
A 1H-NMR-Based Metabonomic Study on the Anti-Depressive Effect of the Total Alkaloid of Corydalis Rhizoma

Abstract
:
1. Introduction
2. Results and Discussion
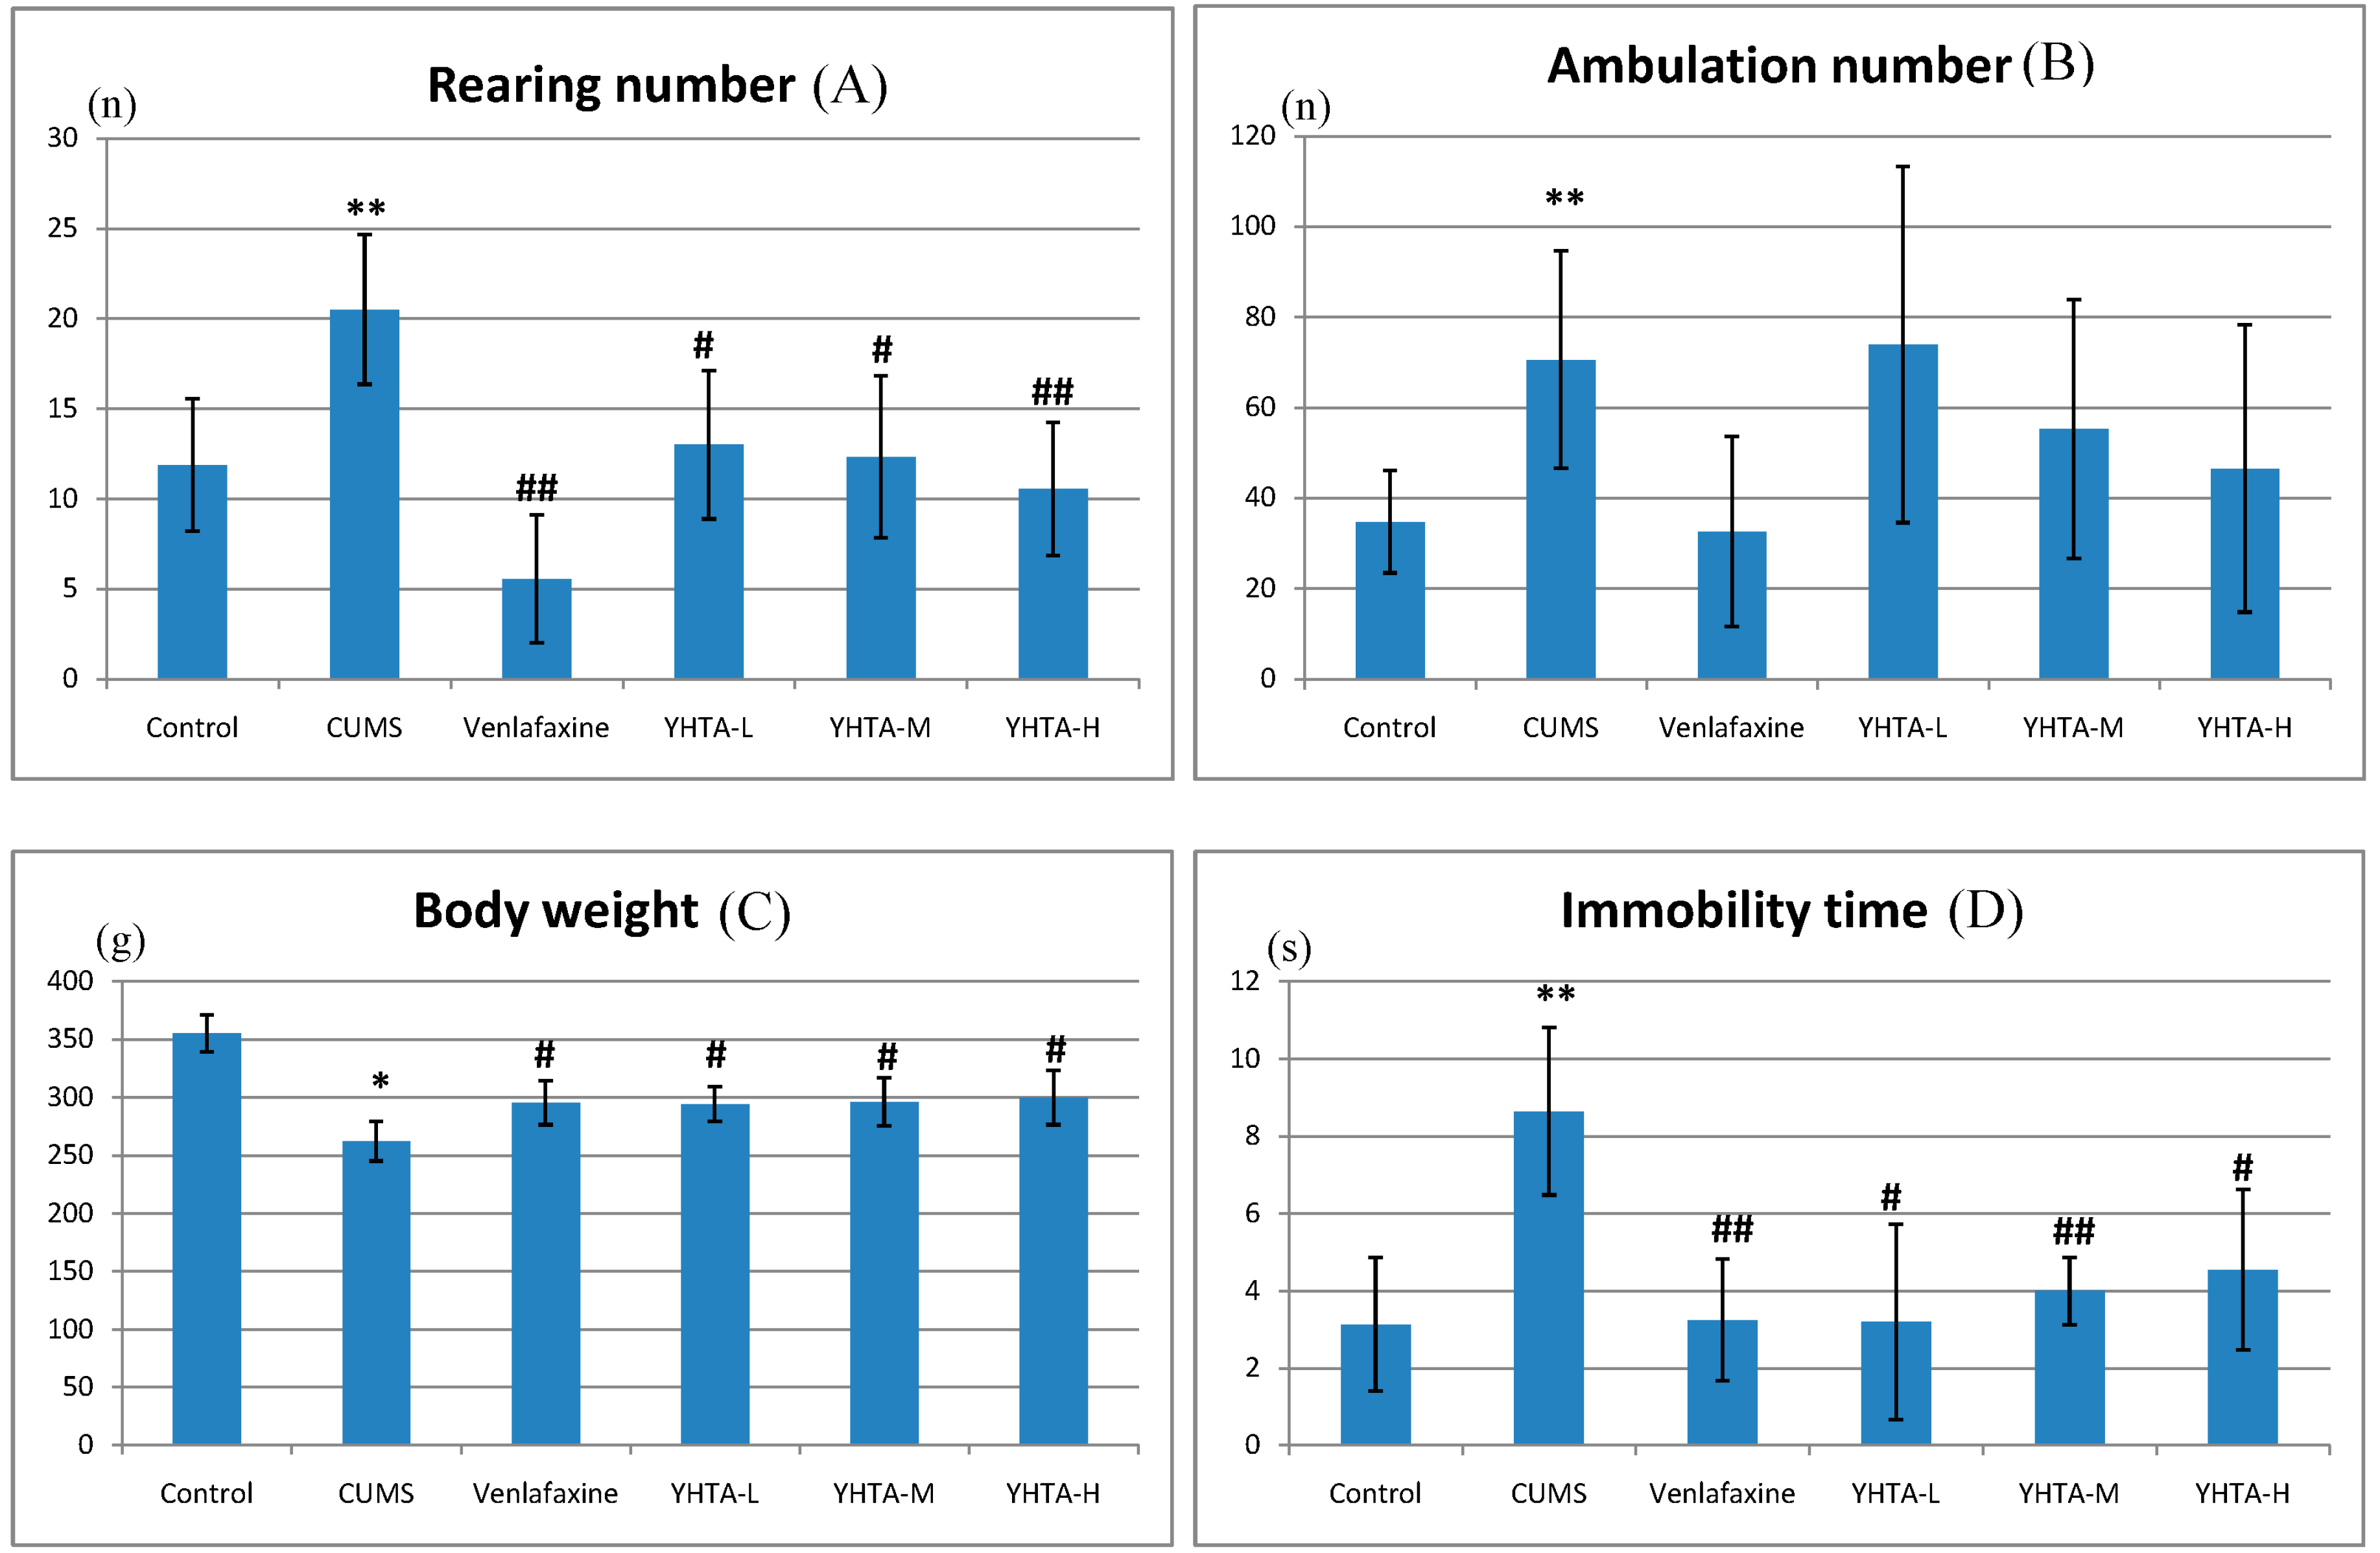
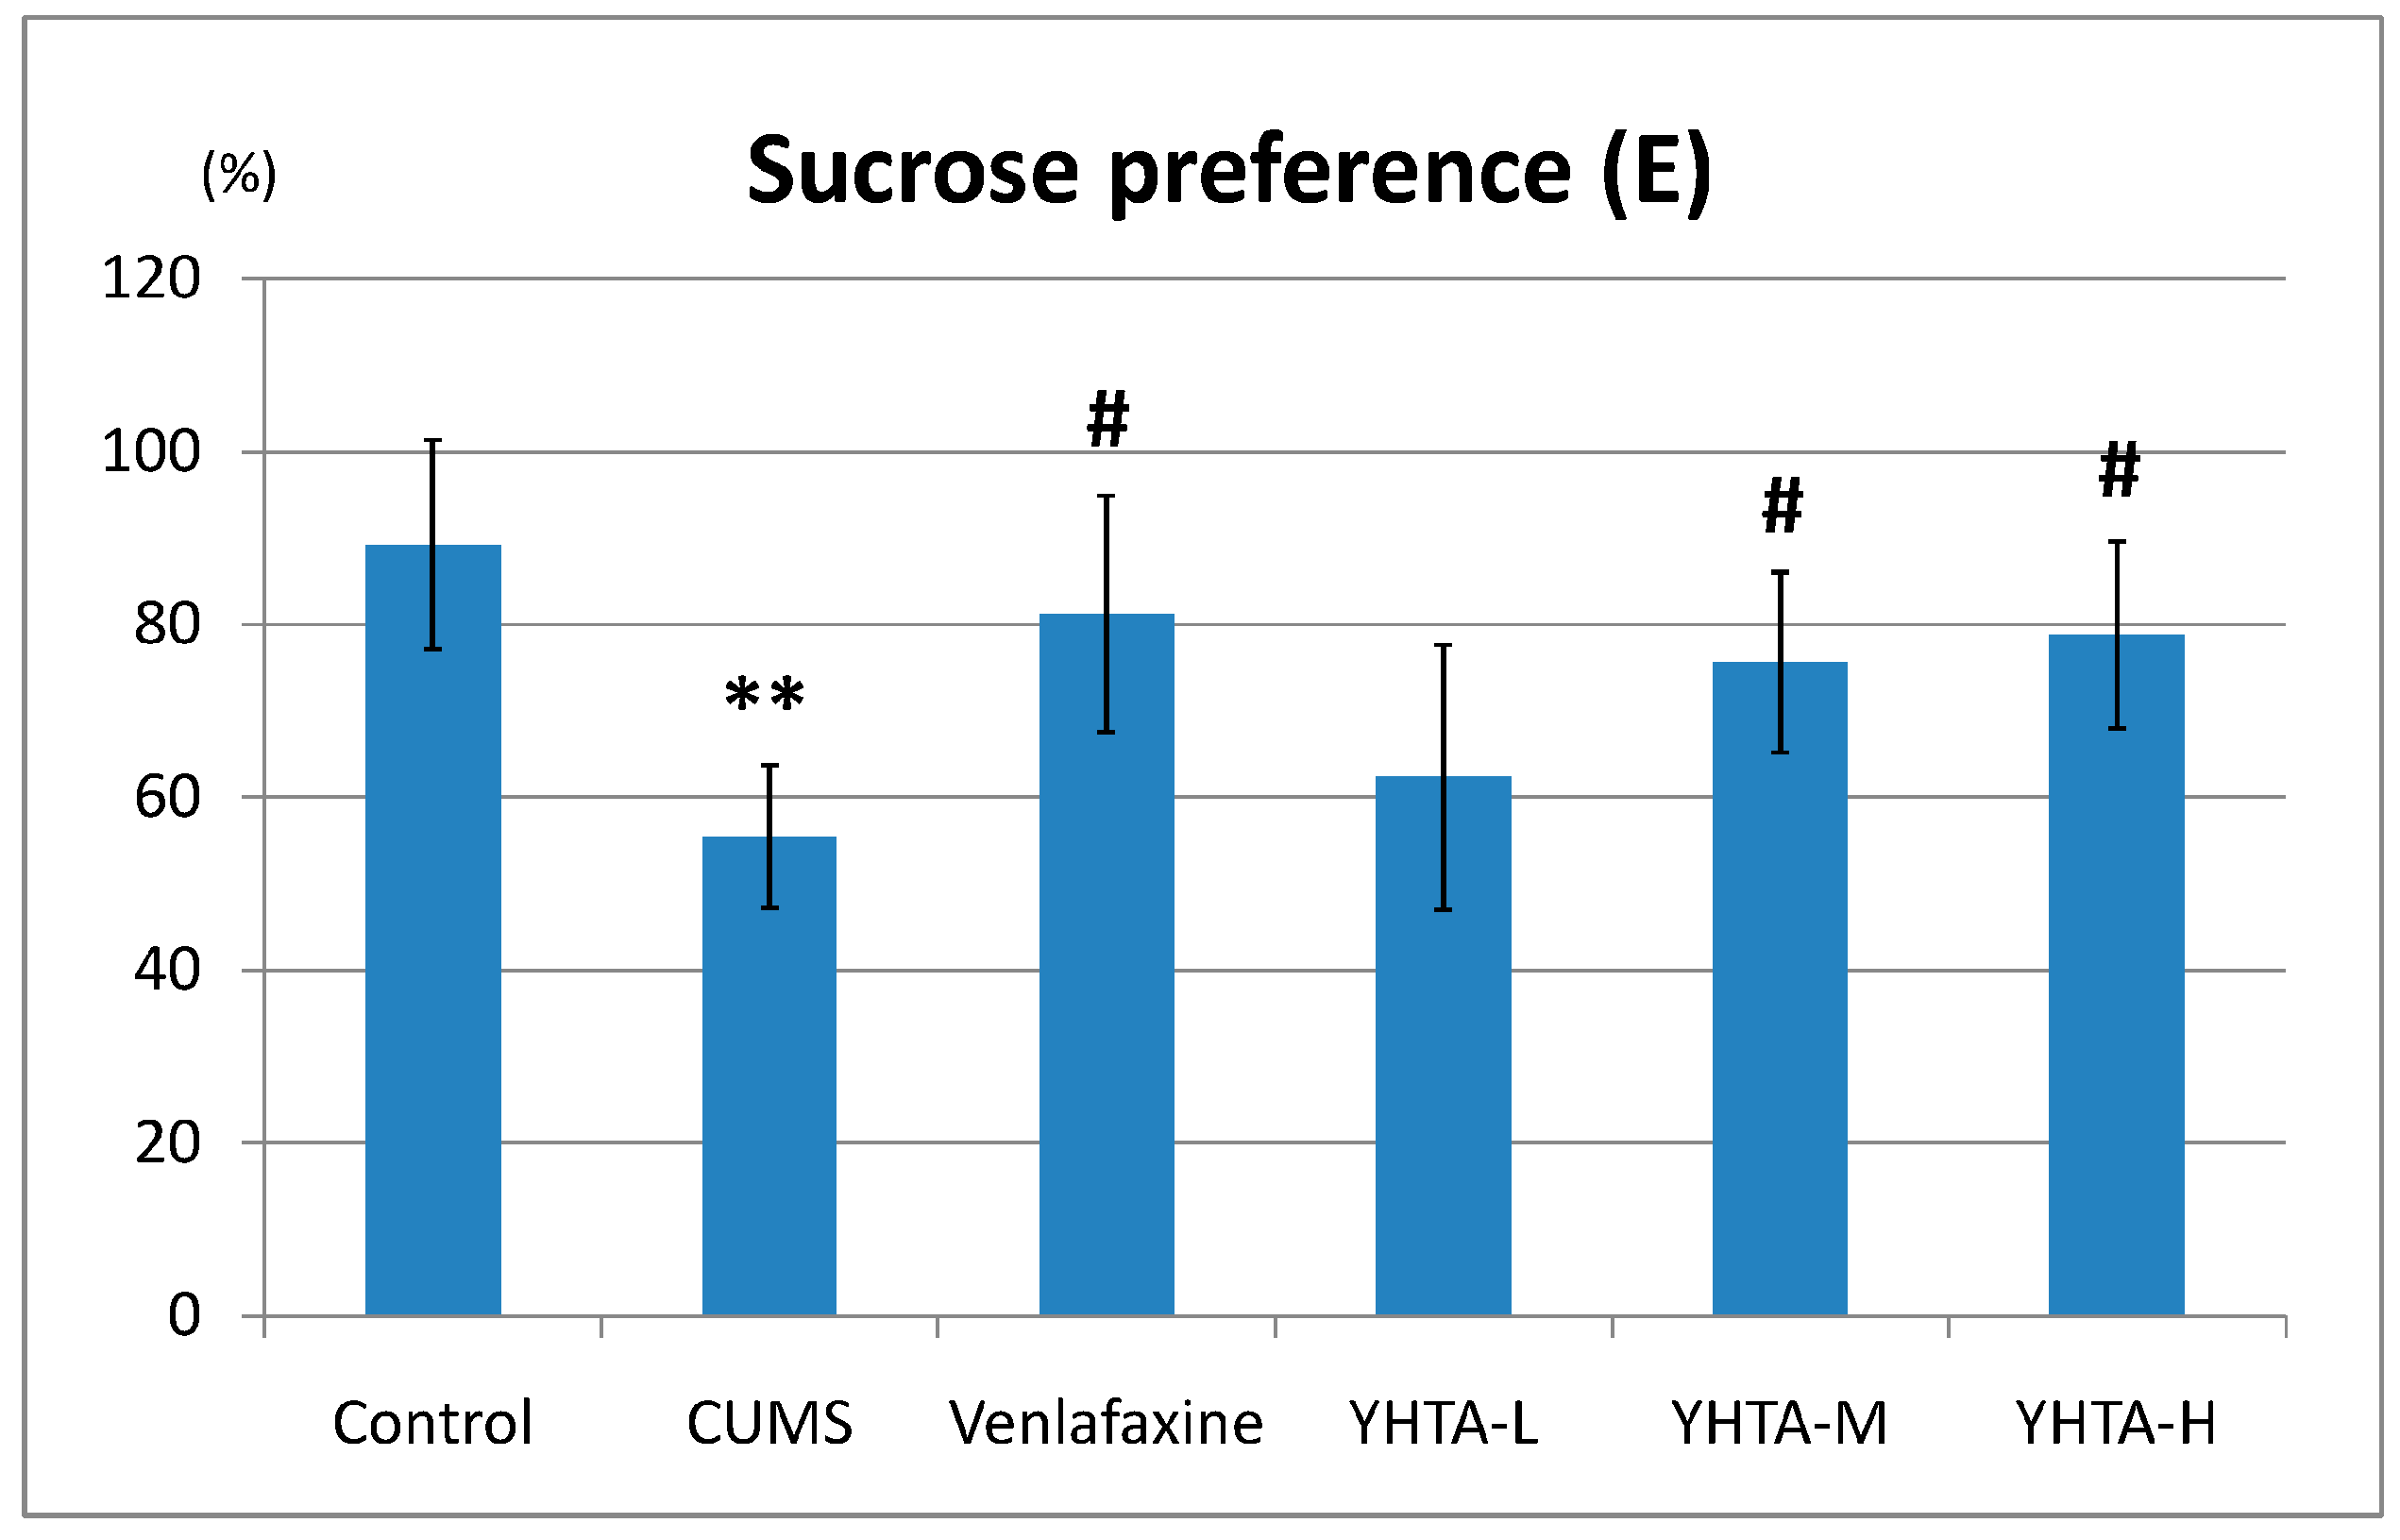
2.1. Effect of YHTA on Behavioral Tests
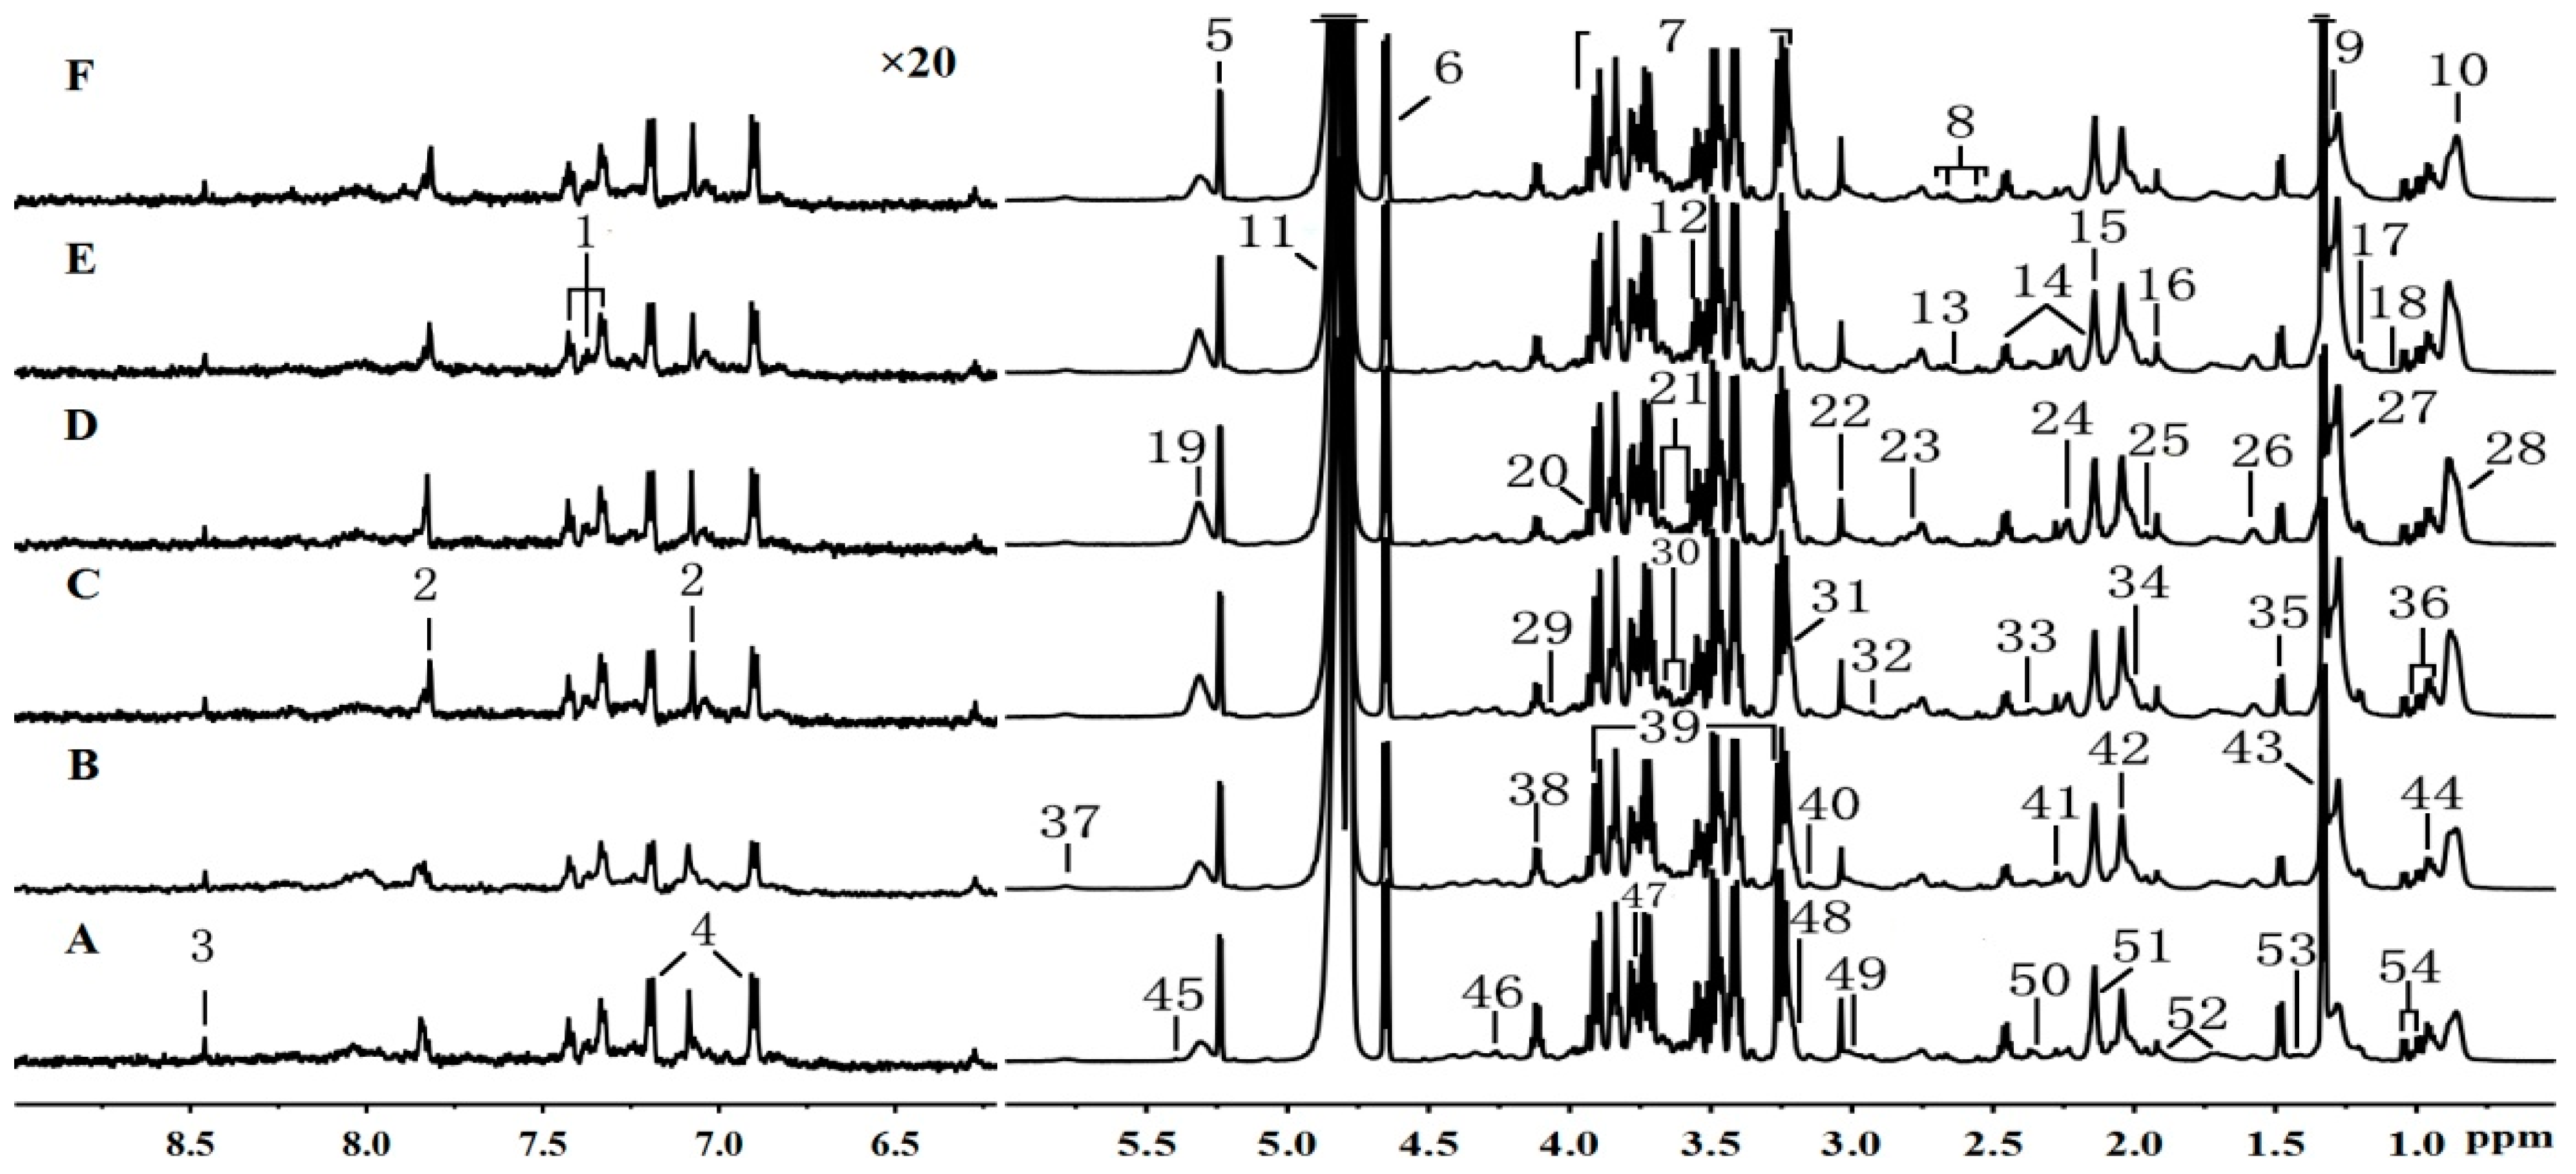
2.2. Analysis of Plasma Samples by 1H-NMR Spectroscopy
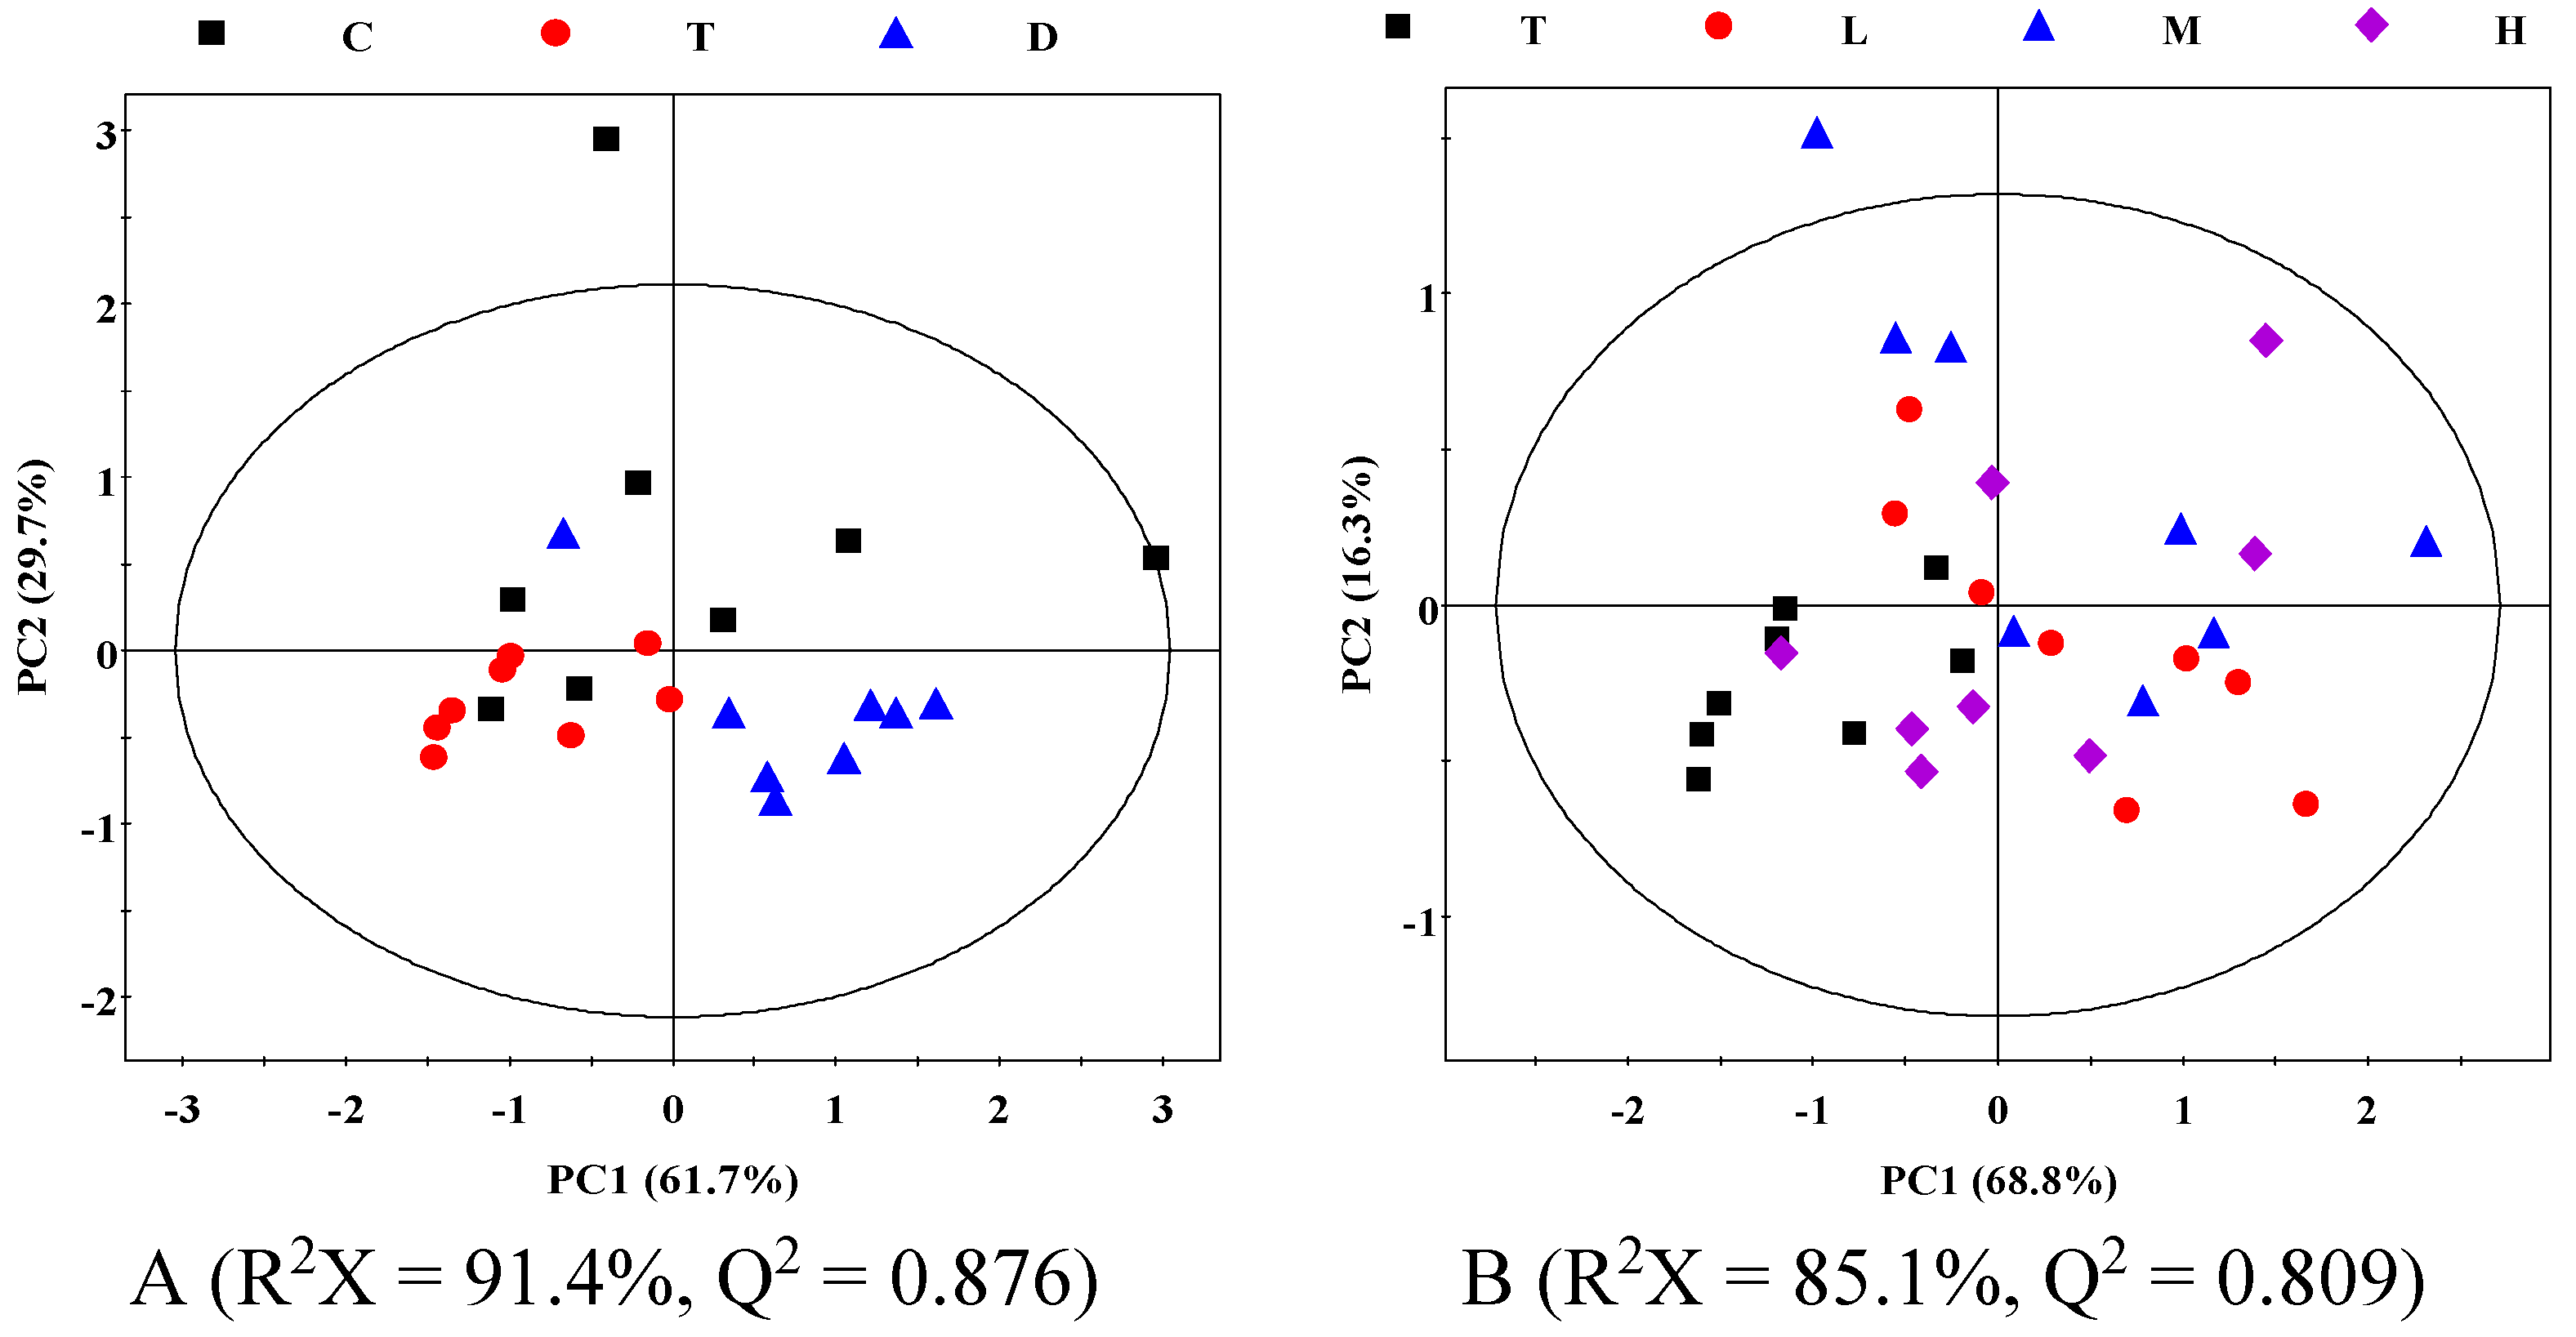
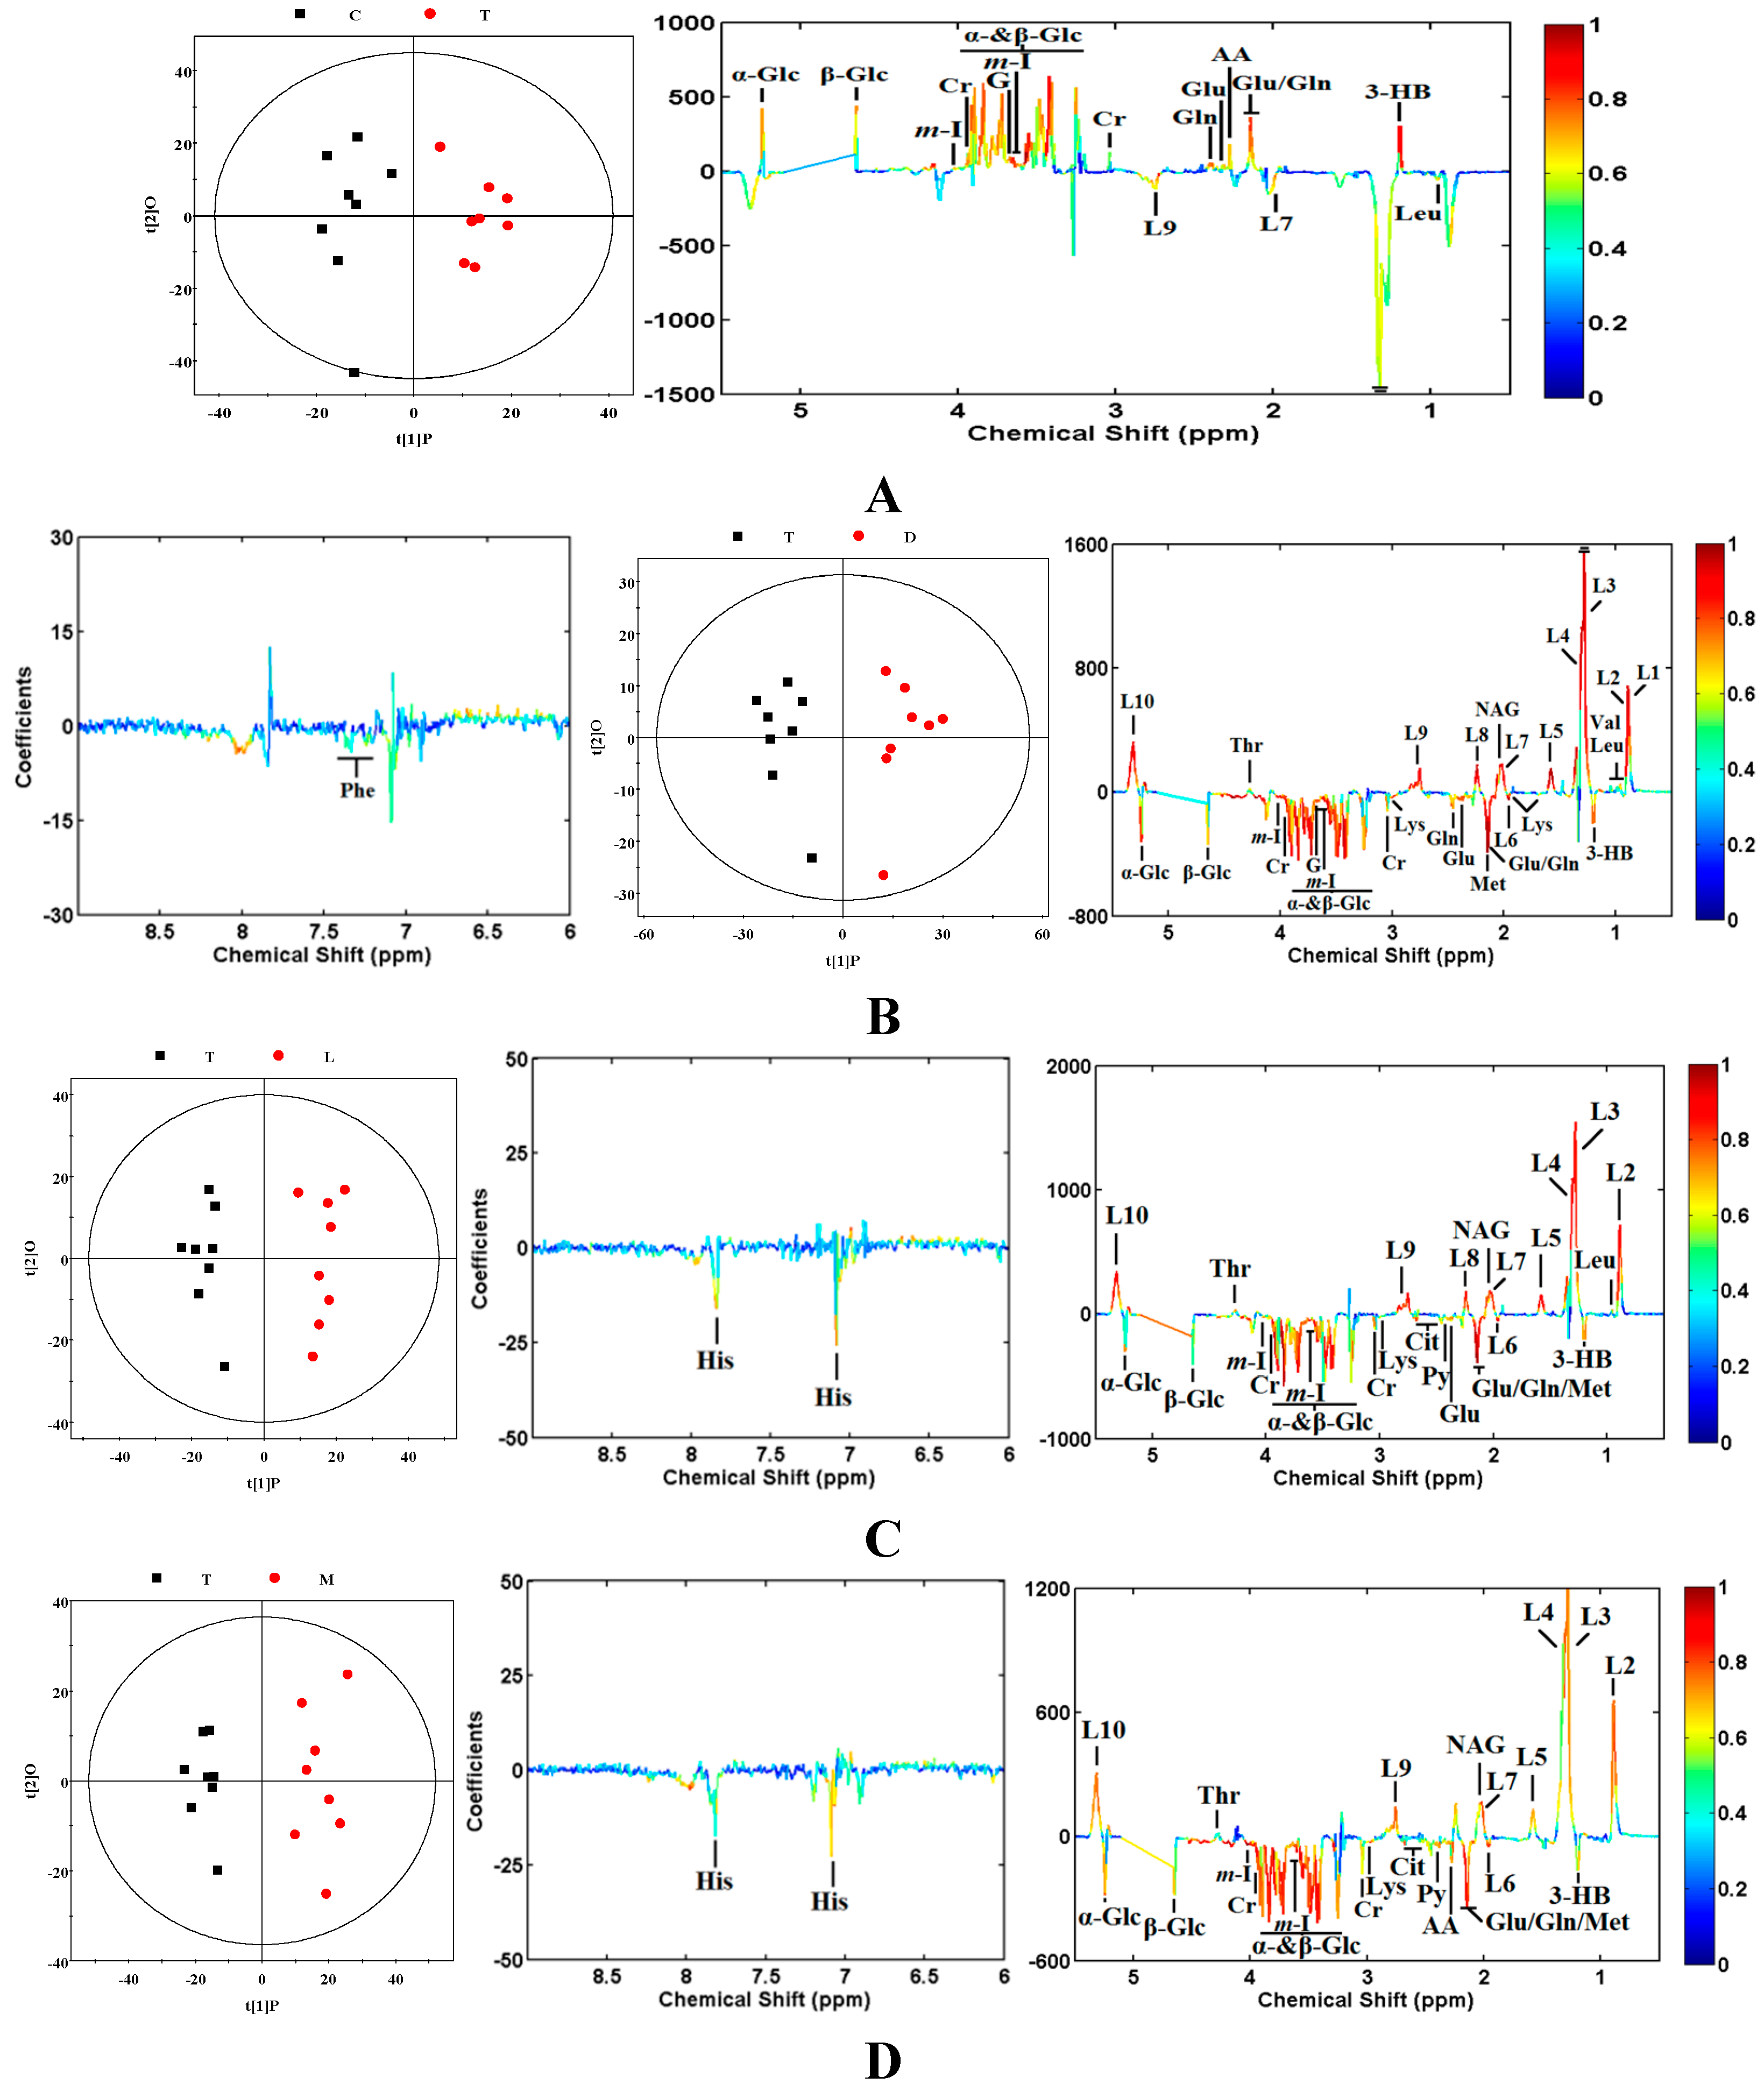
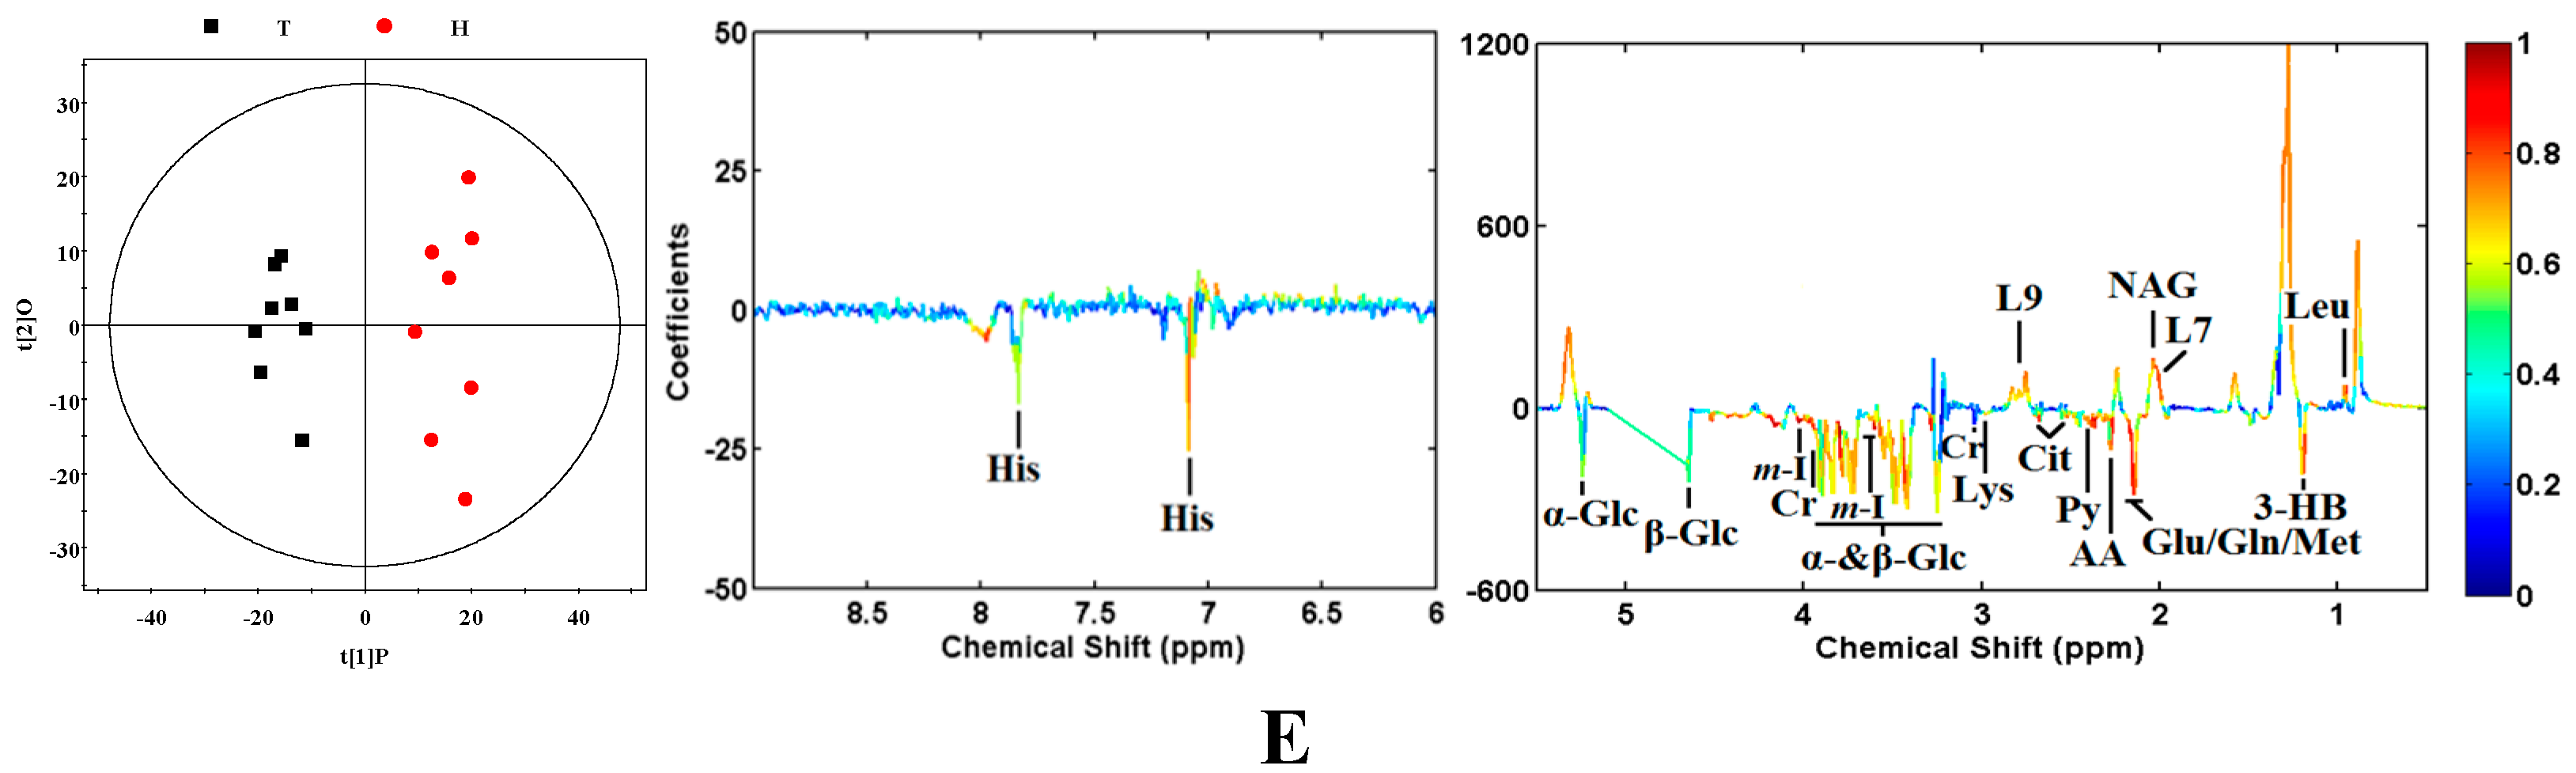
2.3. Multivariate Statistical Analysis of Plasma NMR Data of All Groups

| PLS-DA | OPLS-DA | |||||
|---|---|---|---|---|---|---|
| R2X | R2Y | Q2 | R2X | R2Y | Q2 | |
| C vs. T | 39.0% | 0.908 | 0.560 | 38.0% | 0.908 | 0.521 |
| T vs. D | 42.8% | 0.909 | 0.626 | 42.8% | 0.909 | 0.615 |
| T vs. L | 37.1% | 0.955 | 0.729 | 37.1% | 0.955 | 0.684 |
| T vs. M | 41.7% | 0.941 | 0.748 | 41.7% | 0.941 | 0.678 |
| T vs. H | 35.1% | 0.953 | 0.521 | 35.1% | 0.953 | 0.515 |
| Metabolites | δ1H (ppm) and Multiplicity b | R a | ||||
|---|---|---|---|---|---|---|
| C-T | T-D | T-L | T-M | T-H | ||
| Valine | 0.99(d), 1.04(d) | - | ↑0.695 | - | - | - |
| Threonine | 1.33(d), 3.58(d) 4.26(m) | - | ↑0.810 | ↑0.788 | ↑0.683 | - |
| Pyruvate | 2.37(s) | - | ↓−0.760 | ↓−0.694 | ↓−0.705 | ↓−0.871 |
| Phenylalanine | 7.33(d), 7.37(m) 7.42(dd) | - | ↓−0.669 | - | - | - |
| N-Acetylglycoprotein | 2.04(s) | - | ↑0.865 | ↑0.812 | ↑0.731 | ↑0.696 |
| myo-Inositol | 3.27(t), 3.56(dd), 3.62(t), 4.06(t) | ↓0.851 | ↓−0.866 | ↓−0.906 | ↓−0.891 | ↓−0.863 |
| Methionine | 2.14(s), 2.65(t) | - | ↓−0.927 | ↓−0.898 | ↓−0.795 | ↓−0.720 |
| Lysine | 1.72(m), 1.91(m), 3.01(m), 3.76(t) | - | ↓−0.857 | ↓−0.806 | ↓−0.855 | ↓−0.735 |
| Leucine | 0.96(t) | ↑−0.687 | ↑0.798 | ↑0.765 | - | ↑0.859 |
| Lactate | 1.33(d), 4.11(q) | - | ↓−0.701 | - | - | - |
| L9: Lipid, =CH-CH2-CH= | 2.78(br) | ↑−0.801 | ↑0.892 | ↑0.852 | ↑0.741 | ↑0.677 |
| L8: Lipid, -CH2-C=O | 2.23(br) | - | ↑0.891 | ↑0.791 | - | - |
| L7: Lipid,-CH2-CH=CH- | 2.02(br) | ↑−0.727 | ↑0.872 | ↑0.822 | ↑0.793 | ↑0.716 |
| L6: Lipid, -CH2-CH2-CH=CH- | 1.96(br) | - | ↓−0.913 | ↓−0.862 | ↓−0.795 | - |
| L5: Lipid, -CH2-CH2-C=O(VLDL) | 1.56(br) | - | ↑0.910 | ↑0.811 | ↑0.674 | - |
| L4: Lipid, CH3-(CH2)n-(VLDL) | 1.30(br) | - | ↑0.885 | ↑0.799 | ↑0.718 | - |
| L3: Lipid, CH3-(CH2)n-(LDL) | 1.28(br) | - | ↑0.866 | ↑0.782 | ↑0.696 | - |
| L2: Lipid, CH3-(CH2)n-(VLDL) | 0.90(br) | - | ↑0.874 | ↑0.780 | ↑0.767 | - |
| L10: Lipid, -CH=CH- | 5.31(br) | - | ↑0.865 | ↑0.796 | ↑0.725 | - |
| Histidine | 7.08(s), 7.84(s) | - | - | ↓−0.856 | ↓−0.723 | ↓−0.683 |
| Glycerol | 3.57(m), 3.66(m), 3.78(m) | ↓0.768 | ↓−0.785 | ↓−0.720 | ↓−0.684 | - |
| Glycine | 3.56(s) | ↓0.802 | ↓−0.883 | ↓−0.770 | ↓−0.892 | ↓−0.738 |
| Glutamate | 2.10(m), 2.35(m), 3.78(t) | ↓0.697 | ↓−0.910 | ↓−0.912 | ↓−0.823 | ↓−0.781 |
| Glutamine | 2.14(m), 2.45(m), 3.78(t) | ↓0.669 | ↓−0.884 | ↓−0.817 | ↓−0.798 | ↓−0.745 |
| Creatine | 3.04(s), 3.93(s) | ↓0.688 | ↓−0.846 | ↓−0.884 | ↓−0.821 | ↓−0.747 |
| Citrate | 2.53(d), 2.68(d) | - | - | ↓−0.825 | ↓−0.764 | ↓−0.769 |
| β-Glucose | 3.25(dd), 3.41(t), 3.46(m), 3.49(t), 3.90(dd), 4.65(d) | ↓0.792 | ↓−0.892 | ↓−0.872 | ↓−0.896 | ↓−0.774 |
| α-Glucose | 3.42(t), 3.54(dd), 3.71(t), 3.73(m), 3.84(m), 5.23(d) | ↓0.799 | ↓−0.902 | ↓−0.915 | ↓−0.856 | ↓−0.770 |
| Acetoacetate | 2.28(s) | ↓0.680 | - | ↓−0.673 | ↓−0.786 | ↓−0.779 |
| 3-Hydroxybutyrate | 1.20(d), 2.31(dd), 2.41(dd) | ↓0.776 | ↓−0.769 | ↓−0.711 | ↓−0.743 | ↓−0.790 |
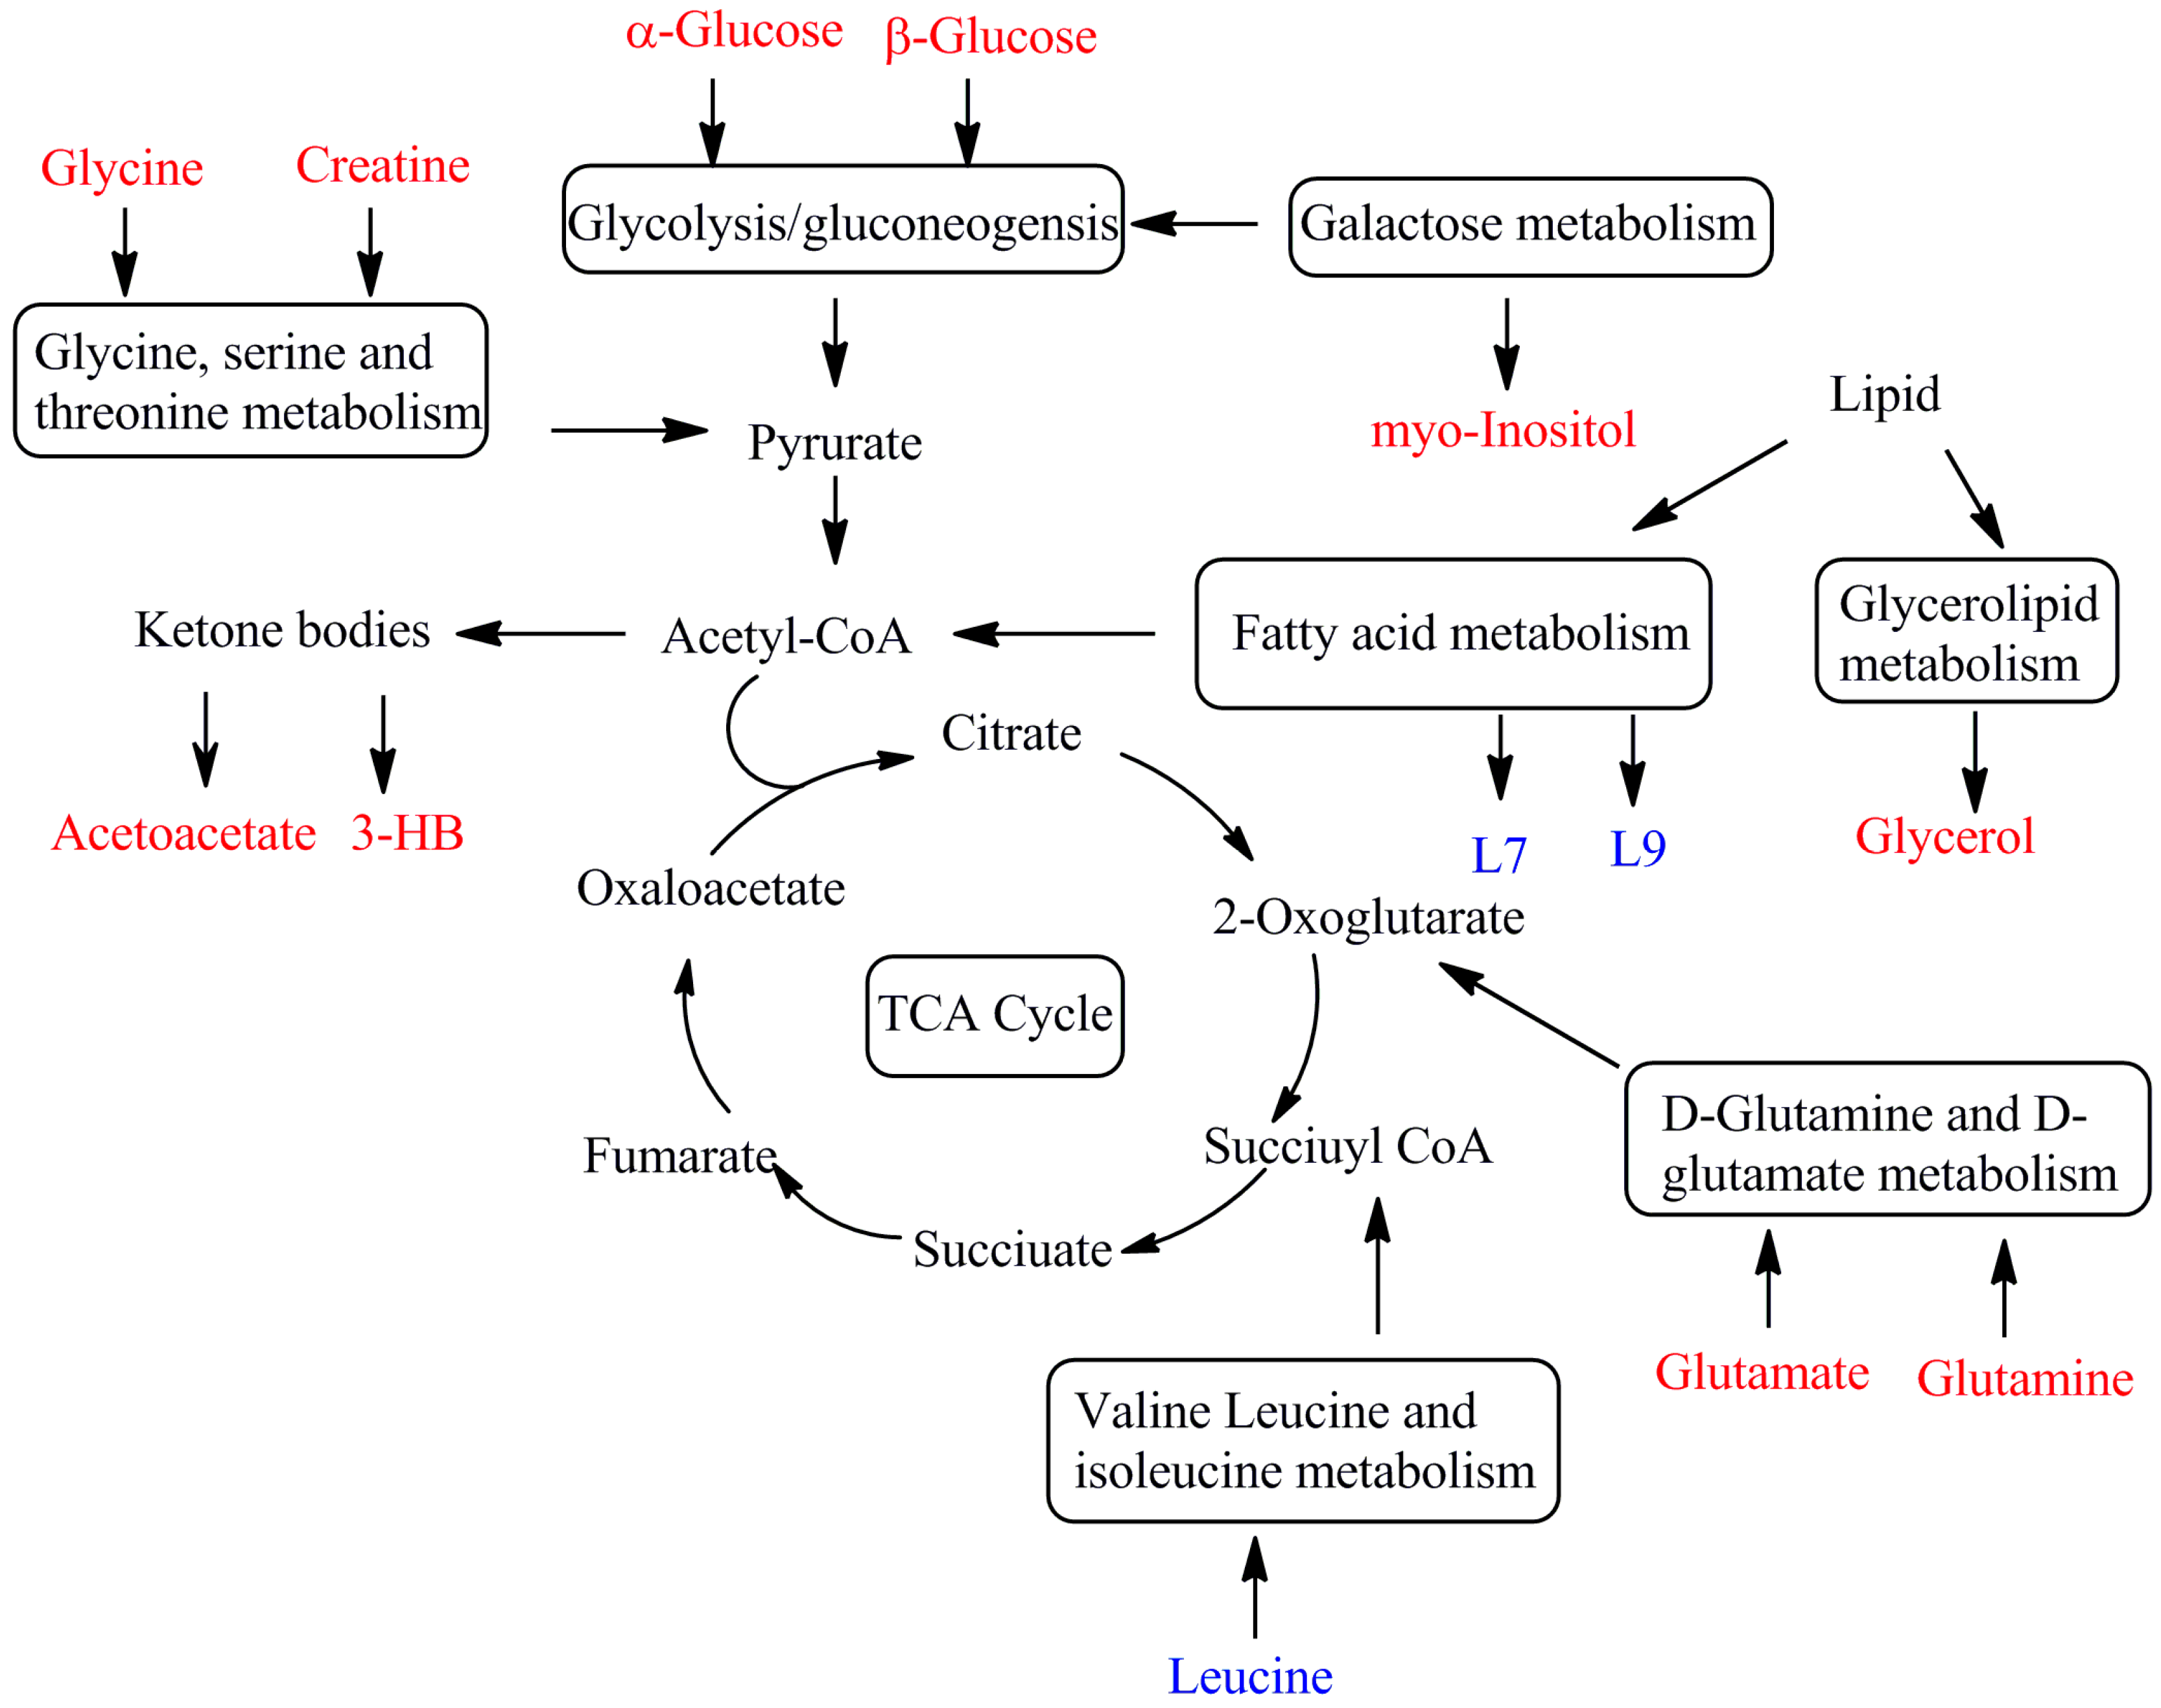
2.4. Discussion

2.4.1. Amino Acid Metabolism
2.4.2. Glycometabolism
2.4.3. Lipid Metabolism and Energy Metabolism
3. Experimental Section
3.1. Chemicals and Reagents
3.2. Preparation of YHTA
3.3. Animals
3.4. Drug Administration and Chronic Unpredictable Mild Stress (CUMS) Procedure
3.5. Behavioral Tests
3.6. 1H-NMR Method
3.6.1. Sample Preparation and 1H-NMR Spectroscopy
3.6.2. Data Processing of NMR Spectra
3.6.3. Multivariate Statistical Analysis
4. Conclusions
Acknowledgments
Author Contributions
Conflicts of Interest
References
- Charney, D.S. Monoamine dysfunction and the pathophysiology and treatment of depression. J. Clin. Psychiatry 1998, 59, 11–14. [Google Scholar] [PubMed]
- Sarko, J. Antidepressants, old and new: A review of their adverse effects and toxicity in overdose. Emerg. Med. Clin. N. Am. 2000, 18, 637–654. [Google Scholar] [CrossRef]
- Lucena, M.I.; Carvajal, A.; Andrade, R.J.; Velasco, A. Antidepressant-induced hepatotoxicity. Expert Opin. Drug Saf. 2003, 2, 249–262. [Google Scholar] [CrossRef] [PubMed]
- Editorial Committee for the Pharmacopoeia of the People’s Republic of China. In Pharmacopoeia of the People’s Republic of China 2010; Chemical Industry Press: Beijing, China, 2010; Volume 1, p. 133.
- Wang, X.L.; Zheng, Z.; Hong, Z.; Fan, G. Advancements on chemical components and quality control of rhizoma corydalis. Lishizhen Med. Mater. Med. Res. 2011, 22, 227–229. [Google Scholar]
- Adsersen, A.; Kjølbye, A.; Dall, O.; Jäger, A.K. Acetylcholinesterase and butyrylcholinesterase inhibitory compounds from Corydalis cava Schweigg. & Kort. J. Ethnopharmacol. 2007, 113, 179–182. [Google Scholar] [PubMed]
- Chang, C.K.; Lin, M.T. dl-Tetrahydropalmatine may act through inhibition of amygdaloid release of dopamine to inhibit an epileptic attack in rats. Neurosci. Lett. 2001, 307, 163–166. [Google Scholar] [CrossRef]
- Lin, M.T.; Wang, J.J.; Young, M.S. The protective effect of dl-tetrahydropalmatine against the development of amygdala kindling seizures in rats. Neurosci. Lett. 2002, 320, 113–116. [Google Scholar] [CrossRef]
- Yue, K.; Ma, B.; Ru, Q.; Chen, L.; Gan, Y.; Wang, D.; Jin, G.; Li, C. The dopamine receptor antagonist levo-tetrahydropalmatine attenuates heroin self-administration and heroin-induced reinstatement in rats. Pharmacol. Biochem. Behav. 2012, 102, 1–5. [Google Scholar] [CrossRef] [PubMed]
- Xu, H.Y.; Tao, Y.; Lu, P.; Wang, P.; Zhang, F.B.; Yuan, Y.; Wang, S.S.; Xiao, X.F.; Yang, H.J.; Huang, L.Q. A computational drug-target network for Yuanhu Zhitong prescription. Evid. Based Complement. Altern. Med. 2013, 2013, 658531. [Google Scholar] [CrossRef] [PubMed]
- Nicholson, J.K.; Connelly, J.; Lindon, J.C.; Holmes, E. Metabonomics: A platform for studying drug toxicity and gene function. Nat. Rev. Drug Discov. 2002, 1, 153–161. [Google Scholar] [CrossRef] [PubMed]
- Nicholson, J.K.; Wilson, I.D. Opinion: Understanding ‘global’ systems biology-metabonomics and the continuum of metabolism. Nat. Rev. Drug Discov. 2003, 2, 668–676. [Google Scholar] [CrossRef] [PubMed]
- Shockcor, J.P.; Holmes, E. Metabonomics applications in toxicity screening and disease diagnosis. Curr. Top. Med. Chem. 2002, 2, 35–51. [Google Scholar] [CrossRef] [PubMed]
- Lao, Y.M.; Jiang, J.G.; Yan, L. Application of metabonomic analytical techniques in the modernization and toxicology research of traditional Chinese medicine. Br. J. Pharmacol. 2009, 157, 1128–1141. [Google Scholar] [CrossRef] [PubMed]
- Zhang, A.; Sun, H.; Wang, Z.; Sun, W.; Wang, P.; Wang, X. Metabolomics: Towards understanding traditional Chinese medicine. Planta Med. 2010, 76, 2026–2035. [Google Scholar] [CrossRef] [PubMed]
- Wishart, D.S. Quantitative metabolomics using NMR. Trends Anal. Chem. TrAC 2008, 27, 228–237. [Google Scholar] [CrossRef]
- Beckonert, O.; Keun, H.C.; Ebbels, T.M.; Bundy, J.; Holmes, E.; Lindon, J.C.; Nicholson, J.K. Metabolic profiling, metabolomic and metabonomic procedures for NMR spectroscopy of urine, plasma, serum and tissue extracts. Nat. Protoc. 2007, 2, 2692–2703. [Google Scholar] [CrossRef] [PubMed]
- Jiménez, B.; Montoliu, C.; MacIntyre, D.A.; Serra, M.A.; Wassel, A.; Jover, M.; Romero-Gomez, M.; Rodrigo, J.M.; Pineda-Lucena, A.; Felipo, V. Serum metabolic signature of minimal hepatic encephalopathy by (1)H-nuclear magnetic resonance. J. Proteome Res. 2010, 9, 5180–5187. [Google Scholar] [CrossRef] [PubMed]
- Wang, T.; Shao, K.; Chu, Q.; Ren, Y.; Mu, Y.; Qu, L.; He, J.; Jin, C.; Xia, B. Automics: An integrated platform for NMR-based metabonomics spectral processing and data analysis. BMC Bioinform. 2009, 10, 83–97. [Google Scholar] [CrossRef] [PubMed]
- Willner, P.; Mitchell, P.J. The validity of animal models of predisposition todepression. Behav. Pharmacol. 2002, 13, 169–188. [Google Scholar] [CrossRef] [PubMed]
- Willner, P. Validity, reliability and utility of the chronic mild stress model of depression: A 10-year review and evaluation. Psychopharmacology 1997, 134, 319–329. [Google Scholar] [CrossRef] [PubMed]
- Papp, M.; Klimek, V.; Willner, P. Effects of imipramine on serotonergic and beta-adrenergic receptor binding in a realistic animal model of depression. Psychopharmacology 1994, 114, 309–314. [Google Scholar] [CrossRef] [PubMed]
- Harro, J.; Häidkind, R.; Harro, M.; Modiri, A.R.; Gillberg, P.G.; Pähkla, R.; Matto, V.; Oreland, L. Chronic mild unpredictable stress after noradrenergic denervation: Attenuation of behavioural and biochemical effects of DSP-4 treatment. Eur. Neuropsychopharmacol. 1999, 10, 5–16. [Google Scholar] [CrossRef]
- Lindon, J.C.; Nicholson, J.K.; Everett, J.R. NMR spectroscopy of biofluids. Annu. Rep. NMR Spectrosc. 1999, 38, 1–88. [Google Scholar]
- Nicholson, J.K.; Foxall, P.J.D. 750 MHz 1H and 1H-13C NMR spectroscopy of human blood plasma. Anal. Chem. 1995, 67, 793–811. [Google Scholar] [CrossRef] [PubMed]
- Dai, Y.; Li, Z.; Xue, L.; Dou, C.; Zhou, Y.; Zhang, L.; Qin, X. Metabolomics study on the anti-depression effect of xiaoyaosan on rat model of chronic unpredictable mild stress. J. Ethnopharmacol. 2010, 128, 482–489. [Google Scholar] [CrossRef] [PubMed]
- Gao, X.; Zheng, X.; Li, Z.; Zhou, Y.; Sun, H.; Zhang, L.; Guo, X.; Du, G.; Qin, X. Metabonomic study on chronic unpredictable mild stress and intervention effects of Xiaoyaosan in rats using gas chromatography coupled with mass spectrometry. J. Ethnopharmacol. 2011, 137, 690–699. [Google Scholar] [CrossRef] [PubMed]
- Tian, J.S.; Shi, B.Y.; Xiang, H.; Gao, S.; Qin, X.M.; Du, G.H. 1H-NMR-based metabonomic Studies on the anti-depressant effect of Genipin in the chronic unpredictable mild stress rat model. PLOS ONE 2013, 8, e75721. [Google Scholar] [CrossRef] [PubMed]
- Luo, H.G.; Chen, J.X.; Zhang, Q.; Yue, G.X.; Ding, J.; Zhang, H.T.; Yan, X.Z.; Zhao, X.; Meng, Z.Z. Comparative study on effects of Xiaoyao Powder and its modified prescription on plasma metabolomics of rats with chronic immobilization stress. Chin. J. Integr. Med. 2013, 19, 610–615. [Google Scholar] [CrossRef] [PubMed]
- Ni, Y.; Su, M.; Lin, J.; Wang, X.; Qiu, Y.; Zhao, A.; Chen, T.; Jia, W. Metabolic profiling reveals disorder of amino acid metabolism in four brain regions from a rat model of chronic unpredictable mild stress. FEBS Lett. 2008, 582, 2627–2636. [Google Scholar] [CrossRef] [PubMed]
- Meldrum, B.S. Glutamate as a neurotransmitter in the brain: Review of physiology and pathology. J. Nutr. 2000, 130, 1007S–1015S. [Google Scholar] [PubMed]
- Newsholme, P.; Lima, M.M.; Procopio, J.; Pithon-Curi, T.C.; Doi, S.Q.; Bazotte, R.B.; Curi, R. Glutamine and glutamate as vital metabolites. Braz. J. Med. Biol. Res. 2003, 36, 153–163. [Google Scholar] [CrossRef] [PubMed]
- Williamson, D.H.; Brosnan, J.T. Concentrations of metabolites in animal tissues. In Methods of Enzymatic Analysis; Academic Press: New York, NY, USA, 1974; Volume 4, pp. 2266–2302. [Google Scholar]
- Etzel, M.R. Manufacture and use of dairy protein fractions. J. Nutr. 2004, 134, 996S–1002S. [Google Scholar] [PubMed]
- Weber, B.; Schweiger, U.; Deuschle, M.; Heuser, I. Major depression and impaired glucose tolerance. Exp. Clin. Endocrinol. Diabetes 2000, 108, 187–190. [Google Scholar] [CrossRef] [PubMed]
- Xia, Q.C.; Wang, G.H.; Chen, H.Z.; Chen, X.Y.; Na, W.Q. Glycometabolism of patients with depression at first episode. J. Zhejiang Univ. Sci. B (Med. Sci.) 2011, 40, 213–216. [Google Scholar]
- Goodnick, P.J.; Henry, J.H.; Buki, V.M. Treatment of depression in patients with diabetes mellitus. J. Clin. Psychiatry 1995, 56, 128–136. [Google Scholar] [CrossRef] [PubMed]
- Hennings, J.M.; Ising, M.; Grautoff, S.; Himmerich, H.; Pollmächer, T.; Schaaf, L. Glucose tolerance in depressed inpatients, under treatment with mirtazapine and in healthy controls. Exp. Clin. Endocrinol. Diabetes 2010, 118, 98–100. [Google Scholar] [CrossRef] [PubMed]
- Zheng, H.; Zhang, L.; Li, L.; Liu, P.; Gao, J.; Liu, X.; Zou, J.; Zhang, Y.; Liu, J.; Zhang, Z.; et al. High-frequency rTMS treatment increases left prefrontal myo-inositol in young patients with treatment-resistant depression. Prog. Neuropsychopharmacol. Biol. Psychiatry 2010, 34, 1189–1195. [Google Scholar] [CrossRef] [PubMed]
- Deng, X.W.; Xie, N. Progress of berberine for treatment of type 2 diabetes. China J. Chin. Mater. Med. 2014, 39, 1374–1378. [Google Scholar]
- Tang, L.Q.; Wei, W.; Chen, L.M.; Liu, S. Effects of berberine on diabetes induced by alloxan and a high-fat/high-cholesterol diet in rats. J. Ethnopharmacol. 2006, 108, 109–115. [Google Scholar] [CrossRef] [PubMed]
- Leng, S.H.; Lu, F.E.; Xu, L.J. Therapeutic effects of berberine in impaired glucose tolerance rats and its influence on insulin secretion. Acta Pharmacol. Sin. 2004, 25, 496–502. [Google Scholar] [PubMed]
- Lori, L. Ketone bodies: A review of physiology, pathophysiology and application of monitoring to diabetes. Diabetes Metab. Res. Rev. 1999, 15, 412–426. [Google Scholar]
- Klein, A.M.; Ferrante, R.J. The neuroprotective role of creatine. In Creatine and Creatine Kinase in Health and Disease; Salomons, G.S., Wyss, M., Eds.; Springer Science & Business Media: Heidelberg, Germany, 2007; pp. 205–243. [Google Scholar]
- Roitman, S.; Green, T.; Osher, Y.; Karni, N.; Levine, J. Creatine monohydrate in resistant depression: A preliminary study. Bipolar Disord. 2007, 9, 754–758. [Google Scholar] [CrossRef] [PubMed]
- Fei, Y.M.; Zhang, Y.P.; Fang, B.E. Determination of total alkaloid in corydalis yanhusuo WT Wang by acid dye colorimetry. Res. Practice Chin. Med. 2012, 26, 66–68. [Google Scholar]
- Wang, H.T.; Xue, L.M.; Qin, X.M.; Zhang, L.Z.; Wang, M.F.; Piao, J.H. Behavioral changes of chornic unpredictable mild stress rat and chronic restraint stress rat. J. Shanxi University (Nat. Sci. Ed.) 2010, 33, 157–160. [Google Scholar]
- Sample Availability: Samples of the compounds tetrahydropalmatine and total alkaloids of YuanHu are available from the authors.
© 2015 by the authors. Licensee MDPI, Basel, Switzerland. This article is an open access article distributed under the terms and conditions of the Creative Commons Attribution license ( http://creativecommons.org/licenses/by/4.0/).
Share and Cite
Wu, H.; Wang, P.; Liu, M.; Tang, L.; Fang, J.; Zhao, Y.; Zhang, Y.; Li, D.; Xu, H.; Yang, H. A 1H-NMR-Based Metabonomic Study on the Anti-Depressive Effect of the Total Alkaloid of Corydalis Rhizoma. Molecules 2015, 20, 10047-10064. https://doi.org/10.3390/molecules200610047
Wu H, Wang P, Liu M, Tang L, Fang J, Zhao Y, Zhang Y, Li D, Xu H, Yang H. A 1H-NMR-Based Metabonomic Study on the Anti-Depressive Effect of the Total Alkaloid of Corydalis Rhizoma. Molecules. 2015; 20(6):10047-10064. https://doi.org/10.3390/molecules200610047
Chicago/Turabian StyleWu, Hongwei, Peng Wang, Mengting Liu, Liying Tang, Jing Fang, Ye Zhao, Yi Zhang, Defeng Li, Haiyu Xu, and Hongjun Yang. 2015. "A 1H-NMR-Based Metabonomic Study on the Anti-Depressive Effect of the Total Alkaloid of Corydalis Rhizoma" Molecules 20, no. 6: 10047-10064. https://doi.org/10.3390/molecules200610047