Article

Determination of the Molecular Weight of Low-Molecular-Weight Heparins by Using High-Pressure Size Exclusion Chromatography on Line with a Triple Detector Array and Conventional Methods

1
Istituto di Ricerche Chimiche e Biochimiche G. Ronzoni, via G. Colombo 81, Milan 20133, Italy
2
Laboratori Derivati Organici, via M. Barozzi 4, Milan 20122, Italy
*
Author to whom correspondence should be addressed.
Current address: Agilent Technologies, via Gobetti 2/c, Cernusco sul Naviglio 20063, Milan, Italy
Current address: Department of Life Sciences, Universit
Molecules 2015, 20(3), 5085-5098; https://doi.org/10.3390/molecules20035085
Submission received: 30 January 2015 / Revised: 6 March 2015 / Accepted: 12 March 2015 / Published: 19 March 2015
(This article belongs to the Special Issue Glycosaminoglycans and Their Mimetics)

Abstract

:
The evaluation of weight average molecular weight (Mw) and molecular weight distribution represents one of the most controversial aspects concerning the characterization of low molecular weight heparins (LMWHs). As the most commonly used method for the measurement of such parameters is high performance size exclusion chromatography (HP-SEC), the soundness of results mainly depends on the appropriate calibration of the chromatographic columns used. With the aim of meeting the requirement of proper Mw standards for LMWHs, in the present work the determination of molecular weight parameters (Mw and Mn) by HP-SEC combined with a triple detector array (TDA) was performed. The HP-SEC/TDA technique permits the evaluation of polymeric samples by exploiting the combined and simultaneous action of three on-line detectors: light scattering detectors (LALLS/RALLS); refractometer and viscometer. Three commercial LMWH samples, enoxaparin, tinzaparin and dalteparin, a γ-ray depolymerized heparin (γ-Hep) and its chromatographic fractions, and a synthetic pentasaccharide were analysed by HP-SEC/TDA. The same samples were analysed also with a conventional HP-SEC method employing refractive index (RI) and UV detectors and two different chromatographic column set, silica gel and polymeric gel columns. In both chromatographic systems, two different calibration curves were built up by using (i) γ-Hep chromatographic fractions and the corresponding Mw parameters obtained via HP-SEC/TDA; (ii) the whole γ-Hep preparation with broad Mw dispersion and the corresponding cumulative distribution function calculated via HP-SEC/TDA. In addition, also a chromatographic column calibration according to European Pharmacopoeia indication was built up. By comparing all the obtained results, some important differences among Mw and size distribution values of the three LMWHs were found with the five different calibration methods and with HP-SEC/TDA method. In particular, the detection of the lower molecular weight components turned out to be the most critical aspect. Whereas HP-SEC/TDA may underestimate species under 2 KDa when present in low concentration, other methods appeared to emphasize their content.

Graphical Abstract

1. Introduction

Heparin is a complex and highly negatively charged sulfated polysaccharide belonging to the glycosaminoglycan family, well known for its medical importance as anticoagulant and antithrombotic drugs. Heparin linear chains are made up of repeating disaccharide units consisting of N-sulfated or N-acetylated α–d–glucosamine α1→4 linked to hexuronic (β–d–glucuronic or α–l–iduronic) acid, both monosaccharides bearing O-sulfates at varying positions. Pharmaceutical grade unfractionated heparin (UFH) preparations are polydisperse mixtures of molecules ranging in molecular weight (Mw) from less than 6000 to over 60,000 Da [1,2]. Such a high degree of polydispersity together with the overall sulfation pattern confers to heparin a remarkable level of structural heterogeneity. To minimize some unwanted side effects of UFH, such as bleeding and thrombocytopenia, and improve some pharmacological properties, as bioavailability and duration of therapeutic action, low molecular weight heparins (LMWHs) were developed [3].
LMWHs are derived from UFH by controlled chemical, physical, or enzymatic depolymerisation to yield fragments that are approximately one third of the original chains, with Mw ranging from 1000 to 10,000 Da [4,5]. Depending on the manufacturing process, LMWHs mainly differ in degree of depolymerisation and in chemical structure of end-units, as well as in therapeutic and pharmacological properties. Since chain length is one of the parameters highly affecting LMWH biological activity, an accurate determination of molecular weight distribution is particularly important.
The evaluation of weight average molecular weight (Mw) and molecular weight distribution is one of the most controversial aspects concerning the characterization of LMWHs. As the most commonly used method for the measurement of such parameters is high performance size exclusion chromatography (HP-SEC), the soundness of results mainly depends on the appropriate calibration of chromatographic columns.
A series of reference standards have been explored including heparin fractions with narrow molecular weight distribution [6,7], a partially depolymerized heparin sample with a broad polydispersity [8], and pullulan fractions [9]. A chromatographic method for determining LMWH Mw distribution based on multi-angle laser light scattering (MALLS) technology in conjunction with HP-SEC was developed [10,11]. This method overcame the critical dependence on adequate calibration products and improved the reliability of response with respect to the one previously proposed by Komatsu et al. that exploited low angle laser light scattering (LALLS) as detector [12]. Recently HP-SEC on-line with a multiple detector array (TDA) was successfully employed to determine molecular weight of UFH and dermatansulfates [1]. Also this approach, which exploits the combined and simultaneous action of a dual angle laser light scattering, refractometer and viscometer, does not require any chromatographic column calibration.
In the present work, the comparison of molecular weight distribution of samples of three commercial LMWHs, enoxaparin, tinzaparin and dalteparin and of a synthetic pentasaccharide, fondaparinux, measured via HP-SEC/TDA and conventional HP-SEC/Refractive Index (RI) method was performed. For this latter method, column calibration was achieved by using (i) a sample of heparin partially depolymerised by γ-rays (γ-Hep) [13]; (ii) several fractions obtained from γ-Hep characterised by narrow Mw distribution; and iii) the European Pharmacopoeia (EP) LMWH reference standard. Both broad Mw sized γ-Hep and its narrow Mw sized fractions were characterized by HP-SEC/TDA. Moreover, within the conventional HP-SEC/RI method, two different chromatographic conditions were applied, i.e., polymeric gel columns according to HP-SEC/TDA method, and silica gel columns according to EP.

2. Results and Discussion

2.1. Characterization of HP-SEC Calibrants

A partially depolymerised heparin mixture, γ-Hep [13], obtained by controlled y-ray irradiation treatment of a pig mucosal heparin, was characterised for its molecular weight distribution, Mn (number average molecular weight), Mw (weight-average molecular weight) and Pd (polydispersity calculated as Mw/Mn ratio). In particular Mw is 7100 Da, Mn 4800 Da and the Pd 1.61. On consideration of its wide polydispersity, γ-Hep was regarded as a broad calibrant and its cumulative distribution function was calculated, by expressing the relative molecular mass, log(Mr), vs. the cumulative percent of sample above that Mw. As reported in Table 1, log(Mr) values ranged from 2.991 to 4.258. This table was used to generate a direct calibration curve of Mr vs. retention volume (Vr) by appropriated gel permeation chromatography software. In Figure 1, the molecular weight distribution curve together with the cumulative distribution function is reported.
Figure 1. Curve of molecular weight distribution of partially depolymerized heparin (γ-hep) together with the cumulative distribution function, generated by HP-SEC/TDA method.
Molecules 20 05085 g001
Table 1. Broad calibration table of a partially depolymerised heparin mixture, obtained by controlled γ-ray irradiation treatment of a pig mucosal heparin (γ-Hep).
PointCum.%log (Mr)Mr
12.14.25818,100
23.14.22816,900
35.24.18215,200
46.94.15514,300
59.14.12413,300
612.24.09012,300
717.64.03710,900
833.73.9148200
941.83.8577200
1051.03.7926200
1161.03.7165200
1271.03.6234200
1380.43.5053200
1488.53.3422200
1596.83.0791200
1698.12.991980
The γ-Hep sample was then fractionated by size exclusion chromatography into 29 fractions. All fractions were characterised by HP-SEC/TDA and 18 of them were selected and, on consideration of their low degree of polydispersity, were regarded as narrow standards. The molecular weight values (Mn, Mw, Mp and Pd) of each fraction, obtained with OmniSEC software data analysis, are reported in Table 2. In addition to selected fractions, a heparin disaccharide, 2-O-sulfated-α-l-iduronic acid 1→4 linked to 6-O-sulfated anhydromannitol residue (molecular mass 566 Da) was used for calibration purpose.
Table 2. Characterization by HP-SEC/TDA method of eighteen selected narrow cut fractions obtained from γ-hep by size exclusion chromatography. Mp value of the heparin derived disaccharide is also reported.
FractionVr #MpMnMwPd
111.7018,77615,32317,6151.15
211.8614,64613,77815,2561.10
311.9313,04612,17313,3831.10
412.149815944410,2621.09
512.179231918396761.05
612.188390833287141.05
712.316883686271511.04
812.356286602364821.07
912.485410504456661.12
1012.494663450047961.07
1112.643871368638811.05
1212.753554347635991.04
1312.932808271328241.04
1413.052653250126311.05
1513.192192205921981.07
1613.292022200620981.05
1713.471830174618271.05
1813.821198136914791.08
19566
# retention volume (mL).
For all calculations, a differential refractive index increment (dn/dc) value of 0.120 was used for converting RI voltages to solute concentration at each data slice across a chromatographic peak. It was calculated as previously described [1]. Full recovery was detected for all the depolymerised heparin fractions by RI signal, which is proportional to the sample concentration and to the RI increment (dn/dc), indicating that no adsorption of material to the columns occurred and no low molecular weight components were eluted together with the salt peak.

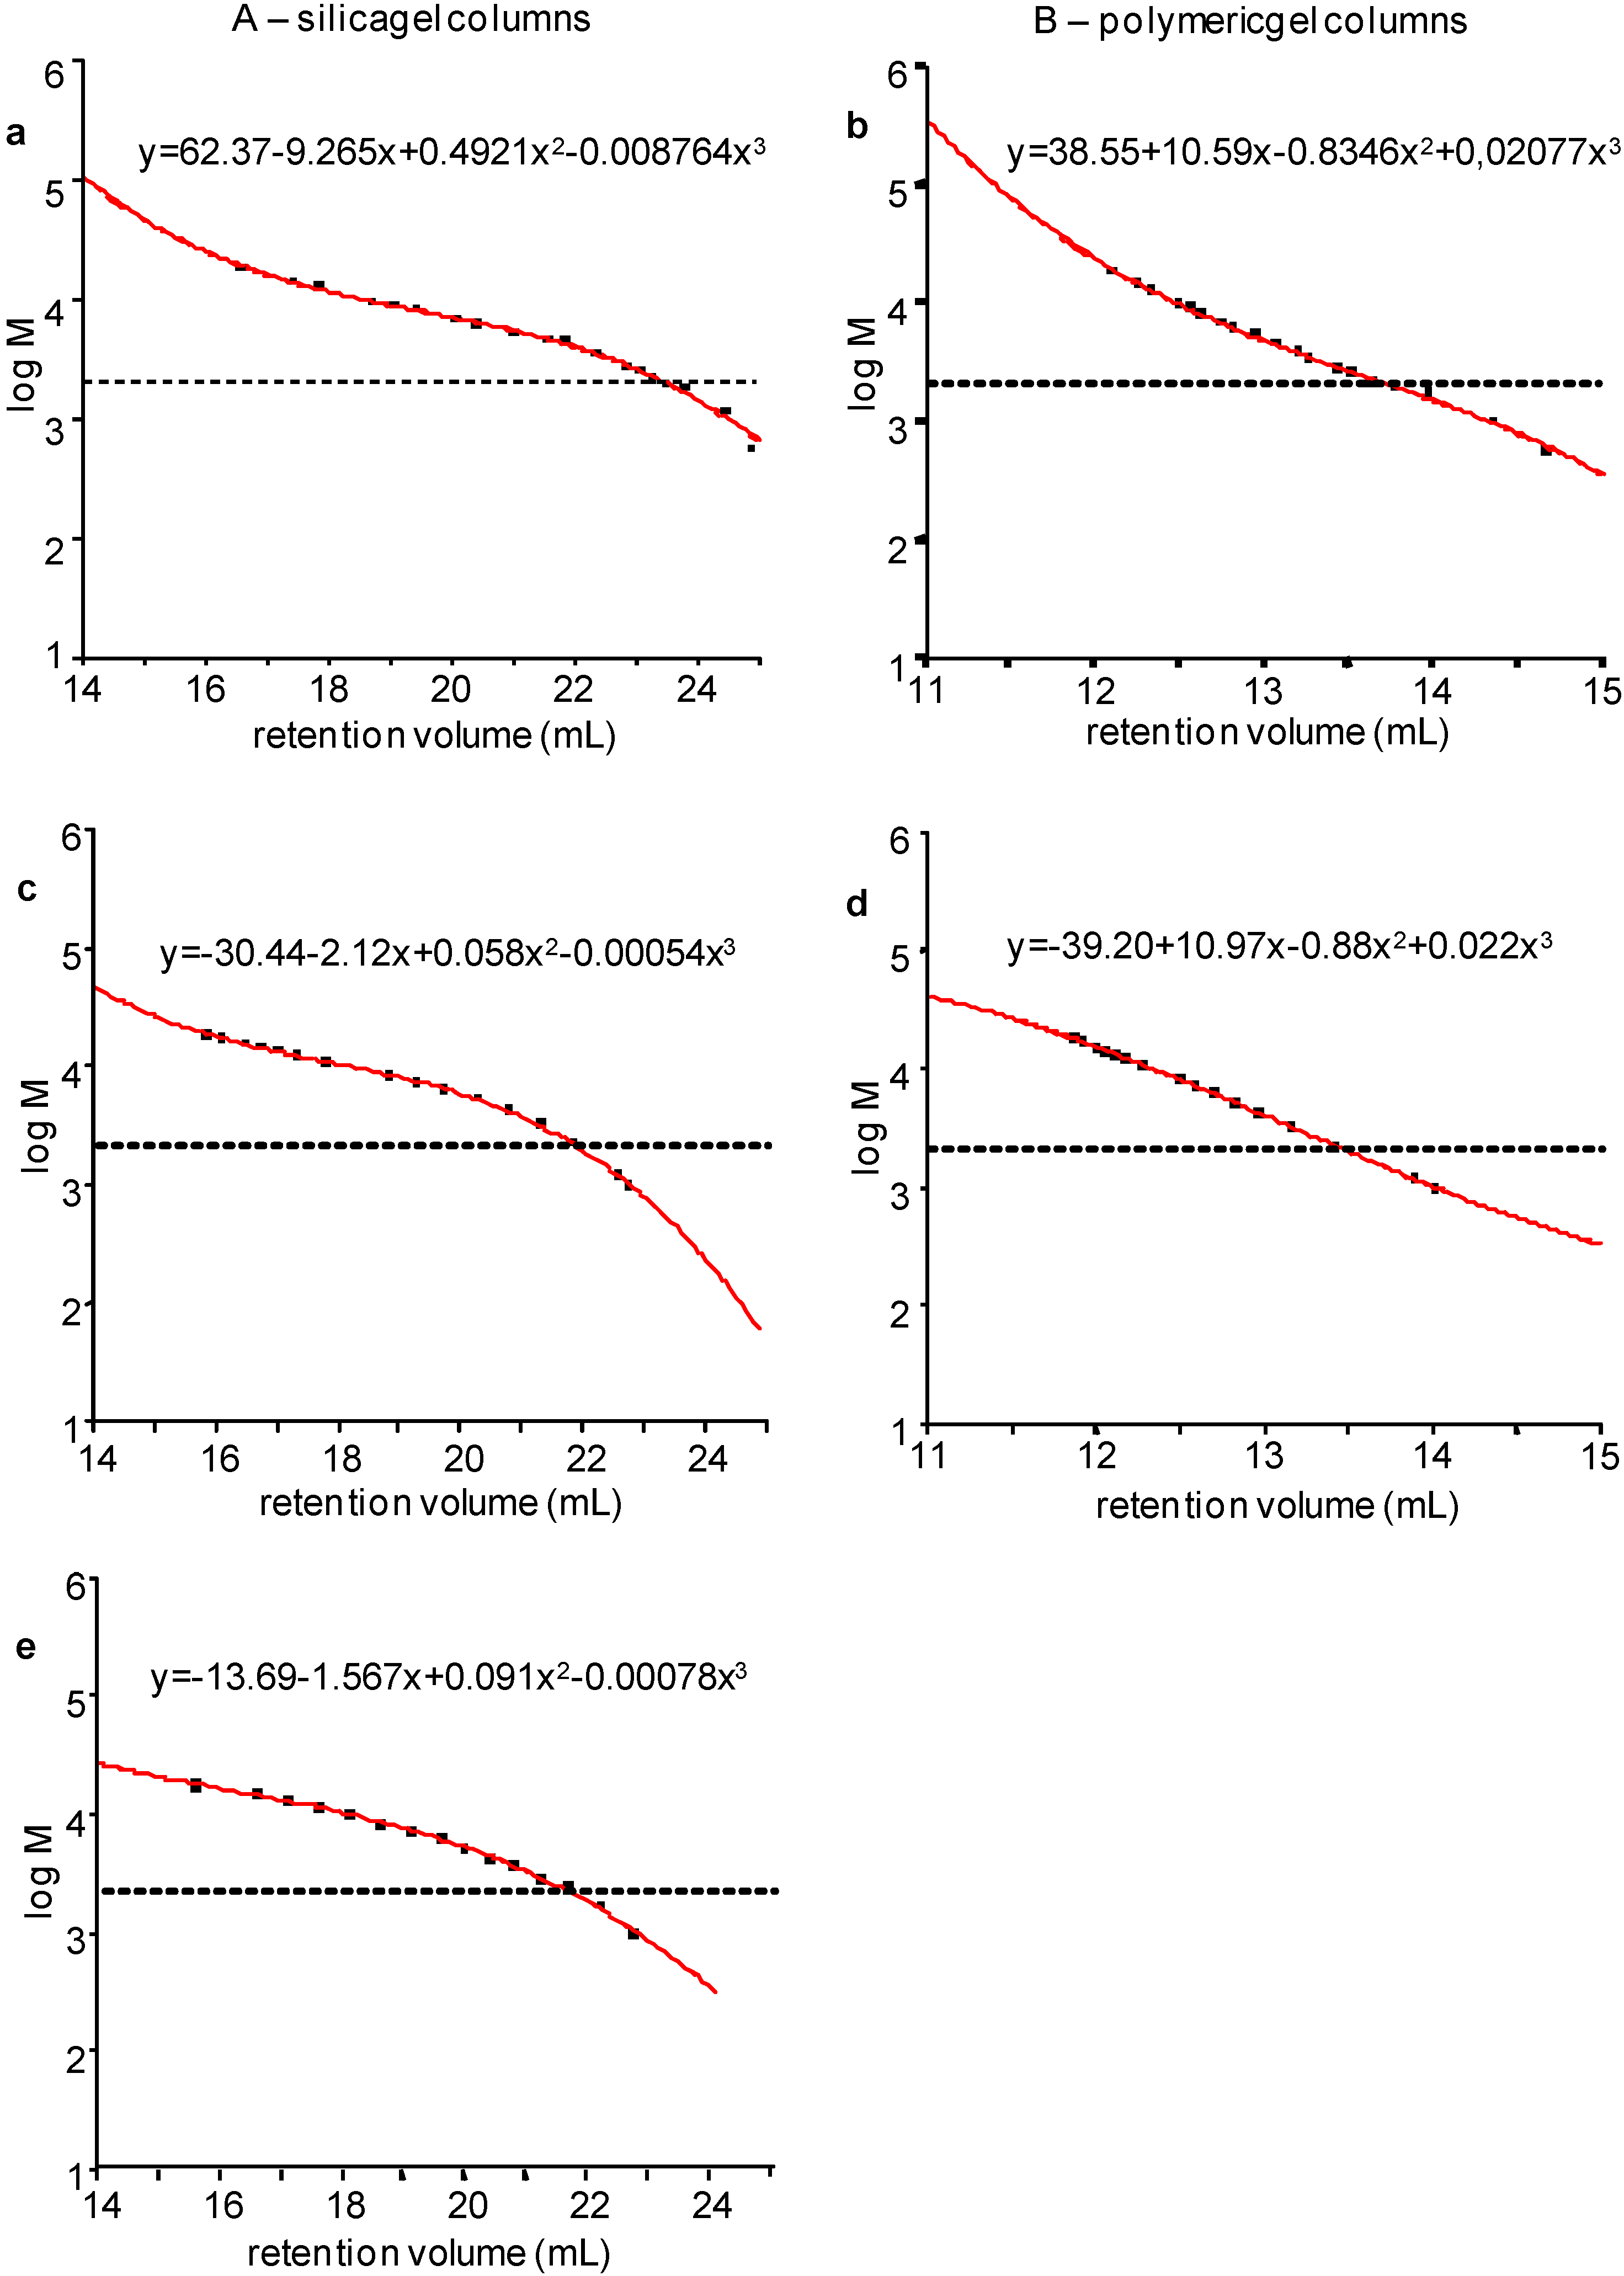
2.2. Calibration of the HP-SEC Systems

Calibration curves with both the broad dispersed γ-Hep and the series of its narrow dispersed fractions, based on data of Table 1 and Table 2 respectively, were built up on conventional HP-SEC/RI-UV system by applying two different chromatographic conditions: (i) according to HP-SEC/TDA procedure, by employing polymeric gel columns and 0.1 M NaNO3 as eluent; (ii) according to the EP indications [14], by using silica gel columns and 0.2 M Na2SO4 as eluent. In addition, a calibration curve with the EP Reference standard, according to EP indications [14], was also implemented. The five calibration curves obtained are presented in Figure 2, together with the equation of the fitted curves.
The first relevant difference between silica gel and polymeric columns is due to the different retention volumes: experimental points appear distributed over 8 mL for the former and over 2–3 mL for the latter.
Figure 2. Typical calibration curves of (A) silica gel columns with narrow fractions (a), broad γ-hep (c) and EP method (e), and (B) polymeric gel columns with narrow fractions (b) and broad γ-hep (d).
Molecules 20 05085 g002

2.3. Measurement of Molecular Weight Parameters of LMWHs
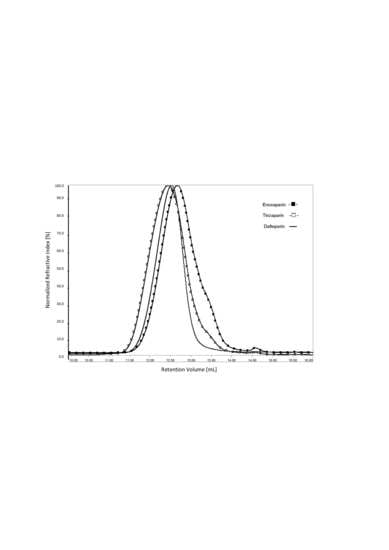
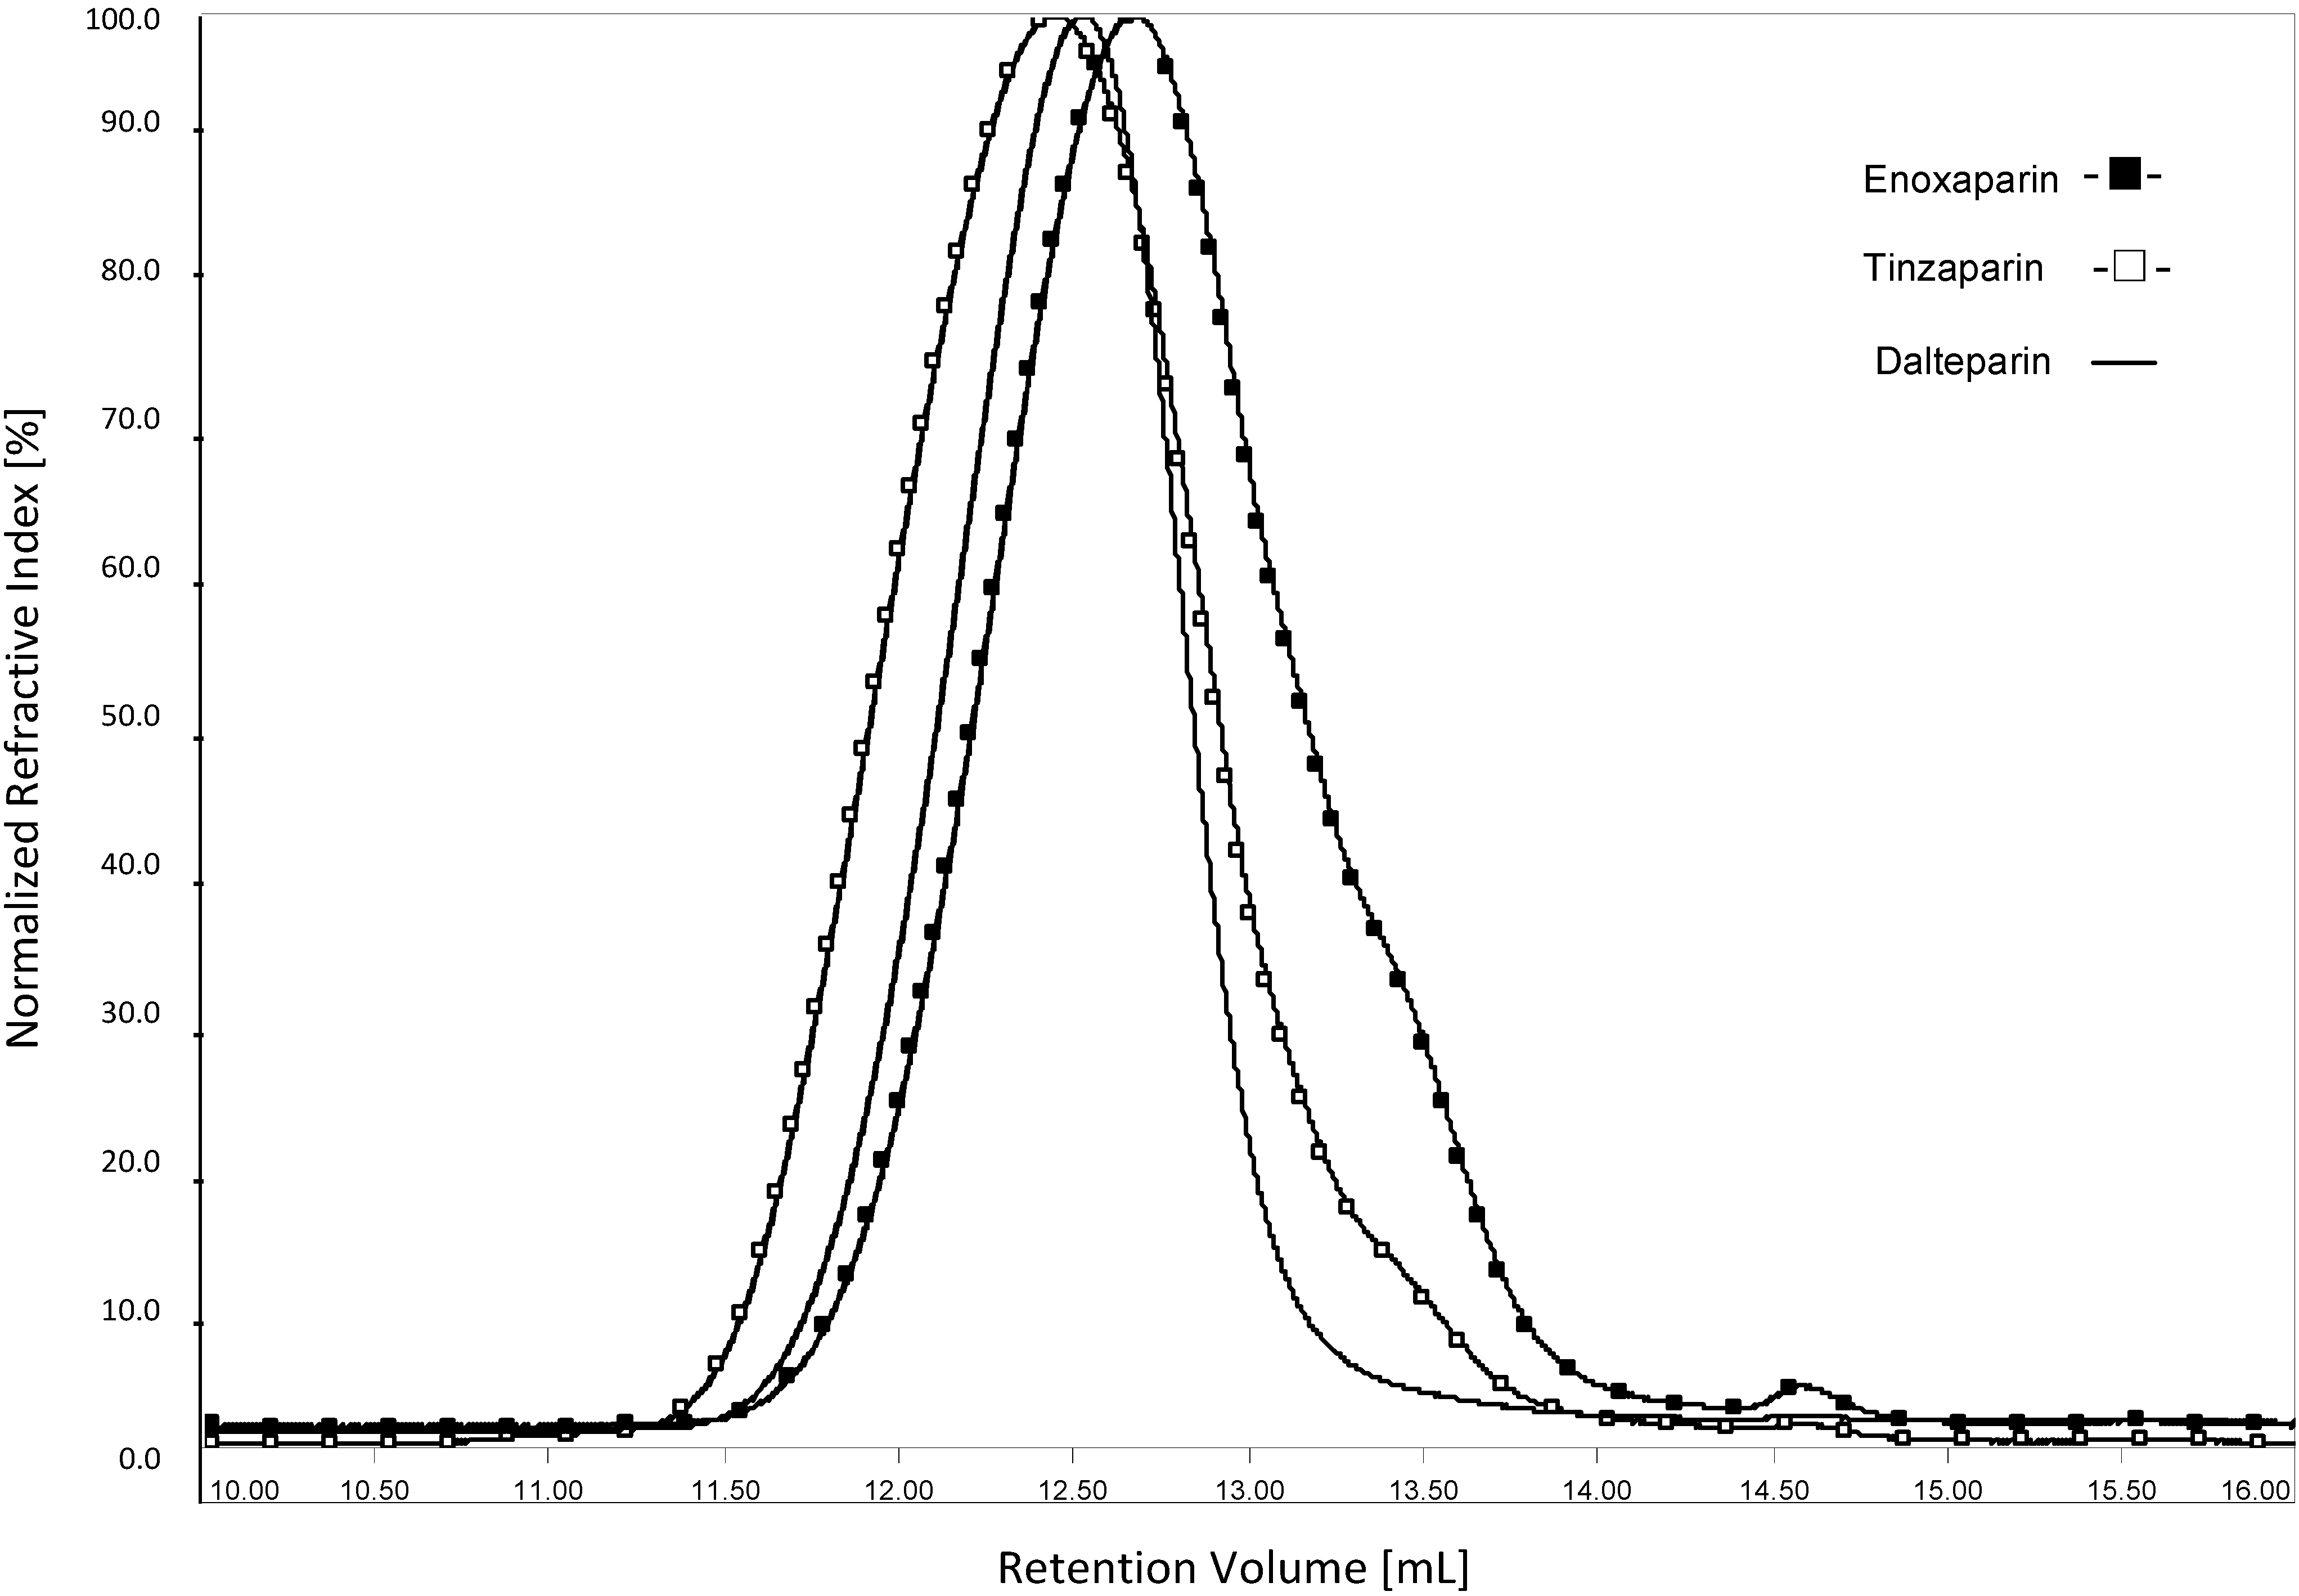
2.3.1. HP-SEC/TDA

The RI elution profiles of enoxaparin, tinzaparin, and dalteparin obtained through HP-SEC/TDA are displayed in Figure 3. In agreement with the observed compositional differences of the three LMWHs regarding the relative content of the different oligomeric components [5], their elution profiles differ both in retention time and in broadness. The resulting molecular weight parameters (Mw, Mn, and Pd), obtained with OmniSEC software data analysis, were determined by subjecting each sample to five independent analyses, each with a double run, over a time span of 18 months. The average results, together with standard deviation of Mw and Mn values are presented in Table 3. The error of determinations was below 3.5%. The error of Mw determination, for four runs within the same day, was below 1.2%.
Table 3. Characterization of three LMWHs by HP-SEC/TDA method.
LMWHMnMwPd
Enoxaparin4036 ±1235426 ± 1011.34
Tinzaparin5920 ± 2078270 ± 2351.40
Dalteparin5668 ± 966910 ± 1311.22
Figure 3. HP-SEC/TDA chromatograms (RI response vs. retention volume) of enoxaparin, tinzaparin and dalteparin.
Molecules 20 05085 g003
Since one of the purpose of the present work is the comparison of the above data with the results obtained from silica column chromatography with 0.2 M Na2SO4 as eluent (see the Experimental section), a check of the possible influence of the different ionic strength (0.1 M vs. 0.2 M of NaNO3) on chromatographic resolution of sample was performed. The three LMWHs were subjected to HP-SEC/TDA analysis on polymeric gel columns using 0.1 M and 0.2 M NaNO3, in both cases very similar Mw and Pd values were obtained (data not shown).

2.3.2. HP-SEC/RI and HP-SEC/RI-UV

The three LMWHs were also analysed by conventional HP-SEC equipped with RI detector using both polymeric and silica gel columns and 0.1 M NaNO3 as eluent. Mw, Mn and Pd were calculated by applying the calibrations curves built up with both narrow fractions and broad calibrant on the corresponding set of chromatographic columns. In addition, enoxaparin, tinzaparin, and dalteparin were also analysed according to the EP indications [14] as previously described and the corresponding molecular weight parameters (Mw and Pd) were calculated by applying the calibration curve built up with the EP reference standard. All the results, calculated as a mean of a double run, are shown in Table 4, in comparison with the corresponding data obtained with HP-SEC/TDA method. In all cases, the percentage of chains with Mw lower than 2 KDa, or than 3 KDa for dlteparin, between 2 and 8 KDa, and higher than 8 KDa are given.
Table 4. Comparison of the molecular weight profiles of enoxaparin, tinzaparin, dalteparin and fondaparinux obtained by HP-SEC/TDA method, and conventional HP-SEC/RI or HP-SEC/RI-UV by applying five different calibration methods: with narrow fractions or broad calibrant on both polymeric and silica gel columns, and with the EP standard on silica gel columns. Mw values were rounded off to the nearest hundred for LMWHs and to the nearest ten for fondaparinux. (nd: not determined).
LMWHDetectorCalibrationStationary PhaseMwPd% Mw
<2000<30002000–8000>8000
EnoxaparinTDA-polymer54001.347nd7617
RInarrow fr.polymer49001.3912nd7613
silica50001.358nd8210
broad cal.polymer53001.4511nd7217
silica48001.6019nd6516
RI-UVEP stdsilica46001.5922nd6514
TinzaparinTDA-polymer83001.402nd5642
RInarrow fr.polymer73001.485nd6234
silica76001.363nd6830
broad cal.polymer79001.454nd5640
silica79001.576nd5242
RI-UVEP stdsilica74001.598nd5339
DalteparinTDA-polymer69001.22nd56830
RInarrow fr.polymer64001.26nd97523
silica66001.14nd28118
broad cal.polymer72001.23nd46633
silica69001.28nd56632
RI-UVEP stdsilica66001.32ndnd6929
FondaparinuxTDA-polymer18901.0197
RInarrow fr.polymer20301.0446
silica20801.0128
broad cal.polymer19201.0855
silica14101.02100
RI-UVEP stdsilica14201.02100
For each LMWH, the Mw values measured with all the different calibration methods varied within a narrow range, the maximum variation being around 800 Da for enoxaparin, 1000 Da for tinzaparin and 800 Da for dalteparin. More consistent discrepancies were observed for Pd values.
In case of employment of broad calibrants (γ-Hep or EP standard) with silica columns, all the three LMWHs exhibited the highest Pd values. Such a result turned out to be in agreement with the declared high resolution capacity of silica gel columns with respect to polymeric columns. Nevertheless, by employing narrow calibrants Pd values obtained with silica columns were found lower than those obtained with polymer columns, for each LMWHs.
Very low molecular weight species are significantly represented only in enoxaparin, whereas in tinzaparin and dalteparin they are less important or negligible, respectively. Different amount of species < 2 KDa were determined in enoxaparin depending on the method applied (Table 4). The lowest value found by HP-SEC/TDA (7) probably reflected the lower sensitivity of light scattering detector toward very low molecular weight molecules. The reliability of the other values detected was considered in relation to their corresponding calibration curves (Figure 2). As concerns broad calibration and EP method on silica gel columns (Figure 2c,e, respectively) a very critical part of the curve is over 22 mL of retention volume, where the deviation from linearity clearly appears. Most probably the high values detected in these cases (19 and 22, respectively) derived from an overestimation of very low molecular weight oligosaccharides. In the case of calibration with narrow standard on silica gel columns, such as narrow standards and broad standard on polymeric gel columns, the curves maintained a good linearity in the region of low molecular weight species and the percentage values of chains under 2 KDa were lower, i.e., 8, 12 and 11, respectively.
To verify the hypothesis of the overestimation, enoxaparin was fractionated on Biogel P10 as previously described [5] and fractions under 2 KDa, i.e., tetramers and hexamers, were collected, desalted and weighted after freeze-drying. Their total percentage with respect to the whole sample turned out to be around 10%, thus confirming the overestimation of the previously detected 20% (data not shown). Larger oligosaccharide components were not considered since LC/MS analysis of both the whole enoxaparin and the octasaccharide peak from Biogel P10 did not detect heptamers or octamers under 2 KDa in significant amount, as reported by Alekseeva et al. [15], and in Figure S1 (Supplementary Material), respectively.
Accordingly, 2 KDa represents a very critical limit for the quantification of underneath oligomeric species. Very slight variations of the calibration curve slope, even if non influential on Mw determination, can result in consistent differences of the percentage determination of chains with Mw values lower than 2000 Da.
According to EP monograph, the three commercial LMWHs enoxaparin, tinzaparin and dalteparin, are identified by the mass-average Mw ranges and molecular weight distribution values reported in Table 5 [14]. By comparing our results with EP requirements, only a few series of the results obtained with the different methods, reported in Table 4, fully satisfy the requirements of the EP. This was the case of HP-SEC/RI method with polymeric gel columns calibrated with narrow fractions: both mass-average Mw and Mw distribution values of the three LMWHs turned out to be included in the required ranges. In all other cases at least one of the measured parameters failed to meet the reported ranges. However the enoxaparin data obtained using RI and RI-UV methods with the γ-Hep and EP standard respectively were quite close to EP requirement. As regards EP method, it is worthwhile to highlight that its implementation was particularly demanding. Calibration of the GPC system with EDQM broad standard turned out to be a critical aspect. Its chromatographic profile and peak resolution mostly depend on the quality of silica gel columns, whose fragile stationary phase can vary both over time and from batch to batch, thus affecting their resolving power. Accordingly, the alignment of UV and RI chromatographic profiles of the standard sometimes did not allow an unequivocal assignment of the degrees of polymerization to the oligosaccharide peaks, so that the addition of pure di- or oligosaccharide species became necessary for a precise calibration.
Table 5. Mass-average Mw range and molecular weight distribution of the three commercial LMWH as reported in EP monograph [14].
LMWHMass-Average Mw RangeMolecular Weight Distribution
<2000 Da<3000 Da2000–8000 Da>8000 Da
Enoxaparin3800–500012%–20%-68%–82%-
Tinzaparin5500–7500≤10%-60%–72%22%–36%
Dalteparin5600–6400-≤13%-15%–25%

2.3.3. Measurement of Molecular Weight Parameters of a Synthetic Pentasaccharide

The molecular weight parameters (Mw and Pd) of the synthetic pentasaccharide fondaparinux (Mw = 1728 Da) were calculated by applying all the calibration curves above described. Results presented in Table 4 indicate that the TDA method can measure LMW species when present in adequate amounts. For conventional SEC, besides on the soundness of column calibration, a reliable quantitative evaluation of smaller oligomeric species depends also on the minimization of the peak broadening effect, especially in the region of very low molecular weights [16]. To minimize such a phenomenon, which is observable also for mono-dispersed species (e.g., fondaparinux), highly efficient chromatographic columns are required.
From the overall results, it appears that Mw and Pd values obtained are strictly dependent on the measurement method applied. In particular, the calibration of polymeric gel columns with a selected series of well characterized heparin derived narrow standards guaranteed the correct evaluation of molecular weight parameters of LMWHs, according to EP requirement. In addition, the stable stationary phase of polymeric columns permitted high reproducibility of analyses even over a long time span. Nevertheless the preparation of narrow standards is an involved and time consuming work. In principle, the application of the cumulative distribution function of a broad heparin standard represents a simpler and efficient tool for calibration, providing the size distribution of the standard is sufficiently wide and adequate for the mass range of the analysis samples. Actually, broad calibration especially on silica gel columns turned out to give positive results. Unfortunately, silica gel columns, together with a high resolution mainly of very low Mw species, exhibited a short lifetime due to a slight but continuous leakage of stationary phase, which can induce a noisy baseline, depending on the detector employed. HP-SEC/TDA method, besides to appear reproducible over a long period, have been successfully employed for characterizing both narrow and broad heparin derived standards. HP-SEC/TDA gave for dalteparin Mw very close to values obtained with all other methods, whereas for enoxaparin and tinzaparin it gave the highest Mw values. As the lower molecular weight components, i.e., tetramers and hexamers, are particularly represented in enoxaparin and tinzaparin [5], such a discrepancy is partly due to an underestimation of those heparin chains by TDA, and partly by an overestimation of the same species by other methods, such as EP method. Actually, the lower sensitivity of TDA appeared only when very low molecular weight species were present in low concentration. Indeed HP-SEC/TDA turned out to be the best procedure for detecting the Mw and Pd values of a synthetic pentasaccharide.

3. Materials and Methods

3.1. Materials

LMWH preparations used in this study were enoxaparin, supplied by Sanofi-Aventis Pharma (Milan, Italy) as injectable Clexane; tinzaparin, supplied by LEO-Pharma (Ballerup, Denmark) as a powder; dalteparin, from Pharmacia AB (Uppsala, Sweden) as injectable Fragmin. The synthetic pentasaccharide Arixtra (fondaparinux) was from GlaxoSmithKline (Verona, Italy). Heparin low-molecular-mass for calibration CRS batch 1, (Mn = 3700 Da) was purchased from European Pharmacopoeia (EP) LMWH standard.

3.2. Fractionation of Depolymerized Heparin

250 g of pig mucosal heparin partially depolymerised by γ-rays [13], dissolved in 0.3 M NaCl, 0.02% NaN3 (w/v) at a final concentration of 150 g/L were loaded onto gel permeation column (Sephadex G-50, GE Healthcare, Uppsala, Sweden; 35 × 100 cm) and eluted with 78 L of the same solution, by collecting 1.62 mL fractions. The eluate, based on the absorbance at 210 nm profile, was divided into 29 fractions that were desalted and freeze-dried.

3.3. HP-SEC/TDA Analysis

The HPLC equipment consisted of a Viscotek system (Malvern Instrument Ltd, Malvern, UK) equipped with a VE1121 Solvent Delivery pump, and a Gastorr 150 metal free two channel on-line degassing device. The detector system was a Viscotek mod. 302 Triple Detector Array (TDA), which is composed as previously described [1] except for the additional presence of Low Angle Laser Light Scattering (LALLS) detector, with the following technical specifications: measuring Angle 90° and 7°, constant optical power output laser diode Light source, wavelength 670 nm; detectors Photodiode/Amplifier and Cell Volume 10 μL.
Two TSK gel columns in series, G3000 PWXL (7.8 × 300 mm) and G2500 PWXL (7.8 × 300 mm) (Tosoh Corp., Tokyo, Japan), were used. Columns, injector and detectors were maintained at 40 °C. An aqueous solution of 0.1 M NaNO3 pre-filtered on 0.22 µm filter (Merck Millipore, Darmstadt, Germany) was used as mobile phase at a flow rate of 0.6 mL/min. The system was calibrated with the polyethylene oxide (PEO) narrow standard of known Mw, polydispersity and intrinsic viscosity. Analysis of data was performed with OmniSEC software, version 4.0 (Viscotek).
For all calculations, a differential refractive index increment (dn/dc) value of 0.120 was used for converting RI voltages to solute concentration at each data slice across a chromatographic peak, as previously described [1].

3.4. HP-SEC/RI-UV Analysis

Conventional HP-SEC analyses were performed with a Waters 515 pump (Water Inc., Milford, MA, USA), equipped with an auto-injector (Waters717plus), ultraviolet (UV) detector (Waters 2487) and differential refractometer (RI) detector (Waters 2410). Both polymeric gel based columns and silica based columns were used. In the first case, TSK G3000 PWXL (7.8 × 300 mm) and G2500 PWXL (7.8 × 300 mm) columns (Tosoh Corp.), connected in series, were eluted with 0.1 M NaNO3 at a flow rate of 0.6 mL/min, according to HP-SEC/TDA procedure. In the second case, TSK SW guardcolumn, TSK G3000 SWXL (7.5 × 300 mm) and TSK G2000 SWXL (7.5 × 300 mm) (Supelco), connected in series, were eluted with 0.2 M Na2SO4, at a flow of 0.5 mL/min, according to the EP indications. In both cases, processes were aided by Chromatography Manager Software Millennium–32 (Waters), with its GPC Empower option.

3.5. Sample Preparation

For HP-SEC/TDA analyses, samples were dissolved in a 0.1 M NaNO3 aqueous solution at about 10 mg/mL. 100 µL of each sample were injected. For HP-SEC all compounds were dissolved with the mobile phase, to a final concentration of 10 mg/mL and 20 µL were injected.

Supplementary Materials

Supplementary materials can be accessed at: https://www.mdpi.com/1420-3049/20/03/5085/s1.

Acknowledgments

The authors thank Annamaria Naggi and Giuseppe Cassinelli (G. Ronzoni Institute) and Paul Clarke (Malvern Instruments) for useful discussion, LEO-Pharma (Denmark) and Sanofi-Aventis (France and Italy) for providing Tinzaparin and Enoxaparin samples, respectively.

Author Contributions

AB drew up the research plan and together with SB and GT discussed the experimental data; AM isolated the narrow heparin calibrants; DV performed HP-SEC/TDA analyses; DB and AC performed HP-SEC/RI-UV analyses. AB wrote the paper and together with SB edited and revised manuscript. All authors read and approved the final manuscript.

Conflicts of Interest

The authors declare no conflict of interest.

References

  1. Bertini, S.; Bisio, A.; Torri, G.; Bensi, D.; Terbojevich, M. Molecular weight determination of heparin and dermatan sulfate by size exclusion chromatography with a triple detector array. Biomacromolecules 2005, 6, 168–173. [Google Scholar] [CrossRef] [PubMed]
  2. Mulloy, B. Structure and physicochemical characterization of heparin. In Heparin—A Century of Progress; Lever, R., Mulloy, B., Page, C.P., Eds.; Springer: London, UK, 2012; pp. 77–98. [Google Scholar]
  3. Fareed, J.; Ma, Q.; Florian, M.; Maddineni, J.; Iqbal, O.; Hoppensteadt, D.A.; Bick, R.L. Differentiation of low molecular-weight heparins: Impact on the future of the management of thrombosis. Semin. Thromb. Hemost. 2004, 30, 89–104. [Google Scholar] [CrossRef] [PubMed]
  4. Linhardt, R.J.; Gunay, N.S. Production and chemical processing of low molecular weight heparins. Semin. Thromb. Hemost. 1999, 25, 5–16. [Google Scholar] [CrossRef] [PubMed]
  5. Bisio, A.; Vecchietti, D.; Citterio, L.; Guerrini, M.; Raman, R.; Bertini, S.; Eisele, G.; Naggi, A.; Sasisekharan, R.; Torri, G. Structural features of low-molecular-weight heparins affecting their affinity to antithrombin. Thromb. Haemost. 2009, 102, 865–873. [Google Scholar] [PubMed]
  6. Fareed, J.; Walenga, J.M.; Hoppensteadt, D.; Huan, X.; Racanelli, A. Comparative study on the in vitro and in vivo activities of seven low-molecular-weight heparins. Haemostasis 1988, 18, 3–15. [Google Scholar] [PubMed]
  7. Malsch, R.; Harenberg, J.; Piazolo, L.; Hule, G.; Heene, D.L. Chromatographic and electrophoretic applications for the analysis of heparin and dermatan sulfate. J. Chromatogr. B 1996, 685, 223–231. [Google Scholar] [CrossRef]
  8. Mulloy, B.; Gee, C.; Wheeler, S.F.; Walt, R.; Gray, E.; Barrowcliffe, T.W. Molecular weight measurements of low molecular weight heparins by gel permeation chromatography. Thromb. Haemost. 1997, 77, 668–674. [Google Scholar] [PubMed]
  9. Guo, X.; Condra, M.; Kimura, K.; Berth, G.; Dautzenberg, H.; Dubin, P.L. Determination of molecular weight of heparin by size exclusion chromatography with universal calibration. Anal. Biochem. 2003, 312, 33–39. [Google Scholar] [CrossRef] [PubMed]
  10. Knobloch, J.E.; Shaklee, P.N. Absolute molecular weight distribution of low-molecular-weight heparins by size-exclusion chromatography with multiangle laser light scattering detection. Anal. Biochem. 1997, 245, 231–241. [Google Scholar] [CrossRef] [PubMed]
  11. Sommers, C.D.; Ye, H.; Kolinski, R.E.; Nasr, M.; Buhse, L.F.; Hakin, A.; Keire, D.A. Characterization of currently marketed heparin products: Analysis of molecular weight and heparinase-I digest patterns. Anal. Bioanal. Chem. 2011, 401, 2445–2454. [Google Scholar] [CrossRef] [PubMed]
  12. Komatsu, H.; Takahata, T.; Ishimitsu, S.; Okada, S. Molecular mass determination of low-molecular-mass heparins. Application of wide collection angle measurements of light scattering using a high-performance gel permeation chromatographic system equipped with a low-angle laser light-scattering photometer. J. Chromatogr. A 1993, 644, 17–24. [Google Scholar] [CrossRef]
  13. Bisio, A.; Guglieri, S.; Frigerio, M.; Torri, G.; Vismara, E.; Cornelli, U.; Bensi, D.; Gonella, S.; De Ambrosi, L. Controlled γ-ray irradiation of heparin generates oligosaccharides enriched in highly sulfated sequences. Carbohydr. Polym. 2004, 455, 101–112. [Google Scholar] [CrossRef]
  14. European Pharmacopoeia, 8th ed.; Council of Europe: Strasbourg, France, 2014; Volume 2.
  15. Alekseeva, A.; Casu, B.; Cassinelli, G.; Guerrini, M.; Torri, G.; Naggi, A. Structural features of glycol-split low molecular weight heparins and their heparin lyases generated fragments. Anal. Bioanal. Chem. 2014, 406, 249–265, electronic supplementary material. [Google Scholar] [CrossRef] [PubMed]
  16. Popovici, S.T.; Kok, W.T.; Schoenmakers, P.J. Band broadening in size-exclusion chromatography of polydisperse samples. J. Chromatogr. A 2004, 1060, 237–252. [Google Scholar] [CrossRef] [PubMed]
  • Sample Availability: Samples of the compounds are available from the authors.

