2.1. Cytotoxicity Analysis of the Diarylpentanoids on the PC-3 and DU 145 Cell Lines
To determine the
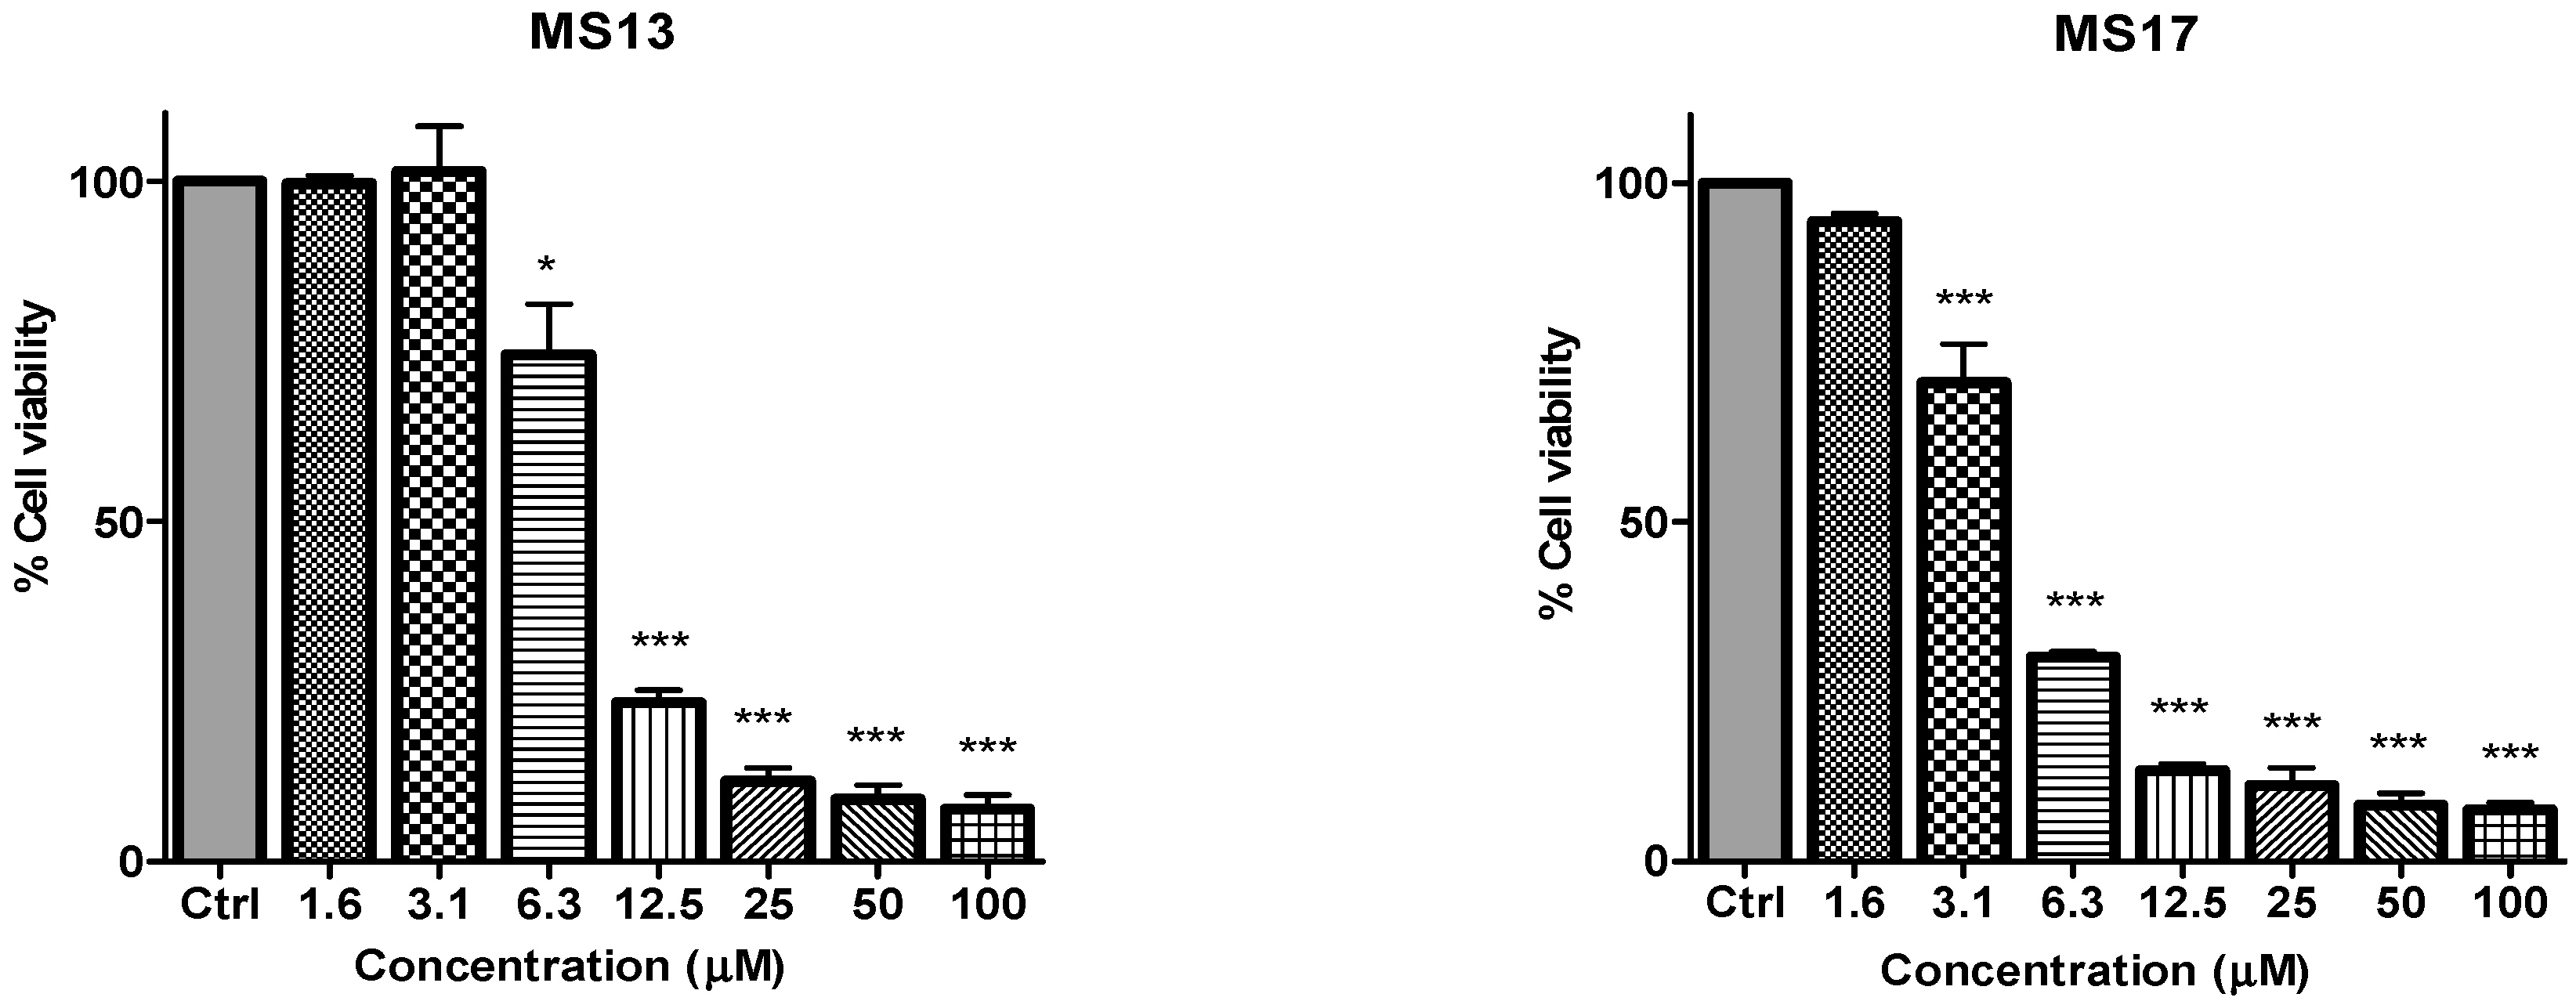
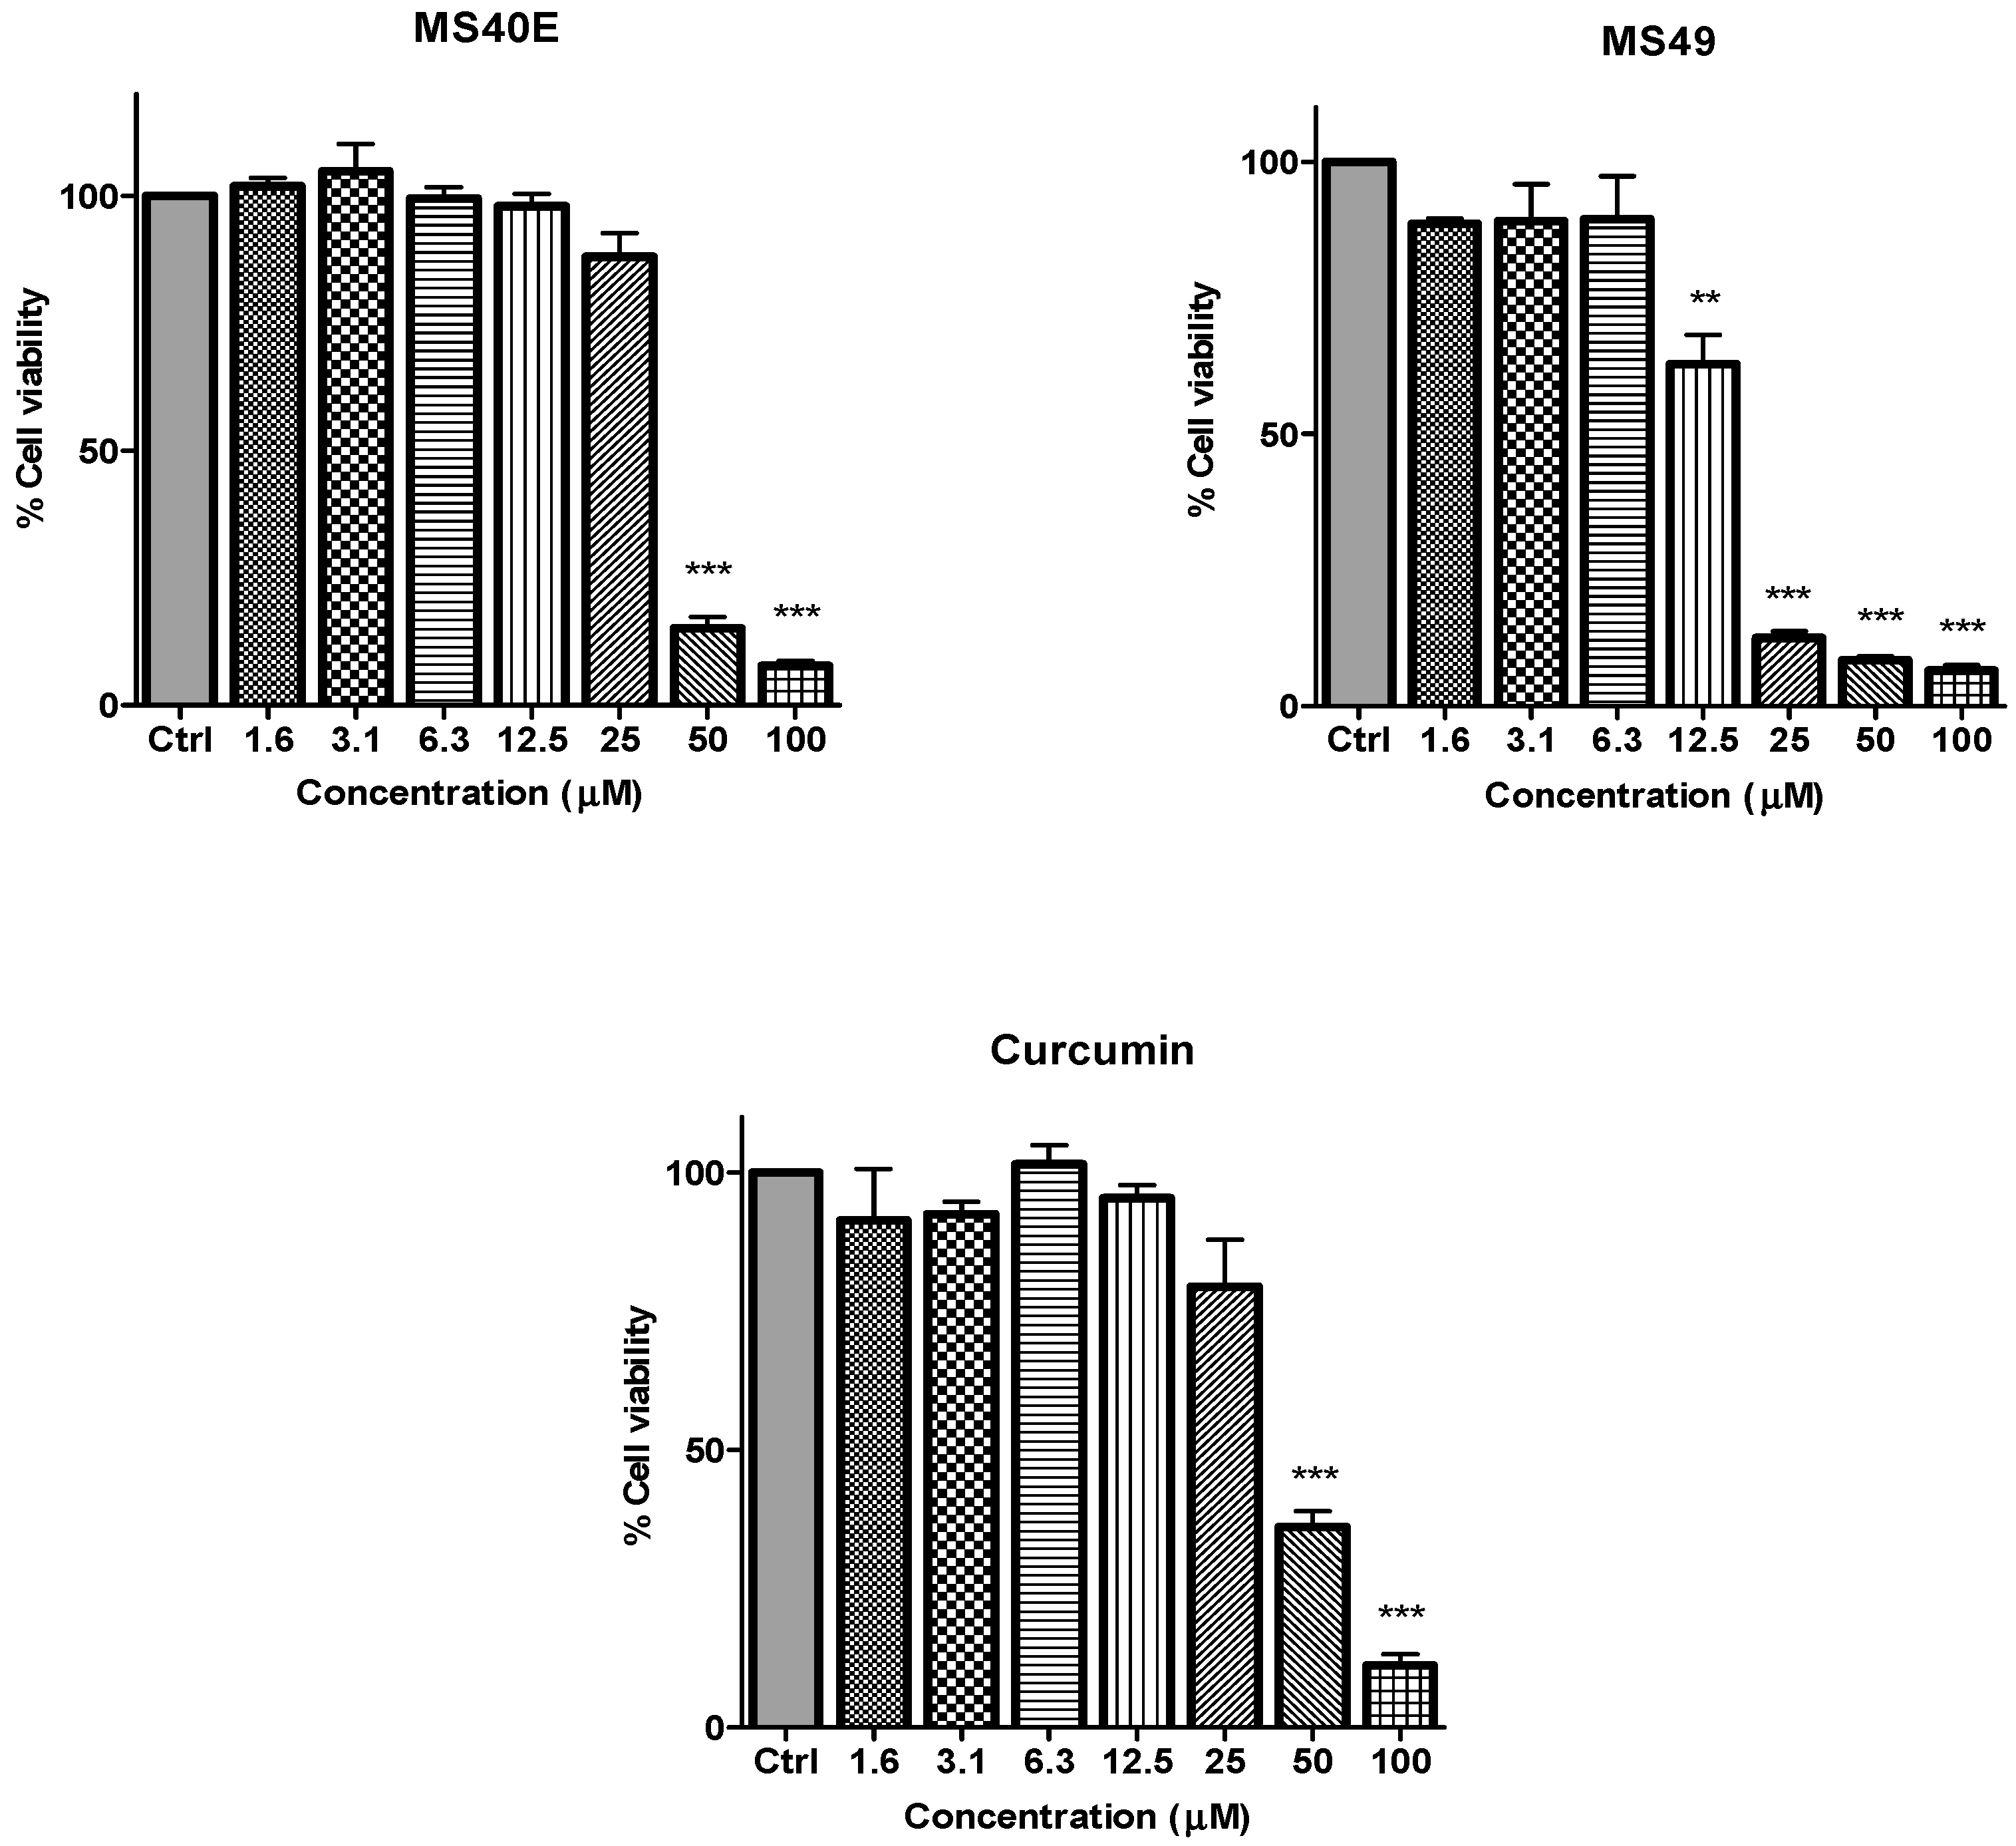
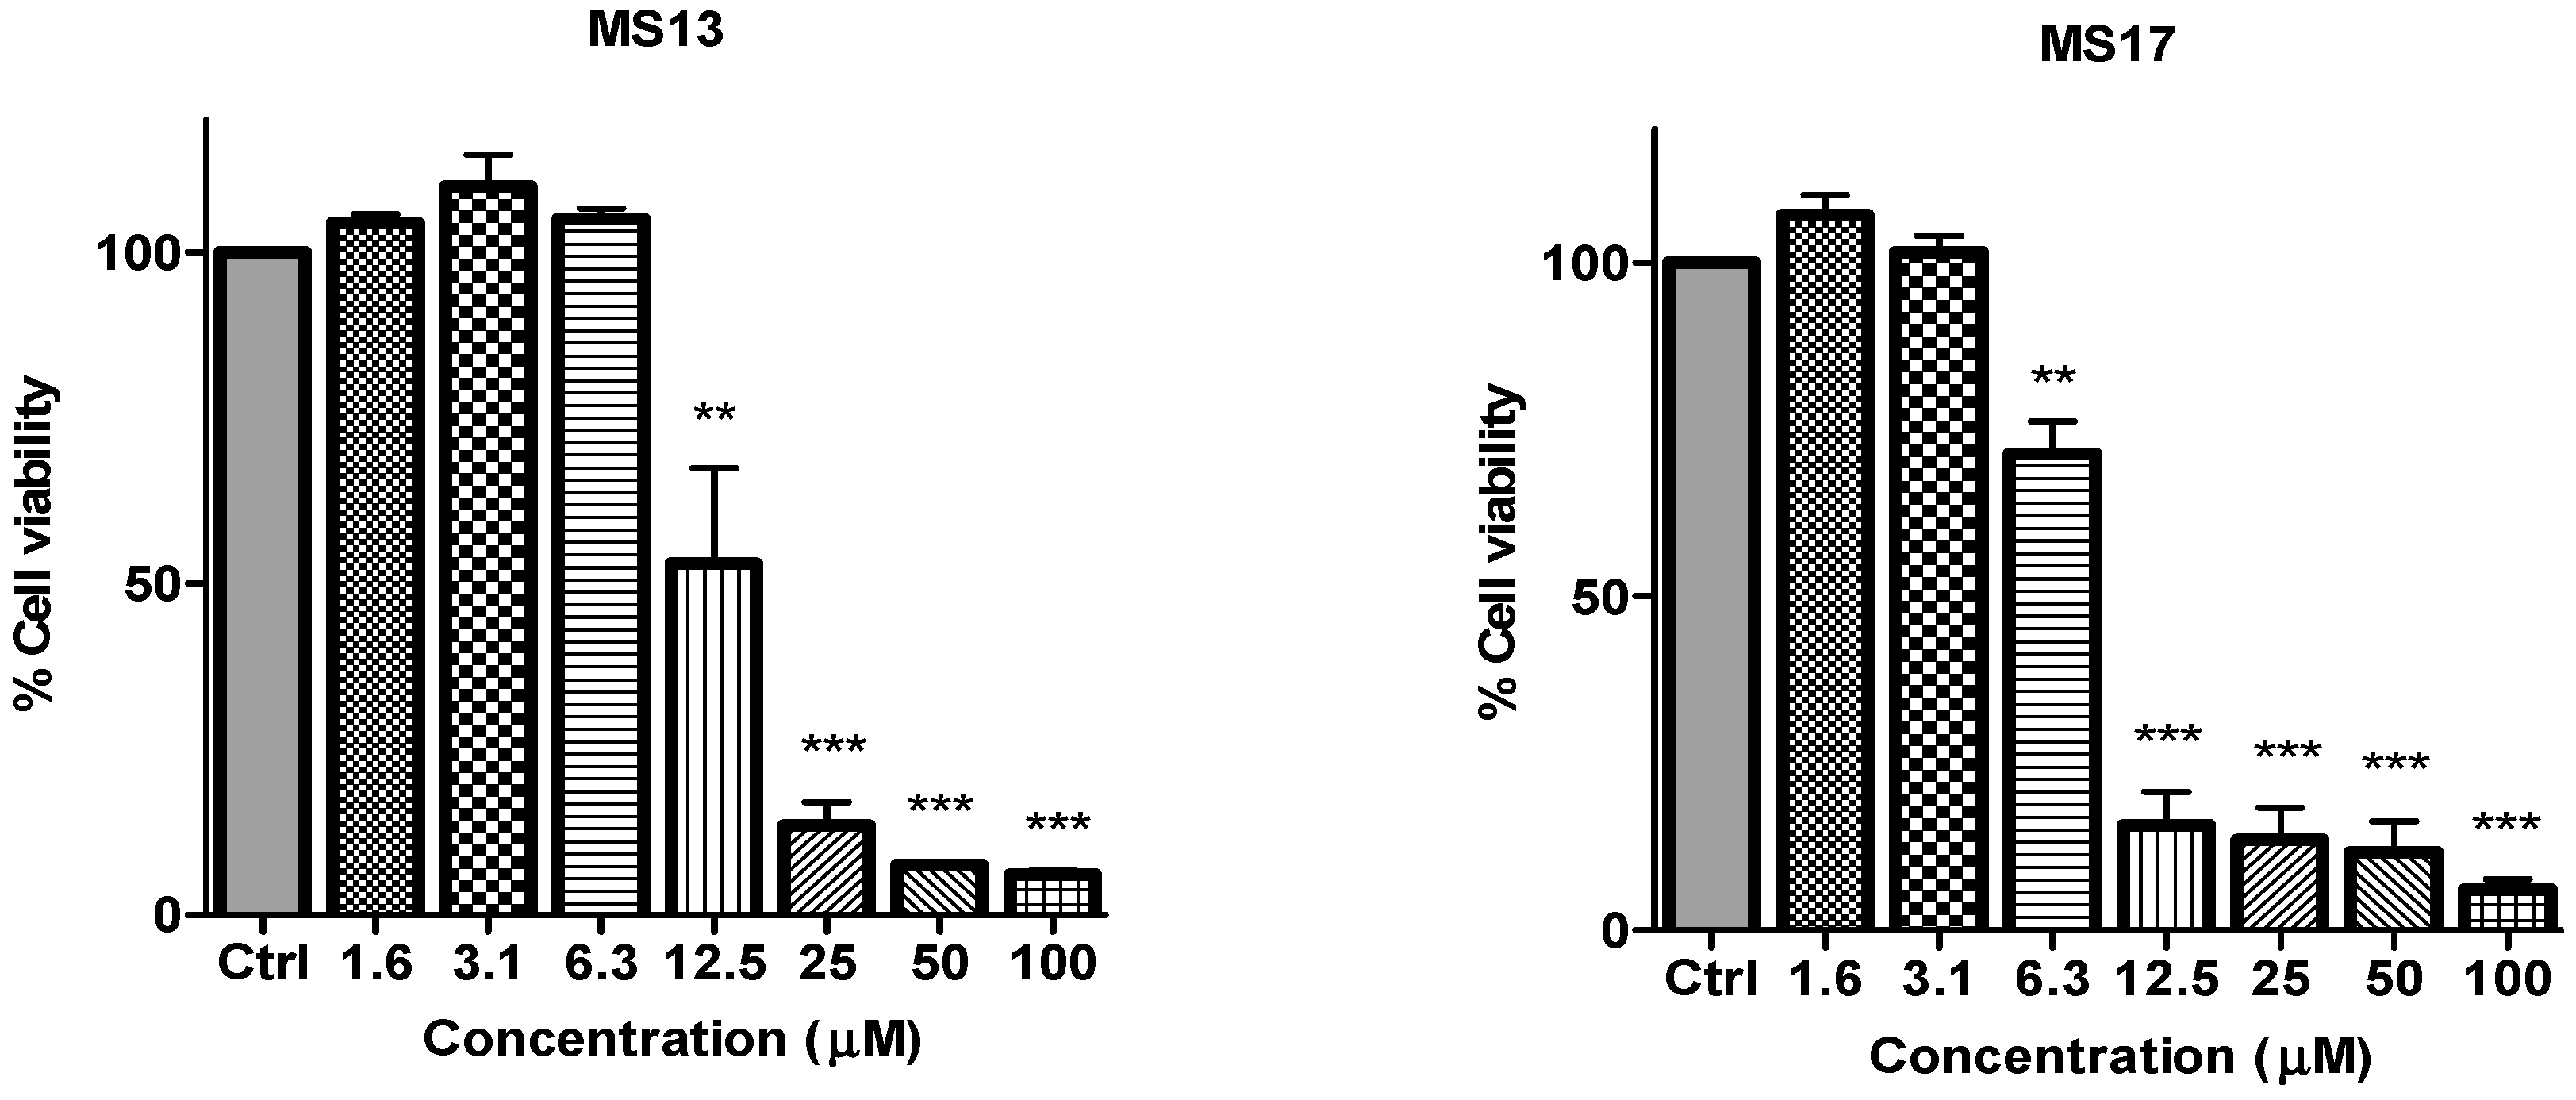
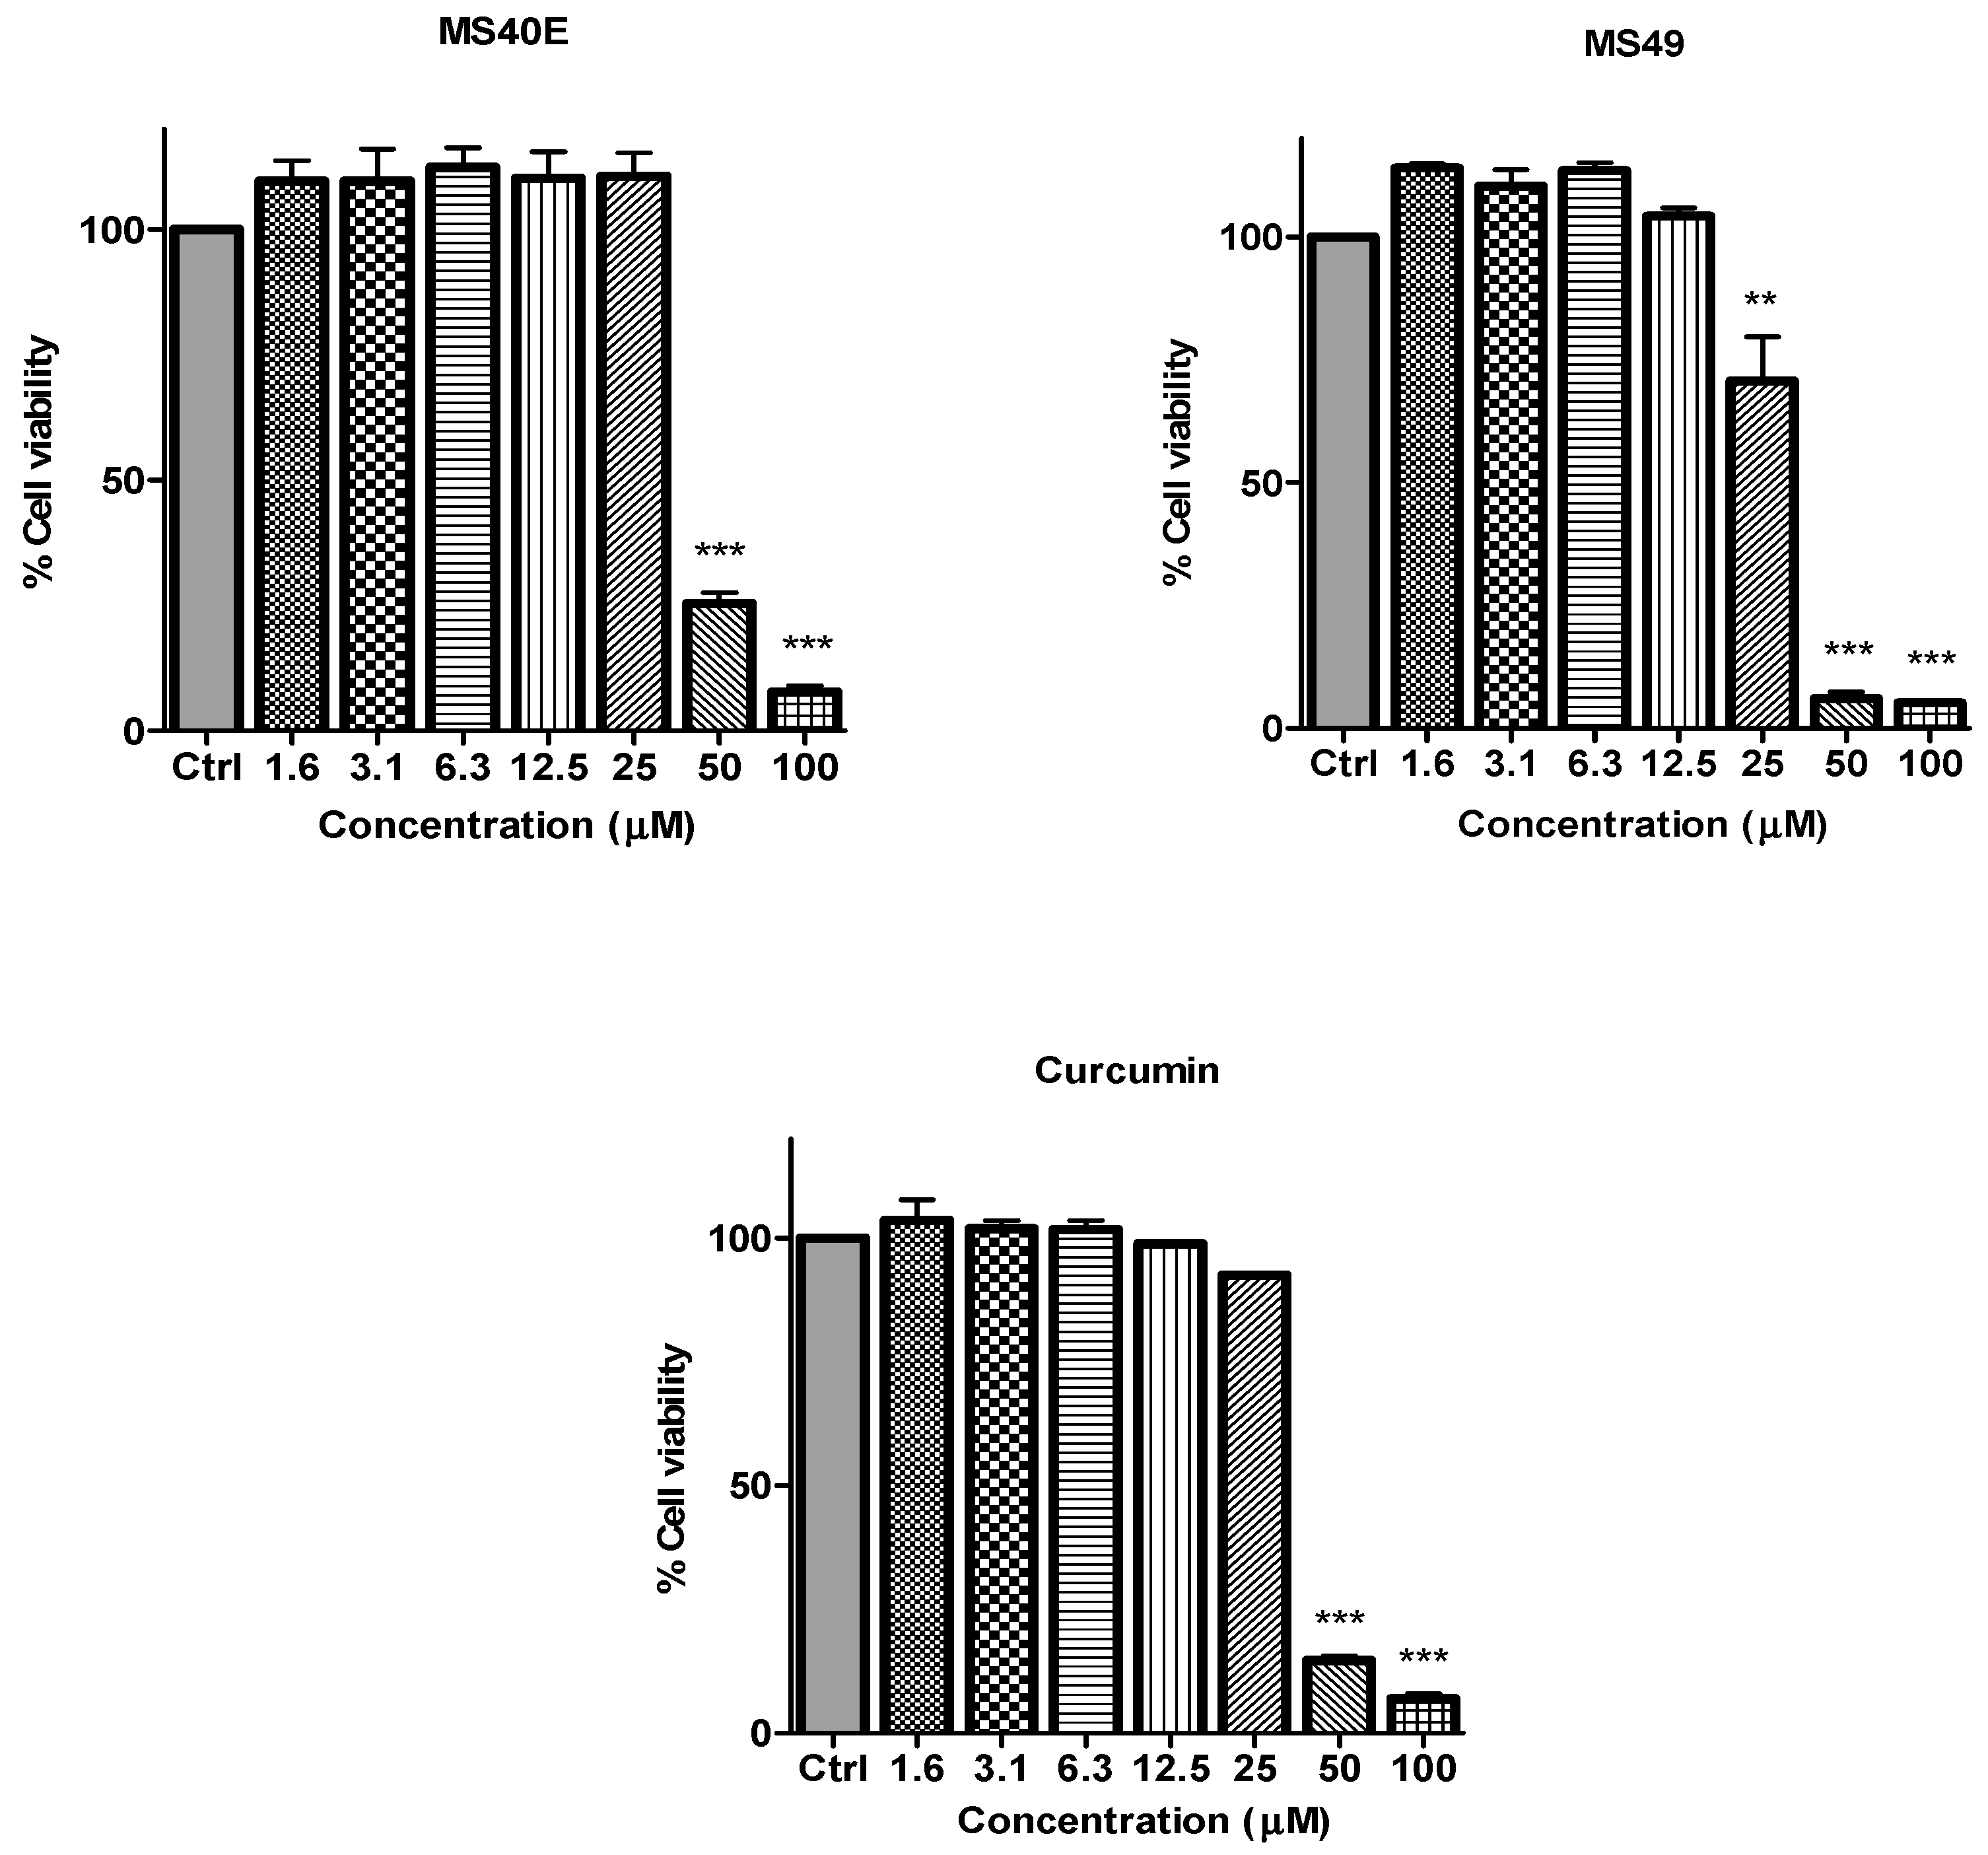
in vitro dose-dependent cytotoxicity effect of the curcumin analogues MS13, MS17, MS40E, and MS49, we performed a prostate cancer cell viability assay. The ability of the diarylpentanoids to inhibit growth of the two widely studied and well characterized androgen independent metastatic human prostate cancer cell lines PC-3 and DU 145 were assessed using the MTT assay. This colorimetric assay is based on the ability of mitochondrial enzymes of live cells to reduce MTT to formazan salt. Cells treated with curcumin and DMSO only was used as positive and negative controls, respectively. Among the tested compounds, MS17 showed the strongest dose and time-dependent cytotoxicity effect in both cell lines with a significant decrease in cell viability at 3.1 µM onwards in PC-3 and 6.3 µM onwards in DU 145 cells. This is followed by MS13 with a significant decrease in cell viability at doses of 6.3 µM and 12.5 µM in PC-3 and DU 145 cell respectively. However, the other compounds MS49 and MS40E exhibited moderate growth inhibitory effect in both cell lines. MS49 revealed a significant decrease in cell viability at doses of 12.5 µM and 25 µM onwards in PC-3 and DU 145 cells respectively whereas, MS40E at a dose of 50 µM onwards in both cell lines. Curcumin, the parent compound displayed a significant cell inhibitory effect at a dose of 50 µM (
Figure 2 and
Figure 3). Based on the cytotoxicity study of all the compounds on both cell lines, the EC
50 value of each compound was measured. As shown in
Table 1, MS17 showed a significantly lower EC
50 value in both the cancer cell lines. Treatment with MS17 stated an EC
50 value of 4.4 ± 0.3 µM in PC-3 and 4.1 ± 0.8 µM in DU 145 compared to that of curcumin, the parent compound. In both cell lines, the order of potencies was MS17 > MS13 > MS49 > MS40E > Curcumin (
Table 1).
Figure 2.
The inhibitory effects of cell viability by curcumin, MS17, MS13, MS40E and MS49 in PC-3 cell line compared to untreated sample (Ctrl). Results are expressed as means ± S.E. from three independent experiments. Percentage cell viability and comparison between data sets performed using ANOVA. * p < 0.05, ** p < 0.01 and *** p < 0.001 indicates statistically significant differences between the means of values obtained with treated vs. untreated cells.
Figure 3.
The inhibitory effects of cell viability by curcumin, MS17, MS13, MS40E and MS49 in DU 145 cell line compared to untreated sample (Ctrl). Results are expressed as means ± S.E. from three independent experiments. Percentage cell viability and comparison between data sets performed using ANOVA. ** p < 0.01 and *** p < 0.001 indicates statistically significant differences between the means of values obtained with treated vs. untreated cells.
Table 1.
EC50 values of curcumin and its analogues on prostate cancer cell lines (PC-3 and DU 145) and normal cell lines (WI-38 and WRL 68).
Table 1.
EC50 values of curcumin and its analogues on prostate cancer cell lines (PC-3 and DU 145) and normal cell lines (WI-38 and WRL 68).
| Compounds | EC50 Values (µM) of Compounds on Cell Lines |
|---|
| PC-3 | DU 145 | WI-38 | WRL-68 |
|---|
| MS13 | 7.5 ± 0.1 | 7.4 ± 2.6 | 9.4 ± 2.3 | 8.7 ± 0.2 |
| MS17 | 4.4 ± 0.3 | 4.1 ± 0.8 | 5.2 ± 1.2 | 5.5 ± 0.5 |
| MS40E | 28.0 ± 7.8 | 30.3 ± 1.9 | 28.4 ± 1.7 | 30.3 ± 2.0 |
| MS49 | 14.5 ± 1.2 | 12.3 ± 2.3 | 19.4 ± 7.0 | 13.1 ± 0.4 |
| * Curcumin | 35.9 ± 2.9 | 32.5 ± 1.4 | 27.9 ± 2.9 | 28.7 ± 3.2 |
The cytotoxicity effects of all compounds were further evaluated for their toxicity against normal human liver epithelia (WRL-68) and human lung fibroblast (WI-38) cell lines. Interestingly, all four compounds showed lower cytotoxicity against the normal cell lines. As a whole, these results revealed that all four compounds showed an improved dose-dependent growth inhibitory effect on PC-3 and DU 145 cells compared to curcumin. These results also suggest that MS17 has the strongest cell inhibitory effect on PC-3 and DU 145 cells. Furthermore, in order to evaluate the most toxic compound towards cancer cells, the corresponding selectivity index (
SX) values were determined. Based on the calculated
SX values, MS17 showed comparably high
SX value in both the cancer cell lines (
Table 2) compared to curcumin which exhibited the lowest
SX value in both the cancer cell lines.
Table 2.
Selective index (SX) values of compounds on each tested prostate cancer cell lines and normal cell lines.
Table 2.
Selective index (SX) values of compounds on each tested prostate cancer cell lines and normal cell lines.
| Compounds | WI-38 (Normal Human Lung Fibroblast Cell) | WRL68 (Normal Human Epithelial Hepatocytes) |
|---|
| PC-3 | DU 145 | PC-3 | DU 145 |
|---|
| MS13 | 124.8 | 127.2 | 115.1 | 117.3 |
| MS17 | 117.4 | 126.3 | 124.9 | 134.3 |
| MS40E | 101.4 | 93.5 | 108.3 | 100.0 |
| MS49 | 134.3 | 158.6 | 90.4 | 106.8 |
| Curcumin | 77.5 | 85.8 | 79.8 | 88.2 |
2.2. Determination of the Anti-Proliferative Effect of the Compounds on the Prostate Cancer Cells
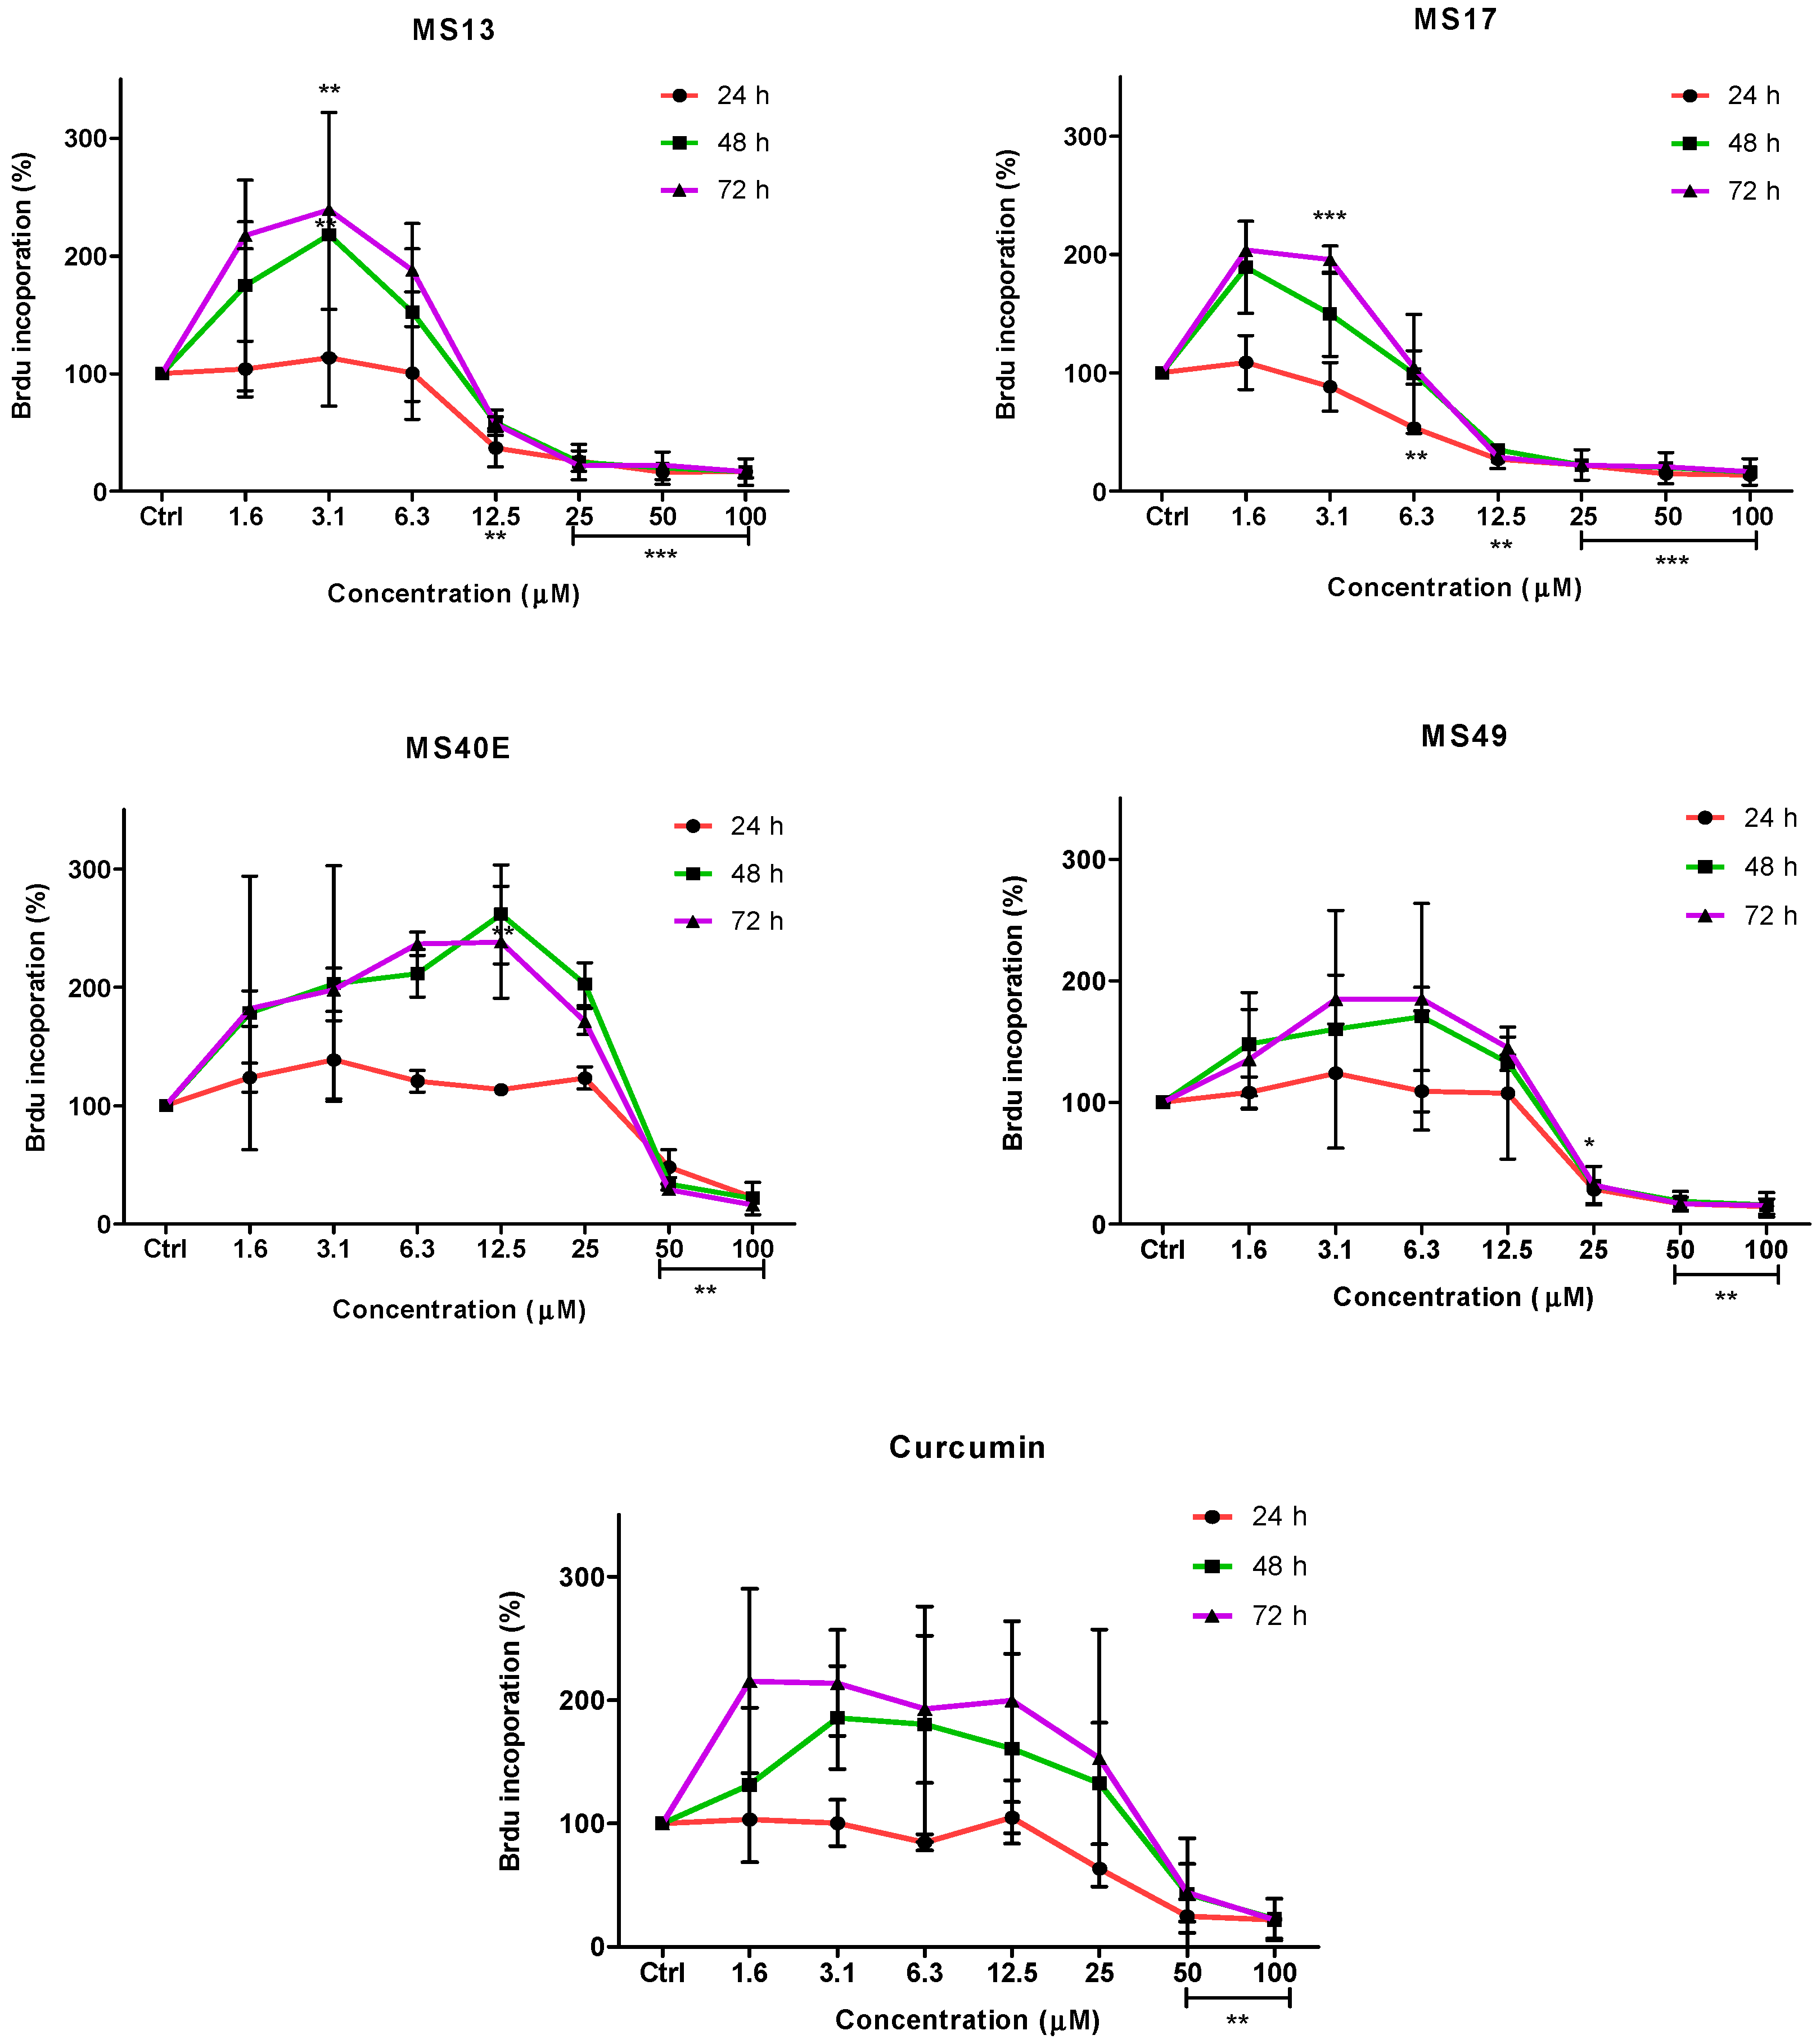
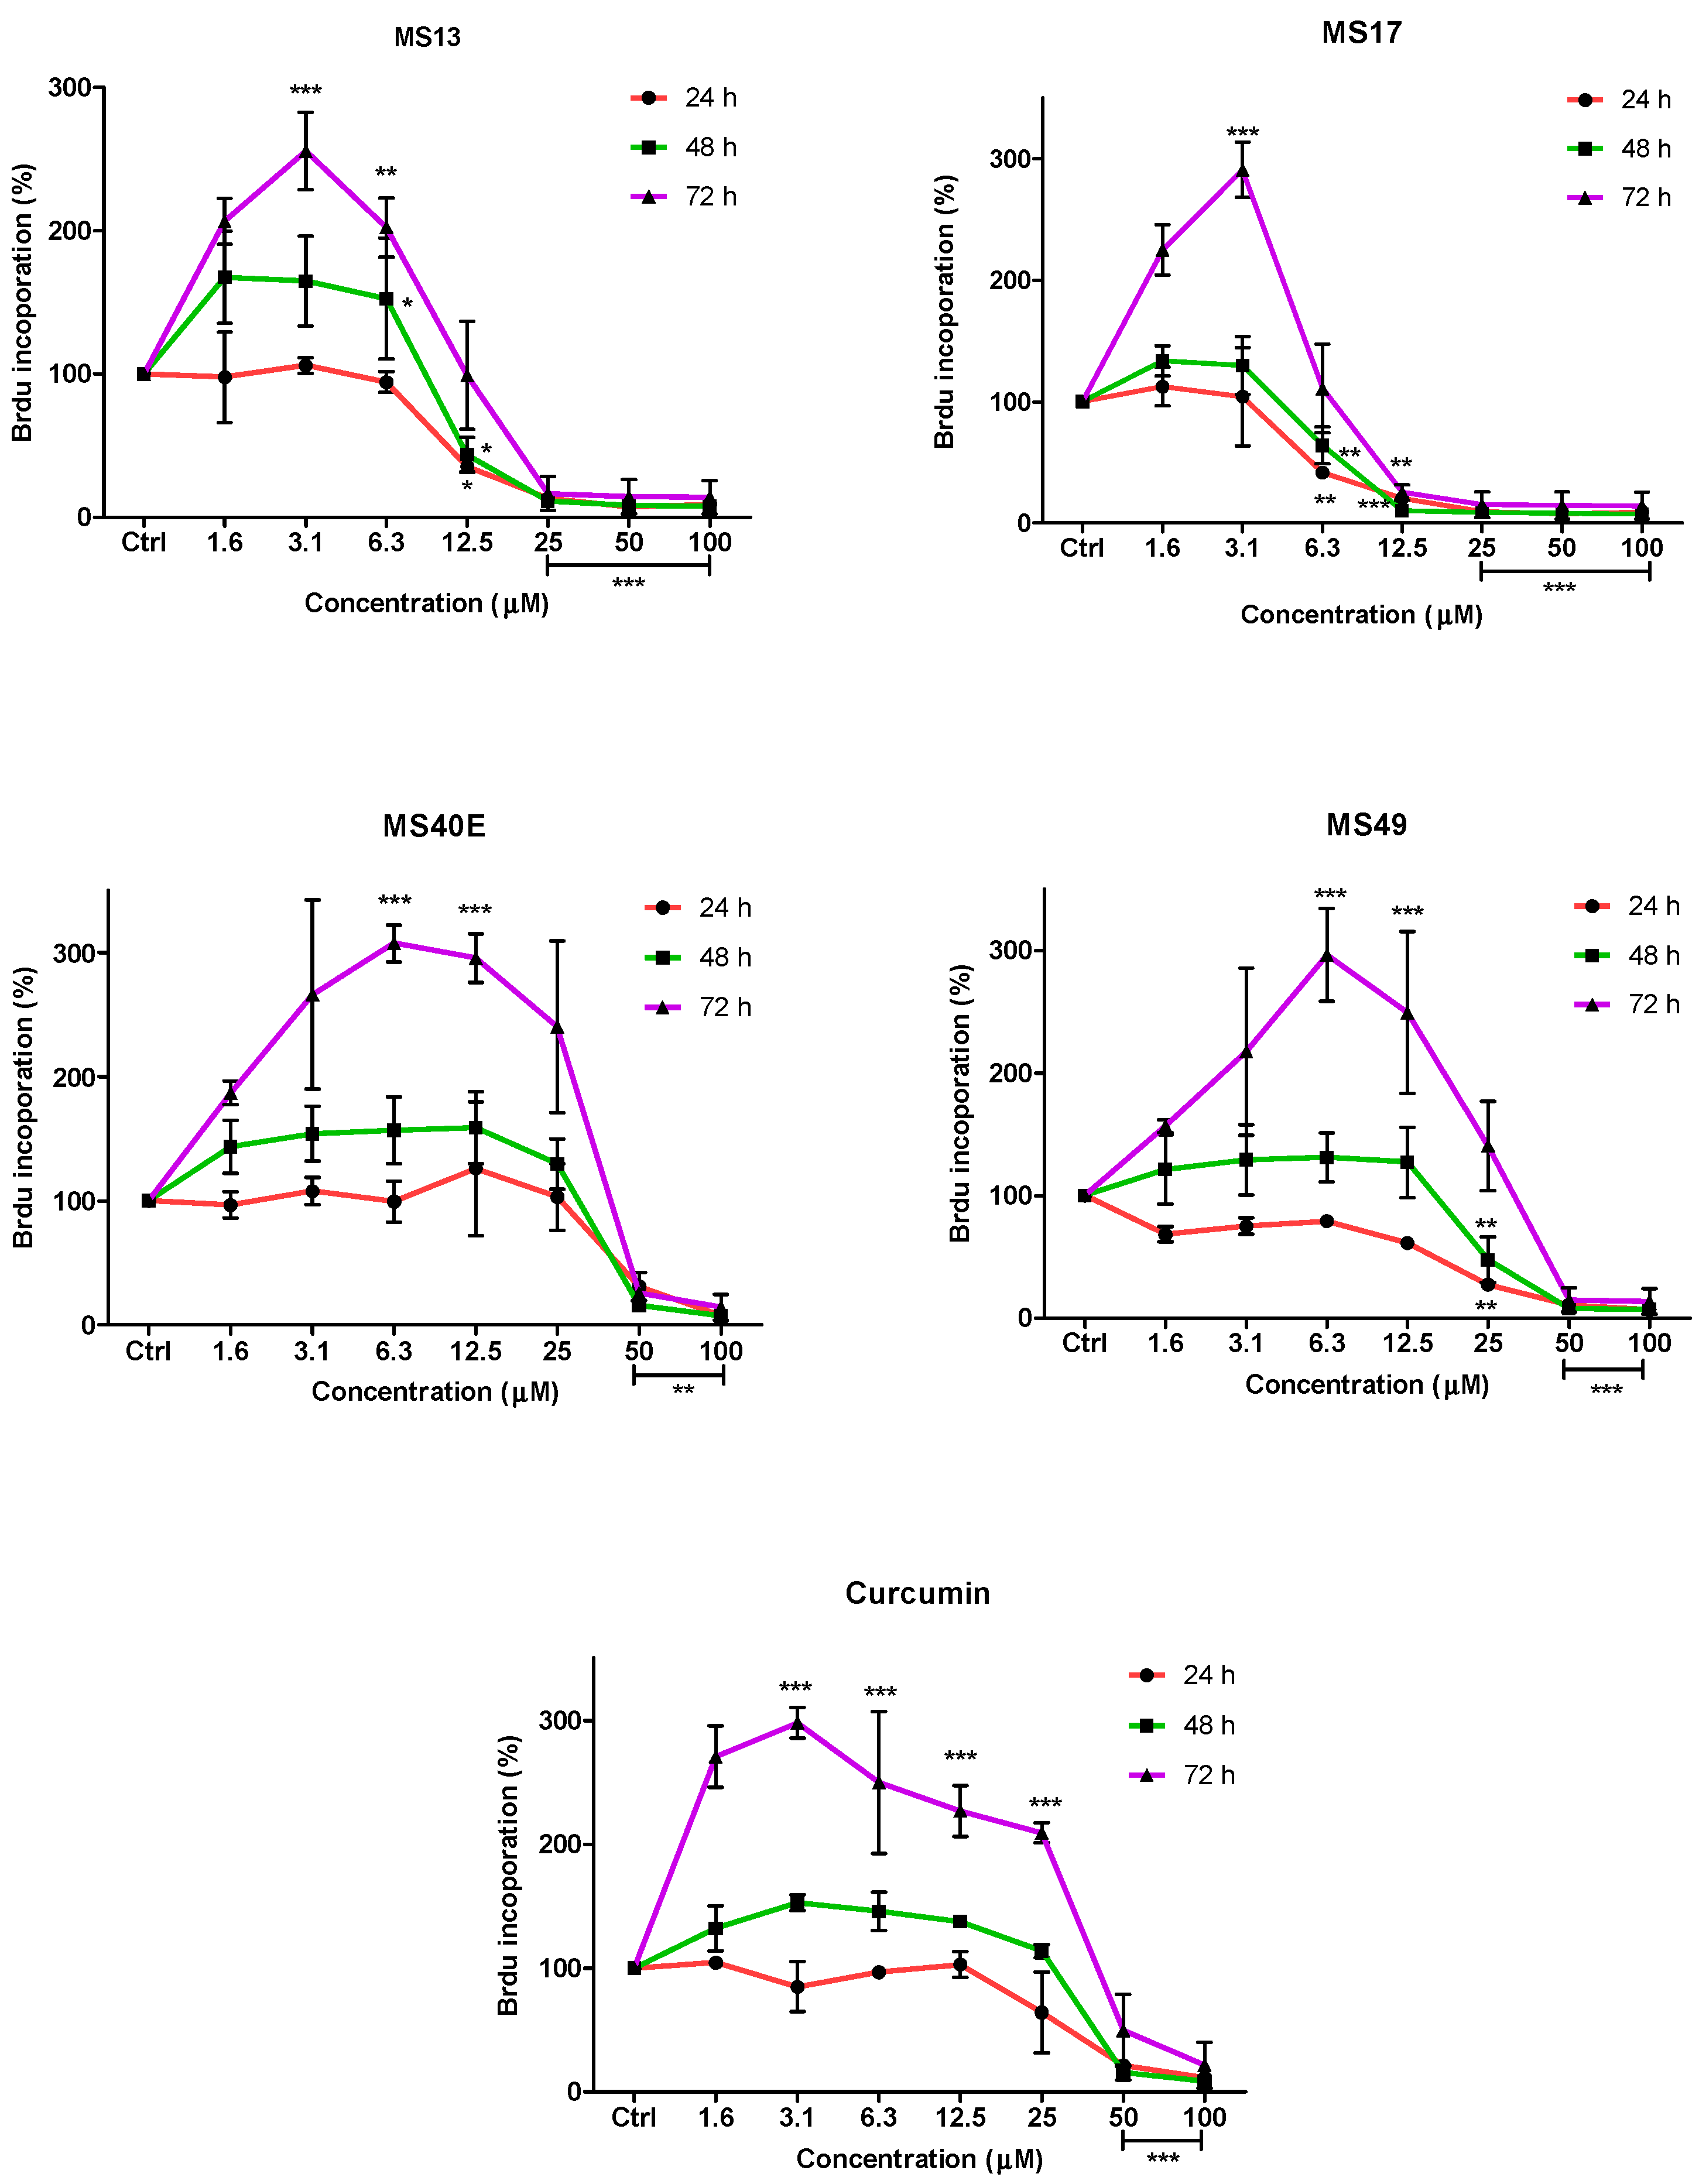
To further confirm the potential of the compounds inhibiting cell growth in both cancer cell lines, a BrdU cell proliferation assay was performed. The cell proliferation percentage was measured based on the incorporation of the bromodeoxyuridine (BrdU) into the DNA of the proliferating cells. The percentage of reduction or decrease of cell proliferation is proportional to the percentage reduction of BrdU incorporation. The anti-proliferative study which is a time-dependent assay evaluates the approximate duration taken for growth inhibition to be initiated. Elucidation of anti-proliferative effect of the compounds was based on the fact that relatively low drug concentration induced considerable growth inhibition of the prostate cancer cell lines. Overall, treatment with the compounds resulted in a concentration and time-dependent reduction in cell proliferation rate in PC-3 and DU 145 cell lines. At all three time points, MS17 and MS13 showed a greater anti-proliferative effect compared to the other compounds.
In PC-3 cells, treatment with MS13 caused a significant reduction in cell proliferation at 12.5 µM onwards for 24, 48 and 72 h. The reduction at 24 h was approximately 60%–80% and 40%–80% at 48 and 72 h compared to the control. However, MS17 showed a significant anti-proliferative activity at 6.3 µM onwards for 24 h treatment with approximately 50%–90% reduction in cell proliferation compared to the control. At 48 and 72 h, the reduction in cell proliferation was significant at 12.5 µM onwards with approximately 80%–90% reduction. As for treatment with MS49, results showed a significant anti-proliferative activity at 25 µM onwards for all three time points. However, MS40E and curcumin showed a moderate anti-proliferative activity at 50 µM onwards for 24, 48 and 72 h compared to the control (
Figure 4).
Figure 4.
Anti-proliferative effect of MS13, MS17, MS40E, MS49 and curcumin on PC-3 cells at 24, 48 and 72 h. Results are expressed as means ± S.E. from three independent experiments. Percentage BrdU incorporation and comparison between data sets performed using ANOVA. * p < 0.05, ** p < 0.01 and *** p < 0.001 indicates statistically significant differences between the means of values obtained with treated vs. untreated cells (control).
On the other hand, treatment with MS13 in DU 145 cells showed a significant anti-proliferative activity at 12.5 µM onwards for 24 and 48 h, with approximately 60%–90% reduction in cell proliferation. However, at 72 h the reduction was noted to be significant at 25 µM onwards compared to the control cells. In MS17 treatment, a significant anti-proliferative activity was seen at 6.3 µM onwards for both the time points compared to the control cells with approximately 60%–90% reduction at 24 h and 30%–90% reduction at 48 h. For 72 h, treatment with MS17 caused a significant decrease in cell proliferation at 12.5 µM onwards. Nonetheless, MS49 showed a significant anti-proliferative activity at 25 µM onwards for both 24 and 48 h treatment, but at 72 h the reduction was significant at 50 µM onwards. However, MS40E and curcumin showed a similar anti-proliferative activity which was significant at 50 µM for all three time points (
Figure 5). These results indicate that treatment with MS13 and MS17 had a greater anti-proliferative activity in both the cell lines compared to curcumin as a greater reduction of BrdU incorporation suggests a higher anti-proliferative activity.
Figure 5.
Anti-proliferative effect of MS13, MS17, MS40E, MS49 and curcumin on DU 145 cells at 24, 48 and 72 h. Results are expressed as means ± S.E. from three independent experiments. Percentage BrdU incorporation and comparison between data sets performed using ANOVA. * p < 0.05, ** p < 0.01 and *** p < 0.001 indicates statistically significant differences between the means of values obtained with treated vs. untreated cells (control).
2.3. Induction of Apoptosis
The mode of killing exerted by most of the effective anti-cancer agents is through the induction of apoptosis. Therefore, the induction of apoptosis was evaluated using several techniques. For a more comprehensive analysis, only MS17 was selected for further analysis on the apoptosis assays based on the selective cytotoxic activity of this compound. The apoptosis effect of MS17 was accessed using three concentrations based on EC50, 2X EC50 and 3X EC50 values at appropriate time points.
2.3.1. Morphological Observation of Cancer Cell Lines by Acridine Orange (AO)—Ethidium Bromide (EB) Double Staining Technique Using Fluorescence Microscope
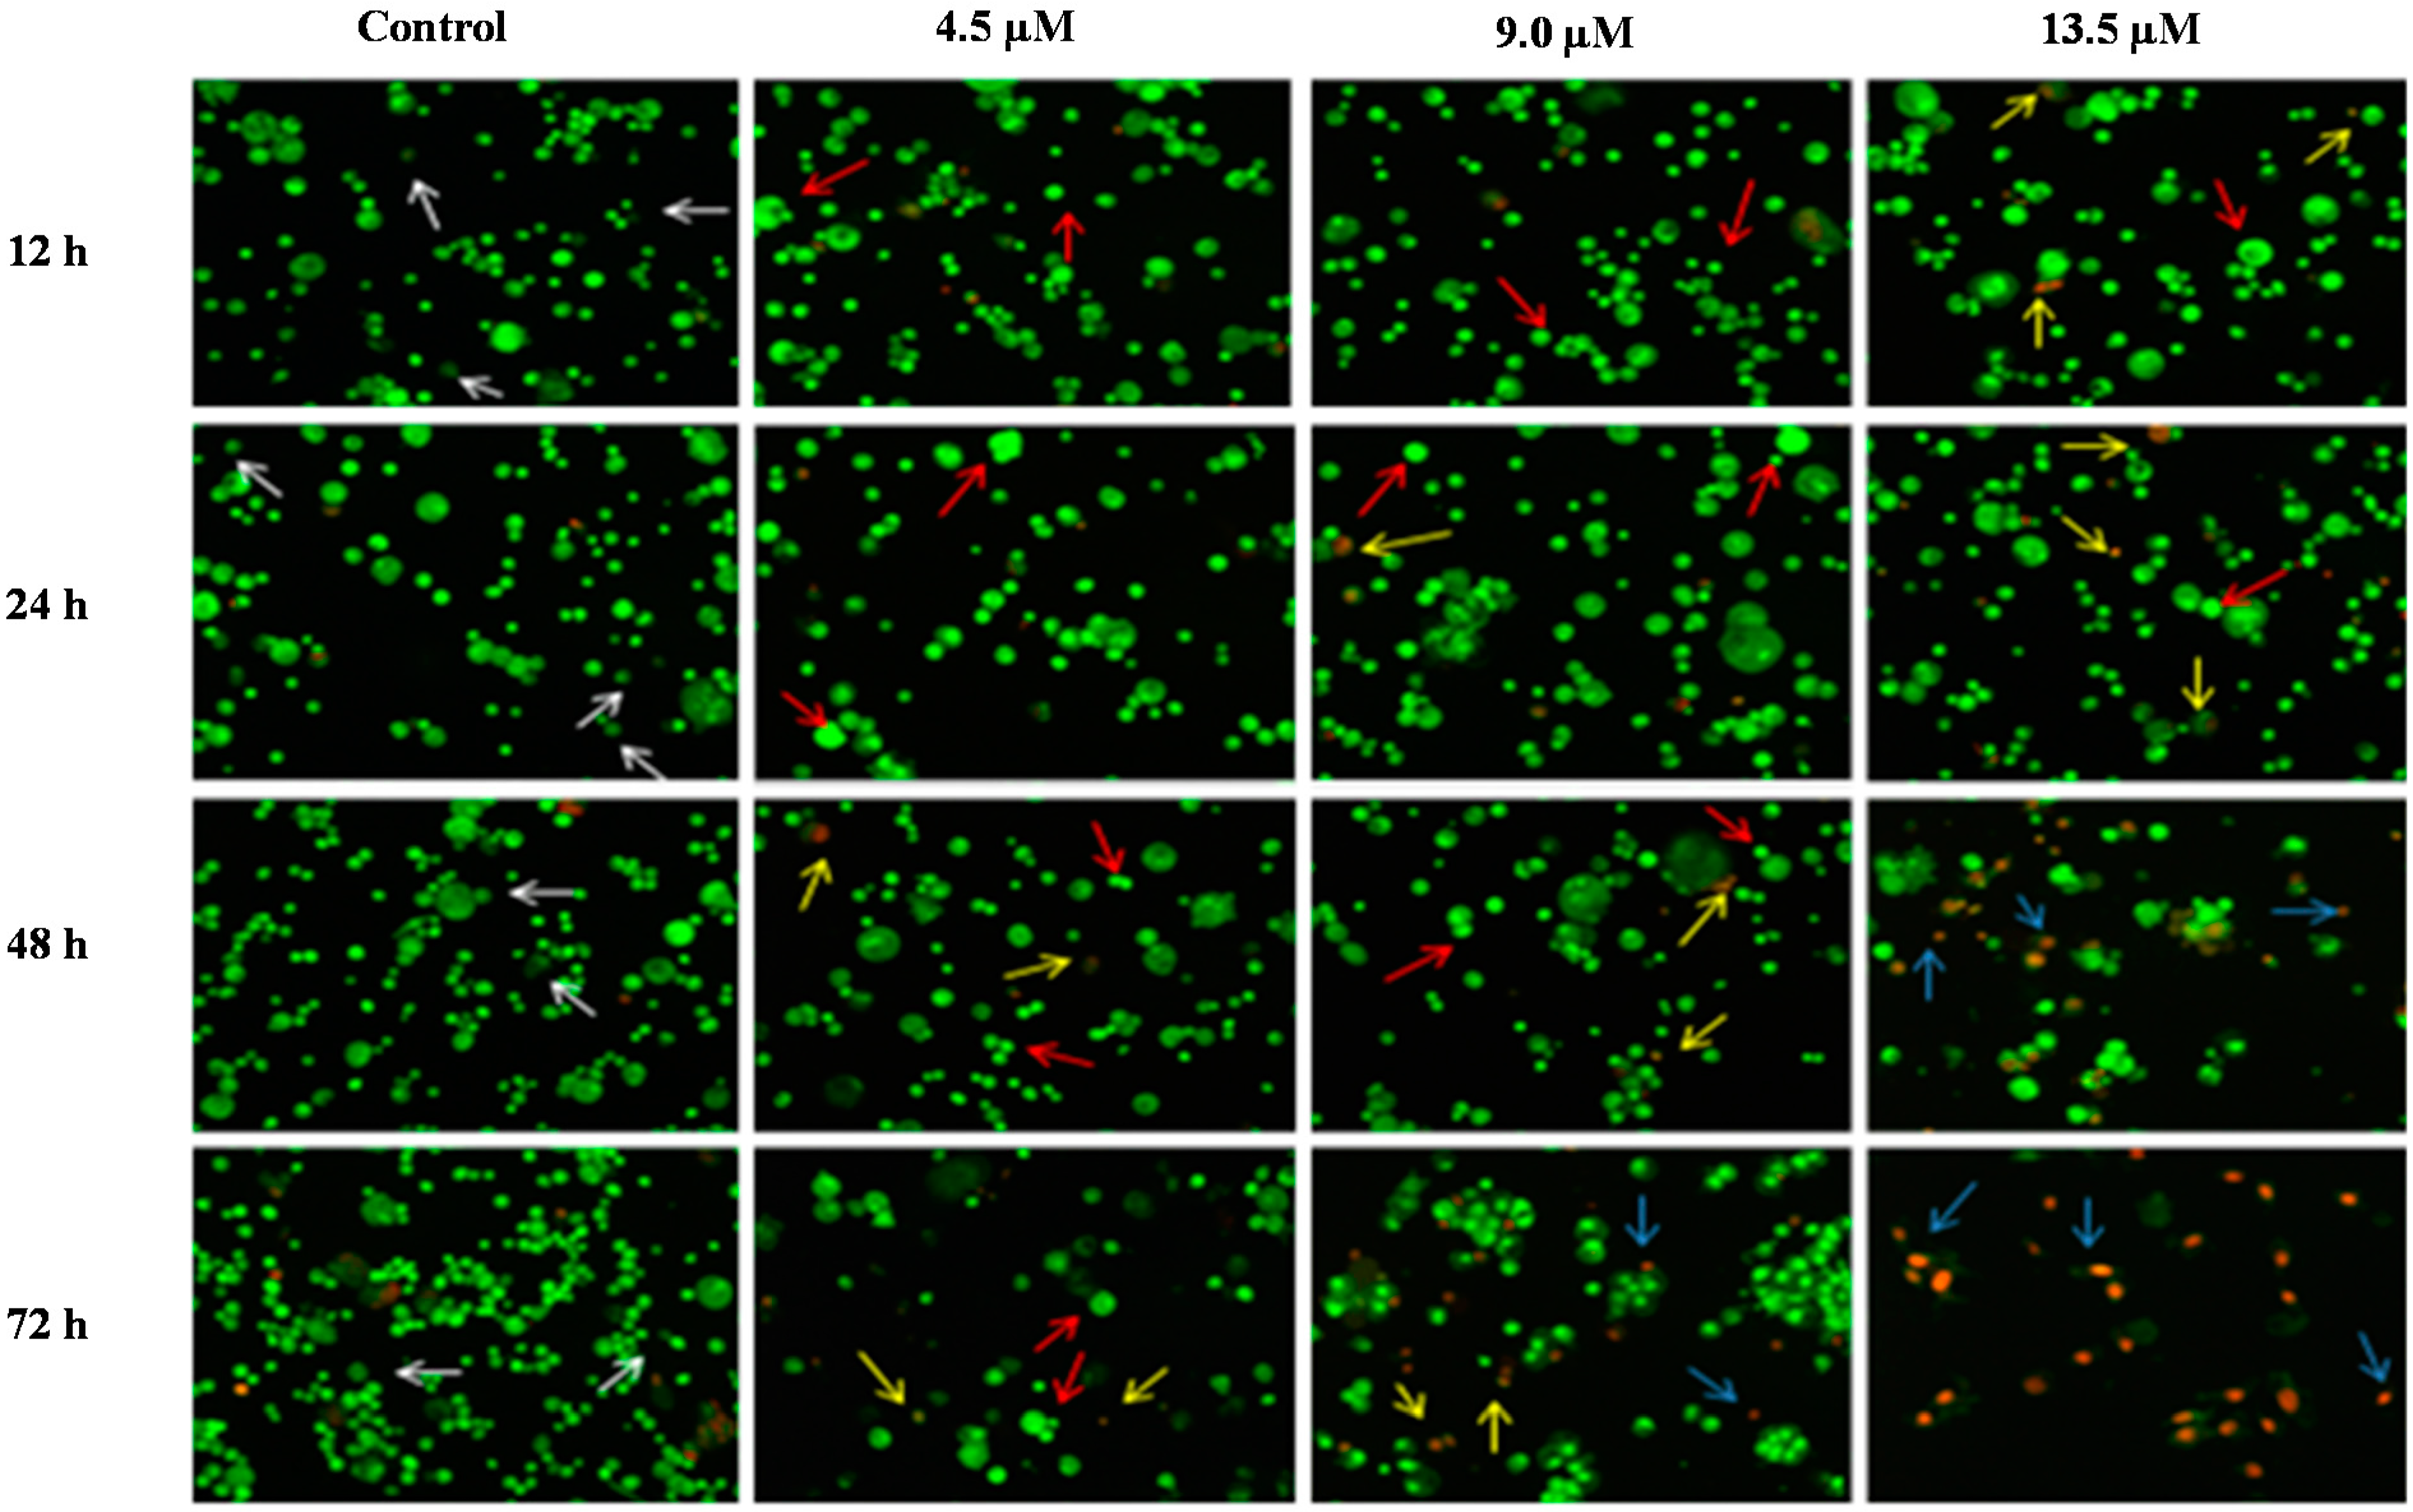
The morphological assessment of cell death was performed in order to confirm that MS17 treatment of PC-3 and DU 145 prostate cancer cells was inducing apoptosis rather than necrosis. Treated cells that were double stained with acridine orange/ethidium bromide (AO/EB) were examined under a fluorescence microscope.
AO is a crucial dye which can stain nucleus DNA in an intact cell membrane, whereas EB stains cells that have lost membrane integrity. Under fluorescent emission, AO is taken up by both the viable and non-viable cells emitting a green fluorescence, whereas EB is taken up only by the non-viable cells emitting red fluorescence if intercalated into the DNA strand. Hence, the live cells have a normal green nucleus whereas the early apoptotic cells have a bright green nucleus with condensed or fragmented chromatin and late apoptotic cells show condensed or fragmented yellow-orange or red chromatin whereas necrotic cells display a bright orange or red uniform nucleus. The morphological characteristics of the MS17 treated cells were photographed and depicted in
Figure 6 and
Figure 7.
Figure 6.
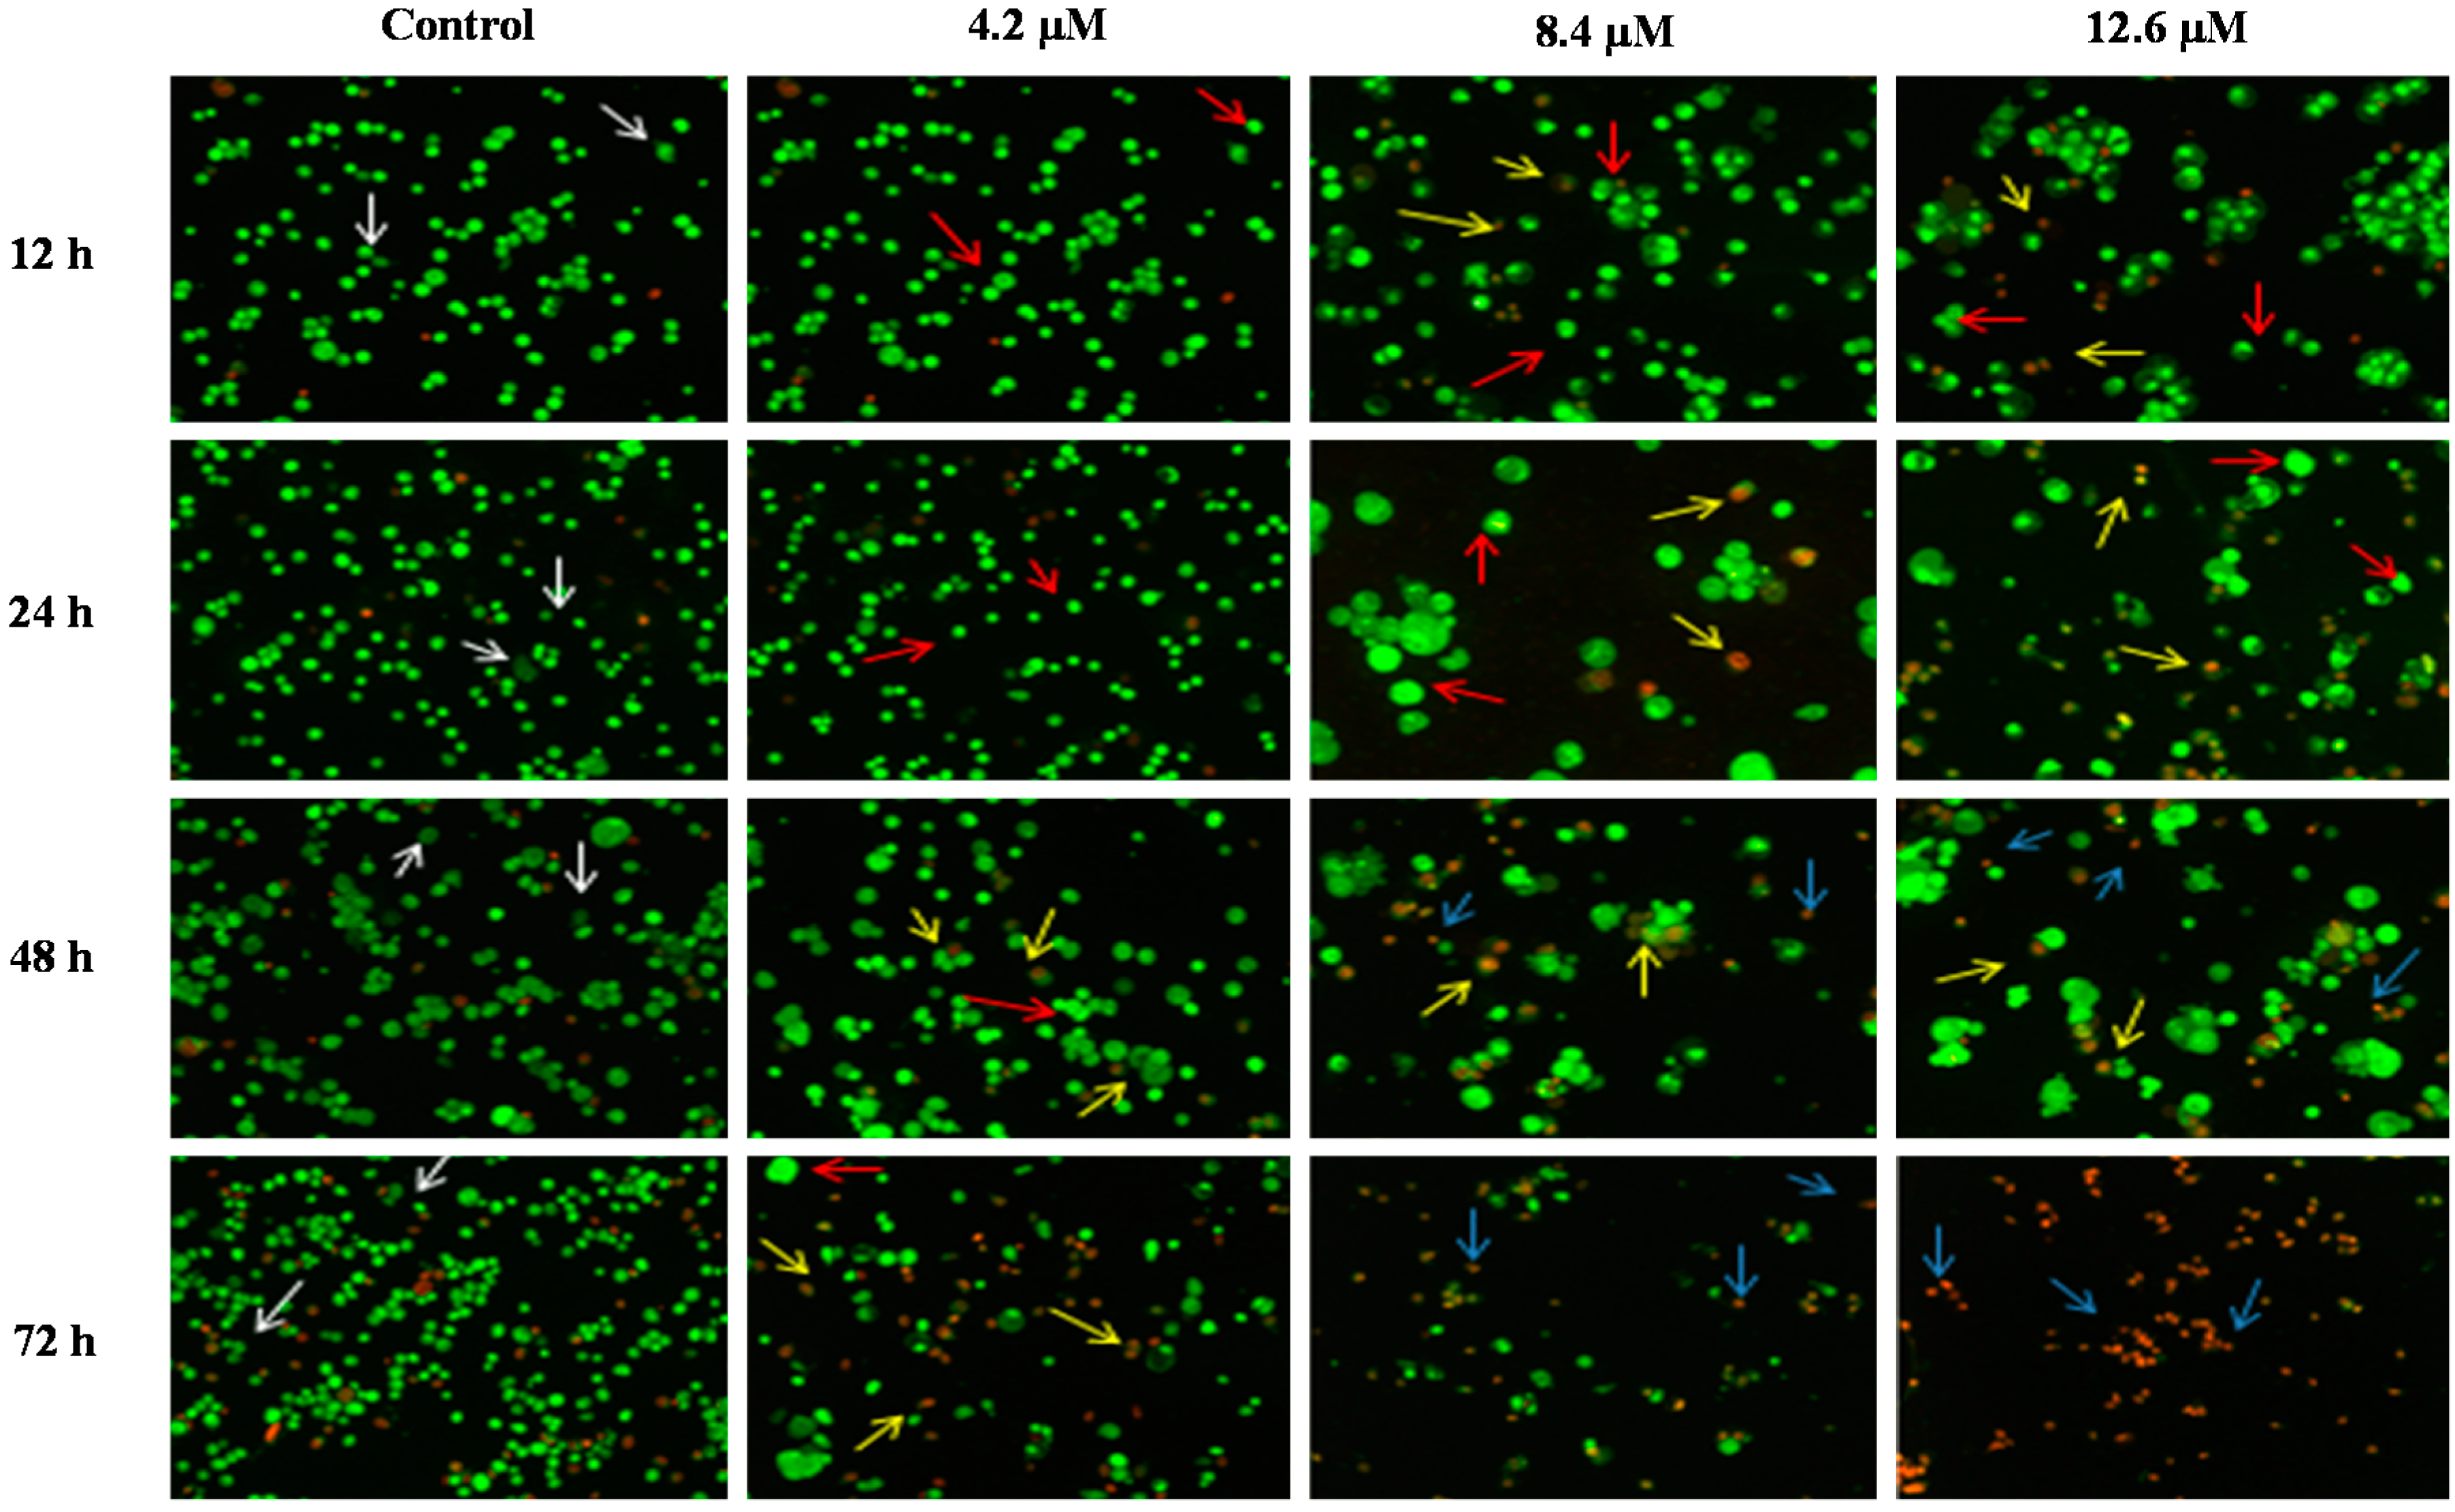
Detection by fluorescent microscopy of acridine orange/ethidium bromide double stained PC-3 cells treated with MS17 for 12, 24, 48 and 72 h. Untreated viable cells are uniformly pale-green (white arrow); Early apoptotic cells shows characteristic loss of membrane integrity and chromatin condensation, stained bright-green to yellow (red arrow); Late apoptotic cells stained yellow-orange or red colour, with a condensed or fragmented chromatin (yellow arrow); Necrotic cells showed bright orange-red in appearance (blue arrow). Magnification 100×.
Figure 6.
Detection by fluorescent microscopy of acridine orange/ethidium bromide double stained PC-3 cells treated with MS17 for 12, 24, 48 and 72 h. Untreated viable cells are uniformly pale-green (white arrow); Early apoptotic cells shows characteristic loss of membrane integrity and chromatin condensation, stained bright-green to yellow (red arrow); Late apoptotic cells stained yellow-orange or red colour, with a condensed or fragmented chromatin (yellow arrow); Necrotic cells showed bright orange-red in appearance (blue arrow). Magnification 100×.
Figure 7.
Detection by fluorescent microscope of acridine orange/ethidium bromide double stained DU 145 cells treated with MS17 for 12, 24, 48 and 72 h. Untreated viable cells are uniformly pale-green (white arrow); Early apoptotic cells shows characteristic loss of membrane integrity and chromatin condensation, stained bright-green to yellow (red arrow); Late apoptotic cells stained yellow-orange or red colour, with a condensed or fragmented chromatin (yellow arrow); Necrotic cells showed bright orange-red in appearance (blue arrow). Magnification 100×.
The morphological observation in the cell nuclei of MS17-treated PC-3 and DU 145 cells showed various morphological alterations when compared to the untreated cells (control). The control cells appeared to be intact oval shape and the nucleus were stained uniformly pale-green due to the AO dye. However, MS17-treated cells showed typical signs of apoptosis such as cell shrinkage, formation of apoptotic bodies and membrane blebbing [
36]. In both cell lines, as the treatment doses increase, there was a significant decrease in the appearance of viable cells (white arrow).
In PC-3 cells, treatment with 4.5 and 9.0 µM of MS17 at 12 and 24 h displayed higher intensity of bright green fluorescent cells (red arrow) compared to the control, revealing an early apoptotic cells. However, at 48 and 72 h there was a mixed population of cells stained bright green to yellow, indicative of early and late apoptosis (red and yellow arrow). At 72 h, 13.5 µM MS17-treated cells displayed a high proportion of necrotic cells. Necrotic cells which showed loss of membrane integrity emit orange-red fluorescence due to the leakage of EB dye into the nuclei (blue arrow). In DU 145 cells, treatment with 4.2 µM of MS17 at 12 and 24 h showed a higher number of cells stained bright green fluorescent (red arrow) compared to 48 and 72 h which displayed a mixed population of bright green to yellow cells (red and yellow arrow). Treatment with 8.4 and 12.6 µM at 12 and 24 h revealed a mixed population of early and late apoptotic cells, stained bright green to yellow (red and yellow arrow) compared to 48 and 72 h which displayed a higher intensity of necrotic cells, stained orange-red (blue arrow). The morphological characteristic of necrotic cells can be seen clearly in DU 145 cells at 72 h with the treatment of the highest concentration. Collectively, the number of cells stained bright orange-red were generally very low in all MS17-treated cells which suggest that cell death occurred mostly due to apoptosis rather than necrosis.
2.3.2. Quantification of Apoptotic and Necrotic Cells
The percentages of apoptotic and necrotic cells were also determined. For the purpose of analysis, early and late apoptosis were combined to indicate an apoptotic activity. As observed in
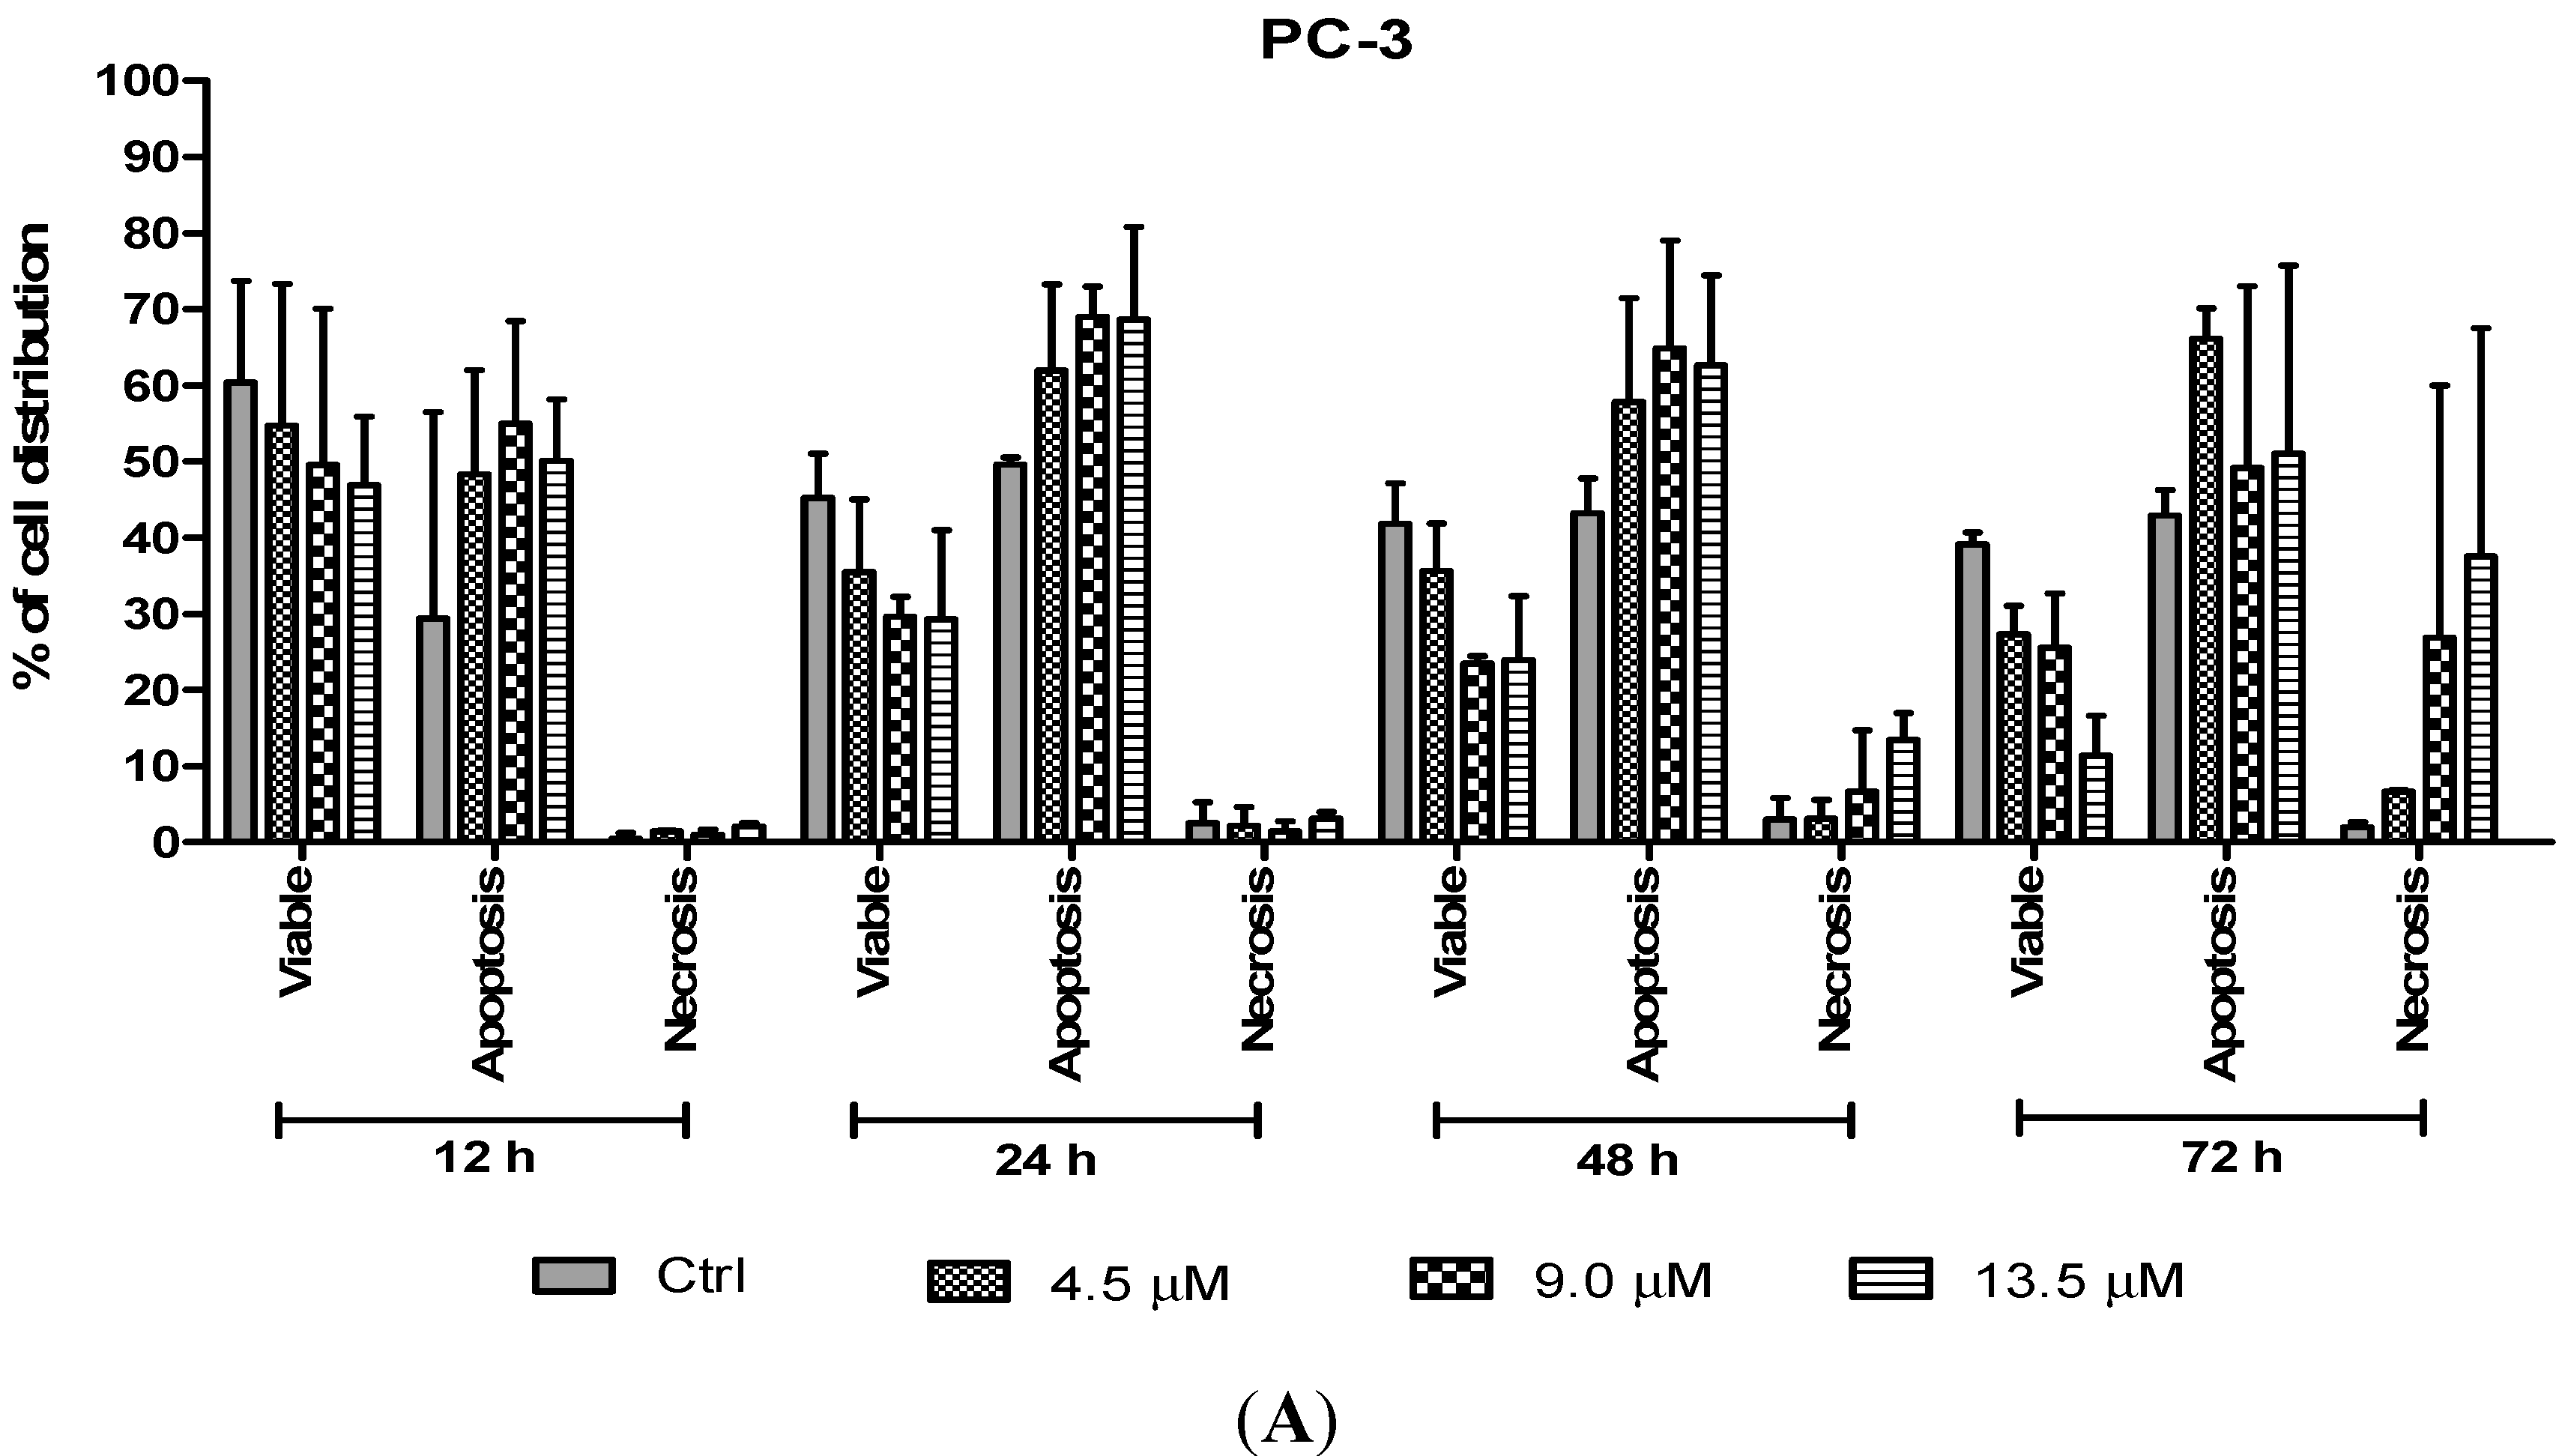
Figure 8, the percentage of viable cells decreased upon exposure to longer incubation times in both cell lines. Between time points, there was an increase of apoptosis in all concentrations compared to the untreated samples (control). The results showed a comparatively higher percentage of cells undergoing apoptosis at 24 and 48 h as treatment doses increase in both cell lines. PC-3 cells treated with doses of 4.5 µM, 9.0 µM and 13.5 µM at 24 and 48 h induced approximately 60%–70% apoptotic cells. Although apoptosis was relatively high at 48 h, necrotic cells were noted to increase at this time point. Treatment with all three doses at 48 and 72 h showed an increase approximately between 5% and 15% of necrotic cells compared to 12 and 24 h with less than 5% of necrotic cells.
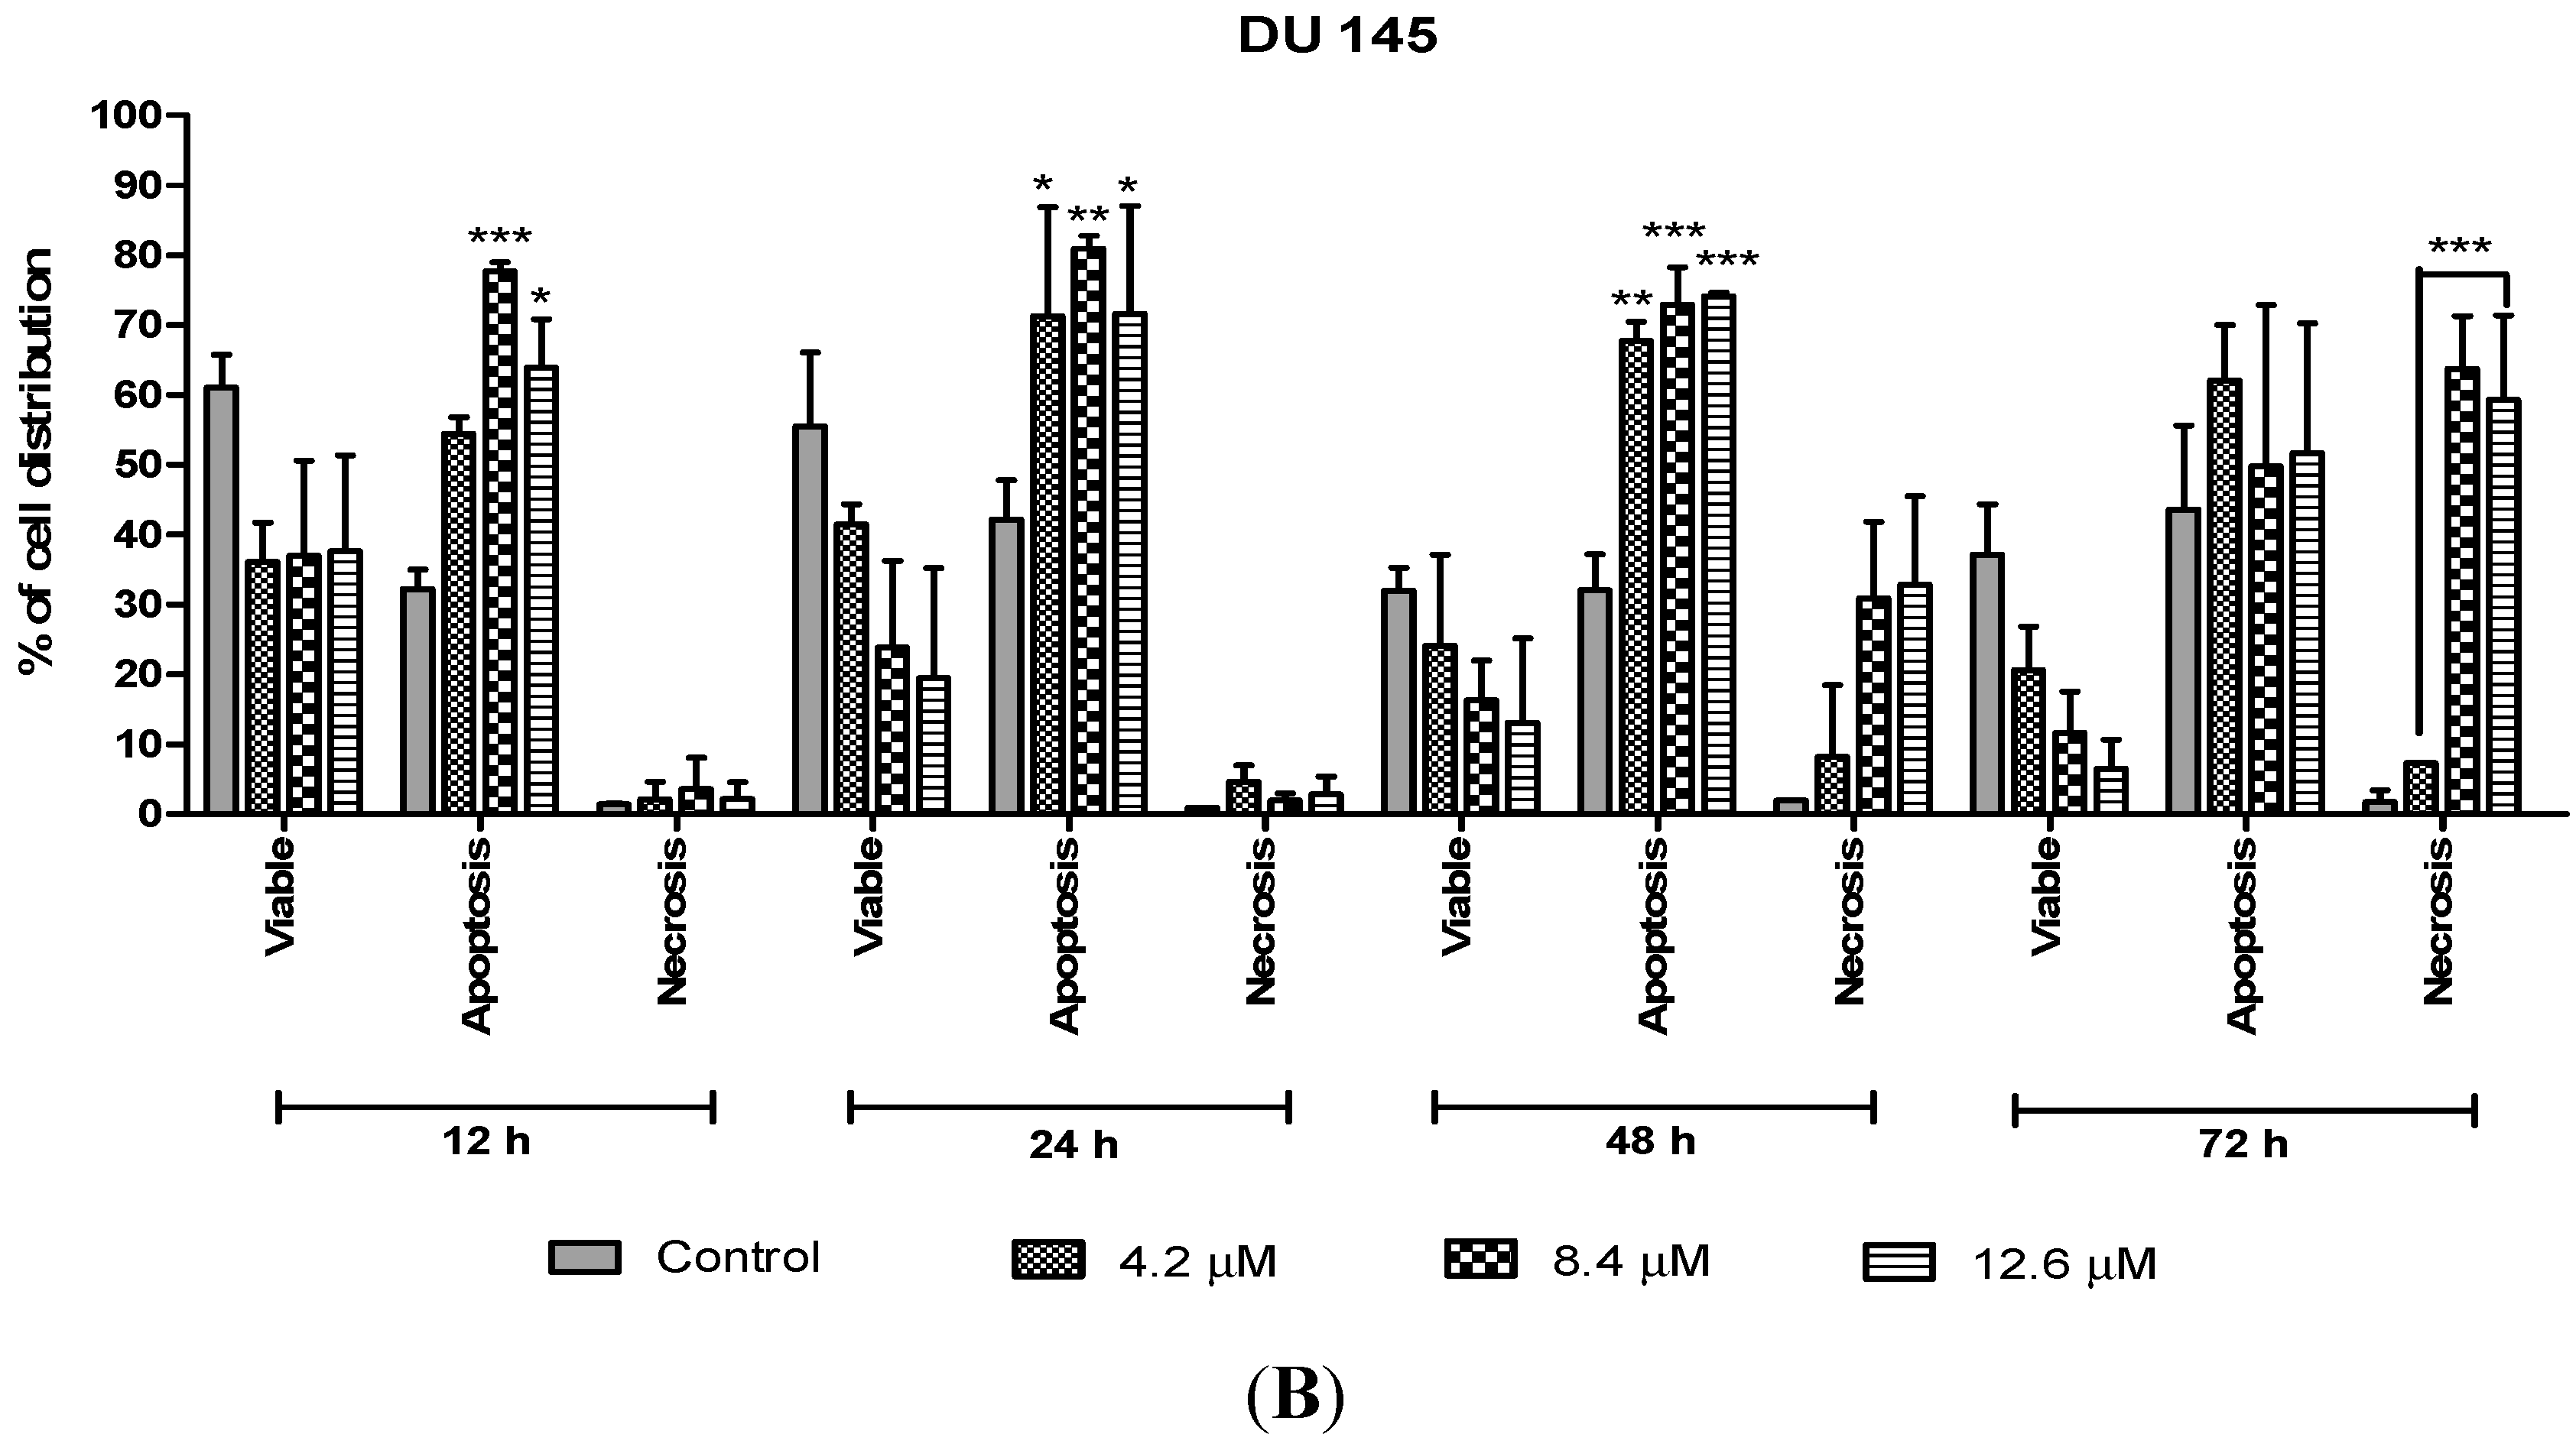
On the other hand, treatment with doses of 4.2, 8.4 and 12.6 µM in DU 145 cells significantly induced approximately 70%–80% apoptotic cells at 24 and 48 h compared to the control cells. However, treatment with a dose of 4.2 µM at 48 h induced approximately 10% necrotic cells to between 30% and 35% necrotic cells at doses of 8.4 µM and 12.6 µM. Strikingly, at 24 h necrotic cells remained low, with approximately lesser than 5% necrotic cells at all examined doses. In summary, MS17 increased apoptosis activity the highest at 24 h after treatment with a low percentage of necrosis. Staining of acridine orange and ethidium bromide in MS17 treated cells provides morphological evidence that MS17 induces apoptosis for both cell lines time and dose-dependently.
Figure 8.
Percentage of cell population in (A) PC-3 cells and (B) DU 145 cells treated with MS17 for 12, 24, 48 and 72 h. Treated and non-treated cells were double stained with AO/EB and a minimum of 200 cells were counted per sample and the percentage of cells from each population (viable, apoptosis and necrosis) was calculated. Samples were run in triplicates and comparable results were obtained from three independent experiments. Comparison between data sets was performed using ANOVA. * p < 0.05, ** p < 0.01 and *** p < 0.001 indicates statistically significant differences between the means of values obtained with treated vs. control.
2.3.3. Quantification of Relative Caspase-3 Activity
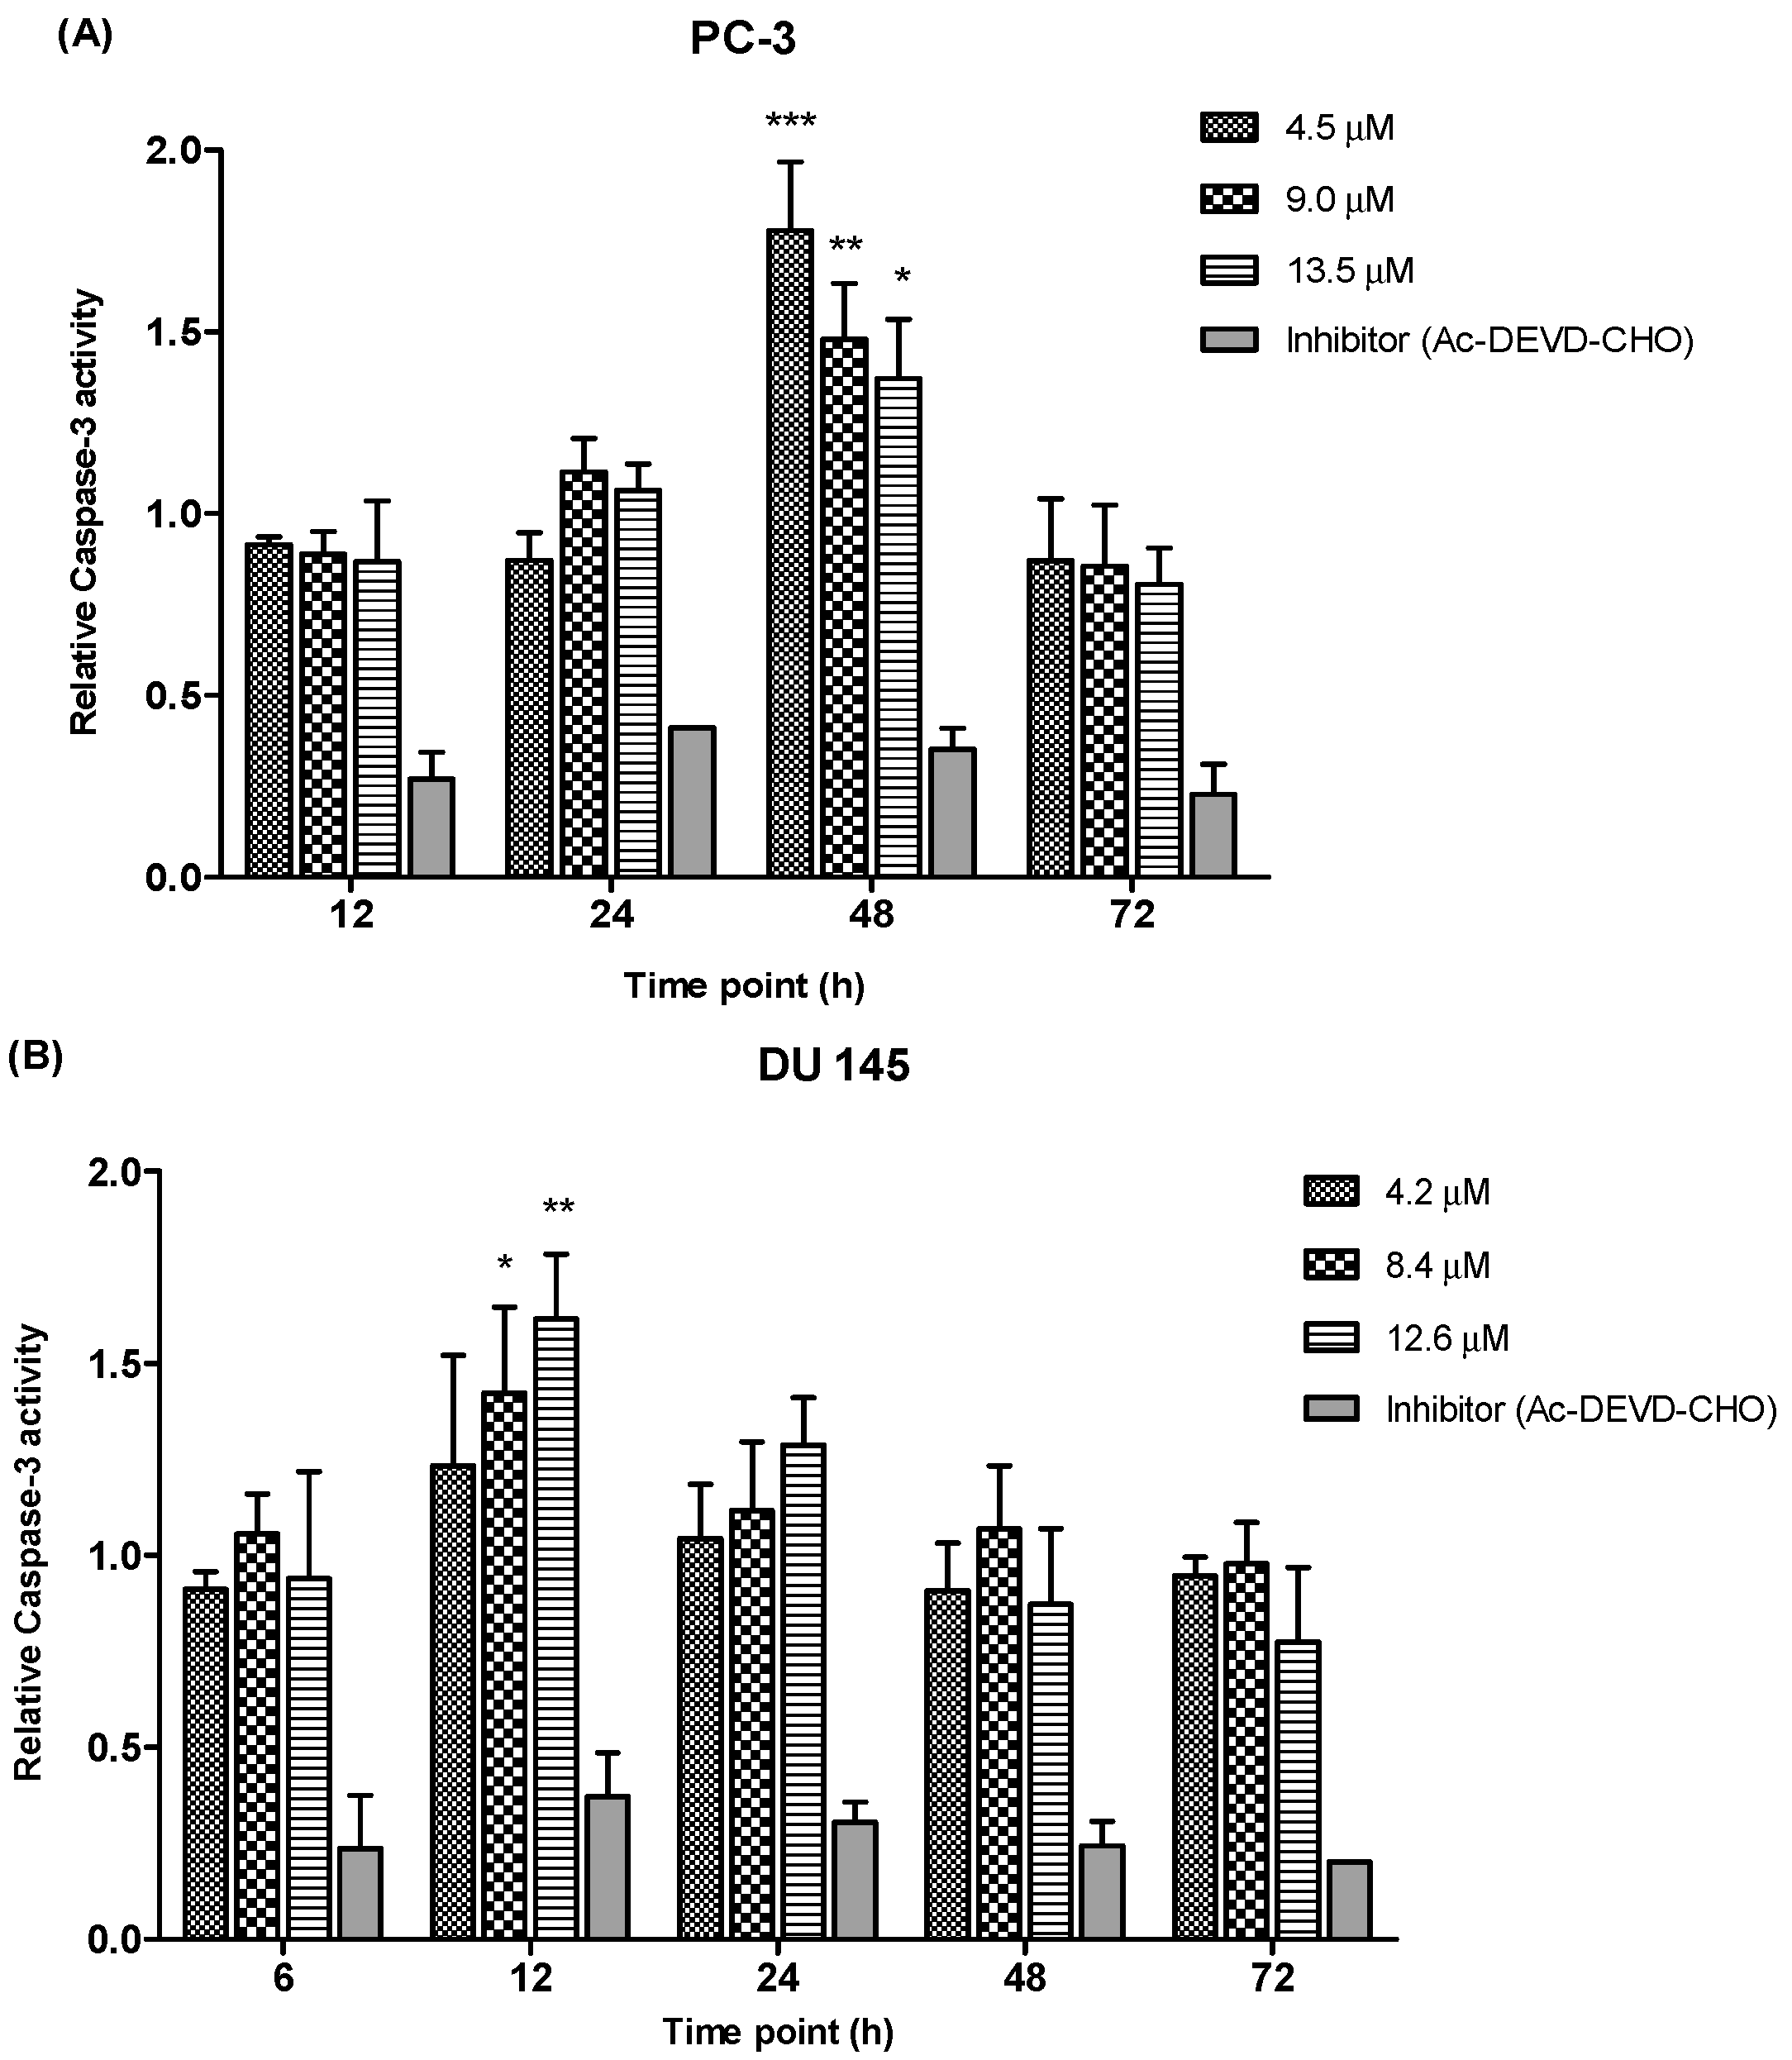
Caspase-3, a member in the family of cysteine proteases is one of the critical enzymes involved in apoptosis. Caspase-3 is synthesized as an inactive pro-enzyme that is responsible for apoptosis execution. Activation of the caspase-3 activity causes cleavage of the key substrate within the cell to execute the apoptotic process which induces DNA fragmentation and morphological changes such as cell blebbing, cell shrinkage, nuclear fragmentation and chromatin condensation. As caspase-3 enzyme are crucial executors in this process, the apoptotic effects of MS17 treated prostate cancer cells were investigated by studying the activity of caspase-3 enzyme.
We determined the relative caspase-3 apoptotic activity in both cell lines at various time points (6, 12, 24, 48 and 72 h as appropriate) and at three different concentrations, the EC
50, 2 × EC
50 and 3 × EC
50 values, which were 4.5 µM, 9.0 µM and 13.5 µM for PC-3 and 4.2 µM, 8.4 µM and 12.6 µM for DU 145 cells. Relative caspase-3 activity was measured based on caspase-3 activity from the treated cells against the untreated cells (control). As shown in
Figure 9, PC-3 cells showed a significant increase of caspase-3 activity at 48 h time point following treatment with 4.5, 9.0 and 13.5 µM of MS17. However, there were no significant differences of caspase-3 activity noted between different concentrations at 12, 24 and 72 h. In DU 145 cells an increase in caspase-3 activity was noted at 12 h after treatment with MS17. Caspase-3 activity was significant at 8.4 and 12.6 µM compared to 4.2 µM. However, there were no significant differences of caspase-3 activity between different concentrations at 6, 24, 48 and 72 h. Treatment with the caspase-3 inhibitor, Ac-DEVD-CHO in both cell lines showed relatively low expression levels at all time points for both cell lines, confirming inhibition of caspase-3 activity.
Figure 9.
Relative caspase-3 activity in (A) PC-3 and (B) DU 145 cells treated with MS17 for 12, 24, 48 and 72 h. Results are expressed as mean ± S.E. from three independent experiments and comparison between data sets was performed using ANOVA. * p < 0.05, ** p < 0.01 and *** p < 0.001 indicates statistically significant differences between the means of values obtained with treated vs. control. Caspase-3 inhibitor, Ac-DEVD-CHO was used as a control to determine the inhibitory activity of caspase-3.
Overall, these results indicate that MS17 induces apoptosis by caspase-3 activity in both cell lines with PC-3 demonstrated a dose-dependent decrease at 48 h while DU 145 displayed a dose-dependent increase at 12 h.
2.3.4. Detection of Free Nucleosomes (ELISA)
To further elucidate the type of cell death, another important biochemical hallmark of apoptosis is the detection of DNA fragments/fragments of genomic DNA (mono- and oligonucleosomes) in the cytoplasm of apoptotic cells. In this study, the induction of apoptosis by the treatment of MS17 was measured through the combination of anti-histone and anti-DNA capture and detection antibodies through the ELISA method. The prostate cancer cell lines were treated with three different concentrations of MS17 and incubated over 24, 48 and 72 h and the presence of free nucleosomes (mono- and oligonucleosomes) in the cytoplasm were measured based on the enrichment factor.
Results (
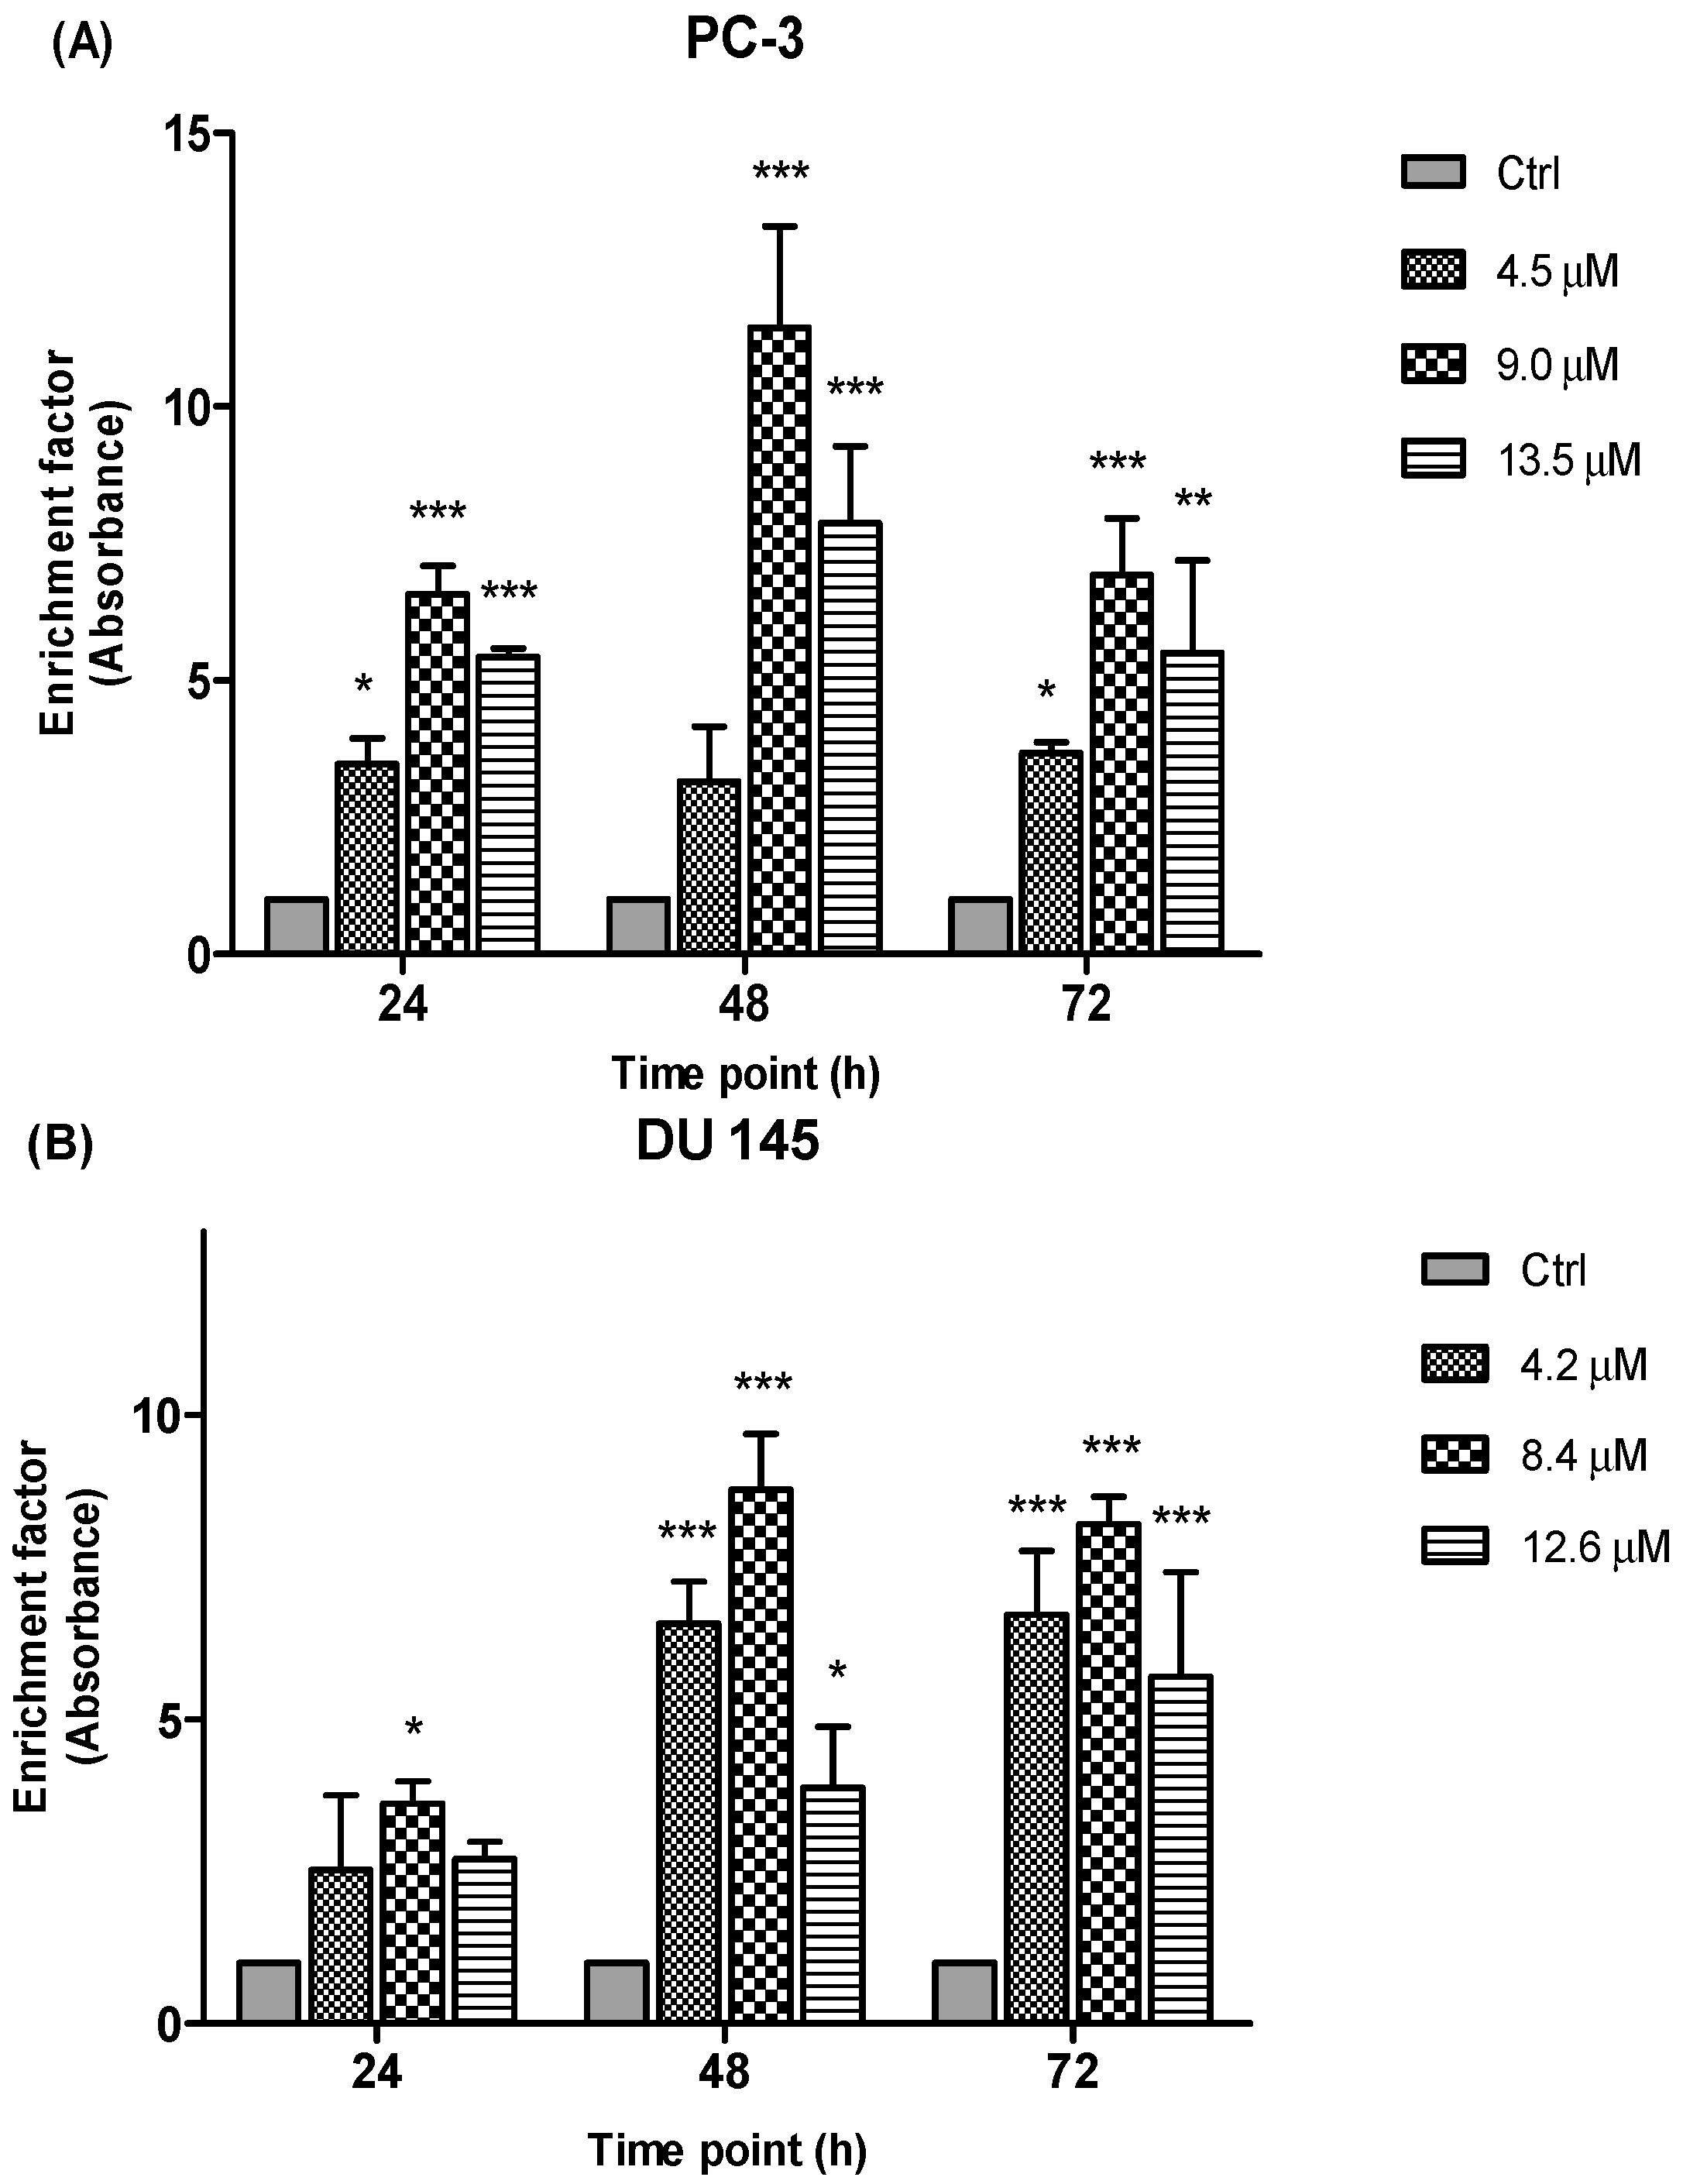
Figure 10) are shown as ratio of absorbance calculated according to the formula introduced in the previous section. The enrichment factor value is an indicative of apoptotic activity for all the concentrations and time points. Following the exposure of PC-3 and DU 145 cells to three different concentrations of MS17 treatment mainly 4.5 µM, 9.0 µM and 13.5 µM for PC-3 and 4.2 µM, 8.4 µM and 12.6 µM for DU 145 cells at 24, 48 and 72 h respectively, apoptotic activity was noted at all examined time points and concentrations of MS17 compared to the corresponding untreated cells (control). As seen in
Figure 10, the results of the PC-3 cells revealed a significant increase in nucleosomal fragments which was measured as an enrichment factor at doses of 9.0 and 13.5 µM for all three time points. However, greater increase in nucleosomes was noted at 48 h with the treatment dose of 9.0 µM. In DU 145 cells, treatment with MS17 at dose of 8.4 µM revealed a significant increase in nucleosomal fragments compared with 4.2 and 12.6 µM at all time points. Interestingly, a greater increase in nucleosomal fragmentation was noted at 48 h compared to the control cells. Hence, these results indicate that MS17 induced apoptotic cell death in PC-3 and DU 145 cells.
Figure 10.
Enrichment of nucleosomes in MS17-treated (A) PC-3 and (B) DU 145 cells at 24, 48 and 72 h incubation. Results are expressed as mean ratio ± S.E. of the absorbance from cells treated with MS17 relative to absorbance of untreated cells and comparison between data sets was performed using ANOVA. * p < 0.05, ** p < 0.01 and *** p < 0.001 indicates statistically significant differences between the means of values obtained with treated vs. control. Samples were run in duplicates and comparable results obtained from two independent experiments.
2.4. Discussion
Curcumin, the multi-target natural product, has extensively been used as a lead compound to design and synthesize analogues for the potential treatment of prostate cancer. This compound has been proven to inhibit many targets in prostate epithelia cells with an importance in cancer formation and progression. However, it has previously been reported that curcumin exhibits poor bioavailability
in vitro and
in vivo [
14]. In light of these efforts, our laboratory has been studying the effectiveness of using selected synthetic diarylpentanoid curcumin analogues as agents for prostate cancer therapy. In this study, we reported the cytotoxic activity of these compounds and the mode of apoptosis induced by a selected compound on the prostate cancer cell lines, mainly PC-3 and DU 145 cells. To the best of our knowledge, this study represents a first report of the cytotoxic and apoptosis activity of these analogues on human androgen-independent prostate cancer cells.
Based on the initial cytotoxicity screening of the diarylpentanoids on the two prostate cancer cells, compound MS17 showed an improved cytotoxicity and growth inhibitory effect in a dose-dependent manner at lower concentrations compared to the parent compound, curcumin. The low EC
50 value (
Table 1) supported the results, indicating that MS17 had the most significant toxicity effect in both cell lines, followed by MS13, MS49, MS40E and lastly curcumin. This result was also supported by the selectivity index value which showed that MS17 is more selective towards cancer cells (
Table 2). However, screening of the compounds on the normal cell lines with comparable doses provided evidence that the normal cell lines are more resistant to the growth suppressive effects of this compound compared to prostate cancer cells, suggesting that it is relatively less toxic to normal cells. A study done by Fajardo and team [
30] reported that the compound MS17, which was labeled as ca27, is able to inhibit the growth of prostate cancer cells at a concentration below that typically used for curcumin. Furthermore, this compound was also found to exert anti-androgenic effect in androgen-dependent prostate cancer cells. However, its effect on androgen-independent prostate cancer cells was not evaluated. It is believed that certain modification to the analogue structure from its parent compound has resulted in a better cytotoxicity activity. Introduction of suitable alkoxy groups and modification of the length of the linker between the biphenyl rings were shown to have greater growth suppressive potential, compared to curcumin [
37].
Dose and time-dependent cytotoxicity of the compounds on the prostate cancer cell lines were also observed. An anti-proliferative study revealed a time-dependent growth inhibitory effect of all compounds. The anti-proliferative study was measured based on the incorporation of BrdU into the DNA of the proliferating cancer cells during the S phase of the cell cycle [
38]. As shown in the results (
Figure 4 and
Figure 5), an increase in the exposure time to the compounds appeared to have a significant anti-proliferative effect in both the cell lines. Furthermore, treatment with MS17 demonstrated greater anti-proliferative effect at all three time points compared to the other compounds and curcumin in both cell lines. This observation could be due to the characteristic of the cell lines. Although both cell lines are metastatic form of prostate cancer cells, DU 145 cells which expresses a mutated p53 protein is relatively more resistant to treatment compared to PC-3 cells which harbors a wild-type p53 protein. However, both dose and time-dependent assays showed selectivity for greater growth inhibitory effect in both cells lines were more significant through the treatment of MS17.
Induction of apoptosis, a programmed cell death, has been identified as the primary strategy in cancer chemotherapy and a gold standard for an anti-cancer candidate [
39]. In order to investigate whether the cytotoxic effect and inhibition of cell growth were related with the apoptotic event, the effect of the compounds on apoptosis induction were studied via various morphological and biochemical methods. However, for a more comprehensive analysis, only MS17 was selected from the other compounds for further analysis on the apoptosis assays using three concentrations, EC
50, 2 × EC
50 and 3 × EC
50 values. Apoptosis results revealed that MS17 could be mediating cell death through apoptosis.
Apoptotic cells were first recognized through the characteristic changes in their morphology, particularly changes in their nuclei. Fluorescence microscopy analysis on MS17-treated cells double stained with acridine orange (AO) and ethidium bromide (EB) provided morphological evidence that MS17 induced apoptosis in both cell lines. The fluorescence microscopy analysis revealed the early stages of apoptosis which are characterized by the shrinkage of cells, blistering and membrane blebbing [
40,
41]. As shown in the time and dose-dependent treatment, both cell lines triggered nearly 50% apoptosis after 24 h in all doses of MS17 treatment. DU 145 cells stained bright green to yellow between 12 and 24 h compared to PC-3 cells between 24 and 48 h. The increase in the percentage of cells stained bright orange-red at 72 h treatment of both cell lines, identified by nucleus staining with EB may correspond partly to the appearance of necrotic cells where the plasma membrane becomes permeable. Overall, MS17 has the capability to induce apoptosis, evident by the morphological changes in DU 145 and PC-3 cells, dose and time-dependently.
The ability of MS17 to induce apoptosis is also supported by measuring the activation of caspase-3 and detection of nucleosomal fragments in both the cell lines. A primary biochemical event marking the start of apoptosis is the activation of caspases. Caspase-3 is one of the critical enzymes involved in apoptosis. It is involved in the activation cascade of caspases responsible for apoptosis execution. Caspase-3 functions as an executioner caspase that cleaves various substrates including PARP. It is observed that, activation of caspase-3 in both cell lines at specific doses and time point correlated with the early morphological signs of apoptosis. In DU 145 cells relative caspase-3 activity resulted in a dose-dependent increase at 12 h after treatment and reduced thereafter. However, in PC-3 cells caspase-3 activity increased significantly at 48 h after treatment and declined gradually at 72 h, thus validating the results from the fluorescence microscopic quantification analysis. Collectively, it is suggested that the cell death episode in both the cancer cells could be partly mediated through the activation of caspase-3, the promoter of apoptosis.
Besides, detection of nucleosomal fragments as a result of DNA degradation has also been widely used as a hallmark of apoptosis processes [
42]. Nuclear fragmentation was measured based on the enrichment of nucleosomes (mono- or oligonucleosomes) in cytoplasm of apoptotic cells. In the present study, enrichment of nucleosomes was detected highest at 48 h after MS17-treatment in both cell lines, which correlates with the morphological signs of apoptosis process. There is a body of evidence that suggest nucleosomal fragments in apoptotic cells are associated with the activation of caspase-3 activity. In the event when caspase-3 is activated, caspase-3 cleaves the cytoskeletal proteins and stimulates the caspase-activated DNase which eventually enters the nucleus and degrades DNA leading to the death of the cell [
43]. Hence, taken together, these results verify a preferential apoptotic process than necrotic effect of MS17 on PC-3 and DU 145 cells.
Overall, MS17 revealed a significant dose-dependent and time-dependent effect in inducing growth inhibition in PC-3 and DU 145 cells. Based on the apoptosis data it is evident that MS17 mediates cell death through apoptosis in both the prostate cancer cell lines. Apoptosis induction is a highly desirable characteristic of treatment strategy for cancer control as it opens a new strategy in the search of anti-cancer drugs. Hence, it is of an importance that in a tested compound, apoptosis is induced rather than necrosis as a cell death module.


 and
and 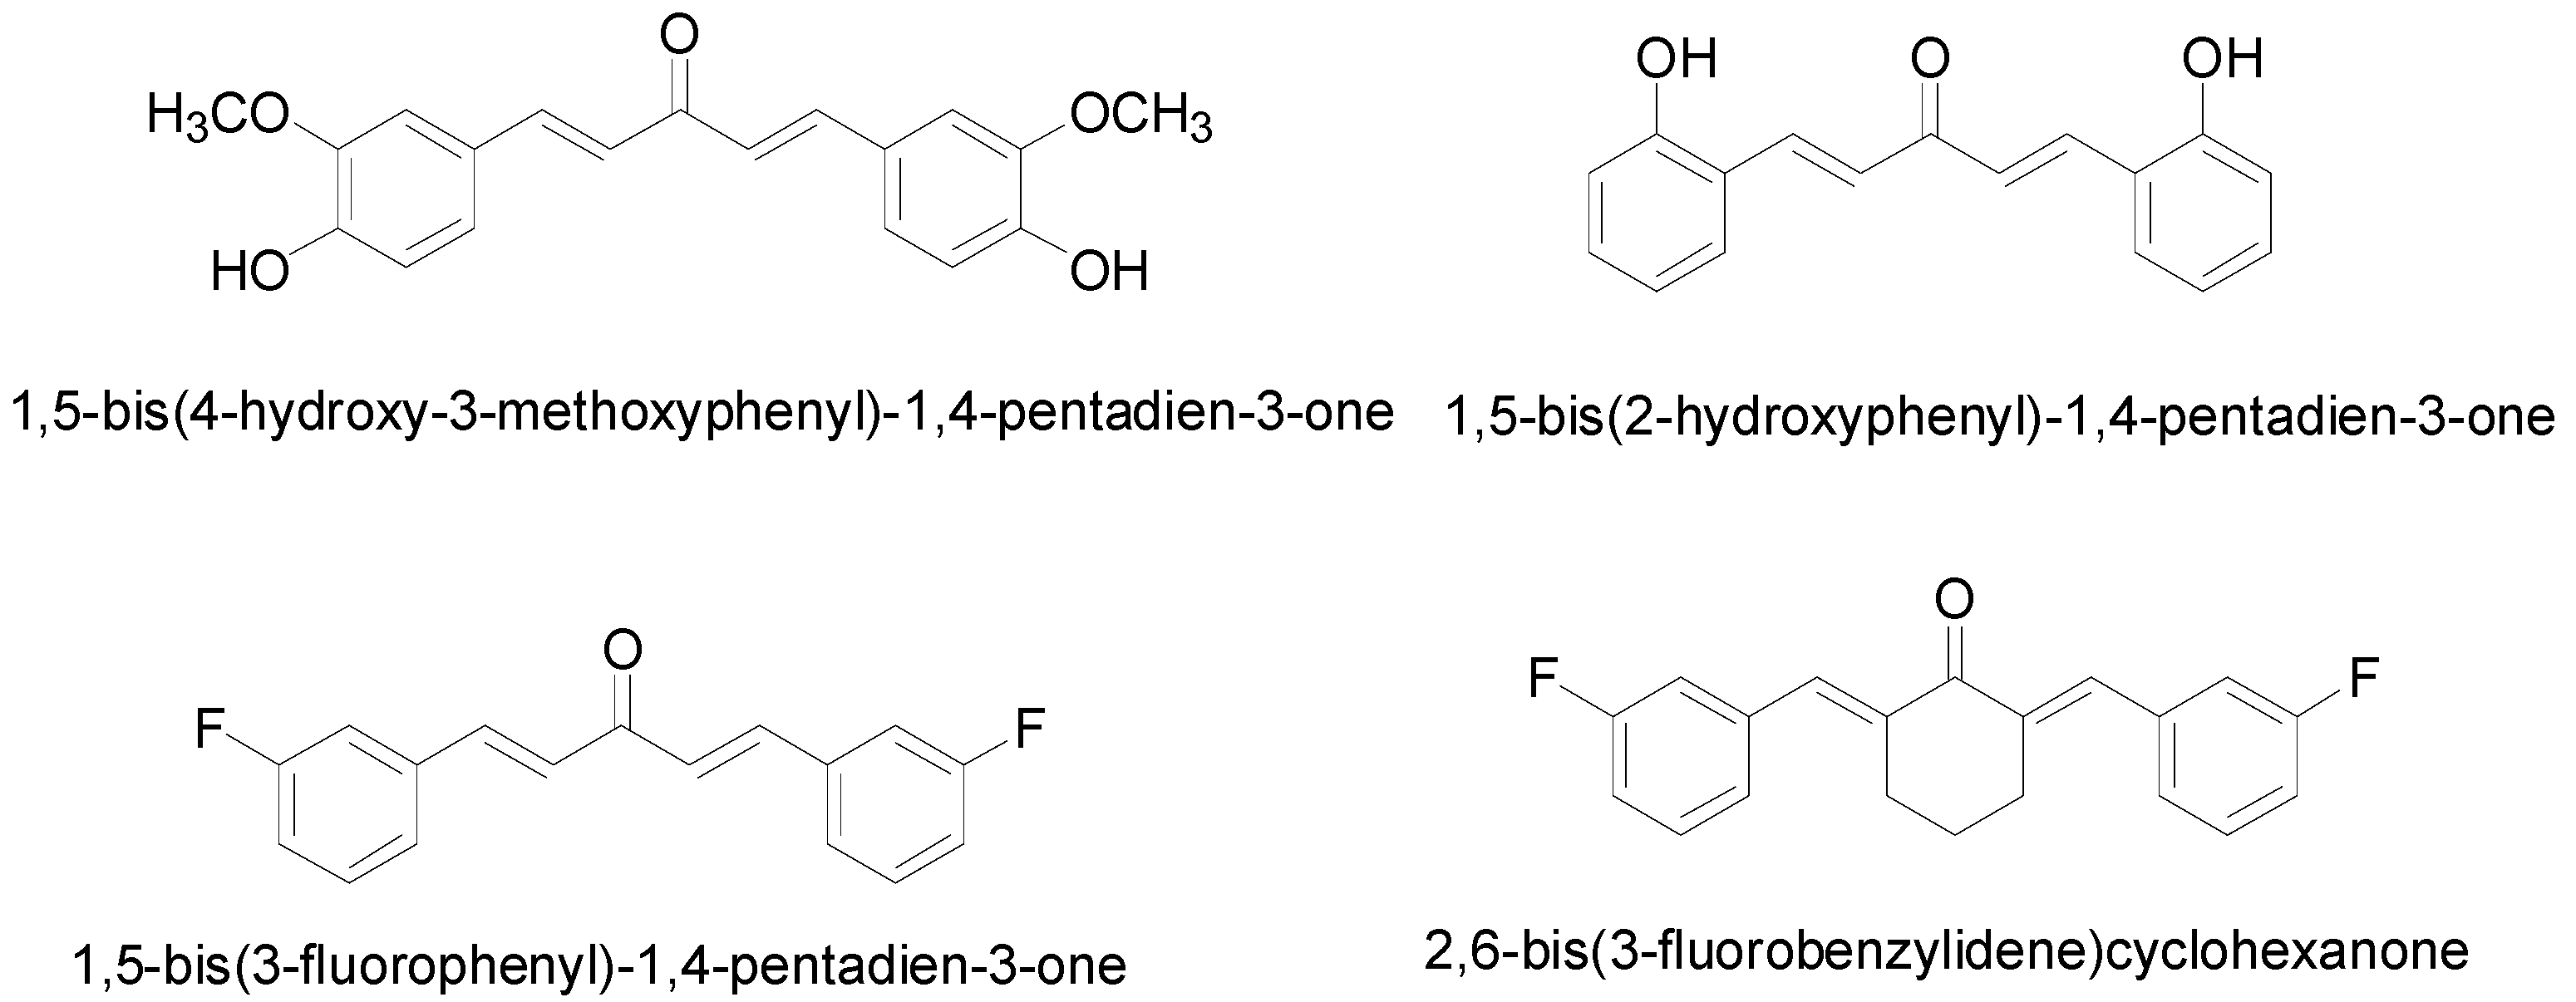
