Monoterpenoid Indole Alkaloids from Alstonia rupestris with Cytotoxic, Anti-Inflammatory and Antifungal Activities

Abstract
:
1. Introduction
2. Results and Discussion

| No. | 1 | 2 | 3 | 4 | 5 | 6 | 7 |
|---|---|---|---|---|---|---|---|
| 2 | 107.5 | 105.6 | 107.0 | 103.5 | 104.9 | 102.0 | 186.7 |
| 3 | 85.4 | 85.1 | 85.3 | 51.9 | 51.1 | 70.6 | 50.8 |
| 5 | 86.1 | 85.6 | 85.9 | 105.4 | 106.9 | 63.5 | 89.7 |
| 6 | 42.5 | 44.4 | 42.9 | 42.8 | 40.9 | 42.5 | 43.6 |
| 7 | 55.1 | 53.1 | 55.5 | 52.3 | 52.4 | 62.4 | 53.2 |
| 8 | 131.5 | 131.6 | 133.1 | 138.0 | 136.8 | 131.3 | 142.4 |
| 9 | 126.0 | 126.0 | 126.1 | 122.7 | 123.4 | 121.6 | 121.6 |
| 10 | 121.5 | 122.1 | 121.9 | 119.9 | 120.0 | 127.5 | 124.9 |
| 11 | 128.9 | 128.6 | 128.9 | 128.1 | 128.5 | 130.6 | 125.4 |
| 12 | 110.7 | 110.4 | 110.3 | 109.1 | 110.2 | 112.5 | 120.8 |
| 13 | 147.9 | 148.3 | 147.8 | 144.6 | 145.9 | 148.7 | 156.1 |
| 14 | 25.0 | 28.5 | 23.6 | 26.2 | 27.0 | 34.2 | 35.8 |
| 15 | 34.1 | 33.5 | 37.3 | 27.7 | 28.3 | 34.2 | 33.4 |
| 16 | 65.6 | 54.4 | 55.0 | 52.8 | 52.1 | 65.6 | 58.8 |
| 17 | 197.4 | 65.9 | 66.2 | - | - | 194.5 | 63.0 |
| 18 | 13.4 | 13.7 | 13.6 | 12.8 | 12.9 | 15.1 | 13.5 |
| 19 | 120.7 | 119.7 | 119.8 | 58.4 | 58.5 | 133.2 | 127.8 |
| 20 | 130.5 | 131.3 | 131.3 | 61.5 | 61.6 | 129.9 | 137.7 |
| 21 | 47.9 | 48.1 | 48.2 | 44.7 | 44.5 | 66.6 | 50.5 |
| CO2CH3 | 168.0 | 169.3 | 169.4 | 172.1 | 172.6 | 171.9 | 169.1 |
| CO2CH3 | 52.7 | 51.5 | 51.7 | 51.8 | 51.6 | 53.9 | 51.4 |
| N1-CH3 | - | - | - | - | - | 50.5 | - |
| OCH3 | 48.6 | 48.5 | 48.4 | 54.8 | 57.0 | - | 54.7 |
| COCH3 | - | - | 171.3 | - | - | - | - |
| COCH3 | - | - | 20.1 | - | - | - | - |
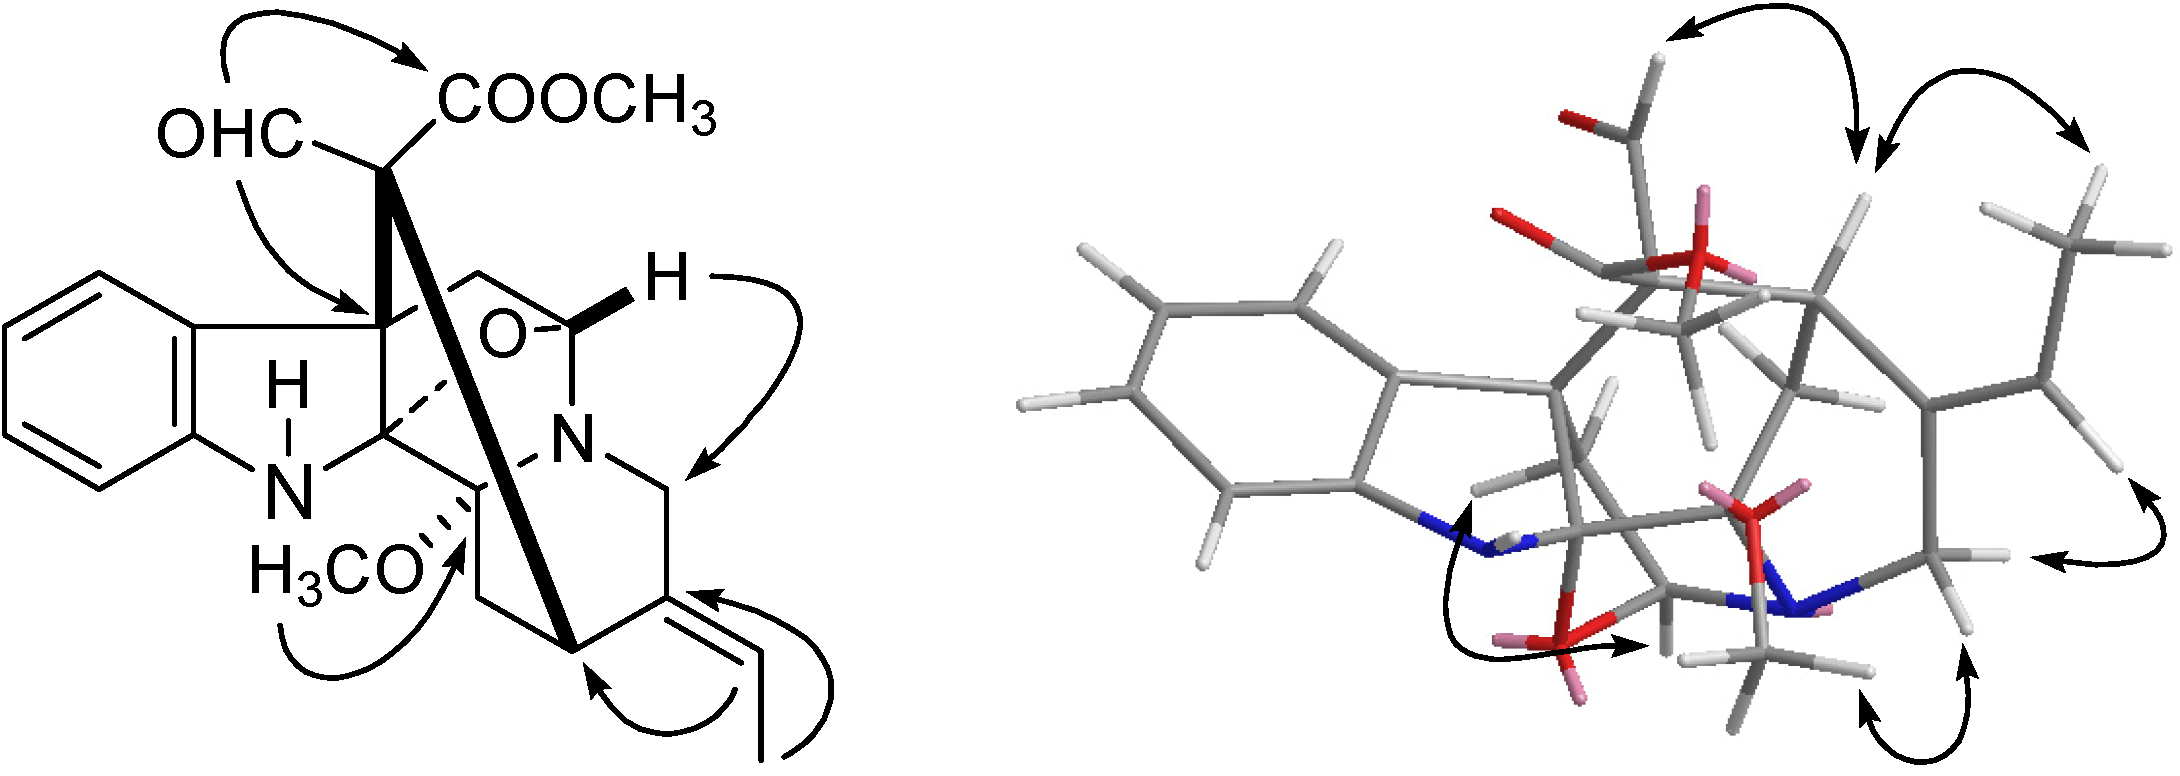
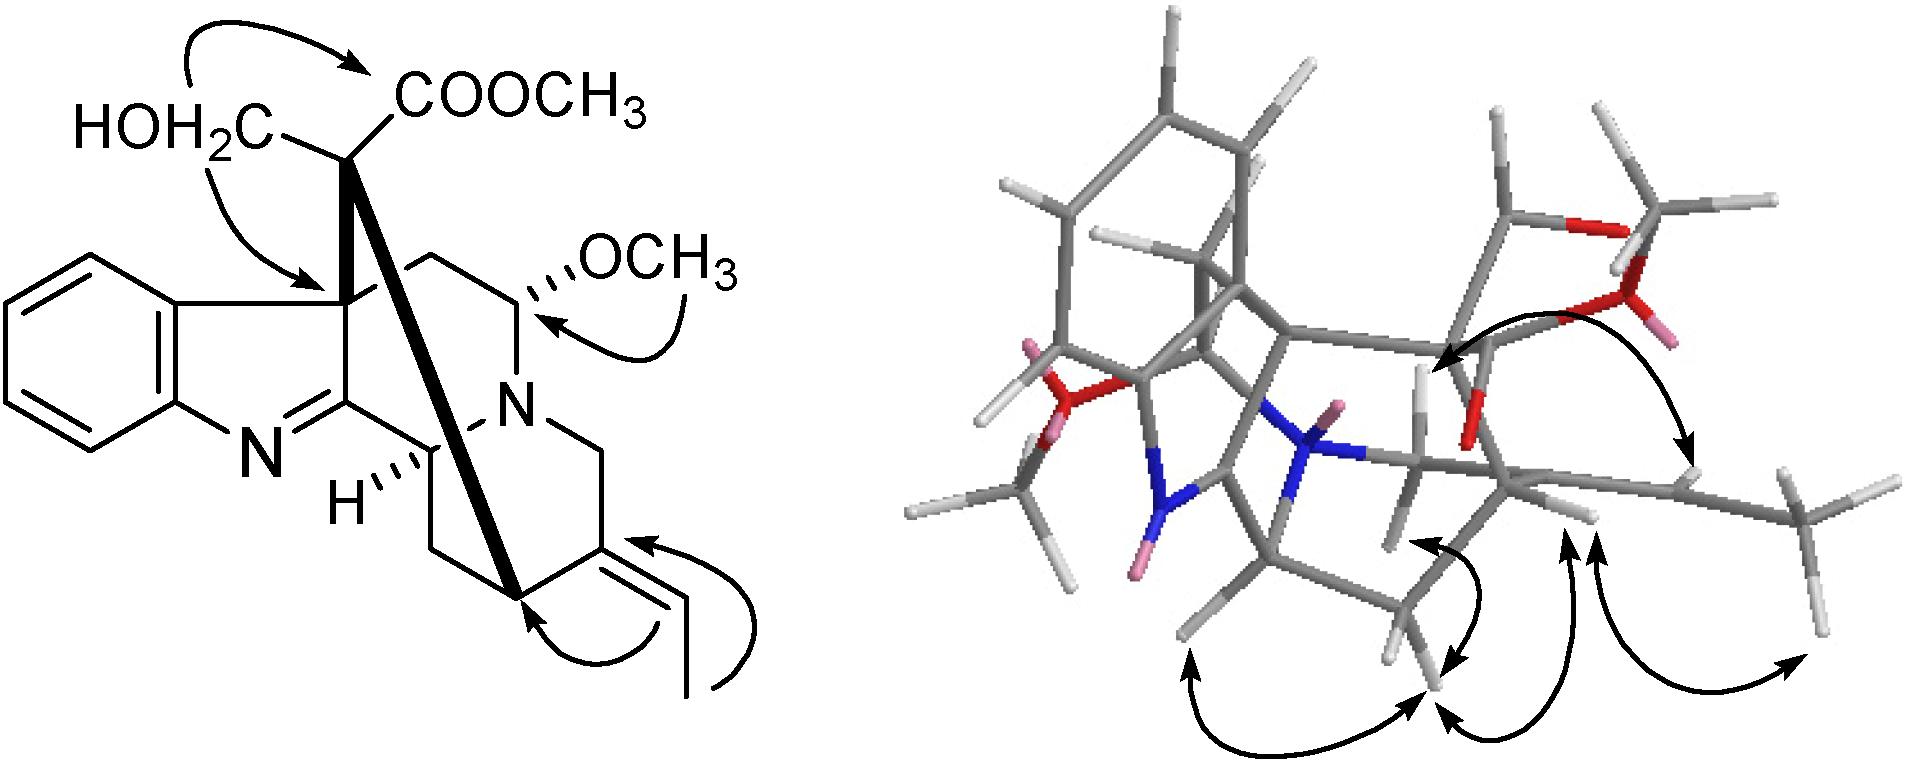
 ) and NOESY (
  ) correlations of of compound 1.
 ) and NOESY ( ) correlations of of compound 4.
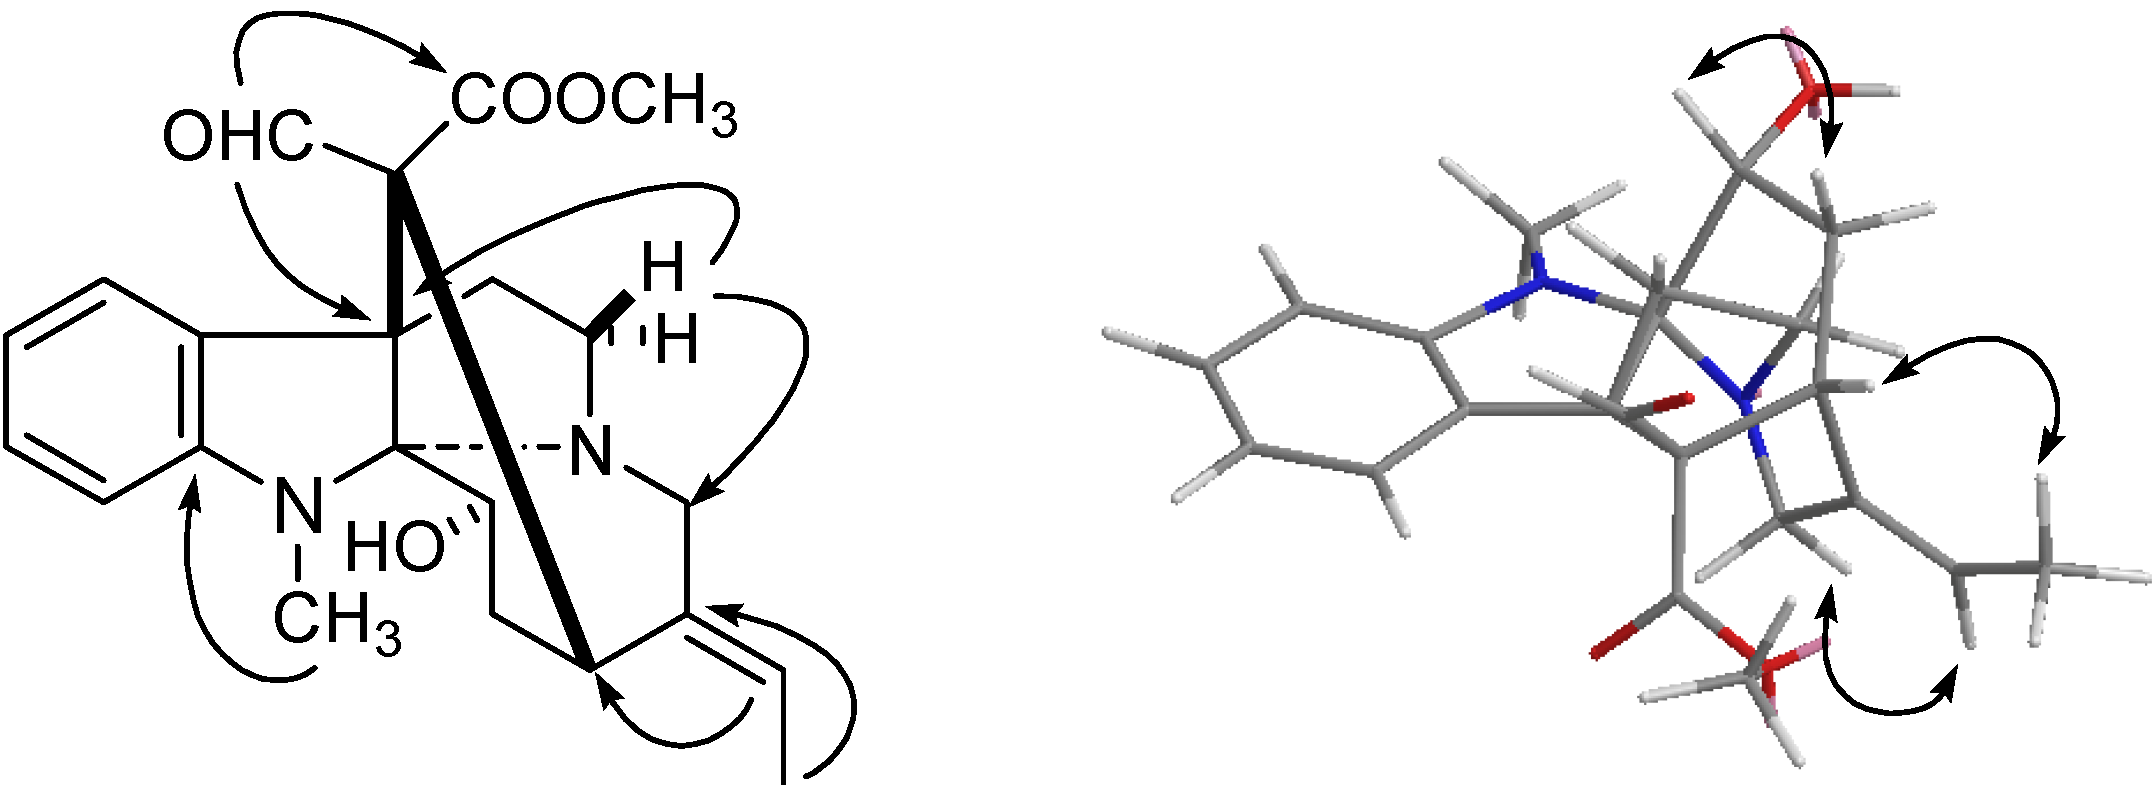
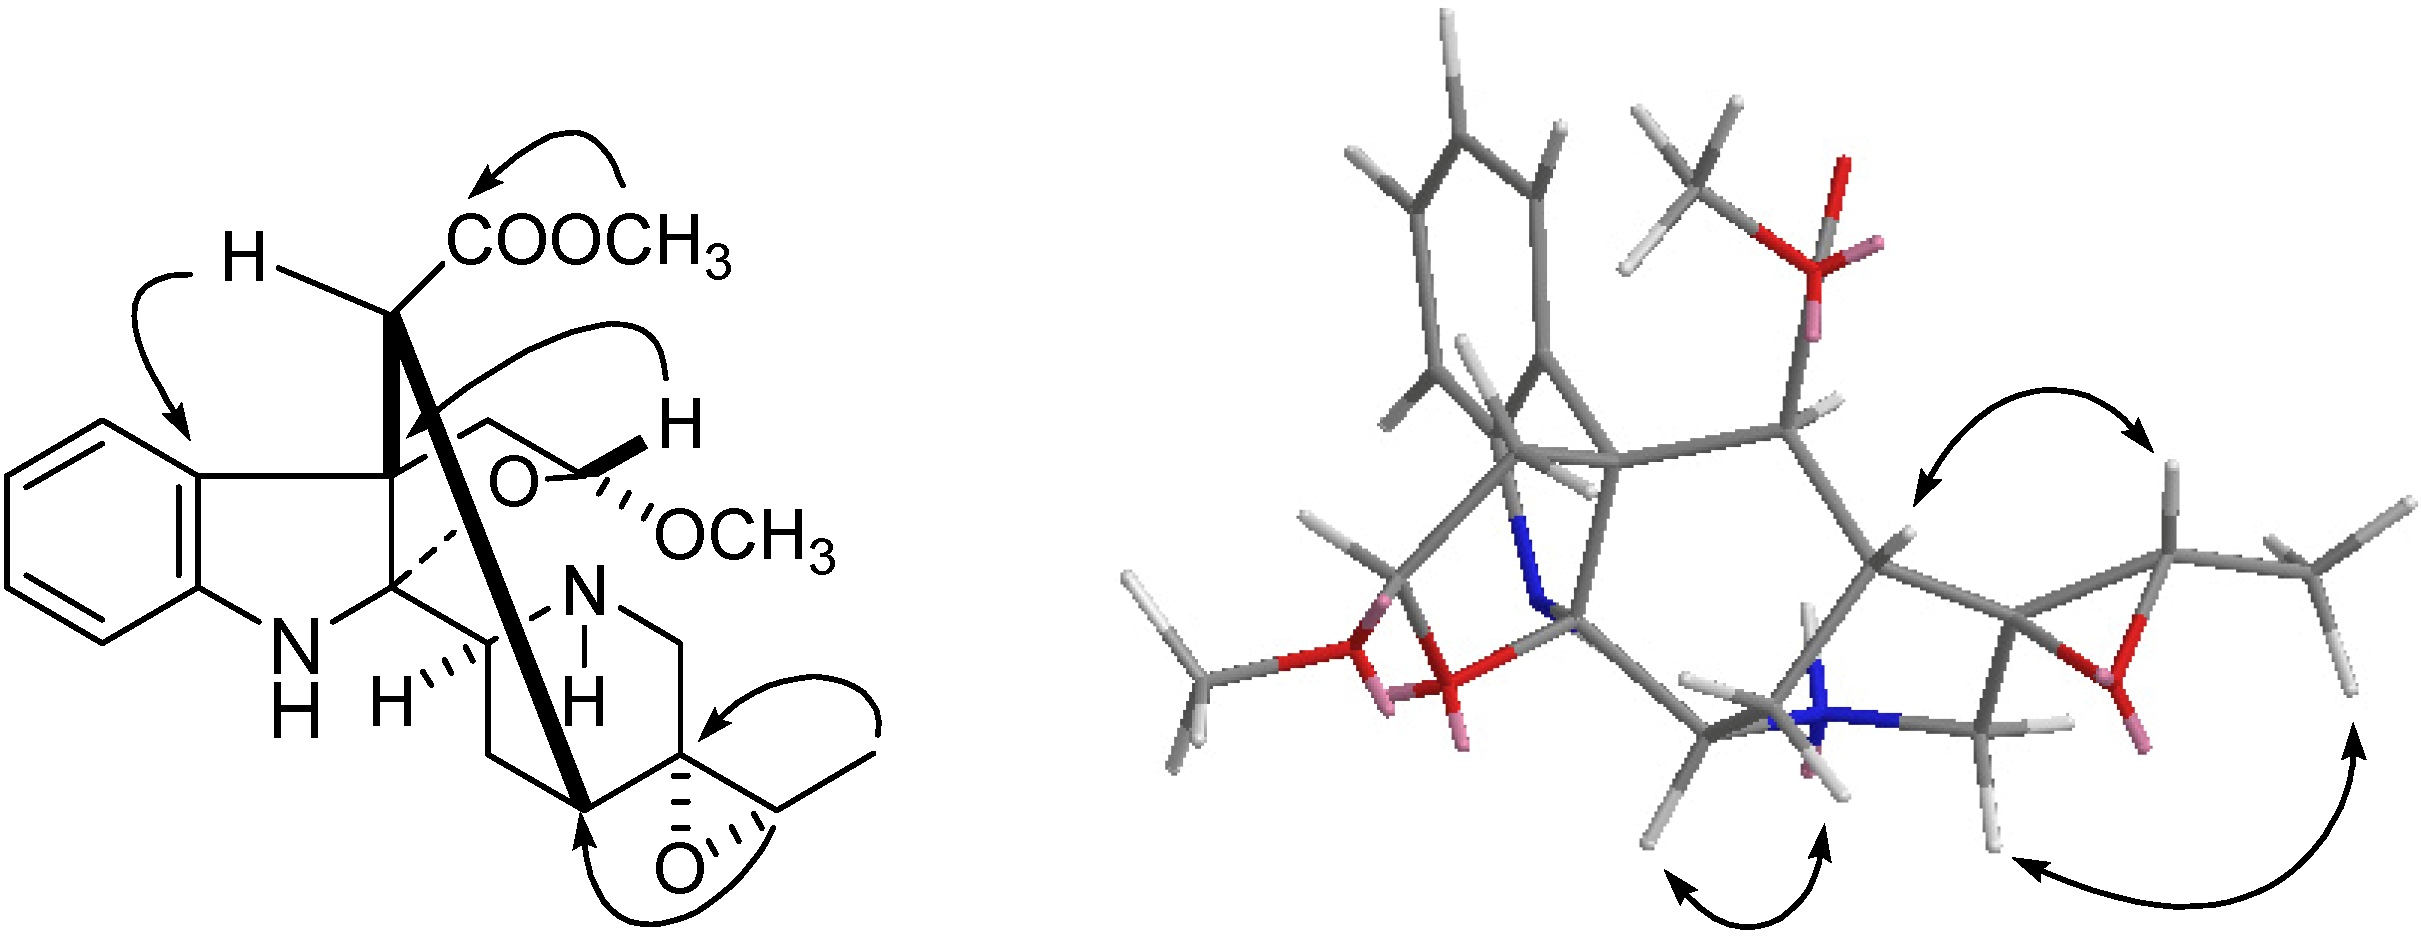 ) and NOESY ( ) correlations of of compound 6.
 ) and NOESY ( ) correlations of of compound 7.
| Compound | Cell lines | ||||||
|---|---|---|---|---|---|---|---|
| A-549 | BGC-823 | HepG2 | HL-60 | MCF-7 | SMMC-7721 | W480 | |
| 1 | 10.3 | 11.3 | 9.2 | 12.0 | 10.7 | 23.7 | 28.0 |
| 2 | 52.7 | 61.8 | 49.0 | 59.4 | 54.3 | 59.7 | 59.5 |
| 3 | 44.1 | 40.8 | 30.4 | 39.6 | 36.8 | 47.0 | 40.1 |
| 4 | - | - | - | - | - | - | 94.9 |
| 5 | 97.4 | - | - | - | - | 92.1 | - |
| 6 | 13.0 | 12.9 | 10.8 | 12.3 | 11.3 | 24.9 | 29.9 |
| 7 | 49.1 | 53.2 | 43.6 | 48.2 | 46.7 | 49.4 | 52.7 |
| 8 | 47.8 | 51.5 | 44.8 | 50.7 | 48.9 | 53.2 | 51.4 |
| 9 | 61.3 | 67.1 | 58.3 | 71.8 | 64.2 | 66.2 | 62.1 |
| 10 | 16.1 | 15.7 | 14.8 | 17.2 | 14.7 | 31.2 | 35.5 |
| Doxorubicin | 18.3 | 14.7 | 22.0 | 31.7 | 24.9 | 35.4 | 15.9 |
| Compound | COX-1 | COX-2 |
|---|---|---|
| 1 | 45.2 | 96.4 |
| 2 | <0 | 14.9 |
| 3 | 12.9 | 50.4 |
| 4 | <0 | 21.1 |
| 5 | <0 | 24.3 |
| 6 | 36.9 | 95.5 |
| 7 | <0 | 17.6 |
| 8 | <0 | <0 |
| 9 | 13.6 | 46.8 |
| 10 | 38.5 | 92.0 |
| SC-560 | 63.2 | |
| NS-398 | 97.1 |
| Compound | G. pulicaris | A. alternata | C. nicotianae | P. capsici. | G. amomi |
|---|---|---|---|---|---|
| 1 | 20/0.69 | - | 19/0.64 | - | - |
| 2 | 18/1.37 | - | 17/1.44 | - | - |
| 3 | 15/1.91 | - | 16/1.80 | - | - |
| 4 | - | - | - | - | - |
| 5 | - | - | - | - | - |
| 6 | - | - | - | - | - |
| 7 | - | - | - | - | - |
| 8 | 15/1.71 | - | 17/1.55 | - | - |
| 9 | - | - | - | - | - |
| 10 | - | - | - | - | - |
| Nystatin | 21/0.007 | 19/0.006 | 19/0.006 | 20/0.010 | 19/0.009 |
3. Experimental
3.1. General
3.2. Plant Material
3.3. Extraction and Isolation
| No. | 1 | 2 | 3 | 4 | 5 | 6 | 7 |
|---|---|---|---|---|---|---|---|
| N1-H | 4.96 (s) | 4.98 (s) | 5.00 (s) | 5.04 (s) | 4.43 (s) | - | - |
| 3 | - | - | - | 3.96 (m) | 3.36 (m) | 4.73 (dd, 14.0,4.0) | 4.48 (dd, 14.0,4.0) |
| 5α | - | - | - | - | - | 2.18 (m) | - |
| 5β | 4.88 (dd, 4.2,3.6) | 4.86 (d, 5.2) | 4.92 (dd, 4.0,3.6) | 5.28 (dd, 4.0,3.8) | 4.92 (dd, 7.2,5.6) | 2.32 (m) | 3.84 (dd, 4.0,3.8) |
| 6α | 2.25 (dd, 13.6,4.2) | 2.26 (d, 13.8) | 2.29 (d, 14.0) | 2.75 (dd, 14.0,4.0) | 2.76 (dd, 14.4,5.6) | 2.06 (m) | 2.20 (dd, 14.0,4.0) |
| 6β | 3.41 (dd, 13.6,3.6) | 3.48 (dd, 13.8,5.2) | 3.52 (dd, 14.0,5.2) | 3.08 (dd, 14.0,3.8) | 3.10 (dd, 14.4,7.2) | 2.33 (m) | 3.75 (dd, 14.0,3.8) |
| 9 | 7.31 (dd, 7.8,1.8) | 7.72 (dd, 8.2,2.0) | 7.76 (dd, 7.8,2.0) | 7.12 (dd, 8.2,1.8) | 7.14 (dd, 8.0,2.0) | 7.76 (dd, 7.8,2.0) | 7.79 (dd, 8.0,2.0) |
| 10 | 6.84 (dt, 7.8,1.8) | 6.70 (dt, 8.2,2.0) | 6.82 (dt, 7.8,2.0) | 6.78 (dt, 8.2,1.8) | 6.77 (dt, 8.0,2.0) | 6.92 (dt, 7.8,2.0) | 7.39 (dt, 8.0,2.0) |
| 11 | 7.08 (dt, 7.8,1.8) | 6.98 (dt, 8.2,2.0) | 7.14 (dt, 7.8,2.0) | 7.06 (dt, 8.2,1.8) | 7.10 (dt, 8.0,2.0) | 7.24 (dt, 7.8,2.0) | 7.14 (dt, 8.0,2.0) |
| 12 | 6.68 (dd, 7.8,1.8) | 6.66 (dd, 8.2,2.0) | 6.78 (dd, 7.8,2.0) | 6.56 (dd, 8.2,1.8) | 6.66 (dd, 8.0,2.0) | 6.79 (dd, 7.8,2.0) | 7.32 (dd, 8.0,2.0) |
| 14α | 2.26 (dd, 14.0,3.8) | 2.30 (dd, 14.0,3.8) | 2.33 (dd, 13.8,3.8) | 2.23 (m) | 2.25 (m) | 2.27 (m) | 2.88 (m) |
| 14β | 2.18 (dd, 14.0,4.0) | 2.27 (dd, 14.0,4.0) | 2.29 (dd, 13.8,4.0) | 1.91 (m) | 1.93 (m) | 2.24 (m) | 1.96 (m) |
| 15 | 3.63 (dd, 4.0,3.8) | 3.69 (dd, 4.0,3.8) | 3.72 (dd, 4.0,3.8) | 2.95 (dd, 4.0,3.8) | 2.97 (dd, 4.0,3.8) | 3.62 (dd, 4.0,3.8) | 3.66 (dd, 4.0,3.8) |
| 16 | - | - | - | 2.92 (d, 4.8) | 2.59 (d, 4.2) | - | - |
| 17a | 8.52 (s) | 3.32 (d, 13.8) | 3.87 (d, 13.6) | - | - | 8.55 (s) | 3.68 (d, 13.2) |
| 17b | - | 3.46 (d, 13.8) | 4.01 (d, 13.6) | - | - | - | 3.91 (d, 13.2) |
| 18 | 1.51 (d, 7.0) | 1.55 (d, 7.2) | 1.58 (d, 7.0) | 1.40 (d, 7.0) | 1.41 (d, 6.8) | 1.83 (d, 7.2) | 1.55(d, 7.0) |
| 19 | 5.47 (q, 7.0) | 5.48 (q, 7.2) | 5.50 (q, 7.0) | 2.93 (q, 7.0) | 2.95 (q, 6.8) | 5.86 (d, 7.2) | 5.54(d, 7.0) |
| 21α | 3.85 (d, 13.8) | 3.87 (d, 14.2) | 3.89 (d, 13.8) | 3.36 (d, 14.0) | 3.39 (d, 14.0) | 3.88 (d, 13.8) | 4.07 (d, 13.6) |
| 21β | 3.31 (d, 13.8) | 3.33 (d, 14.2) | 3.35 (d, 13.8) | 3.08 (d, 14.0) | 3.11 (d, 14.0) | 3.35 (d, 13.8) | 3.08 (d, 13.6) |
| CO2CH3 | 3.69 (s) | 3.78 (s) | 3.82 (s) | 3.70 (s) | 3.67 (s) | 3.80 (s) | 3.71 (s) |
| N1-CH3 | - | - | - | - | 2.03 (s) | - | |
| OCH3 | 3.50 (s) | 3.52 (s) | 3.53 (s) | 3.10 (s) | 3.41 (s) | - | 3.25 (s) |
| COCH3 | - | - | 1.53 (s) | - | - | - |
3.4. Cytotoxicity Assay in Vitro
3.5. Anti-Inflammatory Assay in Vitro
3.6. Antifungal Activity Bioassay
4. Conclusions
Conflicts of Interest
References
- Narine, L.L.; Maxwell, A.R. Monoterpenoid indole alkaloids from Palicourea crocea. Phytochem. Lett. 2009, 2, 34–36. [Google Scholar]
- Tan, S.J.; Lim, K.H.; Subramaniam, G.; Kam, T.S. Macroline-sarpagine and macroline-pleiocarpamine bisindole alkaloids from Alstonia angustifolia. Phytochemistry 2012. [Google Scholar] [CrossRef]
- Ku, W.F.; Tan, S.J.; Low, Y.Y.; Komiyama, K.; Kam, T.S. Angustilobine and andranginine type indole alkaloids and an uleine-secovallesamine bisindole alkaloid from Alstonia angustiloba. Phytochemistry 2011, 72, 2212–2218. [Google Scholar]
- Li, P.T.; Leeuwenberg, A.J.M.; Middleton, D.J. Flora of China; Science Press: Beijing, China and Missouri Botanical Garden, St. Louis, MO, USA, 1995; Volume 16, p. 154. [Google Scholar]
- Channa, S.; Dar, A.; Atta-ur-Rahman, A.S. Evaluation of Alstonia scholaris leaves for broncho-vasodilatory activity. J. Ethnopharmacol. 2005, 97, 469–476. [Google Scholar]
- Sexton, J.E. Alkaloids of the Alstonia Species. In The Alkaloids: Chemistry and Physiology; Manske, R.H.F., Ed.; Academic Press: New York, NY, USA, 1965; Volume 8, pp. 159–202. [Google Scholar]
- Gandhi, M.; Vinayak, V.K.J. Preliminary evaluation of extracts of Alstonia scholaris bark for in vivo antimalarial activity in mice. J. Ethnopharmacol. 1990, 29, 51–57. [Google Scholar]
- Wright, C.W.; Allen, D.; Phillipson, J.D.; Kirby, G.C.; Warhurst, D.C.; Massiot, G.; Le Men-Olivier, L. Alstonia species: Are they effective in malaria treatment? J. Ethnopharmacol. 1993, 40, 41–45. [Google Scholar]
- Leaman, D.J.; Arnason, J.T.; Yusuf, R.; Roemantyo, H.S.; Soedjito, H.; Angerhofer, C.K.; Pezzuto, J.M. Malaria remedies of the Kenyah of the Apo Kayan, East Kalimantan, Indonesian Borneo: A quantitative assessment of local consensus as an indicator of biological efficac. J. Ethnopharmacol. 1995, 49, 1–16. [Google Scholar]
- Kam, T.S.; Nyedh, K.T.; Sim, K.M.; Yoganathan, K. Alkaloids from Alstonia Scholaris. Phytochemistry 1997, 45, 1303–1305. [Google Scholar]
- Lim, S.H.; Low, Y.Y.; Tan, S.J.; Lim, K.H.; Thomas, N.F.; Kam, T.S. Perhentidines A-C: Macroline-macroline bisindoles from Alstonia and the absolute configuration of perhentinine and macralstonine. J. Nat. Prod. 2012, 75, 942–950. [Google Scholar]
- Lim, S.H.; Tan, S.J.; Low, Y.Y.; Kam, T.S. Lumutinines A-D, linearly fused macroline-macroline and macroline-sarpagine bisindoles from Alstonia macrophylla. J. Nat. Prod. 2011, 74, 2556–2562. [Google Scholar]
- Tan, S.J.; Choo, Y.M.; Thomas, N.F.; Robinson, W.T.; Komiyama, K.; Kam, T.S. Unusual indole alkaloid-pyrrole, -pyrone, and -carbamic acid adducts from Alstonia angustifoli. Tetrahedron 2010, 66, 7799–7806. [Google Scholar]
- Arai, H.; Hirasawa, Y.; Rahman, A.; Kusumawati, I.; Zaini, N.C.; Sato, S.; Aoyama, C.; Takeo, J.; Morita, H. Alstiphyllanines E-H, picraline and ajmaline-type alkaloids from Alstonia macrophylla inhibiting sodium glucose cotransporter. Bioorg. Med. Chem. 2010, 18, 2152–2158. [Google Scholar]
- Hirasawa, Y.; Arai, H.; Zaima, K.; Oktarina, R.; Rahman, A.; Ekasari, W.; Widyawaruyanti, A.; Indrayanto, G.; Zaini, N.C.; Morita, H. Alstiphyllanines A–D, Indole alkaloids from Alstonia macrophylla. J. Nat. Prod. 2009, 72, 304–307. [Google Scholar]
- Hirasawa, Y.; Miyama, S.; Kawahara, N.; Goda, Y.; Rahman, A.; Ekasari, W.; Widyawaruyanti, A.; Indrayanto, G.; Zaini, N.C.; Morita, H. Indole alkaloids from the leaves of Alstonia scholaris. Heterocycles 2009, 79, 1107–1112. [Google Scholar]
- Kam, T.S.; Choo, Y.M. New indole alkaloids from Alstonia macrophylla. J. Nat. Prod. 2004, 67, 547–552. [Google Scholar]
- Koyama, K.; Hirasawa, Y.; Hosoya, T.; Hoe, T.C.; Chan, K.L.; Morita, H. Alpneumines A-H, new anti-melanogenic indole alkaloids from Alstonia pneumatophora. Bioorg. Med. Chem. 2010, 18, 4415–4421. [Google Scholar]
- Koyama, K.; Hirasawa, Y.; Nugroho, A.E.; Hosoya, T.; Hoe, T.C.; Chan, K.L.; Morita, H. Alsmaphorazines A and B, novel indole alkaloids from Alstonia pneumatophora. Org. Lett. 2010, 12, 4188–4191. [Google Scholar]
- Macabeo, A.P.G.; Krohn, K.; Gehle, D.; Read, R.W.; Brophy, J.J.; Cordell, G.A.; Franzblau, S.G.; Aguinaldo, A.M. Indole alkaloids from the leaves of Philippine Alstonia scholaris. Phytochemistry 2005, 66, 1158–1162. [Google Scholar]
- Salim, A.A.; Garson, M.J.; Craikc, David J. New Indole Alkaloids from the Bark of Alstonia scholaris. J. Nat. Prod. 2004, 67, 1591–1594. [Google Scholar]
- Tan, S.J.; Low, K.; Gehle, Y.Y.; Choo, Y.M.; Abdullah, Z.; Etoh, T.; Hayashi, M.; Komiyama, K.; Kam, T.S. Strychnan and secoangustilobine A type alkaloids from Alstonia spatulata. Revision of the C-20 configuration of scholaricine. J. Nat. Prod. 2010, 73, 1891–1897. [Google Scholar]
- Hutchinson, C.R. Tetrahedron report number 105: Camptothecin: Chemistry, biogenesis and medicinal chemistry. Tetrahedron 1981, 37, 1047–1065. [Google Scholar]
- Kam, T.S.; Choo, Y.M.; Komiyama, K. Unusual spirocyclic macroline alkaloids, nitrogenous derivatives, and a cytotoxic bisindole from Alstoni. Tetrahedron 2004, 60, 3957–3966. [Google Scholar]
- Kam, T.S.; Tan, S.J.; Ng, S.W.; Komiyama, K. Bipleiophylline, an unprecedented cytotoxic bisindole alkaloid constituted from the bridging of two indole moieties by an aromatic spacer unit. Org. Lett. 2008, 10, 3749–3752. [Google Scholar]
- Jagetia, G.C.; Baliga, M.S. Evaluation of anticancer activity of the alkaloid fraction of Alstonia scholaris (Sapthaparna) in vitro and in vivo. Phytother. Res. 2006, 20, 103–109. [Google Scholar]
- Khan, M.R.; Omoloso, A.D.; Kihara, M. Antibacterial activity of Alstonia scholaris and Leea tetramera. Fitoterapia 2003, 74, 736–740. [Google Scholar]
- Feng, T.; Cai, X.H.; Zhao, P.J.; Du, Z.Z.; Li, W.Q.; Luo, X.D. Monoterpenoid indole alkaloids from the bark of Alstonia scholaris. Planta. Med. 2009, 75, 1537–1541. [Google Scholar]
- Zhou, H.; He, H.P.; Luo, X.D.; Wang, Y.H.; Yang, X.W.; Di, Y.T.; Hao, X.J. Three New Indole Alkaloids from the Leaves of Alstonia scholaris. Helv. Chim. Acta. 2005, 88, 2508–2512. [Google Scholar]
- Lim, K.H.; Hiraku, O.; Komiyama, K.; Kam, T.S. Jerantinines A-G, cytotoxic Aspidosperma alkaloids from Tabernaemontana corymbosa. J. Nat. Prod. 2008, 71, 1591–1594. [Google Scholar]
- Yu, J.O.; Liao, Z.X.; Lei, J.C.; Hu, X.M. Antioxidant and cytotoxic activities of various fractions of ethanol extract of Dianthus superbus. Food. Chem. 2007, 104, 1215–1219. [Google Scholar]
- Duan, W.G.; Zhang, L.Y. Prostaglandins, Cyclooxygenase inhibitors not inhibit resting lung cancer A549 cell proliferation. Prostaglandins Leukot. Essent. Fatty. Acids. 2006, 74, 317–321. [Google Scholar]
- Espine-Ingroff, A.; White, T.; Pfaller, M.A. Manual of Clinical Microbiology, 7th ed.; American Society for Microbiology: Washington, DC, USA, 1999; pp. 1640–1652. [Google Scholar]
- Sample Availability: Samples of the compounds 1–10 are available from the authors.
© 2013 by the authors; licensee MDPI, Basel, Switzerland. This article is an open access article distributed under the terms and conditions of the Creative Commons Attribution license (http://creativecommons.org/licenses/by/3.0/).
Share and Cite
Wang, W.; Cheng, M.-H.; Wang, X.-H. Monoterpenoid Indole Alkaloids from Alstonia rupestris with Cytotoxic, Anti-Inflammatory and Antifungal Activities. Molecules 2013, 18, 7309-7322. https://doi.org/10.3390/molecules18067309
Wang W, Cheng M-H, Wang X-H. Monoterpenoid Indole Alkaloids from Alstonia rupestris with Cytotoxic, Anti-Inflammatory and Antifungal Activities. Molecules. 2013; 18(6):7309-7322. https://doi.org/10.3390/molecules18067309
Chicago/Turabian StyleWang, Wei, Ming-He Cheng, and Xiao-Hua Wang. 2013. "Monoterpenoid Indole Alkaloids from Alstonia rupestris with Cytotoxic, Anti-Inflammatory and Antifungal Activities" Molecules 18, no. 6: 7309-7322. https://doi.org/10.3390/molecules18067309
APA StyleWang, W., Cheng, M.-H., & Wang, X.-H. (2013). Monoterpenoid Indole Alkaloids from Alstonia rupestris with Cytotoxic, Anti-Inflammatory and Antifungal Activities. Molecules, 18(6), 7309-7322. https://doi.org/10.3390/molecules18067309