2.1. Ab Initio Calculations
The MP2/aug-cc-pVDZ(-PP) optimized geometries, of C
1 symmetry, of the complexes of CF
3X (with X = Cl, Br, I) with benzene and toluene are shown schematically in
Figure 1. The structural data describing the relative orientation of the monomers, and those related to the most pronounced perturbations are summarized in
Table 1 (benzene) and
Table 2 (toluene). For both benzene and toluene the equilibrium geometry is characterized by a localized structure [
14] in which the halogen atoms are not bonded towards the center of the aromatic ring but are interacting with a single carbon atom. The observation of localized structures is contradictory to the structural data of Lu
et al. [
15] who reported a delocalized complex as the preferred geometry for isolated complexes of benzene with simple halogen containing hydrocarbons such as chlorotrifluoromethane.
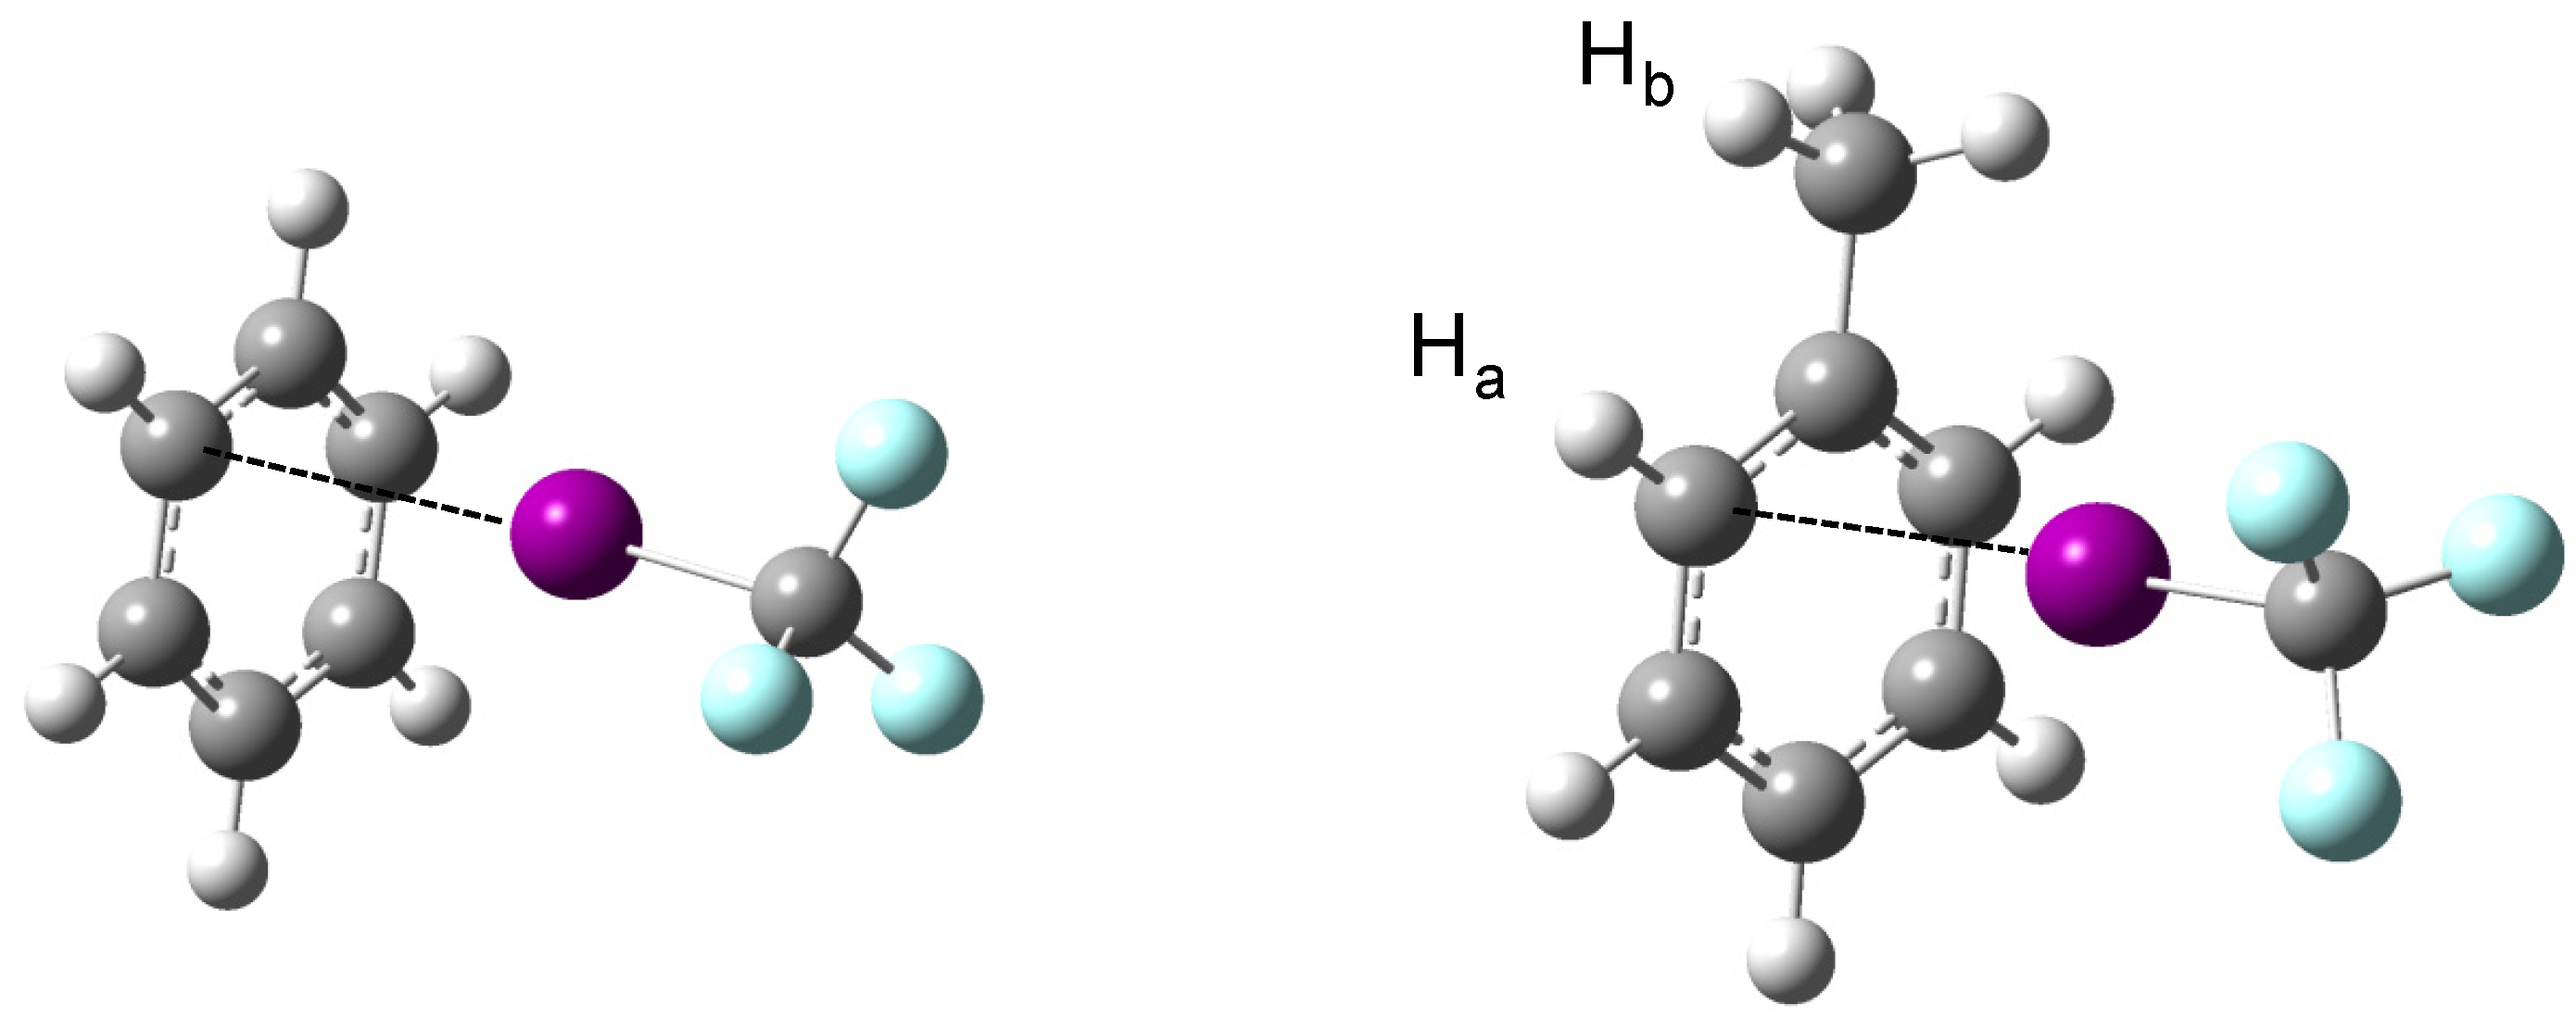
Figure 1.
MP2/aug-cc-pVDZ(-PP) equilibrium geometries of the complexes of CF3I with benzene and toluene. Small changes observed for the complexes with CF3Br and CF3Cl are discussed in the text.
Figure 1.
MP2/aug-cc-pVDZ(-PP) equilibrium geometries of the complexes of CF3I with benzene and toluene. Small changes observed for the complexes with CF3Br and CF3Cl are discussed in the text.
Table 1.
MP2/aug-cc-pVDZ(-PP) bond lengths, in Å, and bond angles, in degrees, for the complexes of CF3Cl, CF3Br and CF3I with benzenea.
Table 1.
MP2/aug-cc-pVDZ(-PP) bond lengths, in Å, and bond angles, in degrees, for the complexes of CF3Cl, CF3Br and CF3I with benzenea.
| | CF3Cl·benzene | CF3Br·benzene | CF3I·benzene |
|---|
| CF3X | | | | | | |
| rCF | 1.3450 | (0.0024) | 1.3464 | (0.0024) | 1.3497 | (0.0028) |
| rCX | 1.7510 | (−0.0039) | 1.9110 | (−0.0013) | 2.1423 | (0.0001) |
| θXCF | 110.72 | (0.24) | 110.80 | (0.26) | 111.01 | (0.29) |
| Benzene
b | | | | | | |
| rCC | 1.4072 | (0.0006) | 1.4077 | (0.0011) | 1.4084 | (0.0018) |
| rCH | 1.0933 | (0.0001) | 1.0934 | (0.0002) | 1.0935 | (0.0003) |
| rCπ | 1.4071 | (0.0005) | 1.4073 | (0.0007) | 1.4076 | (0.0010) |
| θCCC | 119.99 | (−0.01) | 119.99 | (−0.01) | 119.98 | (−0.02) |
| θHCC | 120.01 | (0.01) | 120.01 | (0.01) | 120.01 | (0.01) |
| Intermolecular
c | | | | | |
| rX…Cπ | 3.48 | | 3.45 | | 3.50 | |
| θCX…Cπ | 173.07 | | 174.39 | | 174.64 | |
Table 2.
MP2/aug-cc-pVDZ(-PP) bond lengths, in Å, and bond angles, in degrees, for the complexes of CF3Cl, CF3Br and CF3I with toluenea.
Table 2.
MP2/aug-cc-pVDZ(-PP) bond lengths, in Å, and bond angles, in degrees, for the complexes of CF3Cl, CF3Br and CF3I with toluenea.
| | CF3Cl·toluene | CF3Br· toluene | CF3I· toluene |
|---|
| CF3X | | | | | | |
| rCF | 1.3450 | (0.0024) | 1.3465 | (0.0025) | 1.3499 | (0.0030) |
| rCX | 1.7519 | (−0.0030) | 1.9121 | (−0.0002) | 2.1435 | (0.0013) |
| θXCF | 110.71 | (0.23) | 110.78 | (0.24) | 111.03 | (0.31) |
| Toluene b | | | | | | |
| rC=C | 1.4068 | (−0.0002) | 1.4079 | (0.0009) | 1.4087 | (0.0017) |
| rC-Cmethyl | 1.5112 | (−0.0005) | 1.5113 | (−0.0004) | 1.5112 | (−0.0005) |
| rCHa | 1.0946 | (0.0003) | 1.0945 | (0.0002) | 1.0947 | (0.0004) |
| rCHb | 1.1000 | (0.0008) | 1.0996 | (0.0004) | 1.0996 | (0.0004) |
| rCπ | 1.3993 | (0.0006) | 1.3994 | (0.0007) | 1.3996 | (0.0009) |
| θCCC | 120.06 | (0.01) | 120.03 | (−0.02) | 120.01 | (−0.04) |
| θHCC | 119.67 | (−0.01) | 119.69 | (0.01) | 119.70 | (0.02) |
| Intermolecular c | | | | | |
| rX…Cπ | 3.41 | | 3.38 | | 3.43 | |
| θCX…Cπ | 168.80 | | 171.47 | | 173.19 | |
The observation of localized equilibrium geometries in the current study is in line with the observation of localized and semi-localized halogen bonded interactions in the crystal structures of bromine and iodine derivatives of trityl alcohols reported by Shishkin [
14]. The good agreement, however, might be biased by the fact that the location of the halogen atom as observed in the crystal structures does not immediately reflect the intrinsic properties of the interactions but rather may be dominated by crystal packing effects. Therefore, the theoretical data should ideally be compared with experimental data obtained for isolated complexes as they appear in the gas phase. Because such studies have not yet been reported in literature, this analysis was considered far from straightforward. However, it should be mentioned that Fourier-transform microwave spectroscopic experiments for the benzene·ClF complex lead to a delocalized structure, in which the chlorine atom was pointing towards the centre of the π cloud [
16].
In view of the above, it is of interest to note that for the complexes with toluene, all calculations lead to an equilibrium structure in which the X-atom is pointing towards the ortho carbon atom C2, and that for none of the halogen donors studied, secondary minima on the PES could be located for the ipso, meta or para carbon atoms C1, C3 or C4. For the complexes of toluene with CF3Br and CF3I, the geometry optimizations also lead to eclipsed orientation of the methyl group in which one hydrogen atom is situated in the plane of the aromatic ring and the other two are situated on both sides of the plane. These results contrast with the data for CF3Cl, suggesting that in this complex the methyl group is rotated by 90 degrees. The exact nature of the latter changes is not fully understood, but most probably is related to the nearly free rotation of the methyl group in monomer toluene and by the fact that, although it is significantly weaker, the complex with CF3Cl can lead to shorter C-H···F distances and thus can give rise to weak secondary interactions, which compensate the barrier of rotation.
To shed some light on the differences between localized, semi-localized and delocalized geometries for the complexes of benzene, additional geometry optimizations were initiated in which the interacting halogen atom was forced towards the centre of a carbon-carbon bond or towards the centre of the benzene moiety. The resulting energy differences between the localized and delocalized geometries were found to be in the order of 0.1 to 0.7 kJ mol
−1. The largest differences between the localized and semi-localized geometries were found to be in the order of 0.05 kJ mol
−1. All these values are smaller than the value of kT, which for a typical experiment in LKr is in the order of 1.0 to 1.4 kJ mol
−1. The results therefore suggest that in the cryosolutions studied, the halogen donor molecule will undergo large amplitude motions which, in principle, could lead to an average delocalized geometry with C
6 symmetry [
17].
The MP2/aug-cc-pVDZ(-PP) complexation energies for the different complexes studied, the MP2/aug-cc-pVTZ(-PP) values obtained by performing additional single point energy calculations, and the ratio of the interatomic distances to the sum of the Van der Waals radii are summarized in
Table 3. It can be seen that expanding the basis set slightly stabilizes most of the complexes, the differences typically being in the order of 2% to 8%. The general trends showing a significant increase from CF
3Cl towards CF
3I are in line with the generally accepted ideas suggesting a significant increase in size and depth of the respective σ-holes [
18]. The observed increase in stability when passing from benzene to toluene is in line with the electron donating character of the additional methyl group [
13].
Table 3.
Intermolecular distance X…Cπ a, in Å, ratios of the interatomic distances and sum of the respective Van der Waals radii b, and MP2/aug-cc-pVD(T)Z(-PP) complexation energies ΔE, in kJ mol−1, for the complexes of benzene and toluene with CF3X (X = Cl, Br, I).
Table 3.
Intermolecular distance X…Cπ a, in Å, ratios of the interatomic distances and sum of the respective Van der Waals radii b, and MP2/aug-cc-pVD(T)Z(-PP) complexation energies ΔE, in kJ mol−1, for the complexes of benzene and toluene with CF3X (X = Cl, Br, I).
| | CF3Cl·benzene | CF3Br·benzene | CF3I·benzene |
|---|
| rX…π | 3.48 | 3.45 | 3.50 |
| sumvdW | 3.50 | 3.65 | 3.85 |
| ratio | 0.99 | 0.95 | 0.91 |
| ΔE (DZ) | −11.5 | −14.6 | −17.9 |
| ΔE (TZ) | −12.4 | −15.0 | −18.6 |
| | CF3Cl·toluene | CF3Br·toluene | CF3I·toluene |
| rX…π | 3.41 | 3.38 | 3.43 |
| sumvdW | 3.50 | 3.65 | 3.85 |
| ratio | 0.97 | 0.93 | 0.89 |
| ΔE (DZ) | −13.3 | −17.1 | −21.2 |
| ΔE (TZ) | −13.9 | −17.2 | −21.7 |
The MP2/aug-cc-pVDZ(-PP) harmonic vibrational frequencies and infrared intensities of the monomers and complexes are presented in
Table S1,
Table S2 and
Table S3 (benzene) and
Table S4,
Table S5 and
Table S6 (toluene). The data required to rationalize the experimentally observed complexation shifts is presented in
Table 4 and
Table 5, respectively. To facilitate comparison with calculated and observed frequencies reported in literature data, the normal modes of toluene were split into a group which describes the modes in the phenyl group and a smaller group of 6 describing the methyl vibrations. Following the ascent in symmetry approach, the modes localized in the phenyl group are numbered from 1 to 30, while the methyl vibrations are numbered from 31 to 36 [
19].
Table 4.
Selected harmonic MP2/aug-cc-pVDZ(-PP) vibrational frequencies, in cm−1, and infrared intensities, in km mol−1, for the halogen bonded complexes of benzene and CF3Cl, CF3Br and CF3I, respectively.
Table 4.
Selected harmonic MP2/aug-cc-pVDZ(-PP) vibrational frequencies, in cm−1, and infrared intensities, in km mol−1, for the halogen bonded complexes of benzene and CF3Cl, CF3Br and CF3I, respectively.
| Mode | νmonomer | IR intensity | νcomplex | IR intensity | Δν |
|---|
| CF3Cl | | | | | |
| ν1 | 1097.0 | 469.7 | 1098.8 | 558.7 | 1.8 |
| ν3 | 480.3 | 0.1 | 481.5 | 1.1 | 1.2 |
| ν4 | 1192.2 | 282.1 | 1182.6 | 214.4 | −9.6 |
| Benzene | | | | | |
| ν2 | 1007.1 | 0.0 | 1006.3 | 1.0 | −0.8 |
| ν4 | 678.4 | 115.9 | 680.6 | 128.7 | 2.2 |
| CF3Br | | | | | |
| ν1 | 1078.6 | 496.1 | 1080.0 | 581.9 | 1.4 |
| ν3 | 361.5 | 0.0 | 360.4 | 1.0 | −1.1 |
| ν4 | 1178.8 | 254.7 | 1169.8 | 243.6 | −9.0 |
| Benzene | | | | | |
| ν2 | 1007.1 | 0.0 | 1005.9 | 1.6 | −1.2 |
| ν4 | 678.4 | 115.9 | 681.9 | 133.4 | 3.5 |
| CF3I | | | | | |
| ν1 | 1060.0 | 546.9 | 1063.4 | 625.2 | 3.5 |
| ν3 | 295.1 | 0.3 | 293.3 | 2.6 | −1.8 |
| ν4 | 1162.0 | 227.6 | 1151.8 | 222.2 | −10.2 |
| Benzene | | | | | |
| ν2 | 1007.1 | 0.0 | 1005.3 | 3.1 | −1.8 |
| ν4 | 678.4 | 115.9 | 683.5 | 141.6 | 5.1 |
Because of the anticipated large amplitude motions in the complexes the standard harmonic vibrational frequencies deduced for the localized structures might not yield reliable predictions for the complexation shifts. Close inspection of the vibrational modes localized in the interacting monomers and of the complexation shifts derived from them, however, show that only little differences are observed between the vibrational frequencies derived for the different localized and delocalized geometries. As a consequence, is seems appropriate to assume that the vibrational frequencies and complexation shifts derived from the localized geometry can safely be used in all further studies.
Table 5.
Selected harmonic MP2/aug-cc-pVDZ(-PP) vibrational frequencies, in cm−1, and infrared intensities, in km mol−1, for the halogen bonded complexes of toluene and CF3Cl, CF3Br and CF3I, respectively.
Table 5.
Selected harmonic MP2/aug-cc-pVDZ(-PP) vibrational frequencies, in cm−1, and infrared intensities, in km mol−1, for the halogen bonded complexes of toluene and CF3Cl, CF3Br and CF3I, respectively.
| Mode | νmonomer | IR intensity | νcomplex | IR intensity | Δν |
|---|
| CF3Cl | | | | | |
| ν1 | 1097.0 | 469.7 | 1097.9 | 566.5 | 1.0 |
| ν3 | 480.3 | 0.1 | 481.2 | 1.6 | 0.9 |
| ν4 | 1192.2 | 282.1 | 1183.0 | 260.4 | −9.2 |
| Toluene | | | | | |
| ν4 | 1641.4 | 5.9 | 1639.0 | 5.3 | −2.4 |
| CF3Br | | | | | |
| ν1 | 1078.6 | 496.1 | 1079.6 | 596.5 | 1.0 |
| ν3 | 361.5 | 0.0 | 359.5 | 1.3 | −2.0 |
| ν4 | 1178.8 | 254.7 | 1169.7 | 240.9 | −9.1 |
| Toluene | | | | | |
| ν4 | 1641.4 | 5.9 | 1638.3 | 4.9 | −3.1 |
| CF3I | | | | | |
| ν1 | 1060.0 | 546.9 | 1063.4 | 640.9 | 3.5 |
| ν3 | 295.1 | 0.3 | 292.3 | 3.2 | −2.8 |
| ν4 | 1162.0 | 227.6 | 1151.1 | 220.2 | −10.9 |
| Toluene | | | | | |
| ν4 | 1641.4 | 5.9 | 1637.1 | 4.6 | −4.3 |
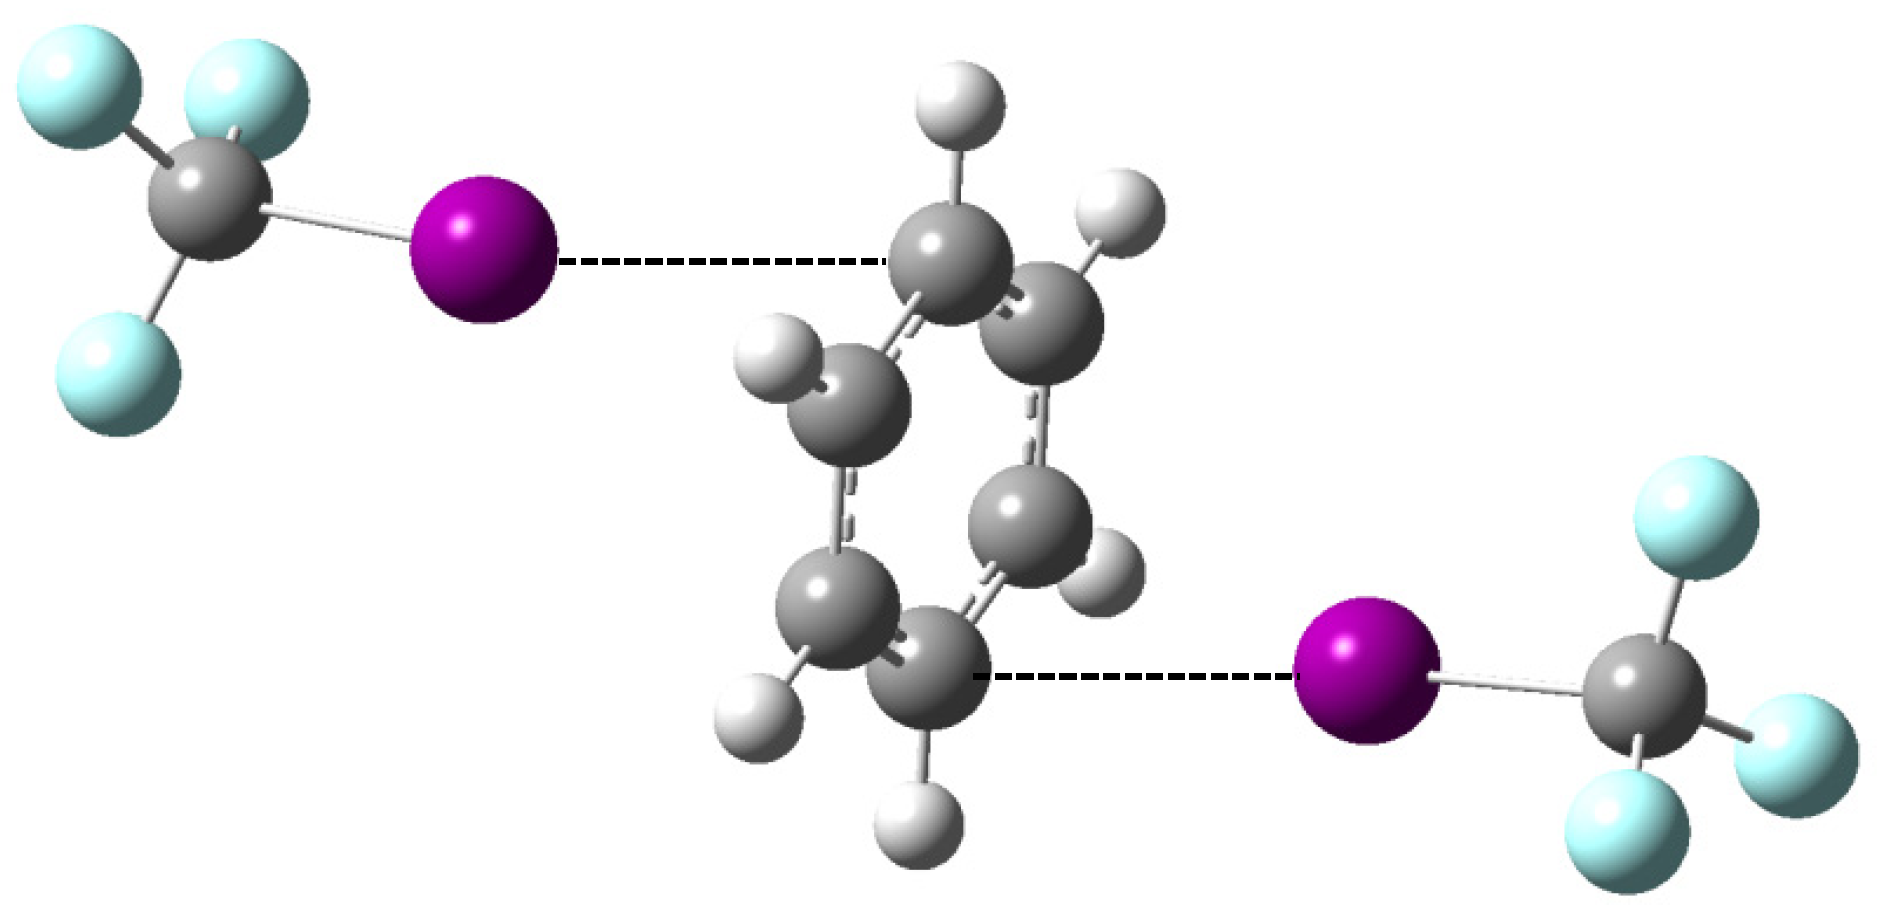
It will be shown below that evidence for the formation of a 2:1 complex, containing two molecules CF
3I and a single benzene moiety, is found in the experimental studies. Theoretical information on this 2:1 complex was, therefore, also derived. The resulting equilibrium geometry is shown in
Figure 2. Comparison of the MP2/aug-cc-pVTZ-PP complexation energies for the 1:1 and 2:1 complexes, given in
Table 6, reveals that the value of the 2:1 complex is a mere 2% smaller than twice the value of the 1:1 complex. This suggests that, analogous to the 2:1 halogen bonded complexes observed in previous studies [
10,
12,
13], the binding of the second CF
3I unit weakens the first halogen bond and vice versa. The occurrence of an anti-cooperative effect is also illustrated by the characteristic frequencies for the 1:1 and 2:1 complexes and those of the monomers, summarized in
Table 7, showing that the shift for modes in the benzene moiety for the 2:1 complex is larger than that for the 1:1 complex, while for the modes in the competing CF
3I moieties the opposite trend is observed.
Figure 2.
MP2/aug-cc-pVDZ(-PP) equilibrium geometry of the 2:1 complex involving two CF3I molecules and a single benzene molecule.
Figure 2.
MP2/aug-cc-pVDZ(-PP) equilibrium geometry of the 2:1 complex involving two CF3I molecules and a single benzene molecule.
Table 6.
Transformation of the ab initio MP2/aug-cc-pVTZ(-PP) complexation energies, ∆E(calc), to the standard complexation enthalpies in LKr by applying thermal and solvent corrections. For completeness, the experimental standard complexation enthalpies are also included. All values are given in kJ mol−1.
| Benzene | Toluene |
|---|
| CF3Cl | CF3Br | CF3I | 2CF3I | CF3Cl | CF3Br | CF3I |
|---|
| ∆E(calc) | −12.4 | −15.0 | −18.6 | −35.0 | −13.9 | −17.2 | −21.7 |
| ∆H (vap,calc) | −10.3 | −12.9 | −16.5 | −30.8 | −11.8 | −15.1 | −19.6 |
| ∆H (LKr,calc) | −7.5 | −9.4 | −12.4 | −23.6 | −8.5 | −10.9 | −15.1 |
| Experimental | | | | | | | |
| ∆H (LKr) | | −6.5 | −7.6 | −14.5 | | −6.2 | −7.4 |
Table 7.
Characteristic vibrational frequencies and complexation shifts (values in brackets), in cm−1, for the 1:1 and 2:1 complexes of CF3I with benzene. The experimental data refer to a solution in liquid krypton, at 120 K. The calculated values were derived from the MP2/aug-cc-pVDZ-PP frequencies.
| | | Calculated | Experiment |
|---|
| ν4 | benzene | 678.4 | 674.8 |
| | CF3I·benzene | 683.5 (5.1) | 679.4 (4.6) |
| | 2CF3I·benzene | 688.4 (10.0) | 683.2 (8.4) |
| ν4 | CF3I | 1162.0 | 1175.6 |
| | CF3I·benzene | 1151.8 (−10.2) | 1165.3 (−10.3) |
| | 2CF3I·benzene | 1154.4 (−7.6) | |
It should be mentioned here that so far no experimental evidence was found for the formation of a 2:1 complex between CF3I and toluene. As a consequence, no calculations for this type of complex were pursued.
2.3. Vibrational Spectra
The vibrational spectra of the trifluorohalomethanes CF
3Cl, CF
3Br and CF
3I and of benzene dissolved in liquid rare gases have been studied in detail before [
10,
13,
20,
21] and are not commented here. The observed frequencies for toluene dissolved in LKr and their assignments, based on literature data for the vapor and liquid phases [
19] and on the harmonic vibrational frequencies derived at the MP2/aug-cc-pVDZ and MP2/aug-cc-pVTZ levels, are summarized in
Table S7. It can be seen that for almost all vibrations an excellent agreement is found between the experimental and calculated frequencies. A typical exception is found for ν
18, which in the infrared spectrum gives rise to an intense feature near 695 cm
−1 and which at the MP2/aug-cc-pVDZ level is calculated to appear as a weak feature, with an infrared intensity of a mere 1.7 km mol
−1, at 609.8 cm
−1. A much more reliable prediction leading to a harmonic vibrational frequency of 713.4 cm
−1 and a calculated infrared intensity of 11.3 km mol
−1 is obtained at the MP2/aug-cc-pVTZ level. The large deviation for the MP2/aug-cc-pVDZ level and the more reliable value for the MP2/aug-cc-pVTZ level is explained as the result of severe Basis Set Incompleteness Errors [
22,
23] appearing at the lower level.
To fully characterize the halogen bonded complexes of CF
3X (with X = Cl, Br and I) with benzene and toluene, in this study infrared and Raman spectra of solutions in LKr containing mixtures of the different halogen donors and acceptors were recorded at temperatures between 120 and 140 K. For the infrared measurements, the mole fractions for the trifluorohalomethanes and the Lewis bases were typically varied between 7.5 × 10
−5 and 3.4 × 10
−2 and between 3.8 × 10
−5 and 1.9 × 10
−3, respectively. The Raman spectra were recorded using mole fractions between 1.7 × 10
−3 and 1.3 × 10
−2 for the mixtures with benzene and between 4.7 × 10
−3 and 7.1 × 10
−3 for the mixtures with toluene. Even at relatively high concentrations of the molecules involved, for none of the mixtures with CF
3Cl, indications for the formation of a C-Cl
…π halogen bonded complex were observed. The obvious conclusion is that these complexes are too weak to be observed in LKr. The observed frequencies, the assignment and the complexation shifts obtained for the complexes with benzene and with toluene are collected in
Table 8 and
Table 9, and in
Table 10 and
Table 11, respectively.
Previous experiments dealing with the complexes of the trifluorohalomethanes with, amongst other, dimethyl ether, dimethyl sulfide and trimethyl amine have shown [
10,
11,
12] that upon complexation with a Lewis base significant shifts can be observed for the CF
3 symmetric and antisymmetric stretches ν
1 and ν
4. In agreement with these results, also in this study significant red shifts, varying between −9.0 and −10.2 cm
−1 for the complexes with benzene and between −9.1 and −10.9 cm
−1 for the complexes with toluene, are predicted for the antisymmetric stretches ν
4. In addition, for the symmetric stretching modes ν
1 small blue shifts, varying between +1.4 and +3.5 cm
−1 and between +1.0 and +3.5 cm
−1, are predicted, respectively.
Table 8.
Experimental vibrational frequencies and complexation shifts, in cm−1, for the complex of CF3Br with benzene dissolved in LKr at 120 K. The ab initio complexation shifts given are derived from the MP2/aug-cc-pVDZ-PP harmonic vibrational frequencies.
Table 8.
Experimental vibrational frequencies and complexation shifts, in cm−1, for the complex of CF3Br with benzene dissolved in LKr at 120 K. The ab initio complexation shifts given are derived from the MP2/aug-cc-pVDZ-PP harmonic vibrational frequencies.
| | Assignment | νmonomer | νcomplex | Δνexp | Δνcalc |
|---|
| CF3Br | ν1 + ν2 | 1831.2 | 1831.9 | 0.7 | −1.3 |
| | ν4 | 1198.1 | 1190.4 | −7.7 | −9.0 |
| | ν1 | 1075.2 | | | 1.4 |
| | ν2 | 759.4 | 758.5 | −0.8 | −2.7 |
| | ν5 | 546.3 | | | −0.8 |
| | ν3 (79Br) | 352.1 | 352.0 | −0.1 | −1.1 |
| | ν3 (81Br) | 350.3 | 350.2 | −0.1 | −1.1 |
| | ν6 | 303.4 | | | 0.5 |
| Benzene | ν1 | 3067.8 | | | 0.6 |
| | ν15 | 3052.2 | | | 1.2 |
| | ν12 | 3041.6 | 3042.2 | 0.6 | 0.8 |
| | ν7 + ν19 | 1955.0 | 1958.1 | 3.1 | 1.2 |
| | ν11 + ν19 | 1810.1 | 1814.1 | 4.0 | 3.6 |
| | ν4+ ν11 | 1520.2 | 1525.5 | 5.3 | 6.1 |
| | ν13 | 1481.3 | 1481.2 | −0.1 | −2.0 |
| | ν17 | 1175.1 | | | −0.1 |
| | ν14 | 1037.6 | | | −0.8 |
| | ν2 | 992.7 | 992.0 | −0.7 | −1.2 |
| | ν4 | 674.8 | 677.4 | 2.6 | 3.5 |
Table 9.
Experimental vibrational frequencies and complexation shifts, in cm−1, for the complex of CF3I with benzene dissolved in LKr at 120 K. The ab initio complexation shifts given are derived from the MP2/aug-cc-pVDZ-PP harmonic vibrational frequencies.
Table 9.
Experimental vibrational frequencies and complexation shifts, in cm−1, for the complex of CF3I with benzene dissolved in LKr at 120 K. The ab initio complexation shifts given are derived from the MP2/aug-cc-pVDZ-PP harmonic vibrational frequencies.
| | Assignment | νmonomer | νcomplex | Δνexp | Δνcalc |
|---|
| CF3I | 2ν4 (l4=0) | 2329.9 | 2309.9 | −20.0 | −20.4 |
| | ν2 + ν4 | 1909.9 | 1898.1 | −11.8 | −13.0 |
| | ν4 | 1175.6 | 1165.3 | −10.3 | −10.2 |
| | ν4 (13C) | 1142.7 | 1132.5 | −10.2 | −10.2 |
| | ν1 | 1067.4 | 1070.1 | 2.7 | 3.5 |
| | ν1 (13C) | 1040.0 | 1042.7 | 2.7 | 3.5 |
| | ν2 | 740.7 | | | −2.8 |
| | ν5 | 539.9 | | | −1.0 |
| | ν3 | 286.4 | 285.6 | −0.8 | −1.8 |
| | ν6 | 266.0 | | | 0.3 |
| Benzene | ν1 | 3067.8 | | | 0.9 |
| | ν15 | 3052.2 | | | 1.7 |
| | ν12 | 3041.6 | 3041.1 | −0.5 | 1.1 |
| ν7 + ν19 | 1955.0 | 1959.6 | 4.6 | 1.1 |
| | ν11 + ν19 | 1810.1 | 1816.3 | 6.2 | 4.7 |
| | ν4+ ν11 | 1520.2 | 1528.5 | 8.3 | 8.6 |
| | ν13 | 1481.3 | 1480.8 | −0.5 | −2.9 |
| | ν17 | 1175.1 | | | −0.2 |
| | ν14 | 1037.6 | 1037.2 | −0.4 | −1.2 |
| | ν2 | 992.7 | 991.4 | −1.3 | −1.8 |
| | ν4 | 674.8 | 679.4 | 4.6 | 5.1 |
Table 10.
Experimental vibrational frequencies and complexation shifts, in cm−1, for the complex of CF3Br with toluene dissolved in LKr at 120 K. The ab initio complexation shifts given are derived from the MP2/aug-cc-pVDZ-PP harmonic vibrational frequencies.
Table 10.
Experimental vibrational frequencies and complexation shifts, in cm−1, for the complex of CF3Br with toluene dissolved in LKr at 120 K. The ab initio complexation shifts given are derived from the MP2/aug-cc-pVDZ-PP harmonic vibrational frequencies.
| | Assignment | νmonomer | νcomplex | Δνexp | Δνcalc |
|---|
| CF3Br | ν1 + ν2 | 1831.2 | | | −2.1 |
| | ν4 | 1198.1 | 1189.8 | −8.3 | −9.1 |
| | ν1 | 1075.2 | | | 1.0 |
| | ν2 | 759.4 | 758.0 | −1.4 | −3.1 |
| | ν5 | 546.3 | | | −0.9 |
| | ν3 (79Br) | 352.1 | 351.5 | −0.6 | −2.0 |
| | ν3 (81Br) | 350.3 | 349.7 | −0.6 | −2.0 |
| | ν6 | 303.4 | | | 0.5 |
| Toluene | ν21 | 3092.9 | 3091.6 | −1.3 | 1.4 |
| | ν1 | 3072.2 | 3071.8 | −0.4 | 1.3 |
| | ν2 | 3061.1 | | | 1.5 |
| | ν34 | 2954.7 | 2955.0 | 0.3 | −0.5 |
| | ν31 | 2923.1 | 2922.8 | −0.3 | −1.9 |
| | ν15 + ν16 | 1870.6 | | | 4.2 |
| | ν4 | 1607.8 | 1607.2 | −0.6 | −3.1 |
| | ν5 | 1497.4 | 1497.3 | −0.1 | −1.8 |
| | ν8 | 1031.6 | 1031.4 | −0.2 | −0.6 |
| | ν17 | 728.6 | 731.2 | 2.6 | 2.2 |
| | ν18 | 694.5 | | | −4.1 |
| | ν19 | 463.8 | | | −0.3 |
Table 11.
Experimental vibrational frequencies and complexation shifts, in cm−1, for the complex of CF3I with toluene dissolved in LKr at 120 K. The ab initio complexation shifts given are derived from the MP2/aug-cc-pVDZ-PP harmonic vibrational frequencies.
Table 11.
Experimental vibrational frequencies and complexation shifts, in cm−1, for the complex of CF3I with toluene dissolved in LKr at 120 K. The ab initio complexation shifts given are derived from the MP2/aug-cc-pVDZ-PP harmonic vibrational frequencies.
| | Assignment | νmonomer | νcomplex | Δνexp | Δνcalc |
|---|
| CF3I | 2ν4 (l4 = 0) | 2329.9 | 2308.9 | −21 | −21.8 |
| | ν2 + ν4 | 1909.9 | 1897.1 | −12.8 | −14.3 |
| | ν4 | 1175.6 | 1164.8 | −10.8 | −10.9 |
| | ν4 (13C) | 1142.7 | 1132.3 | −10.4 | −10.9 |
| | ν1 | 1067.4 | 1070.5 | 3.1 | 3.5 |
| | ν1 (13C) | 1040.0 | 1042.5 | 2.5 | 3.5 |
| | ν2 | 740.8 | 738.7 | −2.1 | −3.4 |
| | ν5 | 539.9 | | | −1.2 |
| | ν3 | 286.4 | 285.1 | −1.3 | −2.8 |
| | ν6 | 266.0 | | | 0.2 |
| Toluene | ν21 | 3092.9 | 3091.1 | −1.8 | 1.8 |
| | ν1 | 3072.2 | 3071.6 | −0.6 | 1.9 |
| | ν2 | 3061.1 | 3061.3 | 0.2 | 2.1 |
| | ν34 | 2954.7 | 2956.0 | 1.3 | 0.1 |
| | ν31 | 2923.1 | 2922.7 | −0.4 | −1.1 |
| | ν15 + ν16 | 1870.6 | 1875.9 | 5.3 | 5.8 |
| | ν4 | 1607.8 | 1606.3 | −1.5 | −4.3 |
| | ν5 | 1497.4 | 1496.9 | −0.5 | −2.3 |
| | ν8 | 1031.6 | 1031.2 | −0.4 | −0.8 |
| | ν17 | 728.6 | 731.5 | 2.9 | 3.5 |
| | ν18 | 694.5 | 694.9 | 0.4 | −7.5 |
| | ν19 | 463.8 | 464.2 | 0.4 | -1.0 |
Figure 3 shows the ν
4 spectral regions of solutions in LKr, at 120 K, containing mixtures of benzene with CF
3Br (panel A) and CF
3I (panel C) and of toluene with CF
3Br (panel B) and CF
3I panel D). To favor complexation with the less soluble Lewis bases, the spectra were recorded for solutions containing a large excess of the trifluorohalomethanes. These conditions, obviously, lead to full absorption in the region of the monomer transitions.
Comparison of the spectra of the mixtures, shown in trace
a, with the spectra of the monomers, given in traces
b and
c, reveals the presence of weak bands that are assigned to the halogen bonded complexes. Additional bands, only present in the spectra of the mixture, are observed at 1165.3, 1164.8 and 1189.8 cm
−1 for the complex of CF
3I with benzene and for the complexes of CF
3I and CF
3Br with toluene, respectively. For the mixture of CF
3Br and benzene in panel A, an extremely weak feature can be envisaged near 1190.4 cm
−1. The small red shift of −7.7 cm
−1 deduced by assuming that this feature is related to the halogen bonded complex between benzene and CF
3Br, and the red shifts of −10.3, −8.3 and −10.8 cm
−1 observed for the complexes of CF
3I with benzene and of CF
3Br and CF
3I with toluene are in excellent agreement with the calculated values of −9.0, −10.2, −9.1 and −10.9 cm
−1, given in
Table 8,
Table 9,
Table 10 and
Table 11.
Figure 3.
Infrared spectra of the antisymmetric ν4 stretching region of CF3X (with X = Br, I) for LKr solutions of mixtures of CF3Br (panels A and B) or CF3I (panels C and D) with benzene (panels A and C) or toluene (panel B and D) at 120 K. In each panel trace a represents the mixed solution, while traces b and c show the solution containing only CF3X (with X = Br, I) or the Lewis base, respectively. New bands appearing in the spectrum of the mixtures are marked with an asterisk (*) and are assigned to the 1:1 complex.
Since different concentrations have been used for the benzene and toluene mixtures, the intensities of the complex bands in
Figure 3 cannot be used to deduce direct information on the relative stabilities of the different complexes. However, the fact that similar complexation shifts have been observed for the corresponding benzene and toluene complexes, suggests, albeit indirectly, comparable stabilities for the CF
3Br·benzene and CF
3Br·toluene halogen bonds and for the CF
3I·benzene and CF
3I·toluene halogen bonds.
Apart from the shifts observed for the CF
3 stretching modes, complexation shifts have also been predicted for the C-X stretching modes. These modes are characterized by a very low infrared intensity in the monomers and, consequently, are preferentially studied using Raman spectroscopy. Careful analysis of the spectra of the mixed solutions and of the spectra of the monomers shows that also for the mixtures studied here, indications for complex bands due to halogen bonded complexes can be observed at a frequency somewhat lower than that of the monomer. The experimental complexation shifts for the C-
79Br, the C-
81Br and the C-I stretching modes are in the order of −0.1 to −0.8 cm
−1 for the complexes with benzene and in the order of −0.6 to −1.3 cm
−1 for the complexes with toluene. These values are in line with, but somewhat smaller than, the calculated values reported in
Table 4 and
Table 5.
Analysis of the data in
Table S1,
Table S2,
Table S3,
Table S4,
Table S5 and
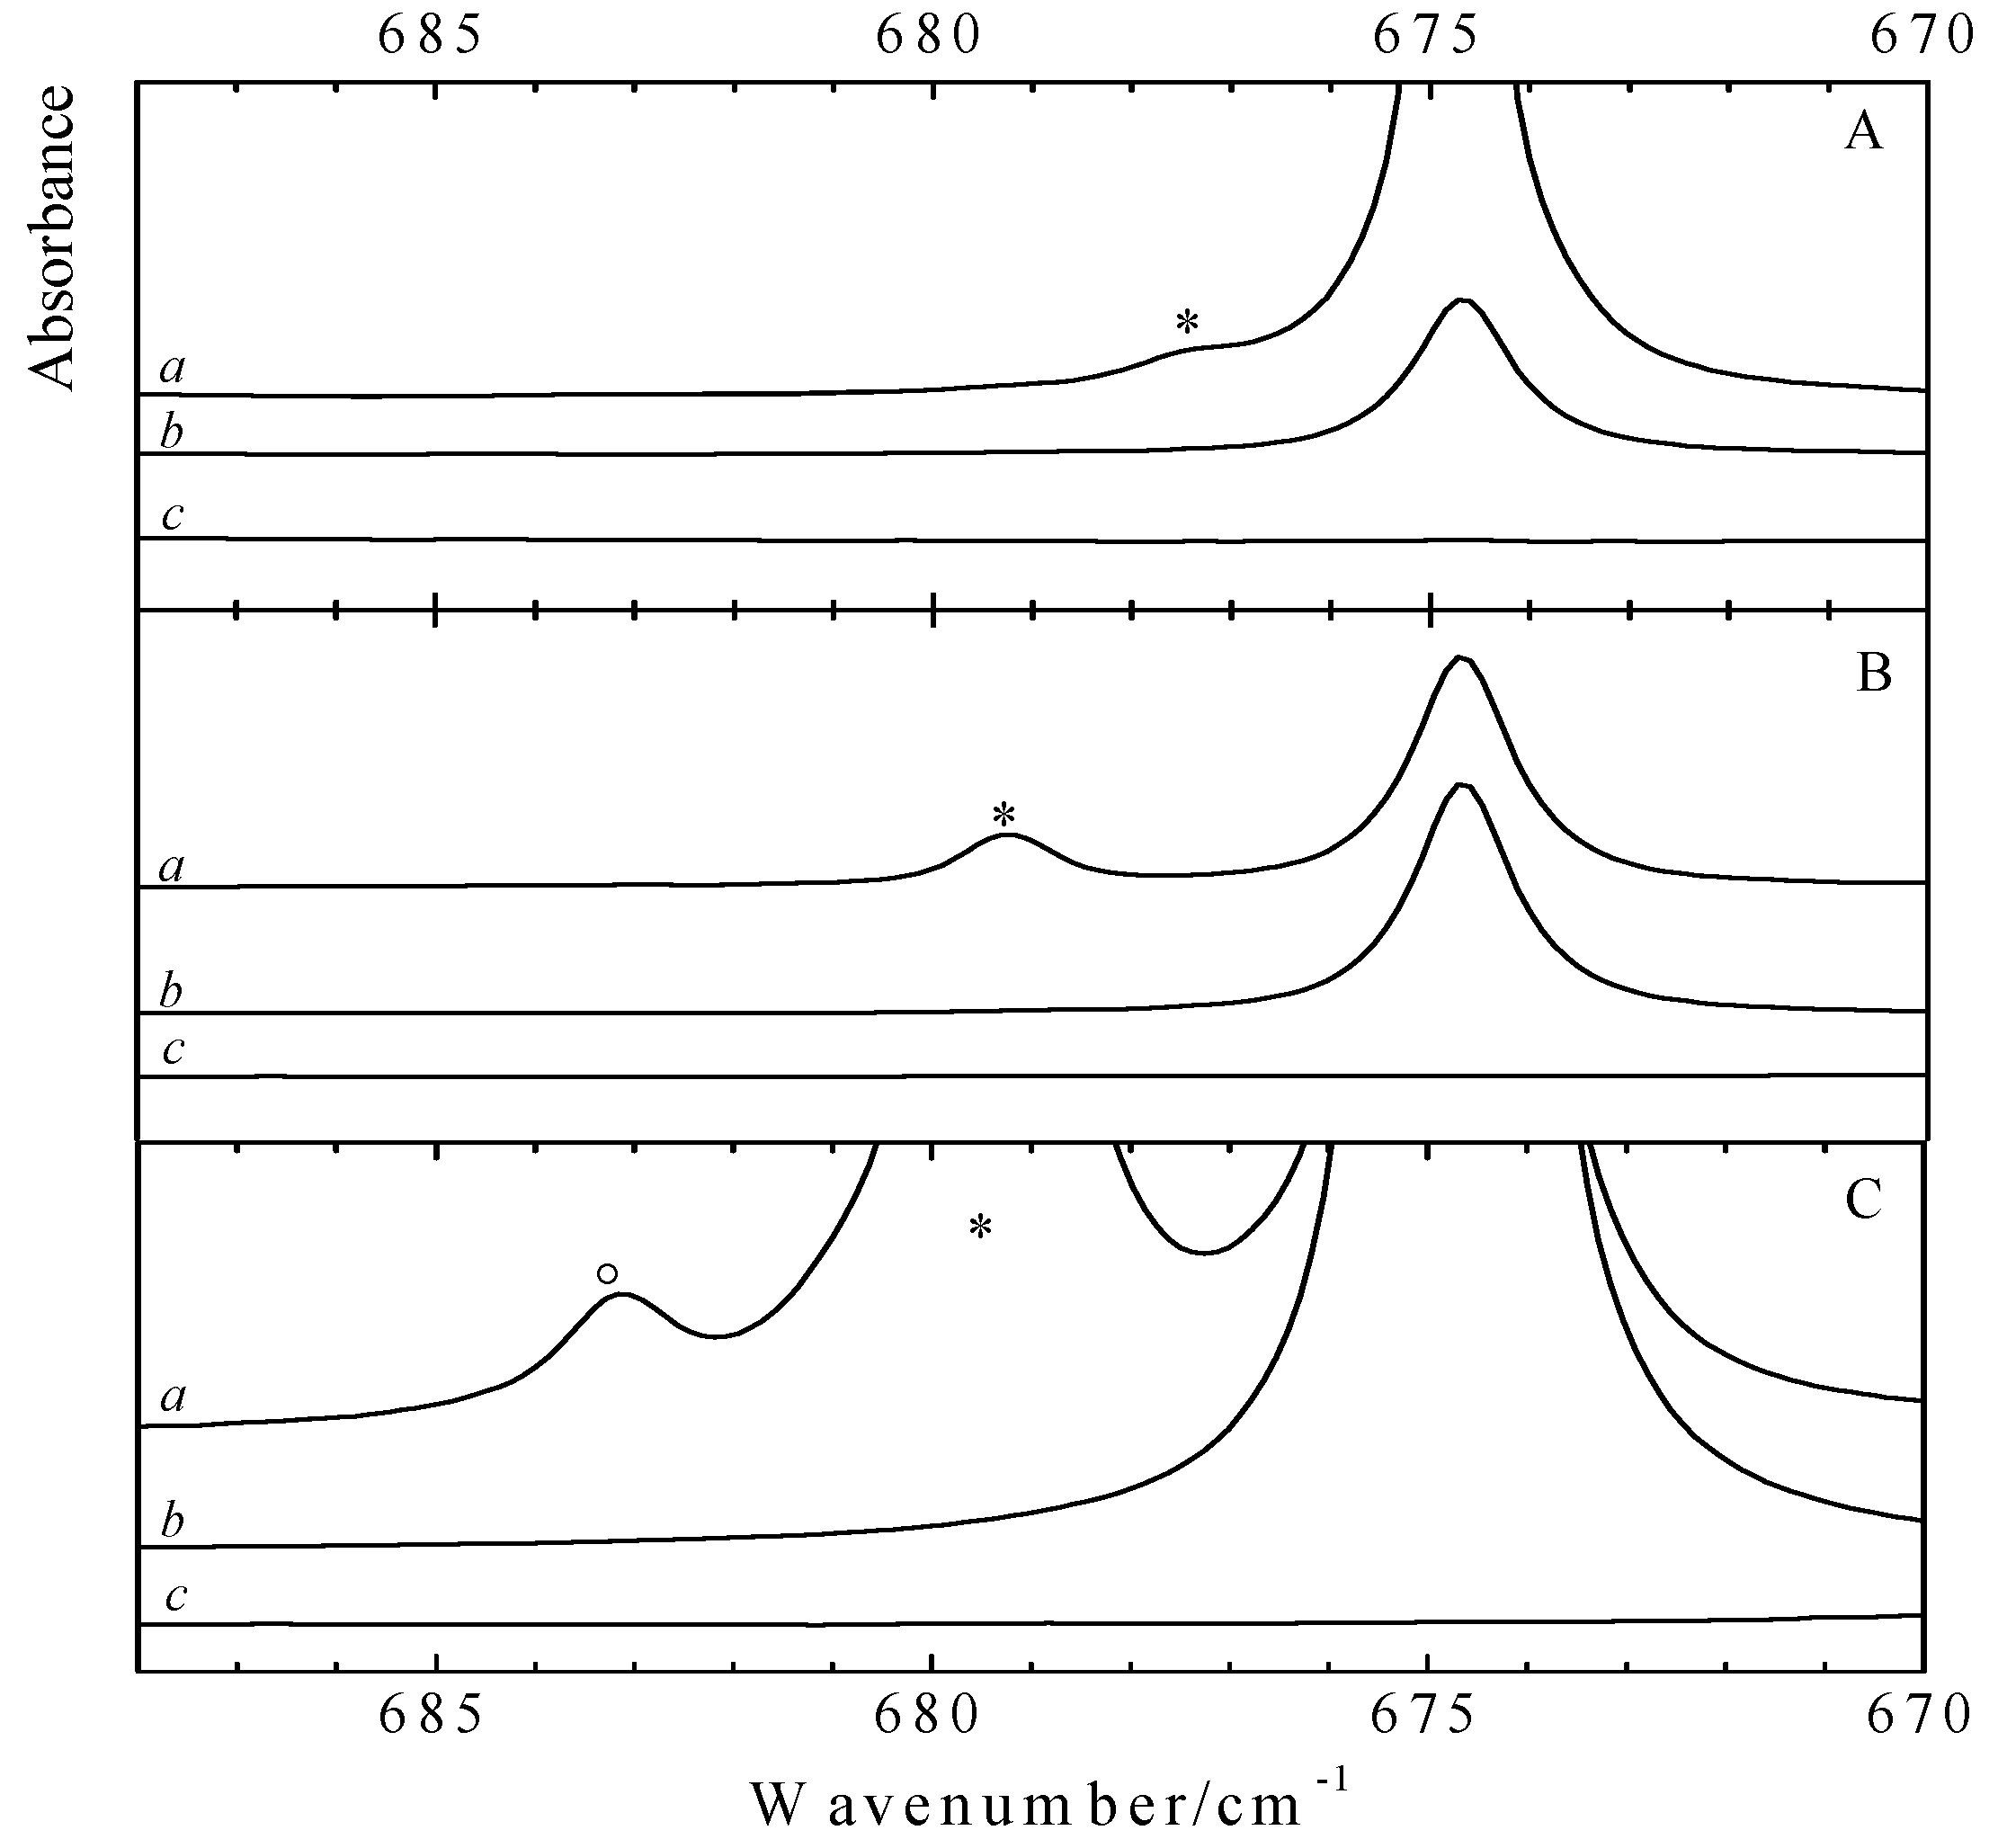
Table S6 reveals that also for the Lewis bases significant complexation shifts and intensity changes can be expected upon complexation. Typical examples of complex bands observed while analyzing the spectral regions related to the C-H out of plane bending mode ν
4 (A
2u) in benzene and to the in plane deformation ν
4 (A
1) in toluene are depicted in
Figure 4 and
Figure 5. The infrared spectra obtained for solutions in LKr, at 120 K, containing mixtures of the Lewis base with CF
3Br and CF
3I are shown in panels A and B, respectively. Since the vibrational mode ν
4 of the monomer benzene has high infrared intensity, with a predicted value of 115.9 km mol
−1, only low concentrations of benzene could be used to study this region. As a consequence, complexation was forced by using a large excess of the halogen donor. The typical mole fractions used for CF
3I, CF
3Br and benzene are 9.1 × 10
−3, 1.3 × 10
−2 and 4.9 × 10
−4. The spectra for the solutions containing benzene and an even larger excess of CF
3I, with mole fractions close to 9.4 × 10
−5 and 2.0 × 10
−2, are given in panel C of
Figure 4. The significantly lower infrared intensity of the monomer vibration ν
4 of toluene, with a calculated value of 5.9 km mol
−1, allows the usage of higher mole fractions in the order of 1.9 × 10
−3 which, combined with mole fractions of 9.4 × 10
−5 and 2.3 × 10
−4 for CF
3I and CF
3Br, result in the spectra shown in
Figure 5. As before, the spectra of the mixed solutions are given in trace
a while the spectra of the corresponding monomers are given in traces
b and
c. The bands related to halogen bonded complexes are marked with an asterisk.
Analysis of the data in the different panels of
Figure 4 reveals that for both CF
3Br and CF
3I a new band appears on the high frequency side of the 674.8 cm
−1 monomer vibration. The blue shifts of + 2.6 cm
−1 for the CF
3Br complex and + 4.6 cm
−1 for CF
3I are in line with the
ab initio complexation shifts, presented in
Table 4, and agree favorably with data reported in earlier studies showing that the C-H out of plane bending mode ν
4 (A
2u) in benzene is largely perturbed by C-H proton donors such as halothane, CF
3CBrClH [
20], and sevoflurane, (CF
3)
2CHOCH
2F [
21], and other Lewis acids such as hexafluorobenzene, C
6F
6 [
24].
Apart from the bands assigned to the monomers and to the 1:1 complexes, in the infrared spectra of the mixed solutions containing higher concentrations of benzene and CF
3I an additional spectral feature at 683.2 cm
−1 is observed. This band, which in
Figure 4C is marked with a circle (°), is observed at lower temperatures and at highly concentrated solutions only. Supported by the results of the
ab initio calculations and a concentration study, to be discussed below, and by the appearance of similar features for solutions containing benzene and halothane, this band is assigned to the ν
4 mode of benzene in a 2:1 complex consisting of two CF
3I molecules and one benzene moiety.
Figure 4.
Infrared spectra of the C-H out of plane bending mode ν4 (A2u) of benzene for LKr solutions of mixtures of CF3Br (panel A) or CF3I (panels B and C) with benzene at 120K. In each panel trace a represents the mixed solution, while traces b and c show the solution containing only benzene and CF3X (with X = Br, I), respectively. New bands appearing in the spectrum of the mixtures are marked with an asterisk (*) and are assigned to the 1:1 complex. Panel C is obtained by using higher concentrations of both CF3I and benzene. In this panel, the band marked with a circle (°) is assigned to the 2:1 complex with two molecules CF3I and a single molecule benzene.
Figure 5.
Infrared spectra of the in plane deformation ν4 (A1) of toluenefor LKr solutions of mixtures of CF3Br (panel A) or CF3I (panel B) with toluene at 120K. Additional bands are visible in the spectrum of the complex (trace d), which is obtained after subtracting the rescaled monomer traces b and c from the mixture trace a. Traces b and c show the solution containing only toluene and CF3X (with X = Br, I), respectively. New bands appearing in thespectrum of the complex are marked with an asterisk (*) and are assigned to the 1:1 complex.
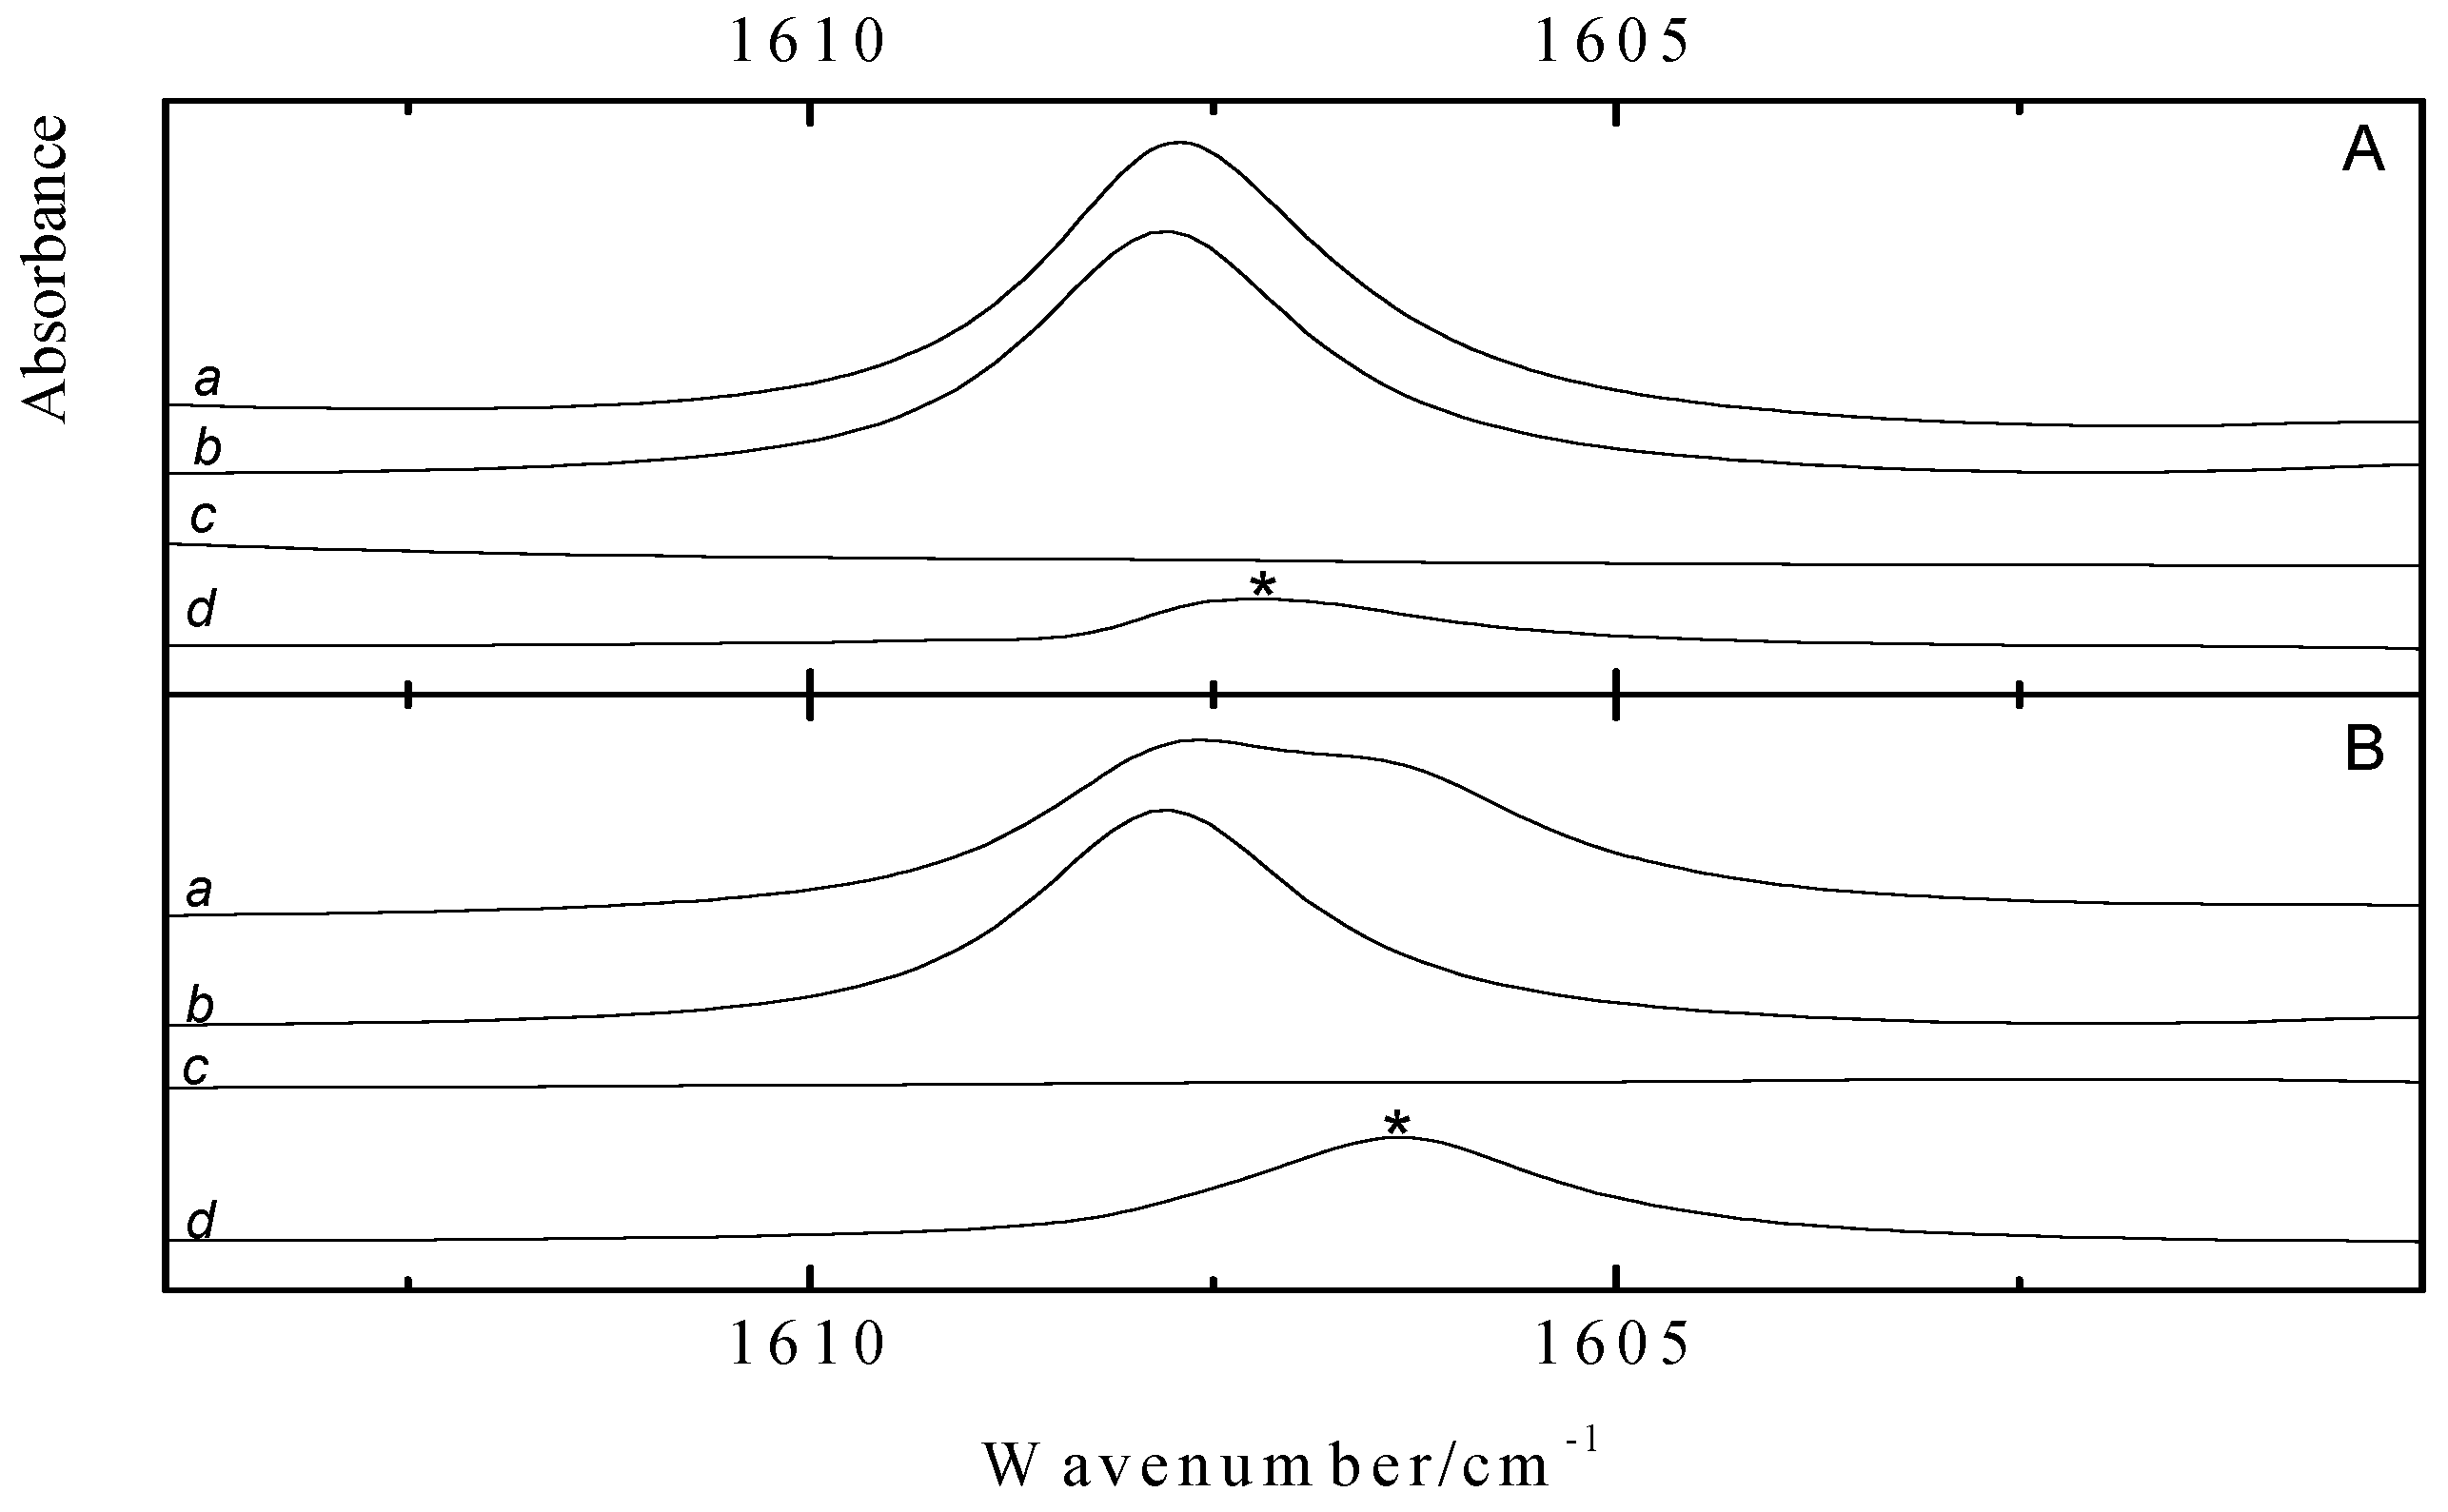
Analysis of the ν
4 spectral data of toluene, presented in
Figure 5, shows that apart from the monomer transition at 1607.8 cm
−1, new features due to the same mode in the complex with CF
3Br and CF
3I become apparent near 1607.2 and 1606.3 cm
−1. The presence of these features is confirmed using subtraction procedures in which spectra of the monomers are recorded at exactly the same temperature as that used to study the mixed solution and are rescaled afterwards to correctly reproduce the monomer contributions in spectral regions where monomers and complexes are easily distinguished. The spectra of the mixed solutions, the rescaled spectra of the monomers, and the difference spectrum obtained by subtracting the various spectra are shown in traces
a,
b and
c, and
d, respectively. The red shifts derived from the data are −0.6 cm
−1 for the complex with CF
3Br and −1.5 cm
−1 for the complex with CF
3I. These values, again, are in line with the theoretical shifts of −3.1 and −4.3 cm
−1 and confirm the above observations suggesting that the predicted complexation shifts in almost all cases are strongly overestimated.
The vibrational frequencies and infrared intensities in
Table 4 show that upon complexation with CF
3I and CF
3Br, a small red shift is observed for the ring breathing mode of benzene. In addition, a significant increase in infrared intensity, from 0.0 km mol
−1 up to 1.6 km mol
−1 for CF
3Br·benzene and 3.1 km mol
−1 for CF
3I·benzene, is encountered. The value of 0.0 km mol
−1 obtained for monomer benzene is in line with the general selection rules showing that the ring breathing mode located near 993 cm
−1 is allowed in Raman but forbidden in infrared. The values of 1.6 and 3.1 km mol
−1 obtained for the complexes with CF
3Br and CF
3I illustrate that during complexation, the symmetry restrictions are lifted, and that due to the electric field generated by the halogen donor and by the relatively large polarizability derivatives for the mode under studied, the mode gains some induced infrared intensity.
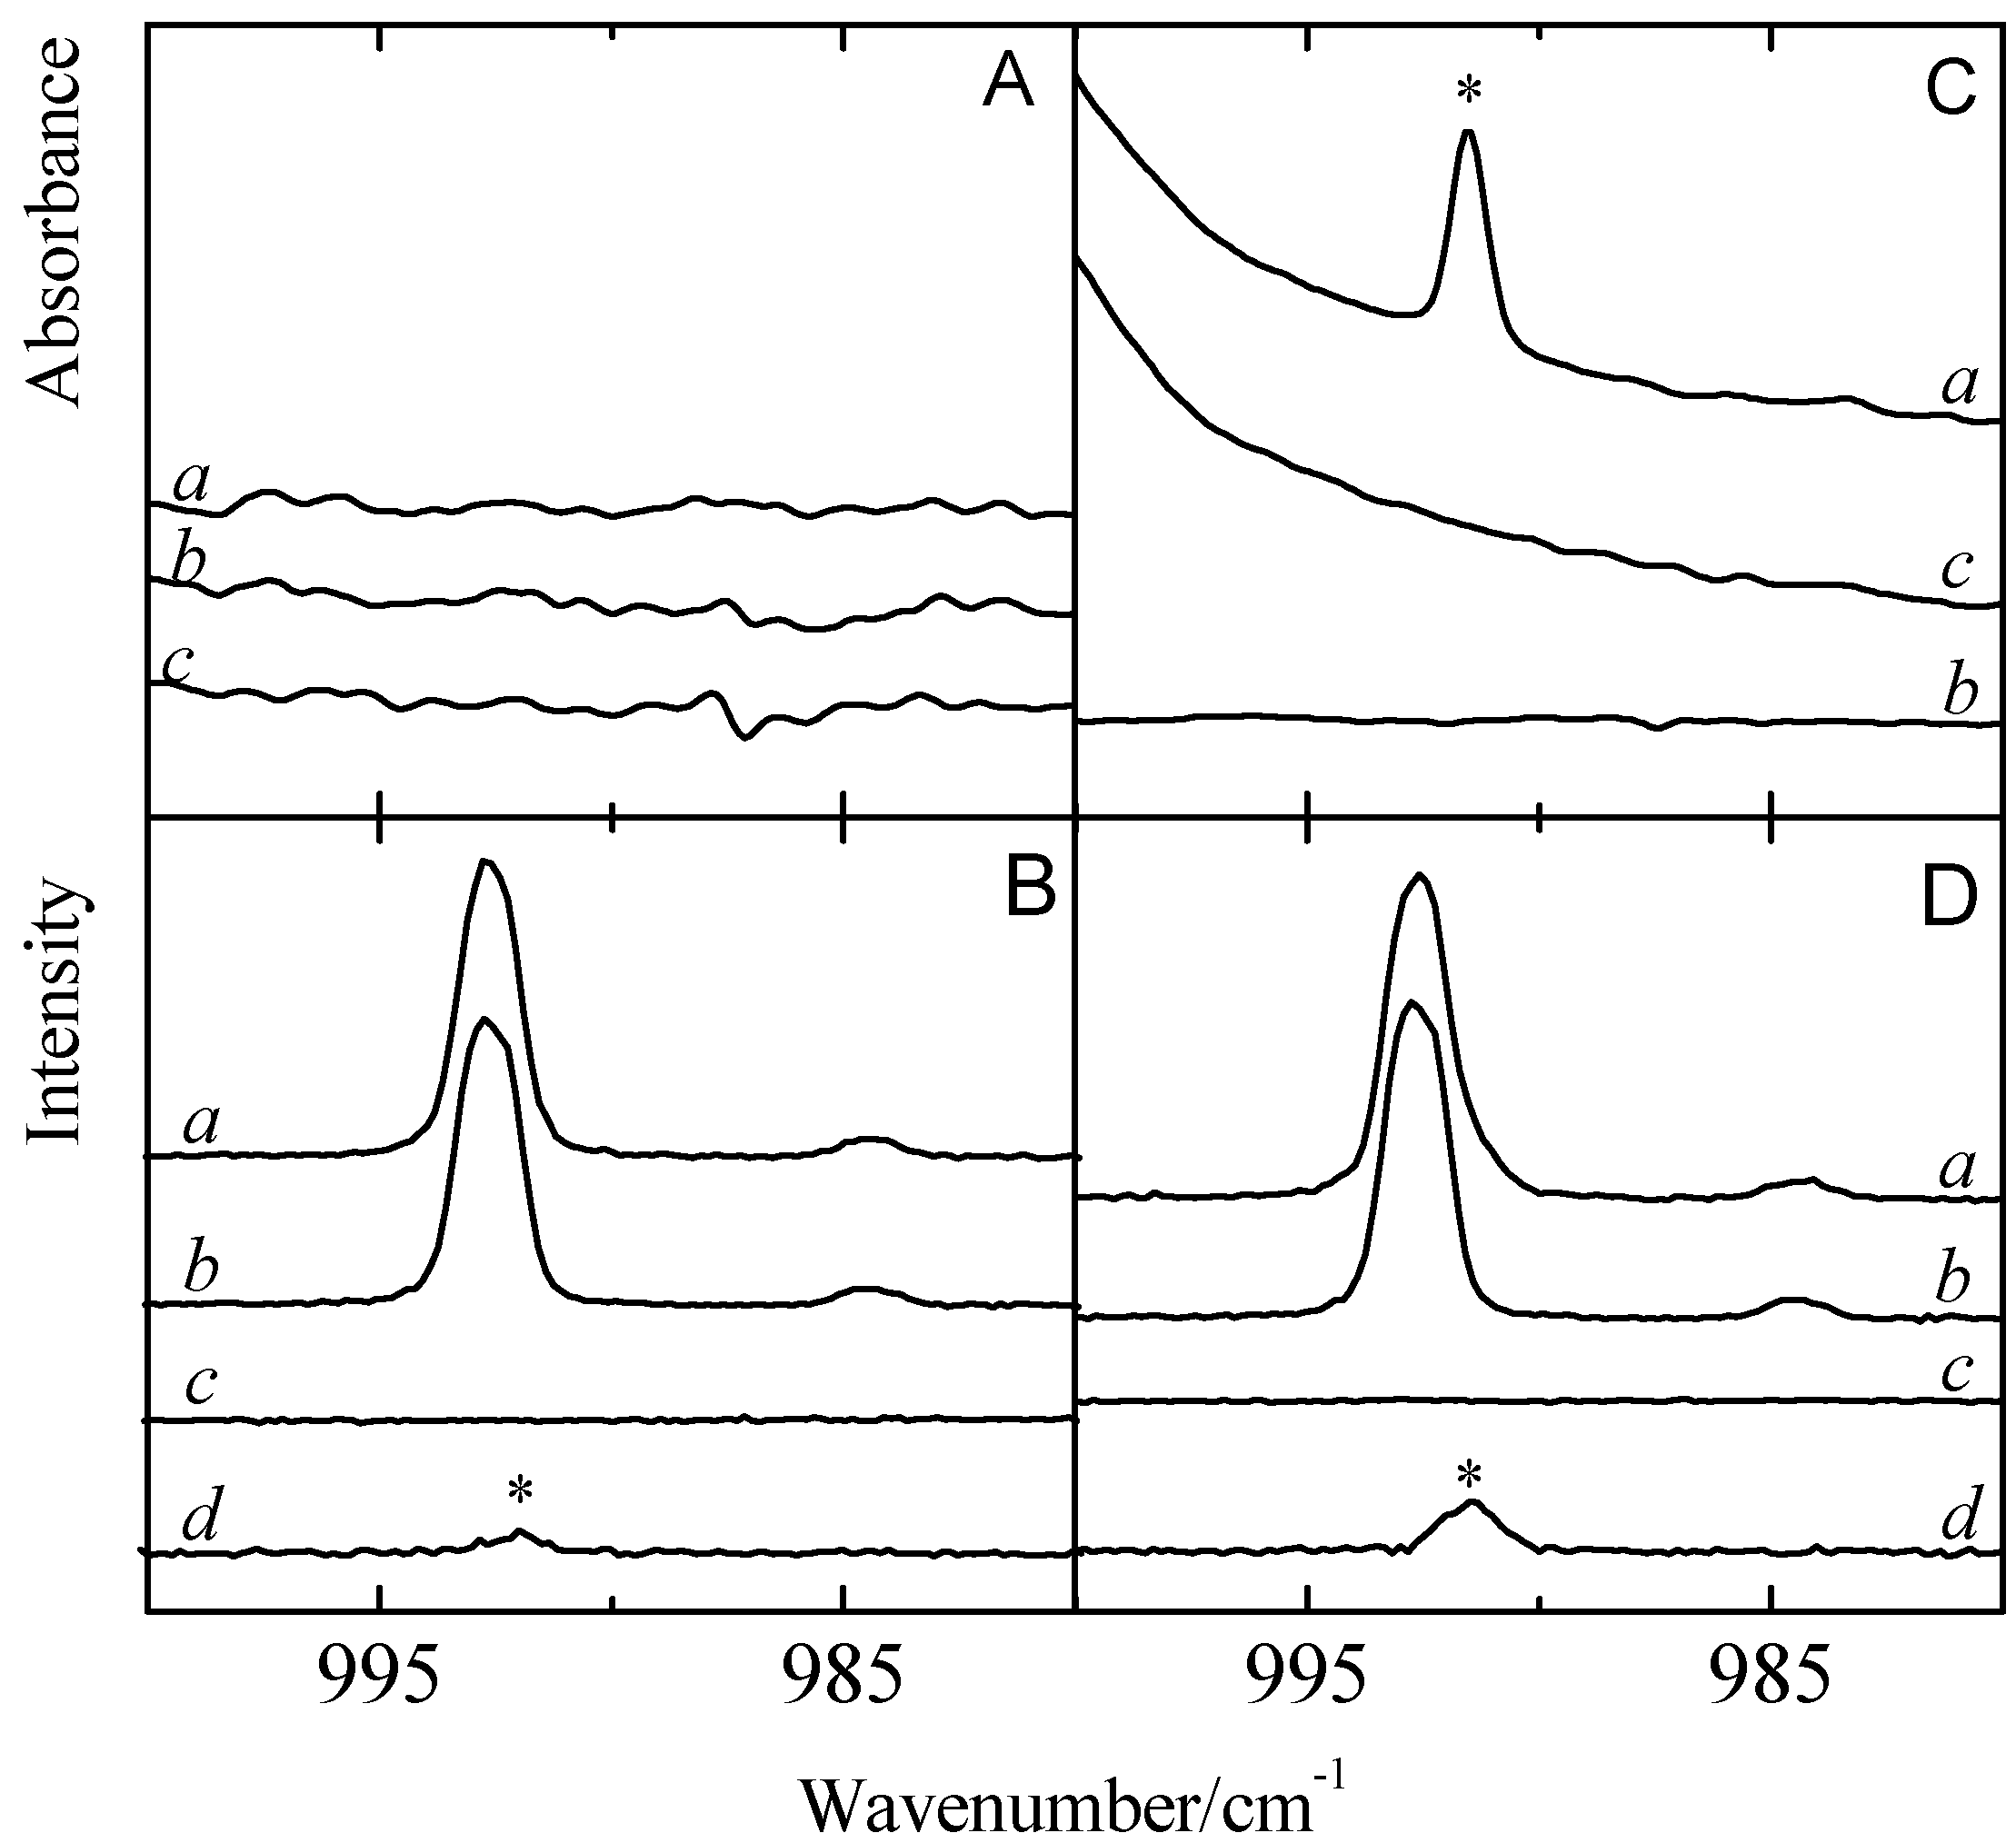
To shed light on the appearance of induced spectral features and to further rationalize the behavior of the ring breathing mode in the complexes formed with benzene, special attention was paid to infrared and Raman spectra in the ν
2 spectral region. Typical spectra obtained for mixed solutions of benzene with CF
3Br and CF
3I, and of the monomers involved are summarized in
Figure 6. The infrared and Raman data are given in panels A and C, and in panels B and D, respectively. The data for CF
3Br is shown in panels A and B while the data obtained for CF
3I is given in panels C and D. In each panel, trace
a refers to the spectrum of the mixed solution, while traces
b and
c are the spectra of monomer benzene and CF
3X, respectively. Trace
d is the spectrum of the 1:1 complex, obtained by subtracting the rescaled monomer traces
b and
c from the mixture trace
a.
Inspection of the difference spectra shown in traces
d of panels B and D shows that for CF
3Br and CF
3I, a new band can be observed to appear red-shifted from the 992.7 cm
−1 monomer transition, by −0.7 and −1.3 cm
−1, respectively. The frequency of the complex band observed for CF
3I·benzene is in excellent agreement with that of the induced spectral feature observed in the infrared spectra in panel C, and confirms its assignment. Even for a large excess of CF
3Br, no counterpart of the 992.0 cm
−1 complex band observed in the Raman spectra, could be detected in the infrared spectra in panel A. The occurrence of an induced ring breathing mode in the complex with CF
3I and the lack of such a feature for the complex with CF
3Br is not fully understood. The observations, however, are in line with the differences in infrared intensity, suggesting that the induced ring breathing mode in the complex with CF
3I is almost twice as large as that in the complex with CF
3Br, and with the above observations showing that even when a large excess of CF
3Br is used, the equilibrium concentrations of the complexes formed remain rather small. The changes in induced infrared intensity, in a first approximation, can be correlated with the large differences in dipole moment between CF
3I and CF
3Br and with the level of charge transfer present, giving rise to an approximate penetration depth [
25] and an X
…π intermolecular distance of −0.20 and −0.35 Å, and of 3.45 and 3.50 Å, respectively.
Figure 6.
Panels A and C present the infrared spectra and panels B and D the Raman spectra of the so-called ring breathing mode ν2 of benzene for solutions with CF3Br (panels A and B) and CF3I (panels C and D). Trace a gives the spectrum of the mixed solution, while traces b and c are the spectra of the monomer benzene and CF3X (with X = Br, I), respectively. Trace d is the spectrum of the 1:1 complex, obtained by subtracting the rescaled monomer traces b and c from the mixture trace a. New bands appearing in the spectrum of the complex are marked with an asterisk (*) and are assigned to the 1:1 complex.
2.5. Relative Stability
Standard complexation enthalpies for the various 1:1 and 1:2 complexes were obtained from temperature studies in which the infrared spectra of mixed solutions were studied as a function of temperature. The mole fractions used typically varied between 7.5 × 10
−5 and 3.4 × 10
−2 for the halogen donor and between 3.8 × 10
−5 and 1.9 × 10
−3 for the halogen acceptor. The temperature ranges used were determined by the solubility of benzene and toluene in LKr, and typically spanned the range from 120 to 140 K. The complexation enthalpies were derived by using the Van’t Hoff relation which establishes a linear relation between the inverse temperature and the logarithm of the appropriate intensity product
![Molecules 18 06829 i003]()
. The slopes of these relations equal
![Molecules 18 06829 i004]()
where
b is a correction factor to account for the changes in solvent density upon temperature variation [
26].
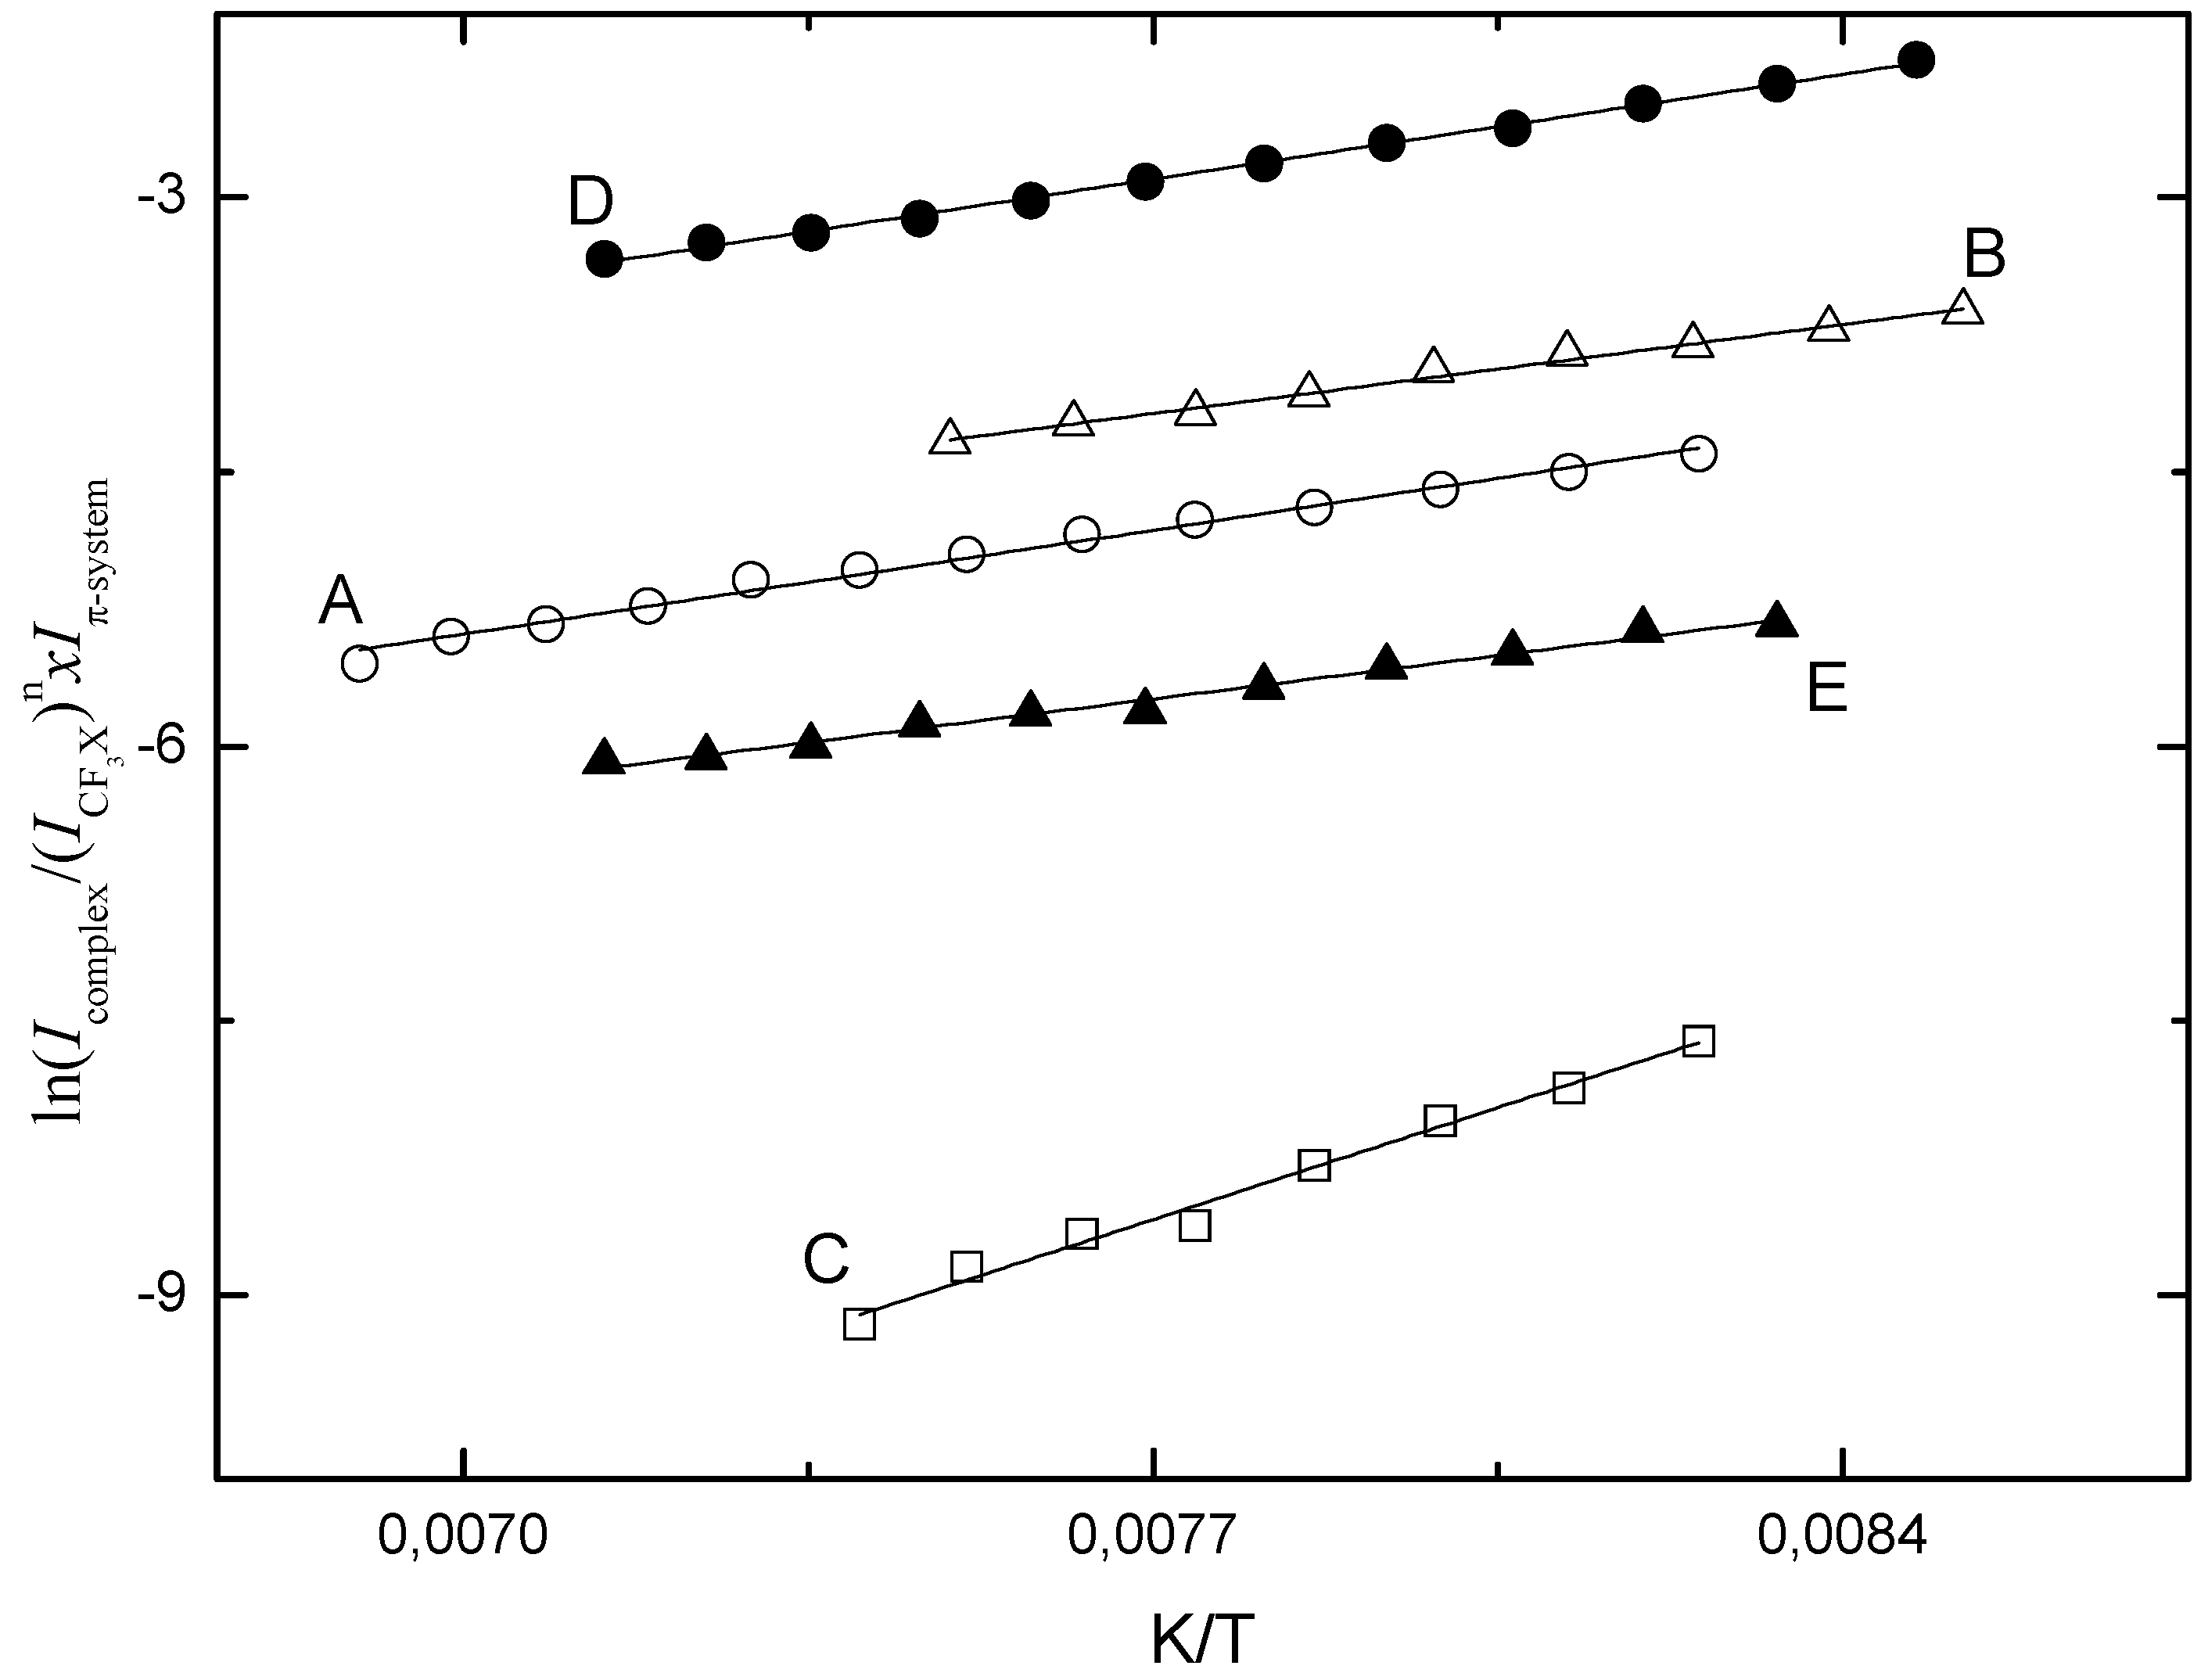
Typical Van’t Hoff plots obtained for the different complexes studied are shown in
Figure 8. The average complexation enthalpies for the 1:1 complexes, obtained by analyzing and averaging out the data for a series of solutions and by correcting the slopes of the different regression lines for density variations in the temperature intervals used, are −6.5(3) kJ mol
−1 for CF
3Br·benzene, −7.6(2) kJ mol
−1 for CF
3I·benzene, −6.2(5) kJ mol
−1 for CF
3Br·toluene and −7.4(5) kJ mol
−1 for CF
3I·toluene. For completeness,
Figure 8 also contains a typical Van’t Hoff plot obtained for the 2:1 complex of CF
3I and benzene. The cumulative complexation enthalpy for this complex, obtained by assuming the complexation equilibrium, 2 CF
3I + benzene
![Molecules 18 06829 i005]()
(CF
3I.)
2benzene, is −14.5(9) kJ mol
−1.
Figure 8.
Typical Van’t Hoff plots obtained for the halogen bonded complexes observed in liquid krypton: (A) CF3I·benzene, (B) CF3Br·benzene, (C) (CF3I)2.benzene, (D) CF3I·toluene and (E) CF3Br·toluene.
Figure 8.
Typical Van’t Hoff plots obtained for the halogen bonded complexes observed in liquid krypton: (A) CF3I·benzene, (B) CF3Br·benzene, (C) (CF3I)2.benzene, (D) CF3I·toluene and (E) CF3Br·toluene.
Comparison of the experimental complexation enthalpies and the theoretical values summarized in
Table 6 shows that the different complexes with benzene and toluene are characterized by very similar complexation enthalpies and that the increase of the predicted values of the relative stability, due to the additional methyl group, are far from reproduced. The experimental observation that the extra methyl group has little or no effect on the relative stability might be somewhat surprising, but in fact is in line with the above observations showing that the complexes with benzene and toluene lead to very similar complexation shifts in the experimental spectra.
The experimental and predicted values in
Table 6 further illustrates that for both aromatic model compounds, the predicted complexation enthalpies are largely overestimated, the differences between experiment and theory being 45% to 63% for the complexes with benzene, and between 76% and 104% for the complexes with toluene. These trends are in line with earlier observations showing that also for other complexes involving the aromatic model compounds including, amongst others, the complexes of benzene with the anesthetics halothane [
20] and sevoflurane [
21], MP2/aug-cc-pVTZ (-PP)
ab initio calculations tend to seriously overestimate the complexation energies and the corresponding complexation enthalpies. The overestimation, most likely, is due to imperfections related to the MP2 second order perturbation approach used. To fully rationalize the nature of these effects, it is considered of great interest to compare the experimental values for the different complexes reported with high level
ab initio calculations in which the complexation energy of the complexes is evaluated at the CCSD(T)/CBS level, or using the recently developed post-MP2 methods or MP2 variants such as scaled MP3 or scaled spin-component MP2 methods [
27,
28,
29,
30]. A full analysis of the results obtained using these methods for all hydrocarbons studied so far was deemed beyond the scope of the current study, and will be reported separately in a later phase.
It is of interest to note here that, although the calculations strongly overestimate the stability of the individual complexes, the experimentally observed anti-cooperative effect yielding an experimental complexation enthalpy for the individual C-X...π halogen bonds in the 2:1 complex which is only 5% smaller than that in the 1:1 complex is well reproduced by the ab initio interaction energies, and that an even better agreement is found for the calculated complexation enthalpies in LKr.


 ΔsolG/
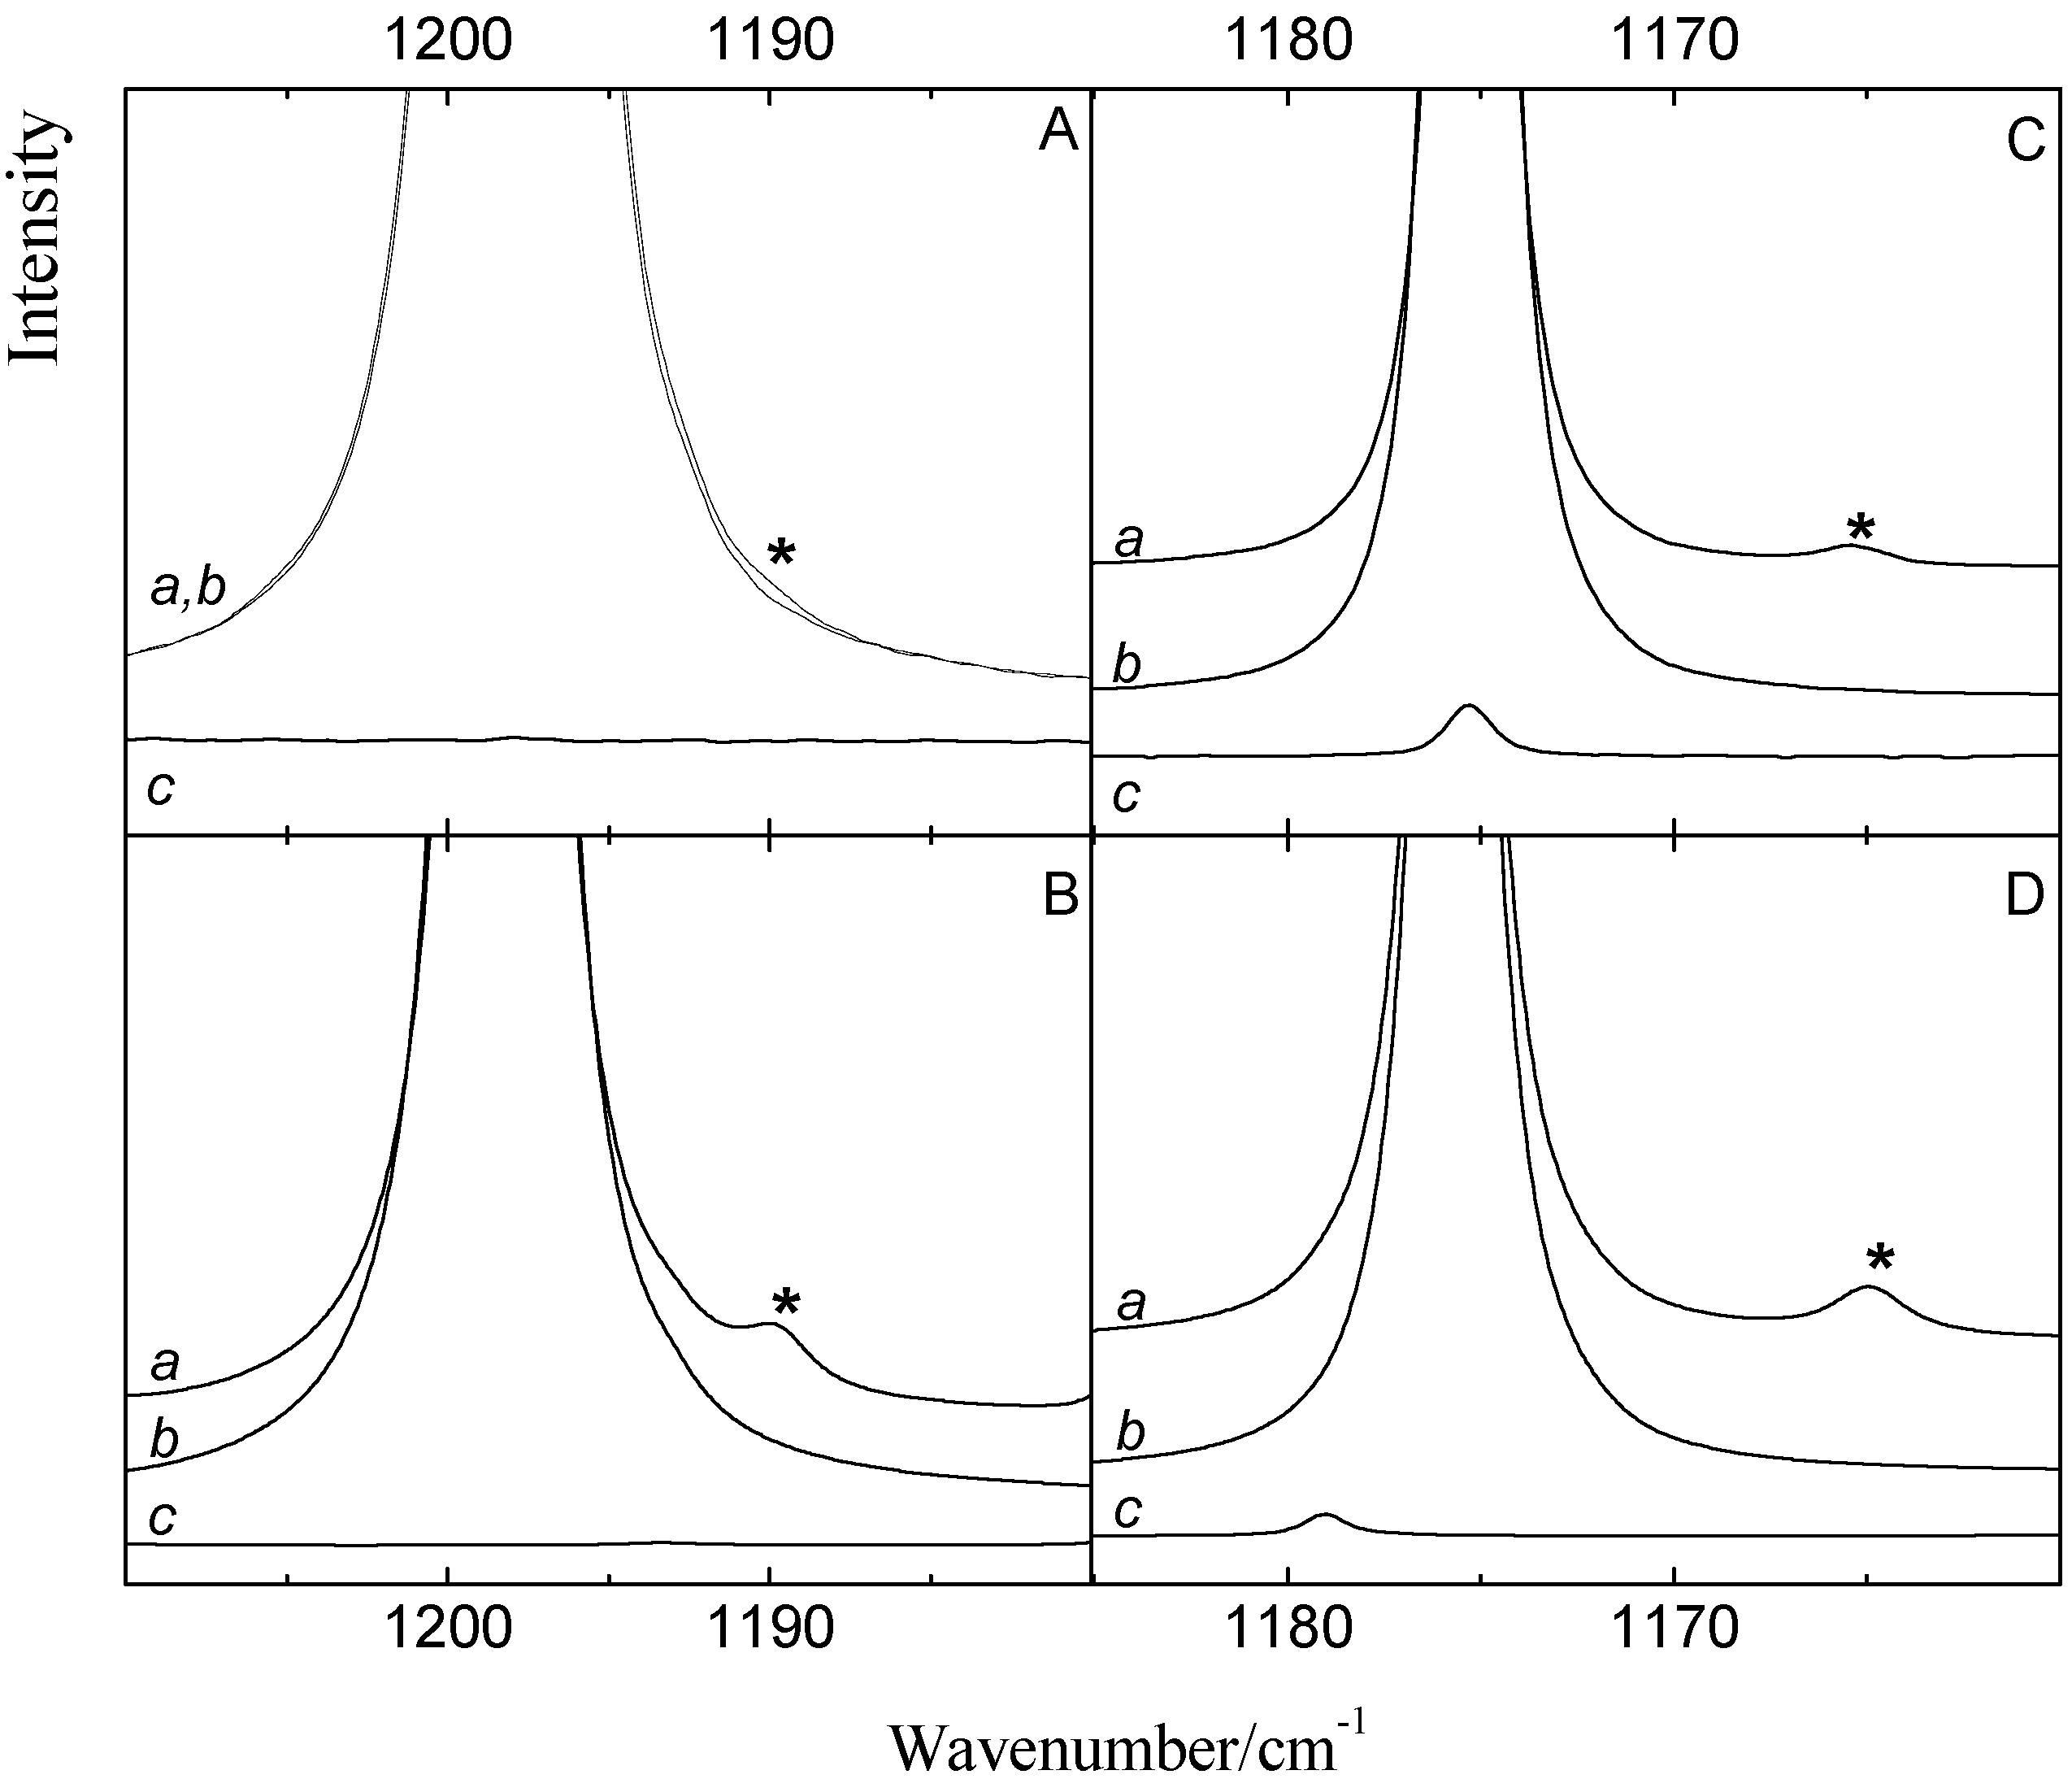

 is linearly related to the product of the mth power of the monomer band area IA and the nth power of the monomer band area IB. By plotting the complex band area Icomplex versus the products of the monomer band areas (IA)x(IB)y for various integer values of x and y, the stoichiometry of the complex can be deduced.
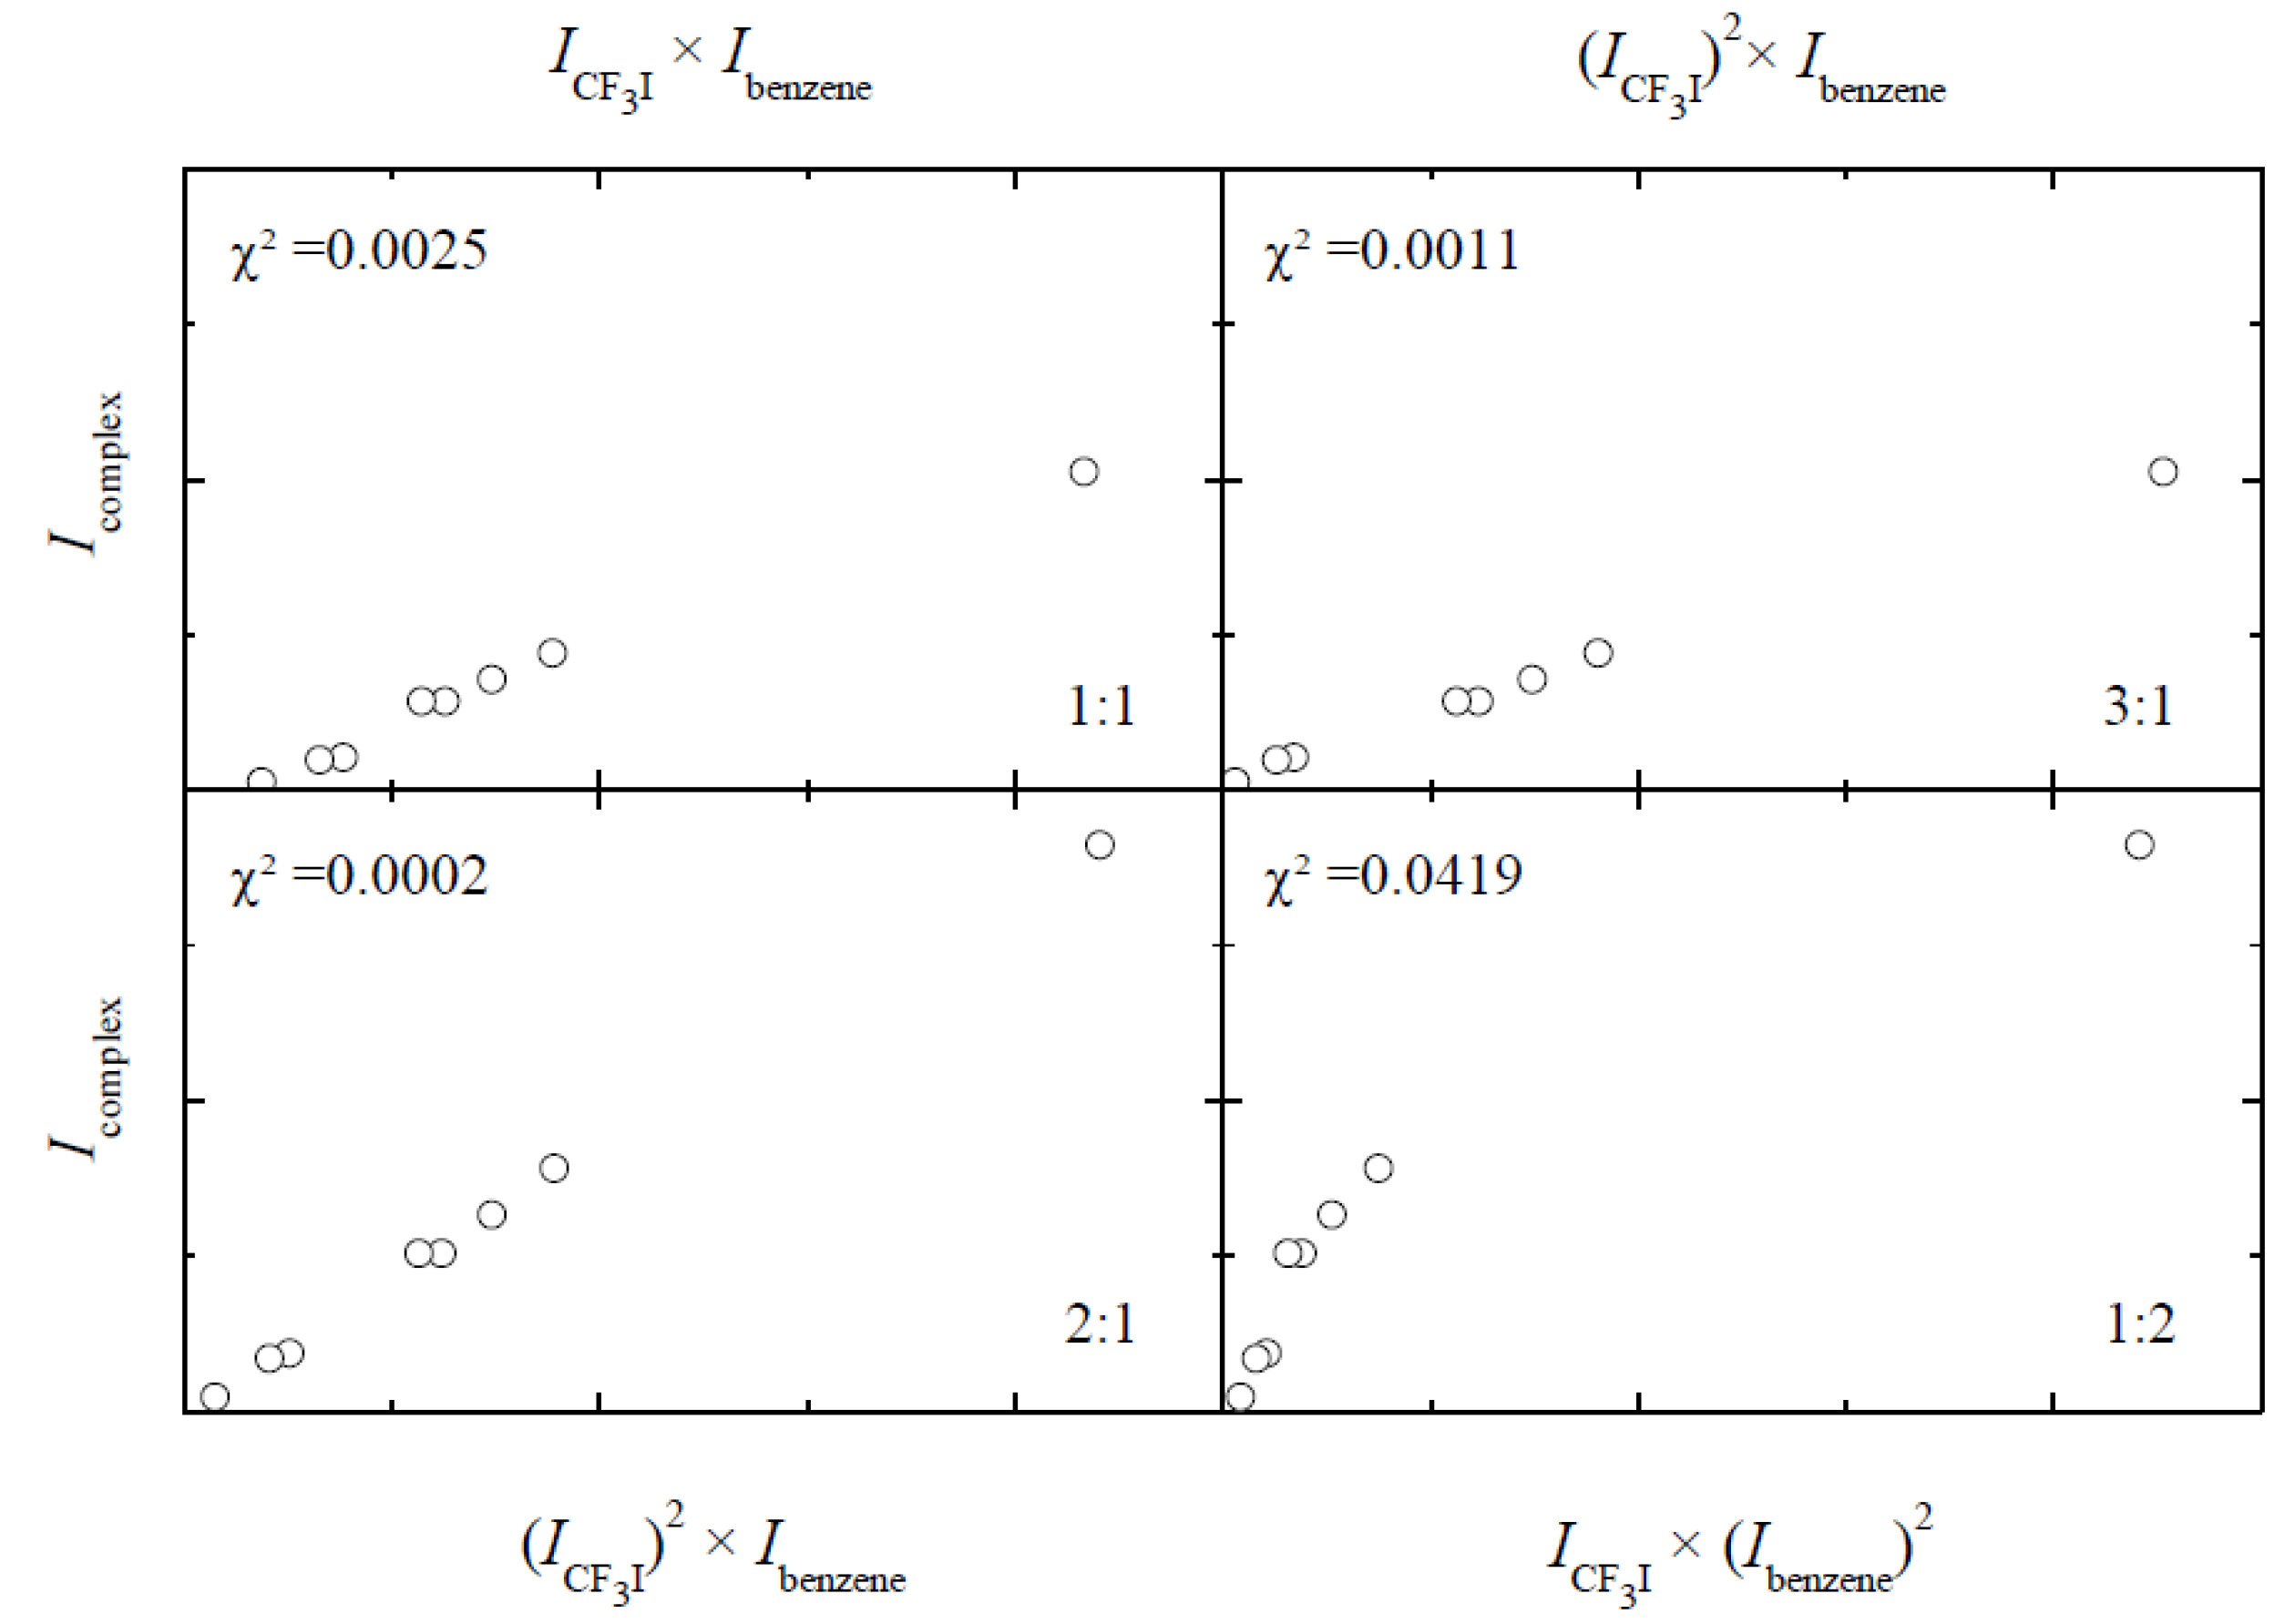
 . The slopes of these relations equal
  where b is a correction factor to account for the changes in solvent density upon temperature variation [26].
 (CF3I.)2benzene, is −14.5(9) kJ mol−1.