Article

Using Exergy to Correlate Energy Research Investments and Efficiencies: Concept and Case Studies

Faculty of Engineering and Applied Science, University of Ontario Institute of Technology, 2000 Simcoe Street North, Oshawa, Ontario, L1H 7K4, Canada
Entropy 2013, 15(1), 262-286; https://doi.org/10.3390/e15010262
Submission received: 30 November 2012 / Revised: 28 December 2012 / Accepted: 5 January 2013 / Published: 16 January 2013
(This article belongs to the Special Issue Exergy: Analysis and Applications)

Abstract

:
The use of exergy to correlate energy-utilization efficiencies and energy research investments is described. Specifically, energy and exergy losses are compared with energy research and development expenditures, demonstrating that the latter correlates with energy losses, even though it would be more sensible to allocate energy research and development funding in line with exergy losses, as they represent the actual deviation of efficiency from the ideal. The methodology is outlined and illustrated with two case studies. The case studies consider the province of Ontario, Canada and the United States. The investigation utilizes data on the energy utilization in a country or region, including flows of energy and exergy through the main sectors of the economy. The results are expected to be of use to government and public authorities that administer research and development funding and resources and should help improve the effectiveness of such investments.

1. Introduction

For several decades, there has been considerable concern about the finite amount of energy resources available and the effect of energy utilization on the environment. Since energy resources are used for transportation, home heating, industrial operations and other processes, such concerns can only be addressed if energy resources are utilized advantageously in countries and regions as well as their sectors.
The energy utilization of a country or region is conventionally analyzed by examining the flows of energy through various sectors of the economy, and such statistics are widely reported, e.g., by organizations like the International Energy Agency [1,2]. This energy analysis is based on the first law of thermodynamics, which states that energy is conserved in every process and cannot be destroyed. The first law of thermodynamics is very useful in certain circumstances, but can be misleading when used to analyze how effectively energy is utilized. Analyses based on this law often indicate the main inefficiencies to be in the wrong sectors, and tend to state a technological efficiency higher than actually exists.
It is the view of the author that in order to properly assess how well a country or region utilizes its energy resources, an examination of the flows of exergy, rather than energy, through the sectors is required. Exergy analysis is based on the first and second laws of thermodynamics. Losses in processes where high quality energy is used for low quality demands can be accounted for with exergy analysis, whereas with energy analysis they cannot.
The application of exergy analysis has in the past several decades received increasing recognition by many researchers in industry, academia and government as a powerful tool for assessing and improving efficiency [3,4,5,6]. The author has performed research related to the development and refinement of the procedures used in applying exergy analysis to energy systems, and has used exergy analysis to analyze energy utilization in various countries, including Canada, Turkey and Saudi Arabia.
Given that exergy is often viewed as a measure of value of energy resources, research has been carried out on the relation of exergy to economics and several related tools have been developed. One outcome of this research is the suggestion that financial investments in energy R&D should be related to or guided by exergy rather than energy measures. This work extends that research.
The principal objective of the work reported here is to analyze the R&D allocations in the energy sectors and compare these allocations to sector energy and exergy losses. This investigation is intended to yield insights on how R&D funding and effort can best be allocated. The research utilizes assessments of energy resource use in countries and regions, aimed at determining the efficiency with which energy resources are utilized and based on energy and exergy analyses.

2. Background

2.1. Exergy

Exergy is a measure of the usefulness or quality or value of energy and other commodities [5]. Exergy is the thermodynamic property which measures the potential of a system to do work and, unlike energy, is not conserved. Any degradation energy, via irreversible processes such as friction, heat transfer across a finite temperature difference and unconstrained expansion, results in exergy destruction.
Exergy analysis is a technique for evaluating meaningful efficiencies, i.e., those that measure how far the efficiency of a system or process deviates from ideality, as well as for pinpointing the causes, locations and magnitudes of losses. By accounting for the usefulness or quality of an energy quantity, exergy analysis is particularly helpful for identifying the causes of inefficiencies. Energy efficiencies and losses do not in general provide such insights. But exergy analysis is often used, sometimes with great benefit, in the analysis and design of engineering technologies and systems (e.g., electricity generation and cogeneration plants, chemical and petrochemical facilities, manufacturing and production companies).
A simple example illustrates well the difference between energy and exergy. Consider a large enclosure consisting of a small container of fuel surrounded by air in abundance. The fuel is combusted in the air, yielding a slightly warm mixture in the enclosure of combustion products and air. Although the total quantity of energy in the enclosure is unchanged, the initial fuel-air combination has greater potential (quality) than the final warm gas mixture. The fuel is intrinsically more useful, as it can be used in some devices to generate electricity, produce superheated vapour and so on, whereas the uses to which warm combustion products can be put are far more limited. Since only a low-quality product, in the form of a warm mixture, is achieved in this process, the initial potential of the fuel has been largely destroyed.
Bryant [7] and others suggest that the first and second laws of thermodynamics have significant implications for economic theory. Further, many researchers observe that exergy, but not energy, is often a consistent measure of economic value, and that accounting and pricing are better performed when based on exergy rather than energy. For instance, costs based on exergy are more rationally distributed among outputs, since exergy-based unit costs are more meaningful than energy-based ones. Several exergy-based economic-analysis techniques have been developed, usually to help determine appropriate allocations of economic resources for optimal or improved systems and operations, aid design efforts, and enhance economic feasibility and profitability. Exergy-based economic techniques include exergoeconomics, thermoeconomics, exergy-based pricing, EXCEM analysis and analysis based on the ratio of thermodynamic loss to capital cost [5,8,9,10,11,12,13,14,15,16,17].

2.2. Exergy Analysis of Regions and Countries

Exergy methods can be applied not only to devices and systems, but also to agglomerations of systems. In particular, regional, national and global energy systems as well as sectors of an economy can be assessed with exergy methods. Such assessments can reveal significant insights useful for identifying efficiency limits and margins for improvement. By describing the use of energy resources in society in terms of exergy, important knowledge and understanding is gained, and areas are identified where large improvements can be attained by applying measures to increase efficiency [5,18,19]. Such insights can help identify and prioritize areas in which technical and other improvements should be undertaken in regions and countries, and in economic sectors.

2.2.1. Regional and National Applications of Exergy Analysis

During the past few decades, exergy has been increasingly applied to regions and countries, as well as economic sectors. Some investigations have focused on general analysis methods, including a review of methods for evaluating the energy utilization efficiency of countries [20]. Also, exergy analyses have been compared for various societies, including the Organization for Economic Co-operation and Development (OECD) countries and the world [21]. Exergy-based analyses have been performed for numerous countries, e.g., Canada [3,4], the United States [18,22], Japan [19,23], China [24,25,26], the United Kingdom [27,28,29,30], Finland [23], Sweden [23,31,32], Norway [21,34], the Netherlands [35], Italy [36], the former U.S.S.R. [37], Turkey [5,38,39], Saudi Arabia [5] and Brazil [40]. On a broader scale, global exergy-based analyses have been carried out [41,42,43], as have evaluations of the exergy consumption of the earth [44,45].
Some studies have focused on particular sectors in isolation, rather than as part of a larger assessment:
  • Industrial: Exergy was utilized to assess energy and materials processing in industry and to compare industries [46]. Assessments have been undertaken of exergy use in industrial processes using artificial intelligence [47] and the effect of reference-state temperatures on exergy assessments of industrial sectors [48]. Wall [49] has examined energy and exergy flows in industrial processes. The industrial sectors of several countries have been investigated using exergy, including Turkey [50,51] and South Africa [52]. The global industrial sector has also been examined with exergy methods [43].
  • Agricultural: Energy and exergy utilization in the agricultural sector of Saudi Arabia has been investigated [53].
  • Residential and commercial: Genetic algorithms for estimating exergy inputs and outputs have been reported [54], as have investigations of the effect of the reference state on efficiencies for the residential and commercial sectors [55]. Residential sectors have been investigated using exergy for several countries, including Jordan [56], Turkey [57,58,59,60], with the latter investigation including a thermoeconomic analysis, and Malaysia [61,62], with the latter including an assessment of the commercial sector.
  • Utility: Exergy assessments have been reported for the utility sectors of Turkey [63] and Saudi Arabia [64].
  • Transportation: Exergy assessments have been reported for Turkey [65,66], Greece [67], Jordan [68], China [69], Malaysia [70] and Italy [71].
  • Public and private: Energy and exergy use in the public and private sector of Saudi Arabia has been assessed [72].
The main results of the Canadian study [3] provide several significant conclusions, which tend to be typical of the results for other countries and regions:
  • Exergy analysis indicates a less efficient picture of energy flow through the country's economy than does energy analysis.
  • The residential-commercial sector shows the most variation of all the sectors, depending on whether an energy or exergy analysis is considered. This is due to the extent to which high-grade energy sources are utilized for low-grade energy demands.
  • The most significant efficiency differences between energy and exergy analyses are caused by thermal processes (heating and cooling).
  • Several aspects of this research could yield important industrial and socio-economic benefits. Specifically, using the results of the present research rather than the results of the energy balances conventionally used today, the author feels that the efficiency of national and regional energy utilization is more clearly illuminated, and more rational assessments are obtained of how R&D effort related to energy systems is presently allocated and could be made in the future. Consequently, the results could provide important guidelines and insights, to both energy industries and governments, for developing the most appropriate energy systems and making energy R&D investments.
Dincer and Rosen [5] have compared energy use in countries with varied characteristics (Canada, Turkey, Saudi Arabia), by obtaining energy and exergy efficiencies for the main sectors of their economies (see Table 1). The province of Ontario, Canada is also considered in the comparison in Table 1. In most cases, the residential sector is the most efficient on an energy basis and the least efficient on an exergy basis. Although based on data for different years, the comparison in Table 1 nonetheless illustrates similarities and differences in the energy and exergy utilization for different types of countries. For example, Saudi Arabia in the year 2000 was observed to have energy and exergy efficiencies, respectively, of 53% and 35% for the overall country, 84% and 9% for the residential sector, 58% and 7% for the public and private sector, 63% and 40% for the industrial sector, 22% and 22% for the transportation sector, 27% and 21% for the agricultural sector, and 31% and 31% for the utility sector. Note that depending on the analysis method and data used exergy assessment results can vary for the same country. For instance, analyses by Ozdogan and Arikol [38] of Turkish energy conversion and use yielded results different than those for Turkey in Table 1. Ozdogan and Arikol determined energy and exergy efficiencies, respectively, to be 15% and 15% for transportation, 45% and 45% for thermal and hydropower plants, 55% and 6% for residential and commercial uses, 58% and 33% for industrial applications and 35% and 13% for the country. It is further noted that energy and exergy utilization in the U.S. appears similar qualitatively to that of Canada and Ontario, indicating common efficiencies and energy-use trends.
Table 1. Comparison of sector and overall energy and exergy efficiencies for Canada, Turkey, Saudi Arabia and the Canadian province of Ontario *.
SectorEnergy Efficiency, η (%)Exergy Efficiency, ψ (%)
OntarioCanadaTurkeySaudi ArabiaOntarioCanadaTurkeySaudi Arabia
Residential-commercial 7072698121141210
Transportation1819222218192222
Industrial6573686345424240
Utility3953453239534532
Overall4351426024242639
* Source: Dincer and Rosen [5]. Data are from 1993 for Turkey and Saudi Arabia, 1986 for Canada, and 1987 for Ontario.

2.2.2. Details on Methodology for Exergy Analysis of Regions and Countries

For completeness, technical details are provided on the exergy methodology, as applied to regions and countries.

2.2.2.1 Efficiencies for Processes in Regions and Countries

Energy efficiency η and exergy efficiency ψ values for the principal processes in regions are usually based on standard definitions:
η = ( Energy in products ) / ( Total energy input )
ψ = ( Exergy in products ) / ( Total exergy input )
Several processes dominate the energy utilization in regions and countries, and the evaluation of efficiencies for these is described below:
  • Work production: Electric and fossil-fuel work production processes produce shaft work W. The energy and exergy efficiencies for shaft work production from electricity We are both η = ψ = W/We, while the energy and exergy efficiencies for shaft work production from fuel are both η = ψ = W/mfHf. Here, mf denotes the mass of fuel and Hf the energy content of fuel in terms of its heating value (usually higher).
  • Electricity generation: The efficiencies for the generation of electricity We from fuel are both η = ψ = W/mfHf.
  • Heating: Electric and fossil fuel heating processes are taken to generate product heat Qp at a constant temperature Tp, either from electrical energy We or fuel mass mf. The energy efficiency for electrical heating is η = Qp/We and the exergy efficiency is ψ = Qp(1 – To/Tp)/We, where To denotes the reference-environment temperature. For fuel heating, the energy efficiency is η = Qp/mfHf and the exergy efficiency is ψ = Qp(1 – To /Tp)/mfHf.
  • Cooling: Electric cooling removes heat Qp at a constant temperature Tp using electrical energy We. The energy efficiency for electric cooling is η = We/Qp and the exergy efficiency is ψ = Qp(1 – To/Tp)/We. Analogous efficiencies can be determined for thermally driven cooling using absorption chillers.
  • Kinetic energy production: The efficiencies for the fossil fuel-driven kinetic energy production processes, which occur in mainly in the transportation sector and which produce a change in kinetic energy Δke in a stream of matter ms, are both η = ψ = msΔke/mfHf.

2.2.2.2. Energy and Exergy Values for Commodities in Regions and Countries

The exergy of an energy resource can for simplicity often be expressed as the product of its energy content and an exergy-to-energy ratio for the energy resource, which can be viewed as a quality factor. Exergy-to-energy ratios for some energy forms are listed in Table 2.
Table 2. Quality factors for some common energy commodities *.
Energy CommodityExergy-Energy Ratio
Shaft work1
Electricity1
Steam at 600°C0.6
Water at 90°C0.2
Heat at the reference-environment temperature, To0
Chemical energy for most hydrocarbon fuels0.85-1.1
* Source: Dincer and Rosen [5].
In assessments of regions and nations, the most common material flows often are hydrocarbon fuels at near-ambient conditions. The physical exergy for such material flows is approximately zero, so the exergy, which is comprised of physical and chemical exergy, reduces to the chemical exergy. The specific chemical exergy of a fuel at the reference-environment temperature To and pressure Po is usually approximately equal to its higher heating value.

2.2.2.3. Reference Environment for Regions and Countries

The reference environment used in many assessments of regions and countries is based on the model of Gaggioli and Petit [73], which has a temperature To = 25 °C, pressure Po = 1 atm, and a chemical composition consisting of air saturated with water vapour and the following condensed phases at 25 °C and 1 atm: water (H2O), gypsum (CaSO4∙2H2O) and limestone (CaCO3). This reference environment model is used in this analysis, except that necessary modifications are made for some processes (e.g., using a reference-environment temperature that is representative of the mean annual or seasonal temperature of the region considered).

2.3. Assessment of Links between Exergy and Research Funding in Countries and Regions

Several researchers have suggested linkages between energy R&D investments and exergy factors [5]. However, little research relating exergy efficiencies or inefficiencies to energy R&D for countries or regions appears to have been undertaken. Only two preliminary studies have been reported, to the best of the author's knowledge. These were carried out over 20 years ago for the U.S. [74,75] and the Canadian province of Ontario [76], and form the basis of the case studies considered here.

3. Methodology

One recommendation by the author a study of Canadian energy utilization [3] was to analyze R&D funding in Canada or a subset thereof and to compare it to the corresponding energy and exergy efficiencies. The intention of that recommendation was to determine if R&D funding is being allocated as beneficially as possible, by assessing whether R&D allocations were being made based primarily on an energy analysis of a sector or on the more rational exergy analysis.
This idea is reinforced by Gaggioli [75], who wrote, “exergy methods for analyzing “energy” systems are the key to pinpointing the losses and consumptions, for measuring their magnitudes and resultant per cent inefficiencies, in order to determine where opportunities for improvement and conservation lie, for the purposes of decision-making for allocation of resources—capital, research and development efforts, and so on. The exergy methods, which involve exactly the same kind of calculations as energy analyses, are a valuable first step for ascertaining likely prospects (opportunities) for cost effective capital expenditures for “energy” conservation.” Some preliminary research in this area was performed by Gaggioli [74,75].
The methodology employed in this investigation to compare R&D spending in a system with the energy and exergy losses of that system is based on that utilized by Gaggioli [74,75]. The methodology involves four main steps.
In the first step, the country or region is modeled. One such model is shown in Figure 1, where four main economic sectors are considered: residential-commercial (including institutional), industrial, transportation and utility (electrical and other). In analyzing such a system, the energy and exergy flows through the overall system and its sectors are evaluated, and efficiencies and losses are determined. To model and assess the individual sectors, each is broken down into its main categories and the categories are divided into specific types. For instance, transportation can be broken down into land, air and water categories, and several types of transportation can be considered for each category (e.g., road and rail for land transportation). Energy and exergy efficiencies can be determined for each of the processes occurring in the system, the main ones of which are heating (electric, fossil fuel, other), cooling (electric, thermal, other), work production (electric, fossil-fuel), electricity generation and kinetic energy production. The industrial sector is particularly complex due to the range of processes occurring in it [77]. A reference environment must be specified to evaluate exergy commodities and, in the present analysis, a reference environment which simulates the natural environment is utilized.
In the second step, energy and exergy efficiencies and inefficiencies are evaluated for a region or country, and for its sectors. For energy or exergy, the inefficiency is the difference between one (or 100% on a percentage basis) and the corresponding efficiency. The fraction of the total energy loss for a sector is considered the perceived inefficiency. This quantity is believed by many not to represent a true picture of inefficiency, despite public perception [5,74,75]. The fraction of total exergy loss (internal destructions plus waste emissions) for a sector is considered the actual inefficiency or real inefficiency. This label is justified, since the value measures how far the efficiency deviates from the ideal efficiency and is therefore meaningful.
Figure 1. Model of a region, country or the world, showing flows of resources like energy.
Entropy 15 00262 g001
The perceived and actual inefficiencies for a sector can be determined. For a sector j, for instance,
Sector j perceived inefficiency = 1 – ηj = (Sector j energy loss/Sector j energy input)
Sector j actual inefficiencies = 1 – ψj = (Sector j exergy loss /Sector j exergy input)
where ηj denotes the energy efficiency and ψj the exergy efficiency of sector j.
It is sometimes more informative to consider the breakdown of the total inefficiencies by sector. Then, we can write
Fraction of perceived inefficiency for sector j = (Sector j energy loss/Total energy loss)
Fraction of actual inefficiency for sector j = (Sector j exergy loss /Total exergy loss)
In the third step, funding allocations by the relevant entities (government, private sector, etc.) to R&D in the different sectors are acquired and assessed to ensure they are properly interpreted.
In the fourth step, the R&D funding allocations to the different sectors are compared with the energy and exergy inefficiencies to help assess how the justified the allocations are and to help recommend future allocations.
Consequently, the approach to the research involves the following main tasks:
  • determination of energy and exergy losses for the country or region and for each of its sectors;
  • acquisition of up-to-date data on sector and overall allocations of energy R&D in the country or region (i.e., the quantity of money allocated and the types of projects related to energy R&D); and
  • comparison of energy and exergy loss values to R&D allocations for each energy sector, along with interpretation of the results and development of appropriate conclusions.
The second task in the analysis, which often utilizes extensively previous research into the efficiency of energy and exergy use in societies or their sectors, is typically accomplished using the following steps:
  • acquisition of data on energy utilization in the country or region (i.e., the quantities and types of energy flowing into and out of the various sectors of the country or region);
  • evaluation of the exergy values associated with each of the energy flows, so that an understanding of exergy utilization in country or region can be obtained; and
  • determination of energy and exergy efficiencies for each of the sectors as well as the overall country or region.
As pointed out earlier, exergy has been increasingly applied over several decades to regions and countries, as well as their economic sectors, using the methodology described above or variations or extensions of it.

4. Case Studies

The author utilizes the methodology described in the previous section to compare R&D spending with energy and exergy losses in the United States and in Ontario, Canada's most populous province. Only two case studies are considered here because only a few analyses of this type have been carried out. The case studies are based on previous analyses, and permit the relation between R&D spending and energy and exergy losses in the U.S. and Ontario to be analyzed and contrasted. Although the results presented are based on past data, implications can be inferred from them for the present and future, and are discussed subsequently.

4.1. Case Study for Ontario, Canada

In this case study, the author uses the methodology described earlier to assess and compare R&D spending with energy and exergy losses, for the province of Ontario, Canada and for its sectors. Such a regional analysis is important not just for Ontario, but also for Canada, since Ontario consumes over 30% of all the energy resources used nationally. Efforts to improve the efficiency with which energy resources are utilized in Canada and to ensure they are used in the most appropriate manner require careful attention to a province as significant as Ontario. This case study utilizes results of energy and exergy analyses of Ontario's energy sectors that were carried out to identify the processes that use significant amounts of energy resources and to assess how effectively the resources are utilized.

4.1.1. R&D Funding Data

Energy R&D in Ontario occurs primarily in the private sector and in universities. There are three main sources of funding for these projects: the federal and provincial governments and the private sector. A variety of programs within the federal and provincial governments exists from which universities and companies obtain energy research funding. For example, a major federal funding body is the Natural Sciences and Engineering Research Council (NSERC). Two Ontario funding programs at the time the data for this investigation were acquired were the University Research Incentive Fund (URIF) of the Ministry of Colleges and Universities and the Enersearch program of the Ministry of Energy.
Accessing data for all R&D projects in Ontario's energy sector as well as their sources of funding was deemed impractical for the case study due to the variety of R&D sources. For this study, therefore, the authors chose to assess spending only in the Enersearch program. It is expected that research spending trends in this program are somewhat representative of all energy R&D efforts in Ontario, justifying this simplification. This simplification was made for the following reasons:
  • The requirements for Enersearch funding for a project are broad enough to encompass energy-related projects in all sectors. The Ontario Ministry of Energy [78] stipulated that Enersearch projects are required to be directed toward such goals as:
    Reducing energy demand through the application of innovative technology to achieve efficient utilization of existing energy sources.
    Developing innovative technology to gain additional supplies from alternative and renewable sources.
    Developing the equipment and capabilities required to utilize these new energy forms.
    Encouraging replication and use of new energy processes and innovative technologies among potential users.
  • The range of activities to which Enersearch applies is broad, and include [78]:
    Research and laboratory testing (proving scientific concepts).
    Equipment development and testing (proving engineering processes and equipment).
    Pilot plant equipment.
    Full-scale field trials and technical demonstrations of innovative technologies to determine system performance, reliability and economics.
    Initial demonstrations of existing technologies used outside Canada to determine their suitability for application in Ontario.
    Technology and information transfer of results obtained during research, development and demonstration activities.
  • The program applies to a broad range of energy technologies, including [78]:
    Fuel research and evaluation.
    Transportation equipment.
    Bio-energy conversion.
    Electro-technologies.
    Energy production from waste and biomass.
    Residential, industrial and commercial building technologies.
    Energy-efficient industrial processes.
    Heat recovery and recuperation.
    Hydrogen technology.
    Renewable energy systems.
  • A wide variety of organizations can apply for funding under this program, including [78]:
    Energy equipment manufacturers and suppliers.
    Industrial and commercial energy users and producer.
    Consulting firms.
    Industrial and research organizations (but excluding electric utilities and publicly funded institutions except when they are in support of private sector proponents).
  • Enersearch participated in over sixty projects totalling $27 million between 1986 and 1989, making it the largest government energy R&D program for Ontario.
  • The projects undertaken in this program by the participants received an average total government contribution of 33% of their projected eligible net cost. With this substantial yet limited government contribution to the project, the participants incur a large portion of the R&D costs thus projects are typically well planned and thought out. Further, the projects thus directly account for private-sector R&D expenditures as well as those by government.
The funding data were processed to render them suitable for the investigation. In order to analyze the research initiatives under the Enersearch program, a summary of the approved Enersearch projects was obtained (Appendix C of Lemieux and Rosen [76,78]). These projects are divided into two categories by the Ministry of Energy: projects related to improved energy efficiency and projects related to new energy supply. In order to assess R&D funding for individual sectors, the sector (or sectors) are determined to which each project is most applicable. However, some projects are applicable to more than one sector. Therefore, the sum of the individual sector funding is greater than the actual total funding. The total project cost (Appendix C of Lemieux and Rosen [76,78]), which includes both private sector and government funding, is used to determine the total funding for each sector. Sector allocation totals are determined by summing the total project costs of each project in a sector.

4.1.2. Energy and Exergy Data

Actual inefficiencies and perceived inefficiencies evaluated elsewhere (Section 6.1 of Lemieux and Rosen [4,76]) are used. These inefficiencies are determined from the sector and total waste quantities given for Ontario in Figure 2 for energy and Figure 3 for exergy. Data for determining the energy flows were obtained from numerous sources [79,80,81,82,83,84].
Figure 2. Energy flow diagram for Ontario (in PJ or 1015 J) for 1987. The hatched region denotes losses and the note “1/” indicates steam extracted from the utility sector. Hydraulic energy is shown in kinetic energy equivalent.
Entropy 15 00262 g002
Figure 3. Exergy flow diagram for Ontario (in PJ or 1015 J) for 1987. The hatched region denotes losses (external exergy emissions and internal exergy destructions) and the note “1/” indicates steam extracted from the utility sector. Hydraulic exergy is shown in kinetic exergy equivalent.
Entropy 15 00262 g003
It is observed that 43% of the total energy consumed in Ontario is converted to useful energy. The most efficient sector on an energy basis is the residential sector with an efficiency of 74%, followed closely by the commercial and industrial sectors with efficiencies of 66% and 65% respectively. The least efficient sector on an energy basis is the transportation sector with an efficiency of 18%.
The exergy analysis indicates that 24% of Ontario's exergy consumption is converted into useful exergy for end uses. The most efficient sector based on exergy is the industrial sector (45%), followed by the utility sector (39%), the commercial sector (27%), the transportation sector (18%) and finally the residential sector (16%).
The reason for the low exergy efficiencies in the residential and commercial sectors is due to the poor utilization of the quality (or work potential) of the energy entering these sectors. In each of these sectors, the primary use of energy is to produce heat. With the production of heat from a fossil fuel or electrical energy source, there is a loss in the quality of energy that can be reflected only with an exergy analysis. The lower the temperature of the heat produced, the lower is the exergy efficiency. The residential, commercial and industrial sectors exhibit a wide variation between energy and exergy efficiencies. This is attributable to the extent to which heating and cooling processes occur in these sectors.
Note that the exergy analysis of Ontario compares well with similar analyses for Canada [3] and the U.S. [18,75,85,86]. For instance, the overall energy and exergy efficiencies respectively are shown in Table 1 to be 43% and 24% for Ontario and 51% and 24% for Canada. Furthermore, sectoral efficiency trends for Canada are similar to those illustrated for the analysis of Ontario in all but the utility sector. In Table 1, for example, the industrial, transportation and residential-commercial sectors in Ontario exhibit exergy efficiencies of 45%, 19%, and 21% respectively, while in Canada these sectors exhibit exergy efficiencies of 42%, 19%, and 14% respectively. The utility sector in Ontario does not follow the trend of the national average, having an efficiency of 39% compared to Canada's 53%. The Ontario utility sector has a lower efficiency than that of Canada due to the extent to which electricity is produced by nuclear utilities in Ontario. The reason for this is that Canada produces a larger percentage of its electricity in highly efficient hydraulic-based utilities than Ontario, which produces about half of its electricity in less efficient nuclear-based utilities.

4.1.3. Analysis

The methodology described earlier for comparing energy R&D funding with energy and exergy efficiencies is utilized, by comparing R&D budget allocations with actual inefficiencies and the actual and perceived inefficiencies.

4.1.4. Results and Discussion

4.1.4.1. Energy Research and Development Budget Allocations

The allocations for energy R&D funding in Ontario and each of its five sectors via Enersearch projects for the period May 1986 to April 1989 are listed in Table 3, in absolute terms and as a percentage of the overall budget allocation.
Based on these data, the sector that receives the most funding is the industrial sector, with approximately 54% of the spending in the Enersearch program. The funding allocations range from 2% ($1,133,101) in the commercial sector to 54% ($24,793,117) in the industrial sector. It is noted that the actual total R&D allocations made through the Enersearch program are approximately $26.8 million and not $46.0 million shown in Table 3. This inflated overall amount is due to the manner in which projects are treated that are applicable to more than one sector, as discussed earlier.
Table 3. Research and Development Funding Data for All Sectors in Ontario *.
SectorTotal project costs ($)Breakdown of budget allocation (%)
Residential3,278,5247
Commercial1,133,1012
Industrial24,793,11754
Transportation6,806,83415
Utility10,008,47122
Overall46,020,047100
* Data are obtained from [78].

4.1.4.2. Sector Inefficiencies

A breakdown of inefficiencies for Ontario and each of its sectors is listed in Table 4, based on data in Figure 2 and Figure 3.
A sample calculation for the industrial sector is presented of the breakdown of energy (perceived) and exergy (actual) inefficiencies listed in Table 4 From Figure 3, it can be seen that the industrial sector contributes 613.5 PJ of waste exergy to the overall waste exergy (2454.3 PJ). Therefore, the actual inefficiency contribution of the industrial sector is as follows:
Contribution of industrial sector to overall actual inefficiency = 613.5/2454.3 = 0.25 (or 25%)
The perceived inefficiency breakdown is calculated similarly but using the waste energy values of Figure 2, which show that the industrial sector contributes 398.4 PJ of waste energy to the overall waste energy (1875.8 PJ). Therefore,
Contribution of industrial sector to overall perceived inefficiency = 398.4/1875.8 = 0.21 (or 21%)
Table 4. Comparison of Breakdowns of Sectoral Inefficiencies with Sectoral Energy Research and Development Budget Allocations for Ontario.
SectorBreakdown of Overall InefficienciesBreakdown of Total Energy R&D Budget Allocations (%)
Portion of perceived inefficiency attributable to sector (%)Portion of actual inefficiency attributable to sector (%)
Residential-commercial12249
Industrial212554
Transportation272015
Utility403122
Overall100100100

4.1.4.3. Relation between Energy Sector R&D Funding and Inefficiencies

The breakdowns of actual and perceived inefficiency values for Ontario and its sectors are compared with the breakdown of values for energy sector R&D funding in Table 4. The breakdown in total energy R&D allocations in that table is based on data in Table 3. Several trends are evident in Table 4, two of the most prominent of which are as follows:
  • Actual inefficiencies are higher than the perceived inefficiencies in the residential-commercial sector and the industrial sector. For the transportation and utility sectors, the actual inefficiencies are lower than the perceived inefficiencies.
  • A relationship is observed between perceived inefficiency and R&D allocations, in that energy R&D budget allocation increases as sector perceived inefficiency increases for all sectors in Ontario (except the industrial sector).
These two trends in the Ontario analysis support the existence of a relationship between R&D allocations and perceived inefficiency levels. It appears that, of all factors affecting energy R&D budget allocations to the sectors, the perceived inefficiency is significant and the actual inefficiency is of less importance or is overlooked. If actual inefficiencies were considered in R&D budget allocations, one would expect to observe more funding for the residential-commercial and utility sectors, because these are the sectors with the largest margins for improvement.

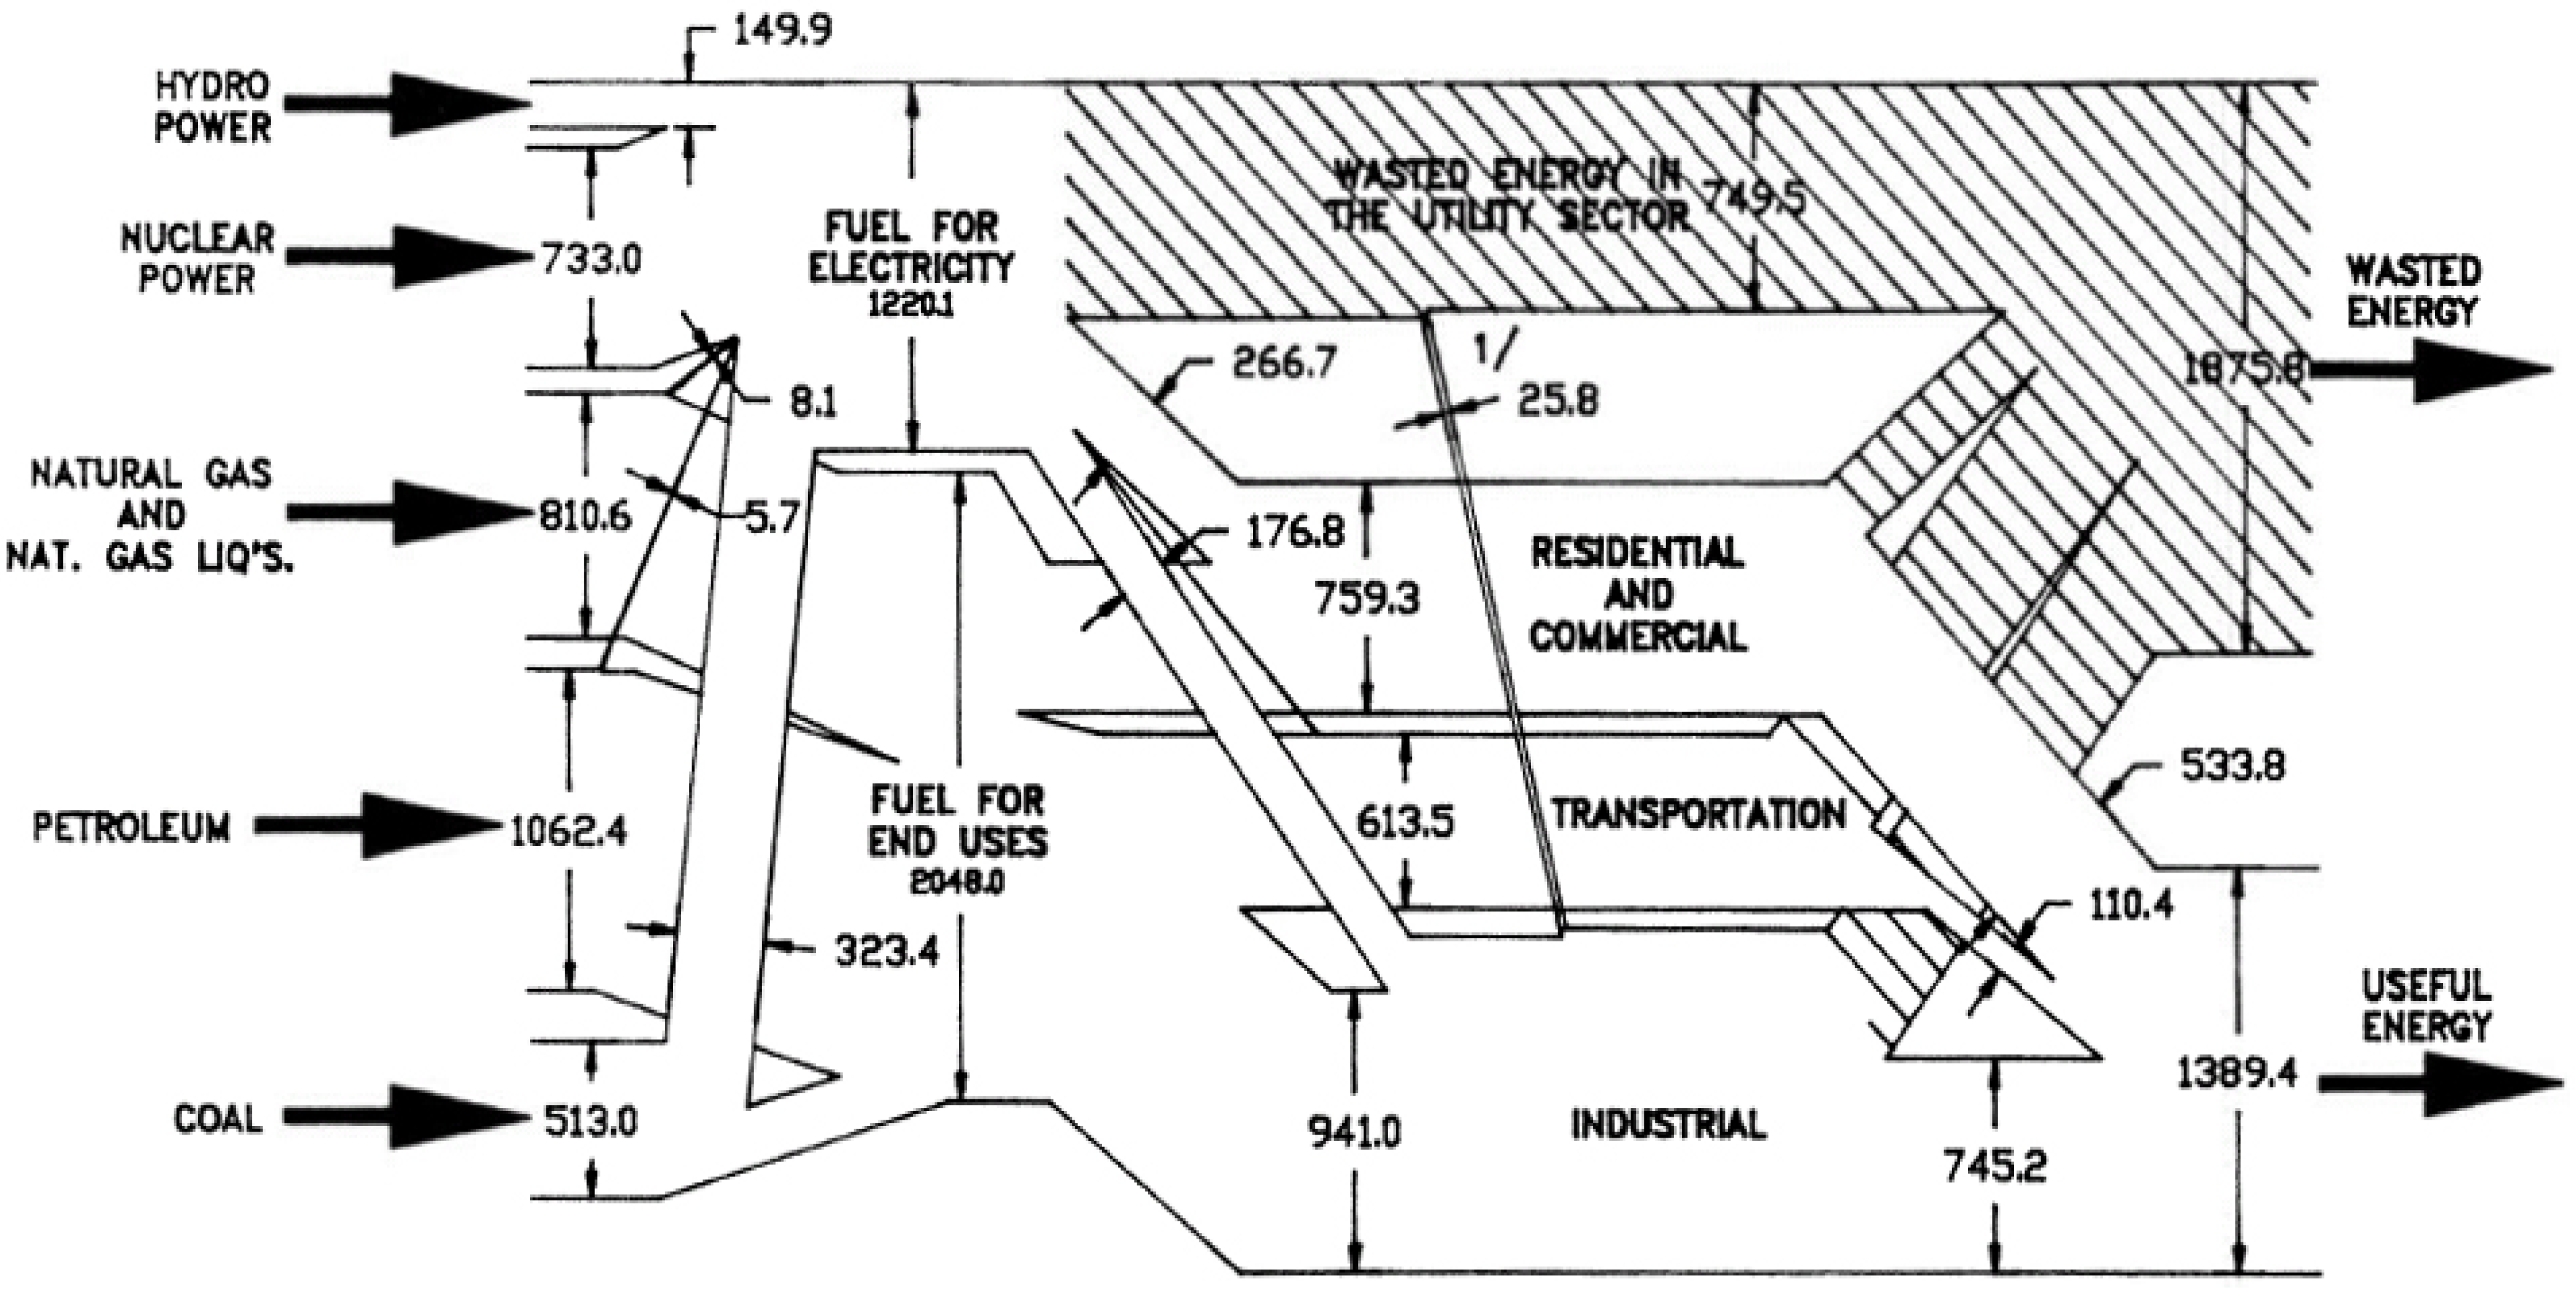
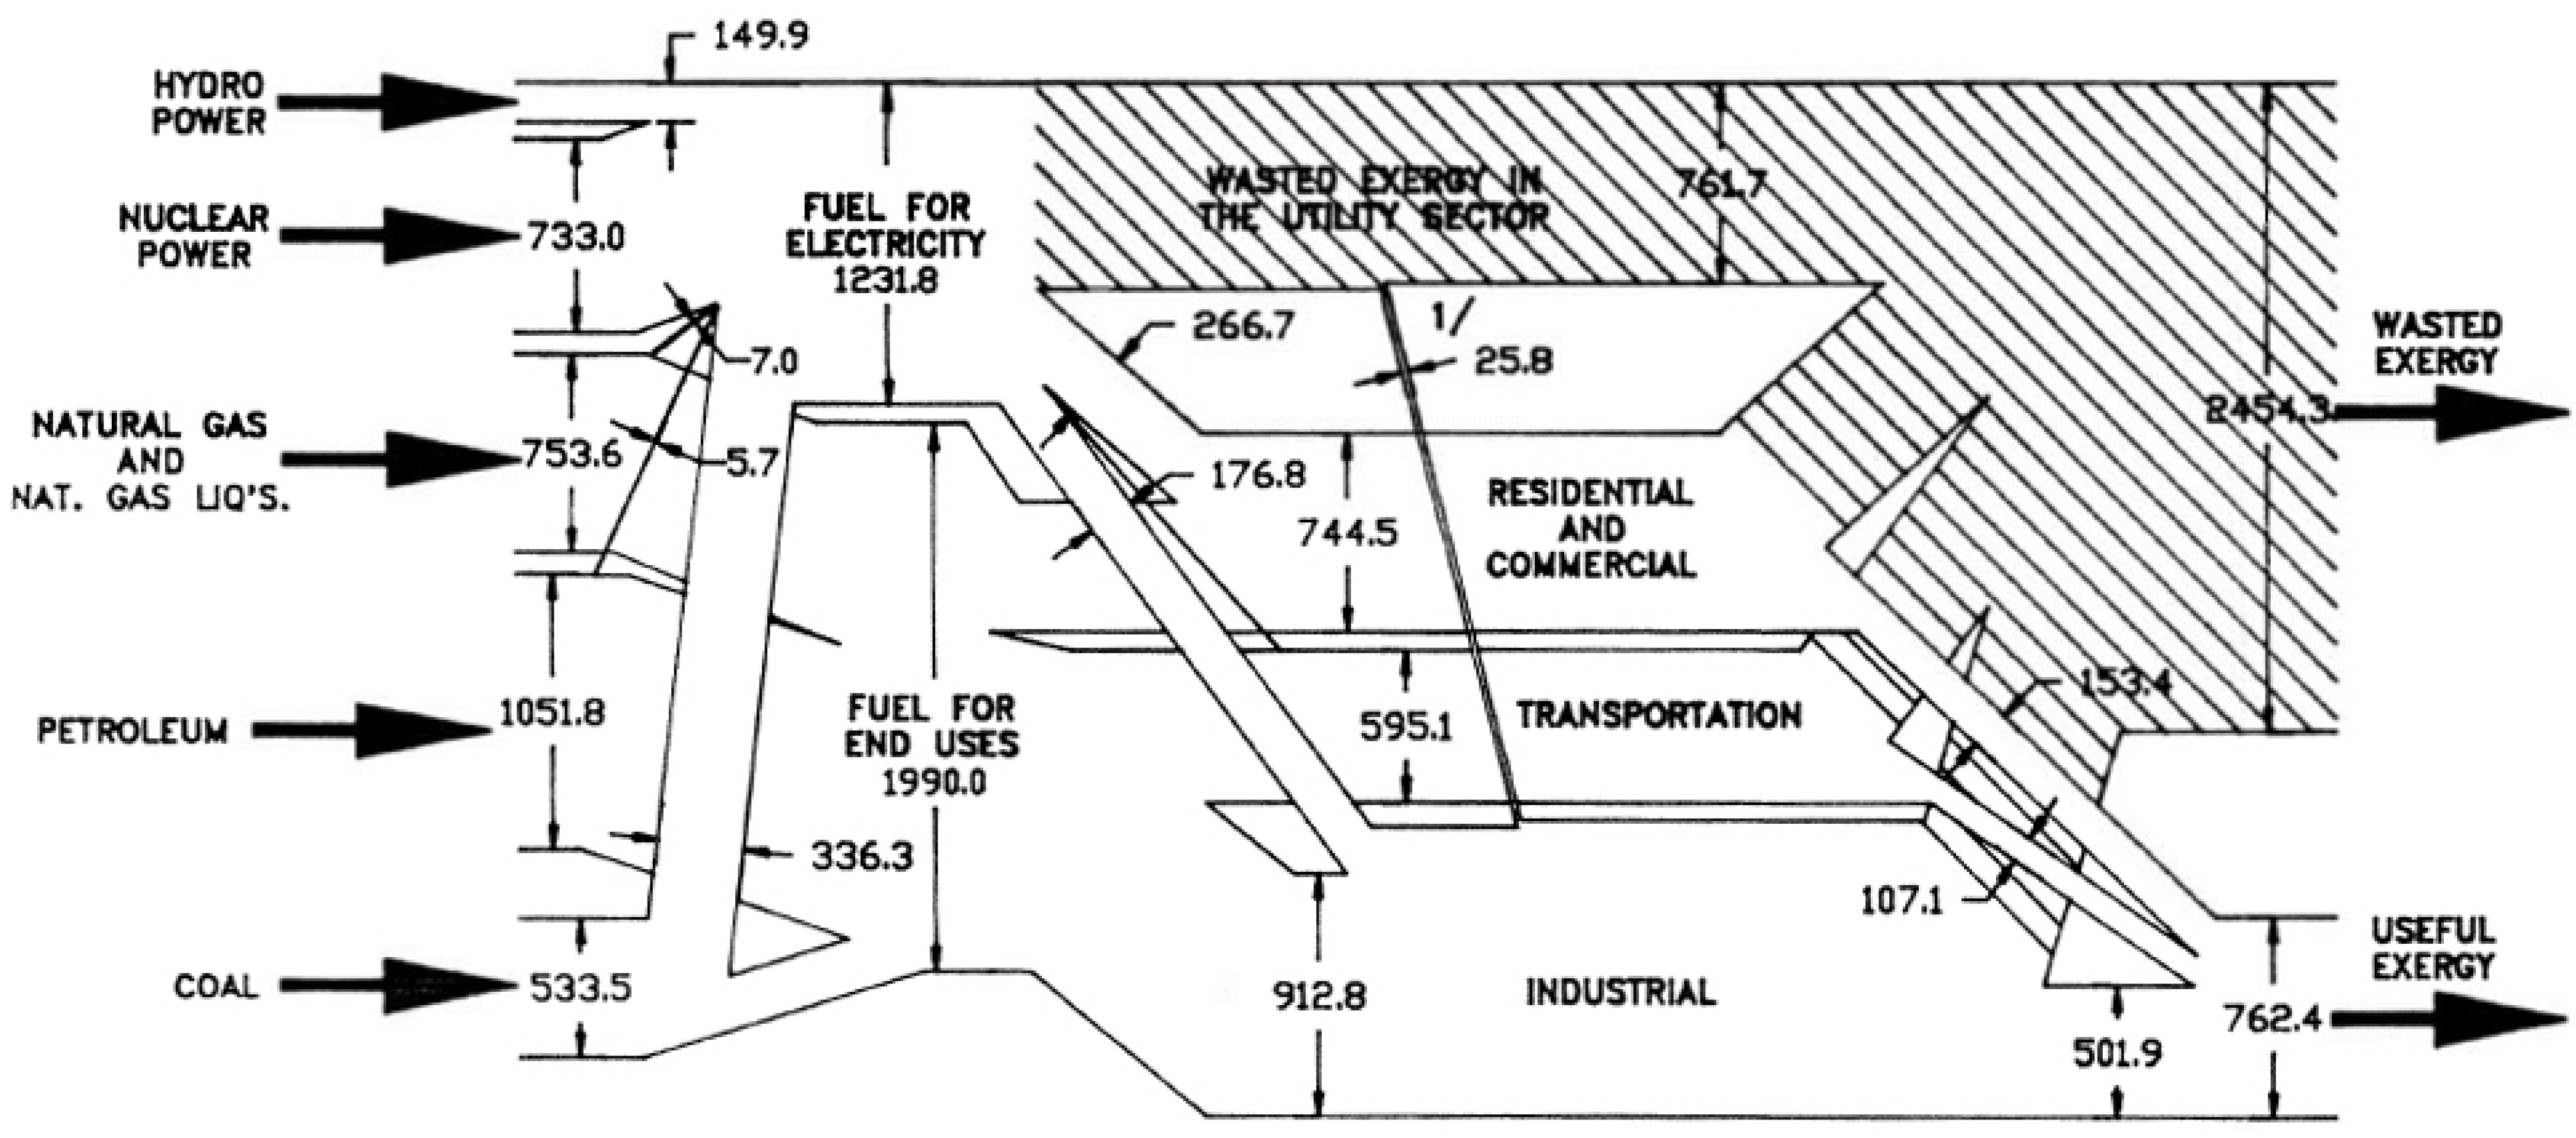
4.2. Case Study for the United States

In this case study, the results are described of a comparison of R&D spending in the U.S. with the energy and exergy losses of that country, as analyzed by Gaggioli [74,75].

4.2.1. Data and Analysis

Gaggioli applies exergy analysis to the energy utilization in the United States in order to calculate energy sector inefficiencies and then compare them to energy sector R&D funding in the U.S. [74,75]. The main data used in this work are presented in Table 5, which shows the breakdown of actual inefficiencies, as a percentage of total exergy loss in the sector, and the perceived inefficiency, as a percentage of the total energy loss in the sector. These inefficiency breakdowns are calculated using Equations 5 and 6. The budget allocation breakdown in that table lists the amount of funding that was allocated by the United States Department of Energy to sector energy R&D.

4.2.2. Results and Discussion

Table 5 shows a clear relationship between the perceived inefficiency and the budget allocations. Although R&D allocations are not based on inefficiency levels alone, the results indicate that budget allocations increase as perceived inefficiencies increase. This leads one to believe that the actual (exergy) inefficiencies are being overlooked when the decision-making for allocating R&D spending is being made.
For example, the two following observations in Table 5 support the statement that R&D funding in the U.S. is based on an energy analysis:
  • The utility sector receives the second largest budget allocation of any sector and yet has the least losses on an exergy basis while, on an energy basis, it is second only to the transportation sector as having the most losses.
  • The industrial sector which consumes the most energy of any end use sector [74,75] and has the most room for improvement on an exergy basis is funded the least mainly because it is perceived as being the most efficient sector on an energy basis.
Table 5. Comparison of Sectoral Breakdown of Inefficiencies with Sectoral Breakdown of Energy Research and Development Budget Allocations for the U.S.*.
SectorBreakdown of Overall InefficienciesBreakdown of Total Energy R&D Budget Allocations (%)
Portion of actual inefficiency attributable to sector (%)Portion of perceived inefficiency attributable to sector (%)
Residential-commercial302020
Industrial321518
Transportation244034
Utility142528
Overall100100100
* Adapted from [74,75].

4.3. Comparison of Case Studies and Generalizations

The results of the case studies for Ontario and the U.S. are compared. It is evident several similar trends are exhibited in Table 4 for Ontario and in Table 5 for the U.S. First, in both jurisdictions actual inefficiencies in the residential, commercial and industrial sectors are higher than the perceived inefficiencies, while actual inefficiencies are lower than the perceived inefficiencies for the transportation and utility sectors.
Second, as sector perceived inefficiency increases, energy R&D budget allocation increases in both jurisdictions (except for the Ontario industrial sector). These trends support the general contention that R&D allocations are related to perceived inefficiency levels, while the actual inefficiency is of less importance or neglected. Following actual inefficiencies would direct larger R&D budgets to the residential, commercial and utility sectors to exploit their relatively larger margins for efficiency improvement.
Different behaviour is observed for the industrial sector in Ontario compared to that in the U.S. The industrial sector in Ontario has a perceived inefficiency level of 21% which is higher than anticipated based on perceived efficiencies. The U.S. industrial sector has a perceived inefficiency level of 32% (Table 5) whereas, on the basis of the methodology, one would expect the energy R&D budget allocations for this sector to be between 15% and 9% for Ontario instead of 54% (Table 4). There are several reasons why the industrial sector funding in Ontario is not similar to that for the U.S. Size difference is important, as one jurisdiction is a province with a population exceeding 12 million while the second is a country with a population over 300 million. The U.S. study included all energy R&D funded by the United States Department of Energy which greatly exceeds that of the Enersearch program for Ontario. Not only did the Ontario analysis assess a province instead of a country, it assessed only one of many R&D funding programs in that province. If, for instance, the Ontario report is based R&D budget allocations on all provincial government R&D spending, the trend between perceived inefficiencies and R&D allocations may closer resemble that of the U.S. study. If we go one step further and include all R&D spending allocations in the province by government and private sector sources, the results may be closer still. Some other reasons why the industrial sector funding in Ontario in Table 4 differs from that for the U.S. in Table 5, and is higher than expected, are discussed below:
  • The fact that the Enersearch program operates on a two-thirds, one-third funding policy (i.e., 2/3 of the cost of a project is incurred by the participant and 1/3 by the Ministry of Energy) results in participants primarily from industry, and thus may skew energy R&D budget allocations. Approximately 46 of the 55 projects are directly related to specific industrial processes, 19 of which are completely disassociated with any other sector (see Appendix C of [76]).
  • Electric utilities and publicly funded institutions (e.g., universities, electrical utilities) are not eligible for funding, except in support of private sector proponents. This restriction significantly reduces the number of publicly funded organizations in the program. For instance, only 2 of the 55 projects involve universities. If universities participated more, one would likely see different energy R&D budget allocations to the sectors, and, in particular, less funding to the industrial sector.
  • The documentation on the Enersearch program provided by the Ontario Ministry of Energy does not indicate funding amounts on a sector basis. Thus, since the authors had to subjectively estimate the separation of projects into sectors, inaccuracies may have been introduced.
  • The large variation in project costs in comparison to the overall budget may also skew the results. For example, it can be seen in Appendix C of Ref. Lemieux that the actual total project costs in the Enersearch program for the period considered are $28,678,131 and the individual project costs range from $23,300 to $6,085,100. This large variation in individual project costs in relation to the total budget results in large variations between energy sector funding and may suppress the trend between perceived inefficiencies and R&D budget allocations.
  • The fact that other Ontario government ministries also allocate funding to energy R&D for specific sectors (e.g., the Ministry of Transportation likely allocates money for R&D to the transportation sector) may also skew the results. This skewing may be amplified because the Enersearch program may tend not to fund R&D in a sector if a particular ministry is funding it significantly. Therefore, a sector may in reality be receiving considerably more funding than indicated in Table 3.
  • The subset or sample group used in this report to assess R&D funding trends is relatively small. To realize more meaningful statistics, it is important to include as many sources of R&D funding as possible when analysing a system. In particular, confidence in the results would increase if a larger sample size were used, preferably by attaining data on the entire R&D spending in the province.

4.4. Implications for the Present and Future

The results of the case studies, although based on past data, have implications for the present and future. The author has begun an investigation of several countries using present and predicted future data and, based on the initial stages of this examination of research funding and energy and exergy efficiencies, many approximate similarities exist between the situation today for many countries and that at the time of the study for Ontario and the U.S., regarding the relation between sectoral energy R&D funding and sectoral inefficiencies. It is thus anticipated that several aspects of the trends indicated by the results of the case studies considered here are likely still valid today. In particular, energy R&D funding appears to be allocated more based on perceived rather than actual efficiencies, thereby potentially missing opportunities for large efficiency gains by focusing on the sectors with the largest margins for efficiency improvement.
It is possible that this trend will continue into the future, unless understanding and appreciation of exergy methods increases and reaches the levels of policy makers and industry leaders. Thus, the need to improve knowledge of exergy in society appears to be of great importance, so that strategic steps can be taken to allocate energy R&D funding where it can be most beneficially utilized.

5. Extensions and Generalizations

The preceding discussions are extended so as to illustrate the variations of exergy efficiencies for regions and countries, characterized by their circumstances and settings, with margin for efficiency improvement, i.e., actual inefficiency. Factors and attributes that characterize the region for purposes of this discussion include energy resource availability and costs, environmental constraints, and availability of funds. Other related factors are also considered implicitly.
Exergy efficiencies and the corresponding margin for efficiency improvement for regions and countries with two sets of realistic characteristics are presented in Figure 4. Countries and regions with high energy costs and major environment concerns and availability of funds are likely represented by the second bar, while those with low energy costs, low environment concerns and lack of funds are likely represented by the rightmost. These cases likely bracket other regions and countries, i.e., those having some but not all of high energy costs, major environment concerns, availability of funds, etc. The hypothetical case of ideal efficiency is also shown in the figure, both for comparison and because an exergy efficiency of 100% always specifies ideal but unattainable thermodynamic behaviour. Several other important points can be observed in Figure 4:
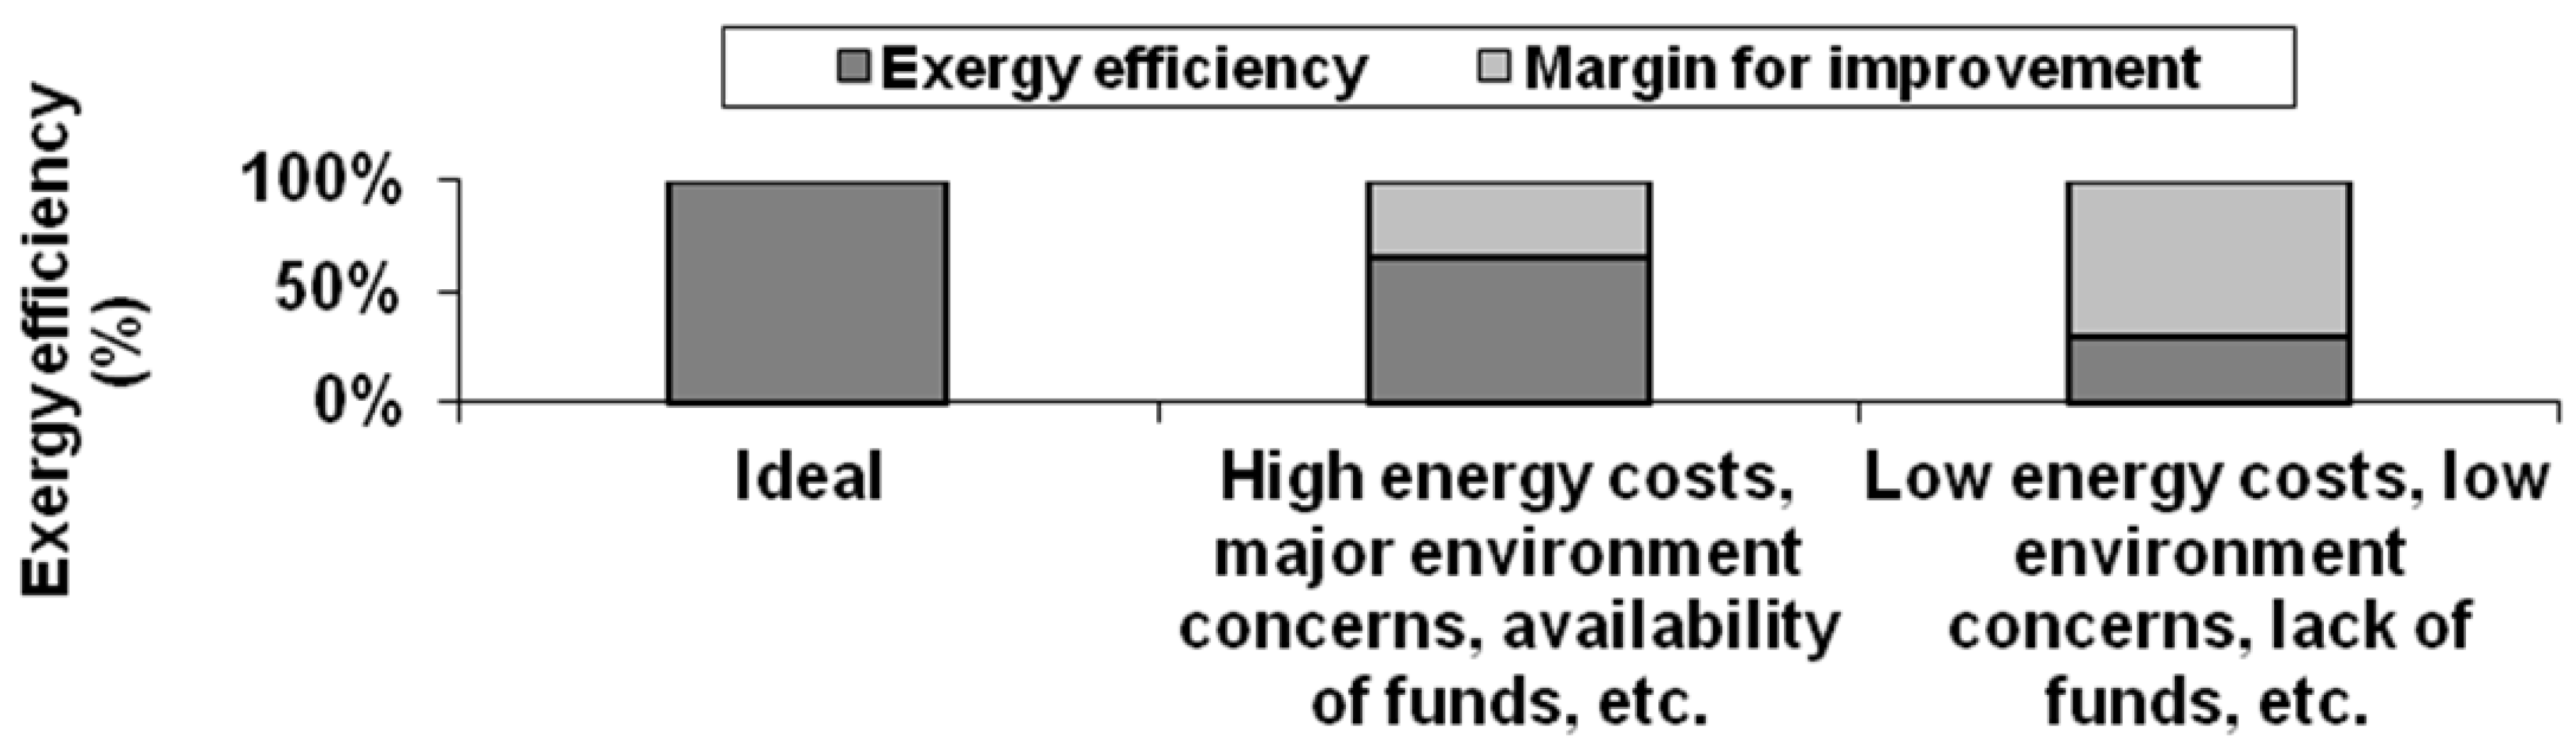
  • Countries and regions with lower rather than higher exergy efficiencies have greater margins for efficiency improvement, which are characterized by actual inefficiencies.
  • Low exergy efficiencies are usually observed in countries and regions with low energy costs, lack of funding for efficient technologies, lax environmental constraints, lack of awareness of efficient technologies and processes, and lack of a sufficiently educated and skilled workforce. High exergy efficiencies are usually observed in countries and regions with circumstances that foster high efficiency, such as high energy costs, funding availability for efficient technologies, readily available export markets for energy commodities, strict environmental constraints or emissions limitations, etc.
  • The ultimate margin for efficiency improvement is seen to be the difference between the ideal exergy efficiency of 100%, which applies to ideal processes or devices, and the actual exergy efficiency. An awareness of this limit helps in establishing realistic targets for efficiency improvement.
  • When energy-related factors change, countries and regions tend to respond (or should respond as it is usually in their best interests to do so). For instance, countries and regions tend to introduce measures that lead to increased exergy efficiency when energy costs increase or environmental regulations become stricter.
  • An important observation for any region or country related to the above point is that exergy efficiency increases when circumstances warrant improved efficiency, but energy efficiencies do not necessarily increase. Appropriate efficiency targets and energy research efforts and support should be established based on exergy, as confusion and waste can result if efforts to determine appropriate efficiency research and targets are based on energy.
Figure 4. Comparison of exergy efficiencies and margin for improvement (or actual inefficiency) for regions and countries having various attributes.
Entropy 15 00262 g004
Specific regions or countries are not easily identified in Figure 4 because their characteristics are usually much more complicated than the two simple cases shown. Nonetheless some generalities and trends, which likely apply in some cases, can be pointed out:
  • Although the characteristics of countries with developing economies vary greatly, many less developed countries fall into rightmost category in Figure 4 because for them energy resources are often less affordable (i.e., energy costs are high as a proportion of gross domestic product or average income per capita), obtaining funding for efficient technologies is difficult, and environmental laws are less strict. This behaviour is partly related to the focus of such countries on developing economically and in other ways and/or meeting basic needs.
  • Developed or industrialized countries tend to fall into the middle category in Figure 4, since they usually have high energy costs and readily available mechanisms for exporting energy resources, strict environmental restrictions and laws, and funding for efficient energy conversion and utilization technologies. The wealth of such countries often makes them require or expect energy resources to be used efficiently and cleanly.
  • In our globalized economy, it is unlikely that a country would have an extremely low exergy efficiency based on market forces, which exist in a similar form for developed or developing regions, because globalization makes it relatively easy to buy and sell energy commodities.
The ideas discussed here are somewhat confirmed in many countries and regions, where significant disparities exists in factors like energy costs and environmental regulations. In much of Europe and Asia, for example, energy prices are roughly double those in North America, and higher exergy efficiencies are observed. In the future, the ideas discussed in this section suggest that countries and regions are generally likely to move towards higher exergy efficiencies due to factors like energy price increases (long-term), resource scarcities, environmental limitations, and growth in developing economies (which can have very significant impacts for large countries like China and India). An important strategy would be to make investments in energy R&D guided in part by actual rather than perceived inefficiencies, i.e., by exergy factors.

6. Conclusions

In comparing energy R&D budget allocations with energy and exergy losses, it appears that of all factors affecting energy R&D budget allocations to the sectors, the perceived inefficiency is significant and the actual inefficiency is of less importance or is overlooked completely. If actual inefficiencies are considered in energy R&D budget allocations, one would probably see more funding for the residential, commercial, and utility sectors, because these are the sectors with a large room for improvement. The results are expected to assist government and public authorities that deal with research and development funding and should help improve the effectiveness of such investments of funds and resources.
The comparison made in the case studies between energy R&D spending for the sectors of a region (Ontario) and a country (United States) with energy and exergy inefficiencies in those sectors has yielded many interesting findings. Two main conclusions can be drawn from the analysis of the relationship between energy R&D allocations and energy and exergy losses (i.e., perceived and actual inefficiencies). That is, a relationship between perceived inefficiency and energy R&D allocations exists, with energy R&D budget allocations increasing for all sectors (except perhaps the Ontario industrial sector) as sector perceived inefficiency increases.
Regarding only thermodynamics, it is noted that an exergy analysis indicates a less efficient picture of energy flow through the economy of Ontario or the U.S. than does energy analysis. Actual inefficiencies in the residential-commercial and industrial sectors are higher than the perceived inefficiencies, while for the transportation and utility sectors the actual inefficiencies are lower than the perceived inefficiencies. An energy analysis of energy utilization in the U.S. or Ontario does not provide a true picture of how well the economy utilizes energy resources. An assessment based on energy can be misleading because it often indicates the main inefficiencies to be in the wrong sectors, and a state of technological efficiency higher than actually exists. In order to accurately assess the true efficiency of energy utilization, an exergy analysis is needed. Such exergy assessments are a powerful tool to indicate to industry and government where emphasis should be placed in programs to improve the use of the exergy associated with our main energy sources (fossil fuels, and nuclear and hydraulic energy).

Acknowledgments

Financial support was provided by the Natural Sciences and Engineering Research Council of Canada, and is gratefully acknowledged. In addition, the author acknowledges the significant contributions to this work of Mark A. Lemieux, who carried out research under the supervision of the author at what is now Ryerson University in Toronto.

Nomenclature

H
heating value
ke
specific kinetic energy
m
mass
P
pressure
Q
heat
T
temperature
W
work
We
electrical energy

Greek Symbols

η
energy efficiency
ψ
exergy efficiency

Subscripts

e
electrical
f
fuel
o
reference-environment state
p
product
s
stream of matter

References and Notes

  1. Energy Balances of Non-OECD Countries, 2004–2005, 2007 Edition ed; International Energy Agency: Paris, France, 2007.
  2. Energy Balances of OECD Countries, 2004–2005, 2007 Edition ed; International Energy Agency: Paris, France, 2007.
  3. Rosen, M.A. Evaluation of energy utilization efficiency in Canada using energy and exergy analyses. Energy 1992, 17, 339–350. [Google Scholar] [CrossRef]
  4. Rosen, M.A. Energy utilization efficiency in a macrosystem (Ontario): Evaluation and improvement through cogeneration. In Proceedings of the International Symposium on CO2 Fixation and Efficient Utilization of Energy, Tokyo, Japan; 1993; pp. 17–26. [Google Scholar]
  5. Dincer, I.; Rosen, M.A. Exergy.: Energy, Environment and Sustainable Development, 2nd ed.; Elsevier: Oxford, UK, 2013. [Google Scholar]
  6. Moran, M.J.; Shapiro, H.N.; Boettner, D.D.; Bailey, M.B. Fundamentals of Engineering Thermodynamics, 7th ed.; Wiley: New York, NY, USA, 2011. [Google Scholar]
  7. Bryant, J. A thermodynamic theory of economics. Int.J. Exergy. 2007, 4, 302–337. [Google Scholar] [CrossRef]
  8. Gogus, Y.A. Thermoeconomic optimization. Int.J. Exergy Res. 2005, 29, 559–580. [Google Scholar] [CrossRef]
  9. Tsatsaronis, G. A review of exergoeconomic methodologies. In Second Law Analysis of Thermal Systems; American Society of Mechanical Engineers: New York, NY, USA, 1987; pp. 81–87. [Google Scholar]
  10. Kotas, T.J. The Exergy. Method of Thermal Plant. Analysis, reprint ed.; Krieger: Malabar, FL, USA, 1995. [Google Scholar]
  11. Yantovskii, E.I. Energy and Exergy. In Currents: An Introduction to Exergonomics; Nova Science Publishers: New York, NY, USA, 1994. [Google Scholar]
  12. El-Sayed, Y. The Thermoeconomics of Energy Conversion; Elsevier: Amsterdam, The Netherlands, 2004. [Google Scholar]
  13. Sciubba, E. Exergo-economics: Thermodynamic foundation for a more rational resource use. Int. J. Energy Res. 2005, 29, 613–636. [Google Scholar] [CrossRef]
  14. Valero, A. Exergy accounting: Capabilities and drawbacks. Energy 2006, 31, 164–180. [Google Scholar] [CrossRef]
  15. Valero, A.; Serra, L.; Uche, J. Fundamentals of exergy cost accounting and thermoeconomics. Part I: Theory. Trans. ASME: J. Energy Resour. Technol. 2006, 128, 1–8. [Google Scholar] [CrossRef]
  16. Valero, A.; Serra, L.; Uche, J. Fundamentals of exergy cost accounting and thermoeconomics. Part II: Applications. Trans. ASME: J. Energy Resour. Technol 2006, 128, 9–15. [Google Scholar] [CrossRef]
  17. Lazzaretto, A.; Tsatsaronis, G. SPECO: A systematic and general methodology for calculating efficiencies and costs in thermal systems. Energy 2006, 31, 1257–1289. [Google Scholar] [CrossRef]
  18. Reistad, G.M. Available energy conversion and utilization in the United States. J. Eng. Power 1975, 97, 429–434. [Google Scholar] [CrossRef]
  19. Wall, G. Exergy conversion in the Japanese Society. Energy 1990, 15, 435–444. [Google Scholar] [CrossRef]
  20. Utlu, Z.; Hepbasli, A. A review on analyzing and evaluating the energy utilization efficiency of countries. Renew. Sust. Energy Rev. 2007, 11, 1–29. [Google Scholar] [CrossRef]
  21. Ertesvag, I.S. Society exergy analysis: A comparison of different societies. Energy 2001, 26, 253–270. [Google Scholar] [CrossRef]
  22. Ayres, R.U.; Ayres, L.W.; Warr, B. Exergy, power and work in the US economy, 1900–1998. Energy 2003, 28, 219–273. [Google Scholar] [CrossRef]
  23. Wall, G. Exergy conversions in the Finnish, Japanese and Swedish societies. In Report EE; Turku School of Economics: Turku, Finland, 1991. [Google Scholar]
  24. Chen, G.Q.; Qi, Z.H. Systems account of societal exergy utilization: China 2003. Ecol. Modell. 2007, 208, 102–118. [Google Scholar] [CrossRef]
  25. Chen, B.; Chen, G.Q. Exergy analysis for resource conversion of the Chinese Society 1993 under the material product system. Energy 2006, 31, 1115–1150. [Google Scholar] [CrossRef]
  26. Chen, B.; Chen, G.Q.; Yang, Z.F. Exergy-based resource accounting for China. Ecol. Modell. 2006, 196, 313–328. [Google Scholar] [CrossRef]
  27. Hammond, G.P.; Stapleton, A.J. Exergy analysis of the United Kingdom energy system. Proc. Instn. Mech. Engrs. 2001, 215, 141–162. [Google Scholar] [CrossRef]
  28. Gasparatos, A.; El-Haram, M.; Horner, M. Assessing the sustainability of the UK society using thermodynamic concepts: Part 1. Renew. Sust. Energy Rev. 2009, 13, 1074–1081. [Google Scholar] [CrossRef]
  29. Gasparatos, A.; El-Haram, M.; Horner, M. Assessing the sustainability of the UK society using thermodynamic concepts: Part 2. Renew. Sust. Energy Rev. 2009, 13, 956–970. [Google Scholar] [CrossRef]
  30. Warr, B.; Schandl, H.; Ayres, R.U. Long term trends in resource exergy consumption and useful work supplies in the UK, 1900 to 2000. Ecol. Econ. 2008, 68, 126–140. [Google Scholar] [CrossRef]
  31. Wall, G. Exergy conversion in the Swedish society. Resour. Energy 1987, 9, 55–73. [Google Scholar] [CrossRef]
  32. Wall, G. Exergy use in the Swedish society 1994. In Proceedings of the International Conference on Thermodynamic Analysis and Improvement of Energy Systems, Beijing, China, 10–13 June 1997; pp. 403–413.
  33. Ertesvag, I.S.; Mielnik, M. Exergy analysis of the Norwegian society. Energy 2000, 25, 957–973. [Google Scholar] [CrossRef]
  34. Ertesvag, I.S. Energy, exergy, and extended-exergy analysis of the Norwegian society 2000. Energy 2005, 30, 649–675. [Google Scholar] [CrossRef]
  35. Ptasinski, K.J.; Koymans, M.N.; Verspagen, H.H.G. Performance of the Dutch energy sector based on energy, exergy and extended exergy accounting. Energy 2006, 31, 3135–3144. [Google Scholar] [CrossRef]
  36. Wall, G.; Sciubba, E.; Naso, V. Exergy use in the Italian society. Energy 1994, 19, 1267–1274. [Google Scholar] [CrossRef]
  37. Stepanov, V.S. A method for estimating the energy efficiency of the economy. Energy 1995, 20, 577–583. [Google Scholar] [CrossRef]
  38. Ozdogan, O.; Arikol, M. Energy and exergy analyses of selected Turkish industries. Energy 1995, 20, 73–80. [Google Scholar] [CrossRef]
  39. Ileri, A.; Gurer, T. Energy and exergy utilization in Turkey during 1995. Energy 1998, 23, 1099–1106. [Google Scholar] [CrossRef]
  40. Schaeffer, R.; Wirtshafter, R.M. An exergy analysis of the Brazilian economy: From energy production to final energy use. Energy 1992, 17, 841–855. [Google Scholar] [CrossRef]
  41. Nakicenovic, N.; Gilli, P.V.; Kurz, R. Regional and global exergy and energy efficiencies. Energy 1996, 21, 223–237. [Google Scholar] [CrossRef]
  42. Hermann, W.A. Quantifying global exergy resources. Energy 2006, 31, 1685–1702. [Google Scholar] [CrossRef]
  43. Banerjee, R.; Cong, Y.; Gielen, D.; Jannuzzi, G.; Maréchal, F.; McKane, A.T.; Rosen, M.A.; van Es, D.; Worrell, E. Chapter 8, End-Use Efficiency: Industry. In Global Energy Assessment: Toward a Sustainable Future; Gomez-Echeverri, L., Johansson, T.B., Nakicenovic, N., Patwardhan, A., Eds.; International Institute for Applied Systems Analysis, Vienna, Austria and Cambridge University Press: Cambridge, UK, 2012; pp. 513–573. [Google Scholar]
  44. Chen, G.Q. Exergy consumption of the earth. Ecol. Modell. 2005, 184, 363–380. [Google Scholar] [CrossRef]
  45. Rosen, M.A.; Scott, D.S. Entropy production and exergy destruction—Part I: Hierarchy of Earth's major constituencies. Int. J. Hydrogen Energy 2003, 28, 1307–1313. [Google Scholar] [CrossRef]
  46. Brodyanski, V.M.; Sorin, M.V.; Le Goff, P. The efficiency of industrial processes. In Exergy Analysis and Optimization; Elsevier: London, UK, 1994. [Google Scholar]
  47. De Jong, E.D.; Keuken, H.; van der Pol, E.; den Dekker, E.; Kerckhoffs, E.J.H. Exergy analysis of industrial processes using AI techniques. Comput. Chem. Engng. 1996, 20 (Suppl.), S1631–S1636. [Google Scholar] [CrossRef]
  48. Utlu, Z.; Hepbasli, A. Energetic and exergetic assessment of the industrial sector at varying dead (reference) state temperatures: A review with an illustrative example. Renewable Sustainable Energy Rev. 2008, 12, 1277–1301. [Google Scholar] [CrossRef]
  49. Wall, G. Exergy flows through industrial processes. Energy 1988, 13, 197–208. [Google Scholar] [CrossRef]
  50. Utlu, Z.; Hepbasli, A. A review and assessment of the energy utilization efficiency in the Turkish industrial sector using energy and exergy analysis method. Renewable Sustainable Energy Rev. 2007, 11, 1438–1459. [Google Scholar] [CrossRef]
  51. Hepbasli, A.; Ozalp, N. Development of energy efficiency and management implementation in the Turkish industrial sector. Energy Convers. Manage. 2003, 44, 231–249. [Google Scholar] [CrossRef]
  52. Oladiran, M.T.; Meyer, J.P. Energy and exergy analyses of energy consumptions in the industrial sector in South Africa. Appl. Energy 2007, 84, 1056–1067. [Google Scholar] [CrossRef]
  53. Dincer, I.; Hussain, M.M.; Al-Zaharnah, I. Energy and exergy utilization in agricultural sector of Saudi Arabia. Energy Policy 2005, 33, 1461–1467. [Google Scholar] [CrossRef]
  54. Ozturk, H.K.; Canyurt, O.E.; Hepbasli, A.; Utlu, Z. Three different genetic algorithm approaches to the estimation of residential exergy input/output values. Build. Environ. 2004, 39, 807–816. [Google Scholar] [CrossRef]
  55. Utlu, Z.; Hepbasli, A. Parametrical investigation of the effect of dead (reference) state on energy and exergy utilization efficiencies of residential-commercial sectors: A review and an application. Renewable Sustainable Energy Rev. 2007, 11, 603–634. [Google Scholar] [CrossRef]
  56. Al-Ghandoor, A.; Al-Hinti, I.; Akash, B.; Abu-Nada, E. Analysis of energy and exergy use in the Jordanian urban residential sector. Int. J. Exergy 2008, 5, 413–428. [Google Scholar] [CrossRef]
  57. Utlu, Z.; Hepbasli, A. A study on the evaluation of energy utilization efficiency in the Turkish residential-commercial sector using energy and exergy analyses. Energy Build. 2003, 35, 1145–1153. [Google Scholar] [CrossRef]
  58. Utlu, Z.; Hepbasli, A. Analysis of energy and exergy use of the Turkish residential-commercial sector. Build. Environ. 2005, 40, 641–655. [Google Scholar] [CrossRef]
  59. Utlu, Z.; Hepbasli, A. Estimating the energy and exergy utilization efficiencies for the residential-commercial sector: An application. Energy Policy 2006, 34, 1097–1105. [Google Scholar] [CrossRef]
  60. Utlu, Z.; Hepbasli, A. Thermoeconomic analysis of energy utilization in the residential-commercial sector: An application. Build. Environ. 2008, 43, 896–904. [Google Scholar] [CrossRef]
  61. Saidur, R.; Masjuki, H.H.; Jamaluddin, M.Y. An application of energy and exergy analysis in residential sector of Malaysia. Energy Policy 2007, 35, 1050–1063. [Google Scholar] [CrossRef]
  62. Saidur, R.; Sattar, M.A.; Masjuki, H.H.; Abdessalam, H.; Shahruan, B.S. Energy and exergy analysis at the utility and commercial sectors of Malaysia. Energy Policy 2007, 35, 1956–1966. [Google Scholar] [CrossRef]
  63. Utlu, Z.; Hepbasli, A. Assessment of the Turkish utility sector through energy and exergy analyses. Energy Policy 2007, 35, 5012–5020. [Google Scholar] [CrossRef]
  64. Dincer, I.; Hussain, M.M.; Al-Zaharnah, I. Energy and exergy use in the utility sector of Saudi Arabia. Desalination 2004, 169, 245–255. [Google Scholar] [CrossRef]
  65. Utlu, Z.; Hepbasli, A. Assessment of the energy utilization efficiency in the Turkish transportation sector between 2000 and 2020 using energy and exergy analysis method. Energy Policy 2006, 34, 1611–1618. [Google Scholar] [CrossRef]
  66. Ediger, V.S.; Camdali, U.O. Energy and exergy efficiencies in Turkish transportation sector, 1988–2004. Energy Policy 2007, 35, 1238–1244. [Google Scholar] [CrossRef]
  67. Koroneos, C.J.; Nanaki, E.A. Energy and exergy utilization assessment of the Greek transport sector. Resour. Conserv. Recycl. 2008, 52, 700–706. [Google Scholar] [CrossRef]
  68. Jaber, J.O.; Al-Ghandoor, A.; Sawalha, S.A. Energy analysis and exergy utilization in the transportation sector of Jordan. Energy Policy 2008, 36, 2995–3000. [Google Scholar] [CrossRef]
  69. Ji, X.; Chen, G.Q. Exergy analysis of energy utilization in the transportation sector in China. Energy Policy 2006, 34, 1709–1719. [Google Scholar] [CrossRef]
  70. Saidur, R.; Sattar, M.A.; Masjuki, H.H.; Ahmed, S.; Hashim, U. An estimation of the energy and exergy efficiencies for the energy resources consumption in the transportation sector in Malaysia. Energy Policy 2007, 35, 4018–4026. [Google Scholar] [CrossRef]
  71. Federici, M.; Ulgiati, S.; Basosi, R. A thermodynamic, environmental and material flow analysis of the Italian highway and railway transport systems. Energy 2008, 33, 760–775. [Google Scholar] [CrossRef]
  72. Dincer, I.; Hussain, M.M.; Al-Zaharnah, I. Energy and exergy use in public and private sector of Saudi Arabia. Energy Policy 2004, 32, 1615–1624. [Google Scholar] [CrossRef]
  73. Gaggioli, R.A.; Petit, P.J. Use the second law first. Chemtech 1977, 7, 496–506. [Google Scholar]
  74. Gaggioli, R.A. Personal communication Presentation to Technical Staff at the Institute for Hydrogen Systems. Mississauga, Ontario, USA, 1985. [Google Scholar]
  75. Gaggioli, R.A. Second law analysis for process and energy engineering. In Efficiency and Costing: Second Law Analysis of Processes; American Chemical Society: Washington DC, USA, 1983; ACS Symposium Series 235; pp. 7–50. [Google Scholar]
  76. Lemieux, M.A.; Rosen, M.A. Energy and Exergy Analyses of Energy Utilization in Ontario. Report for Imperial Oil Ltd.; Ryerson Polytechnical Institute: Toronto, ON, Canada, 1989. [Google Scholar]
  77. Brown, H.L.; Hamel, B.B.; Hedman, B.A.; Koluch, M.; Gajanana, B.C.; Troy, P. Analysis of 108 Industrial Processes; Fairmount Press: Liburn, GA, USA, 1985. [Google Scholar]
  78. Proposal Criteria and Application Form; Energy Programs and Technology Division, Ontario Ministry of Energy: Toronto, ON, Canada, 1989.
  79. Brooks, D.; Torrie, R. Electricity Conservation Supply Curves for Ontario; Marbek Resource Consultants: Ottawa, ON, Canada, 1987. [Google Scholar]
  80. Appliance Efficiency Information Base; Marbek Resource Consultants Limited: Ottawa, ON, Canada, 1987.
  81. Commercial/Institutional Buildings, Electrical Energy Technology Study; Engineering Interface Limited and Marbek Resource Consultants Limited: ON, Canada, 1988.
  82. Quarterly Report on Energy Supply and Demand, 1987-IV; Ministry of Supply and Services Canada: Ottawa, ON, Canada, 1987; Volume 12.
  83. An Energy Efficient Ontario toward the Year 2000; Series: Energy Policy Paper; Ontario Ministry of Energy: Toronto, ON, Canada, 1986.
  84. Ontario's Future Electricity Demand; Ontario Ministry of Energy: Toronto, ON, Canada, 1987.
  85. Reistad, G.M. Available energy utilization in the United States. In Thermodynamics: Second Law Analysis; American Chemical Society: Washington, DC, USA, 1980; ACS Symposium Series 122; pp. 93–110. [Google Scholar]
  86. Rosen, M.A. Economics and Exergy: An. Enhanced Approach to Energy Economics; Nova Science Publishers: Hauppauge, NY, USA, 2011. [Google Scholar]

