Remote Sens. 2021, 13(23), 4899; https://doi.org/10.3390/rs13234899 - 2 Dec 2021
Cited by 32 | Viewed by 5181
Abstract
Flood disasters have a huge effect on human life, the economy, and the ecosystem. Quickly extracting the spatial extent of flooding is necessary for disaster analysis and rescue planning. Thus, extensive studies have utilized optical or radar data for the extraction of water
[...] Read more.
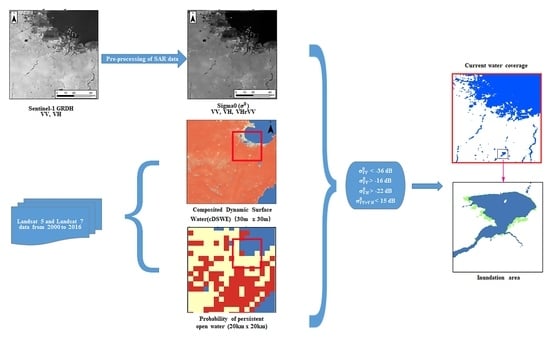
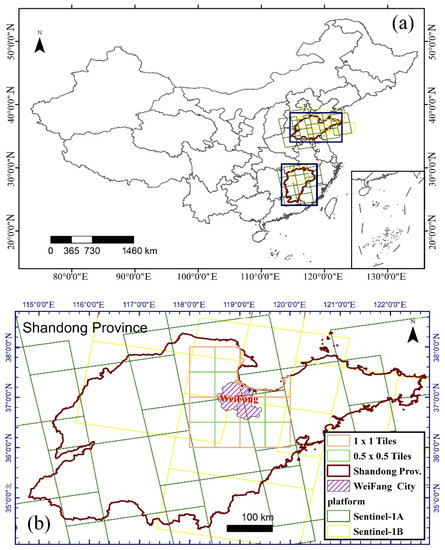
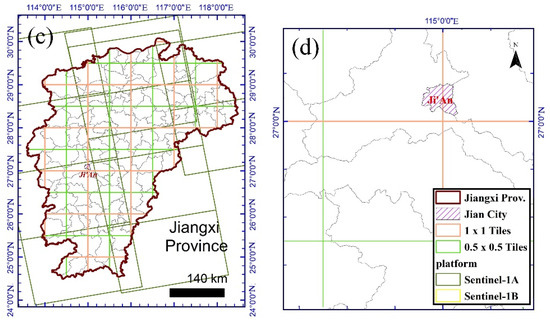
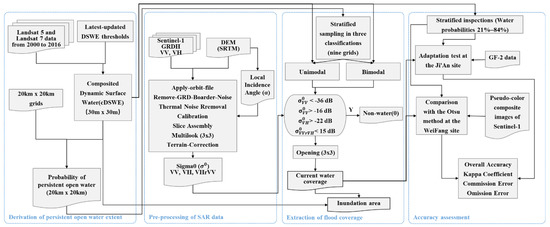
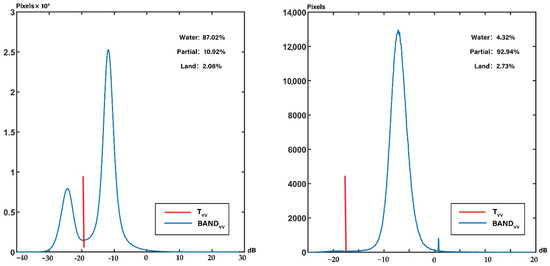
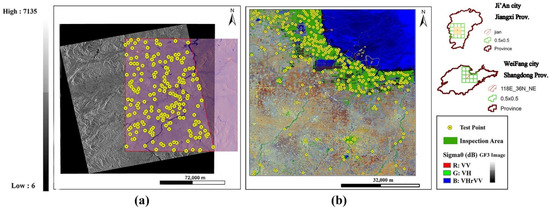
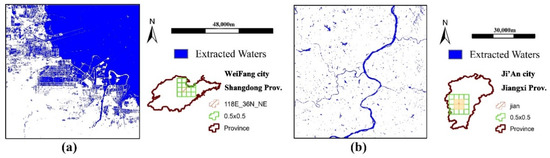
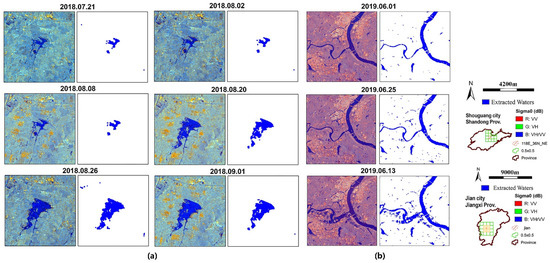
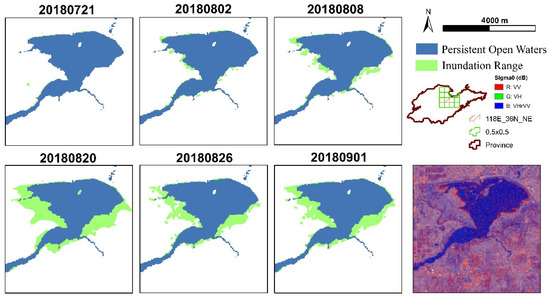
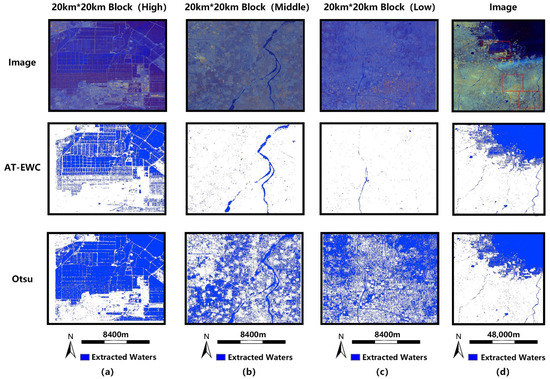
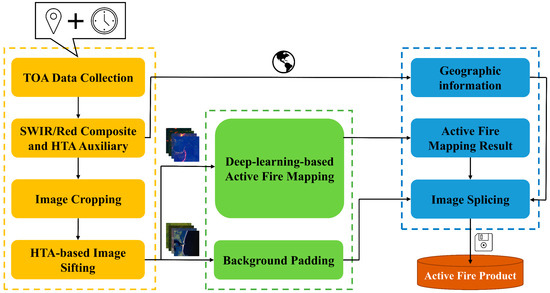
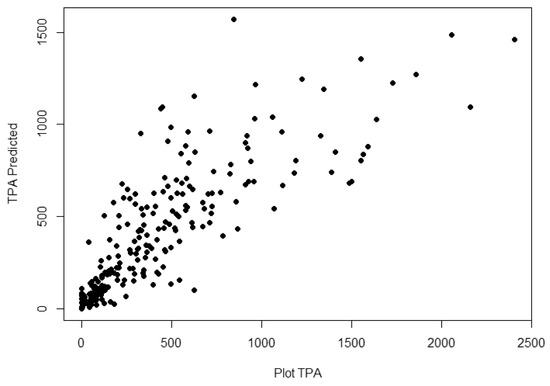
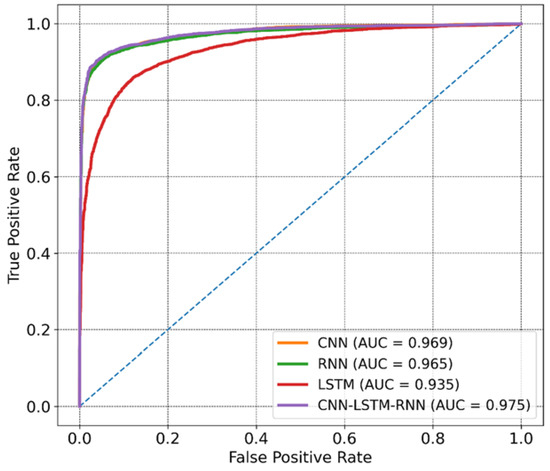
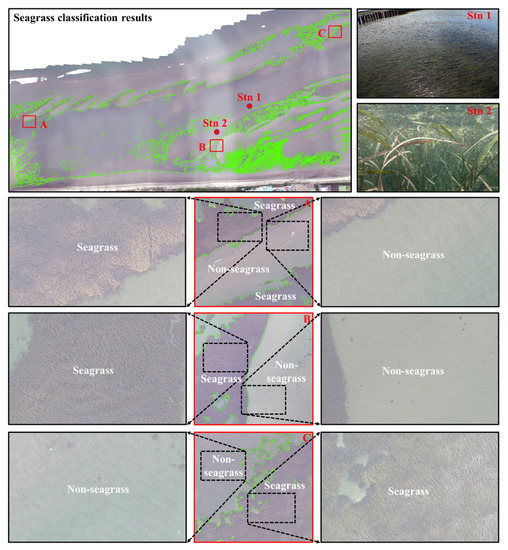
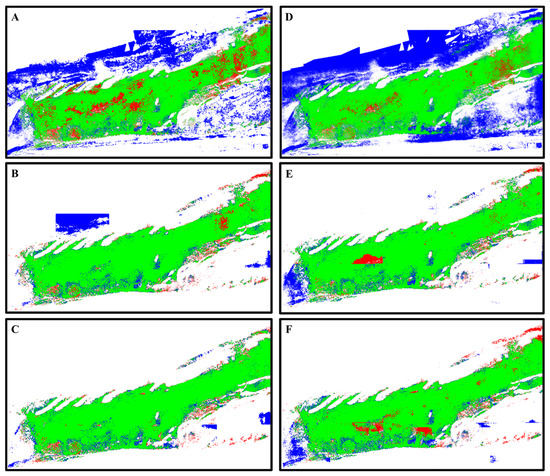
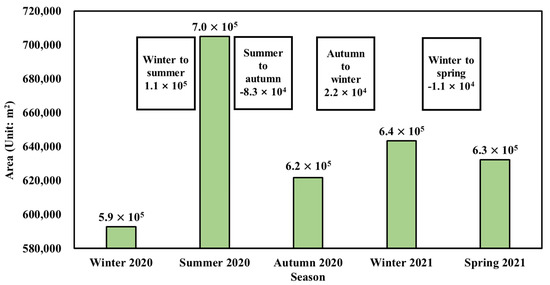
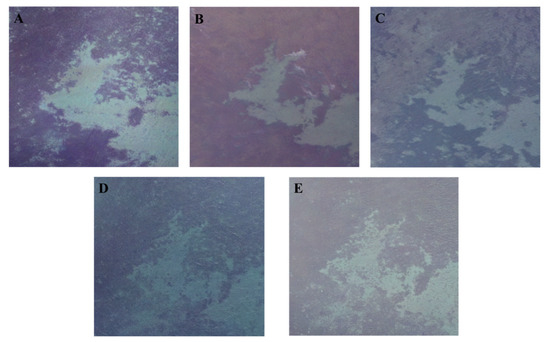
Flood disasters have a huge effect on human life, the economy, and the ecosystem. Quickly extracting the spatial extent of flooding is necessary for disaster analysis and rescue planning. Thus, extensive studies have utilized optical or radar data for the extraction of water distribution and monitoring of flood events. As the quality of detected flood inundation coverage by optical images is degraded by cloud cover, the current data products derived from optical sensors cannot meet the needs of rapid flood-range monitoring. The presented study proposes an adaptive thresholding method for extracting water coverage (AT-EWC) regarding rapid flooding from Sentinel-1 synthetic aperture radar (SAR) data with the assistance of prior information from Landsat data. Our method follows three major steps. First, applying the dynamic surface water extent (DSWE) algorithm to Landsat data acquired from the year 2000 to 2016, the distribution probability of water and non-water is calculated through the Google Earth Engine platform. Then, current water coverage is extracted from Sentinel-1 data. Specifically, the persistent water and non-water datasets are used to automatically determine the type of image histogram. Finally, the inundated areas are calculated by combining the persistent water and non-water datasets and the current water coverage as derived from the above two steps. This approach is fast and fully automated for flood detection. In the classification results from the WeiFang and Ji’An sites, the overall classification accuracy of water and land detection reached 95–97%. Our approach is fully automatic. In particular, the proposed algorithm outperforms the traditional method over small water bodies (inland watersheds with few lakes) and makes up for the low temporal resolution of existing water products.
Full article
(This article belongs to the Special Issue Advances in Earth Observation to Improve Flood Disaster Monitoring and Management)
►
Show Figures
Graphical abstract


