The Effect of Food Unit Sizes and Meal Serving Occasions on Eating Behaviour Characteristics: Within Person Randomised Crossover Studies on Healthy Women


Abstract
:1. Introduction
2. Materials and Methods
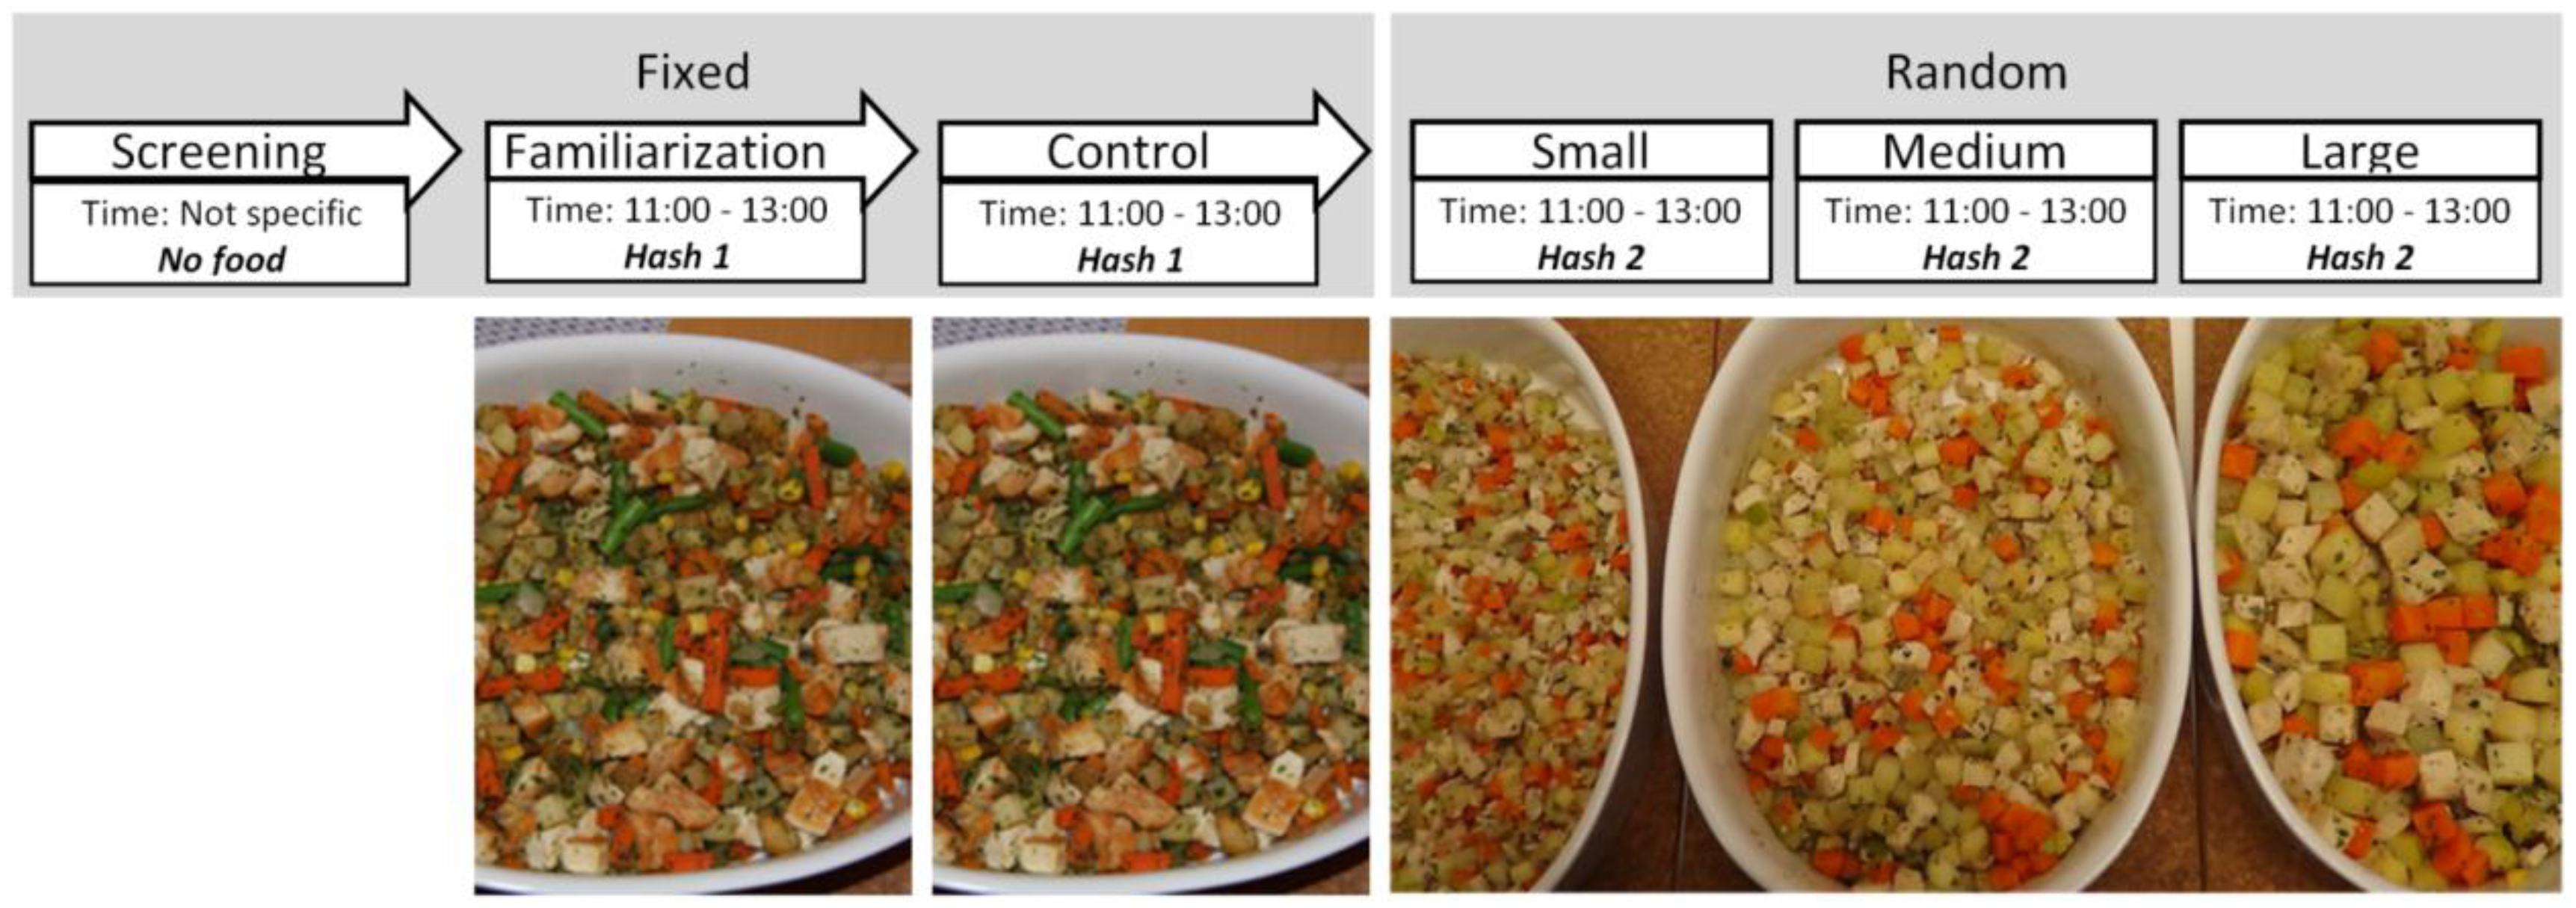
2.1. Experimental Design
2.2. Subjects
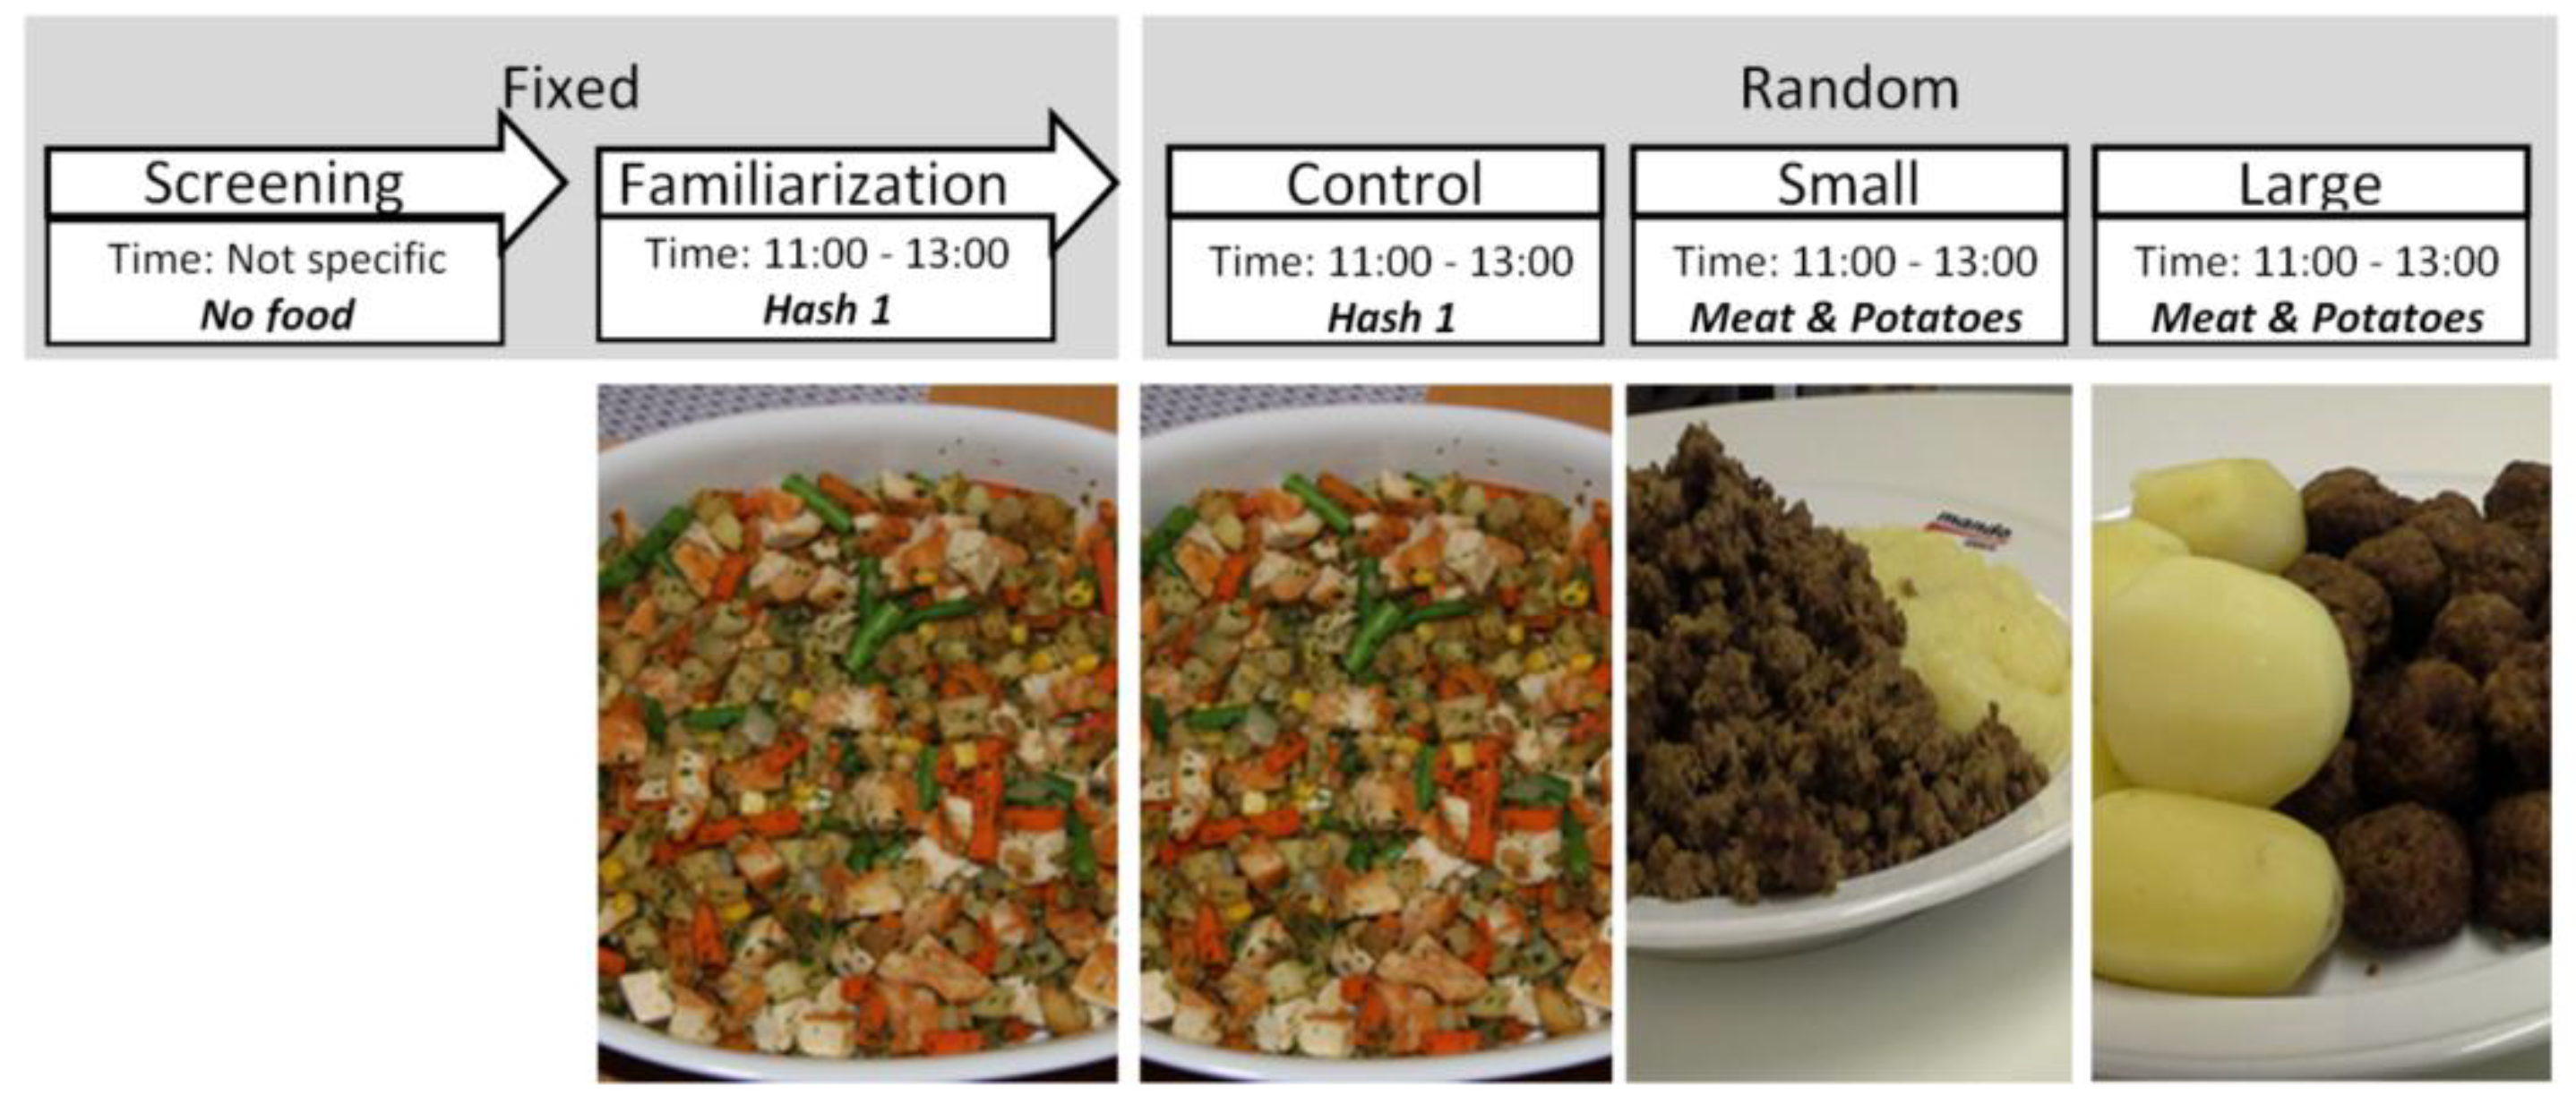
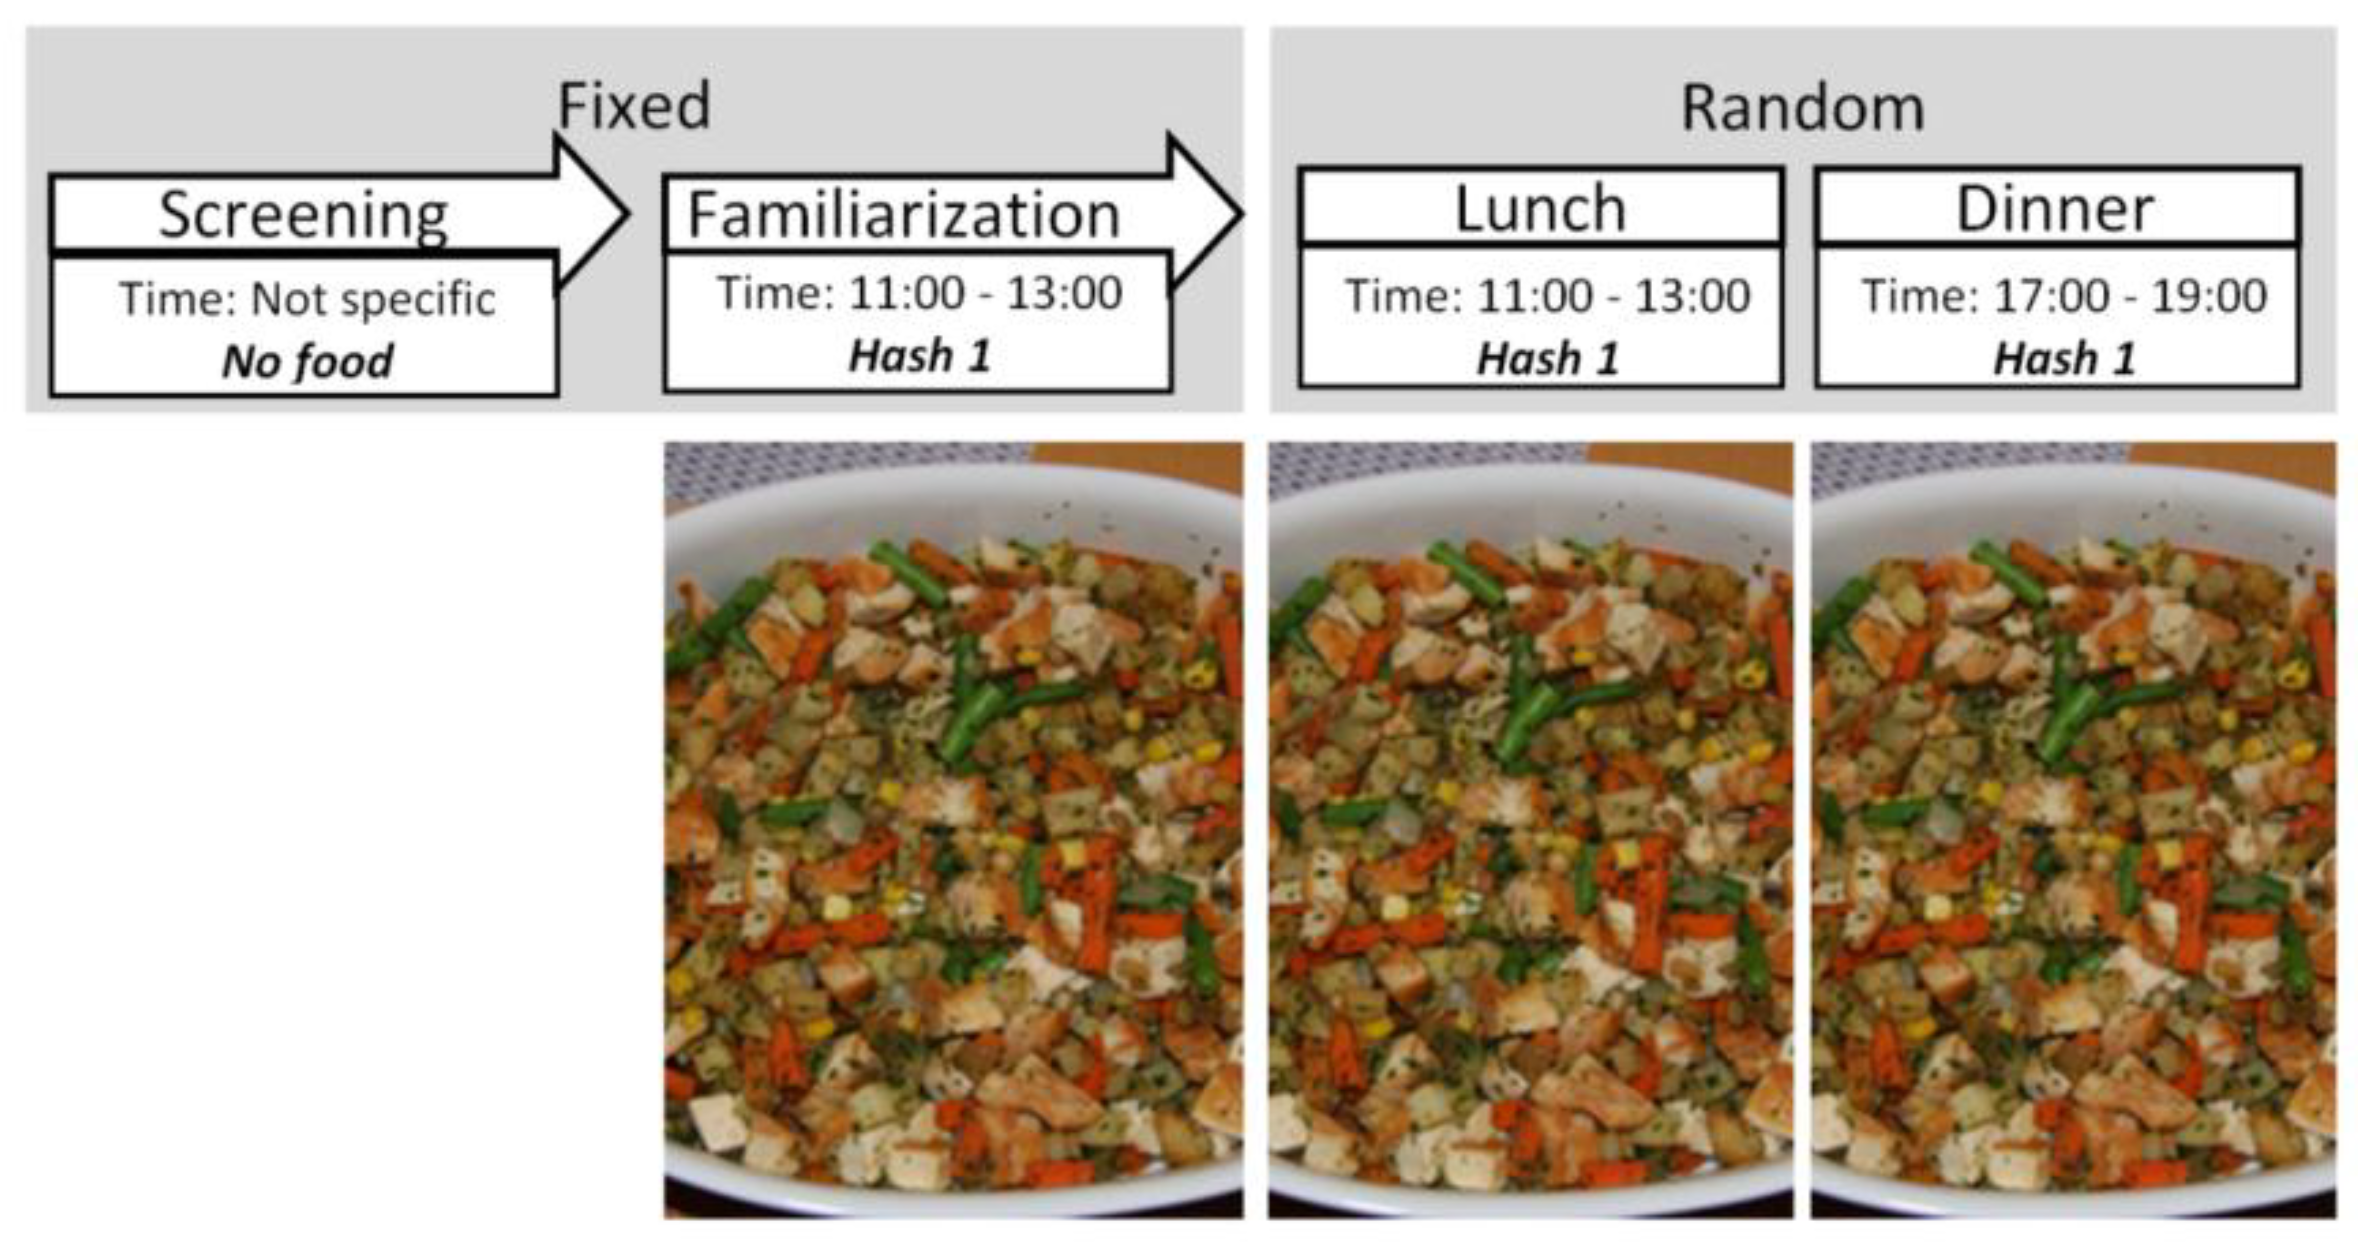
2.3. Familiarisation and Control Meals
2.4. Unit Size (Study 1)
2.5. Unit Size (Study 2)
2.6. Serving Occasion (Study 3)
2.7. Session Procedure
2.8. Meal Preparation
2.9. Devices
2.10. Questionnaires
2.11. Data Handling
2.12. Statistical Analysis
3. Results
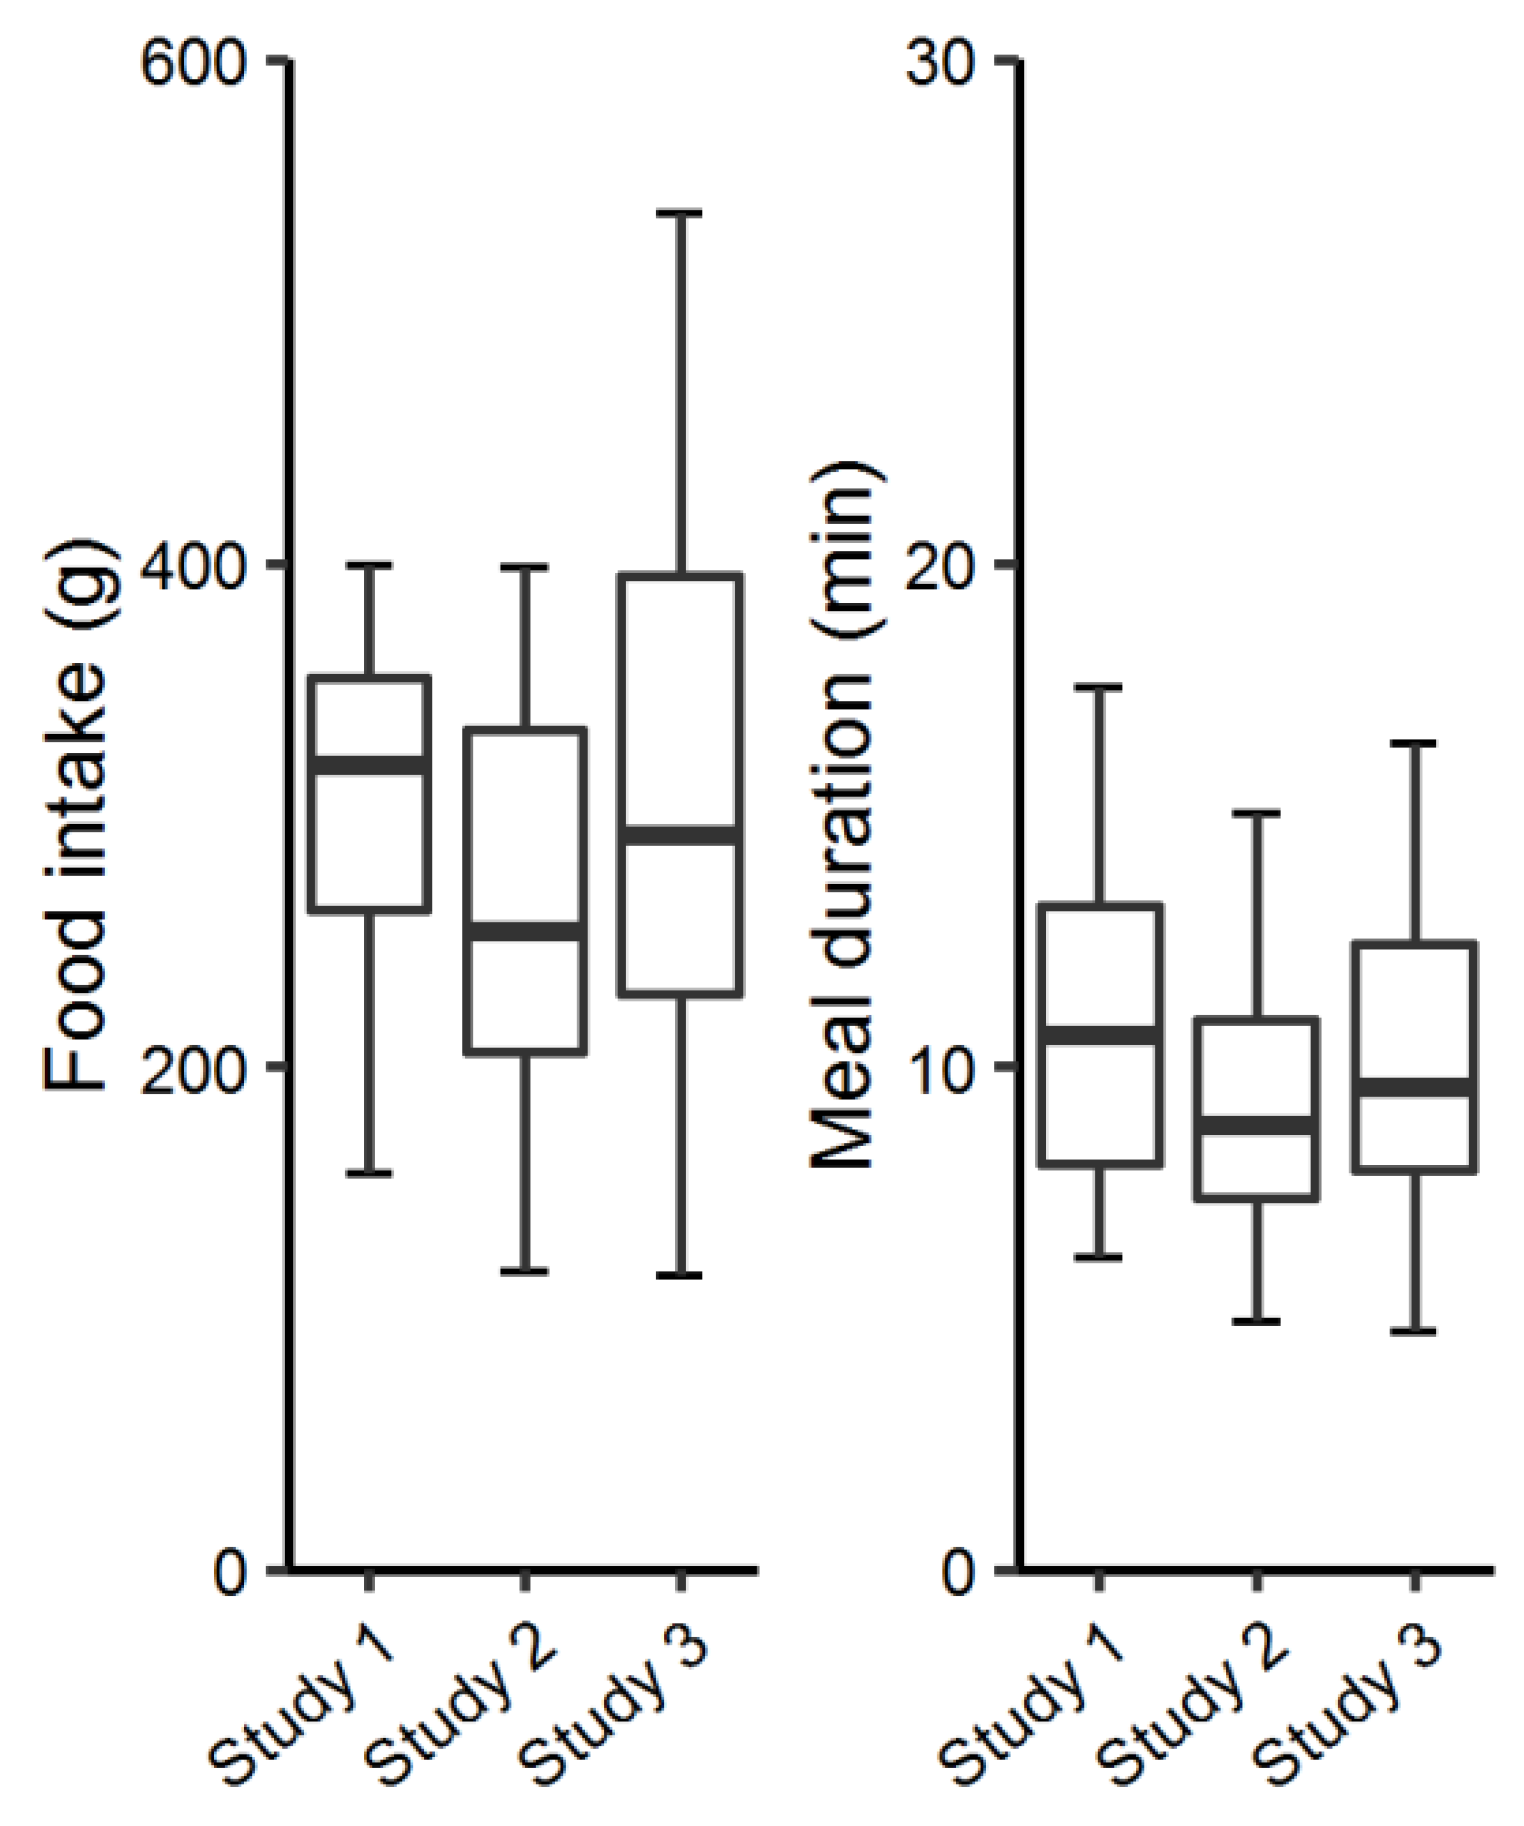
3.1. Food Intake and Meal Duration of Control Meals
3.2. Eating Behaviour Characteristics of Test Meals
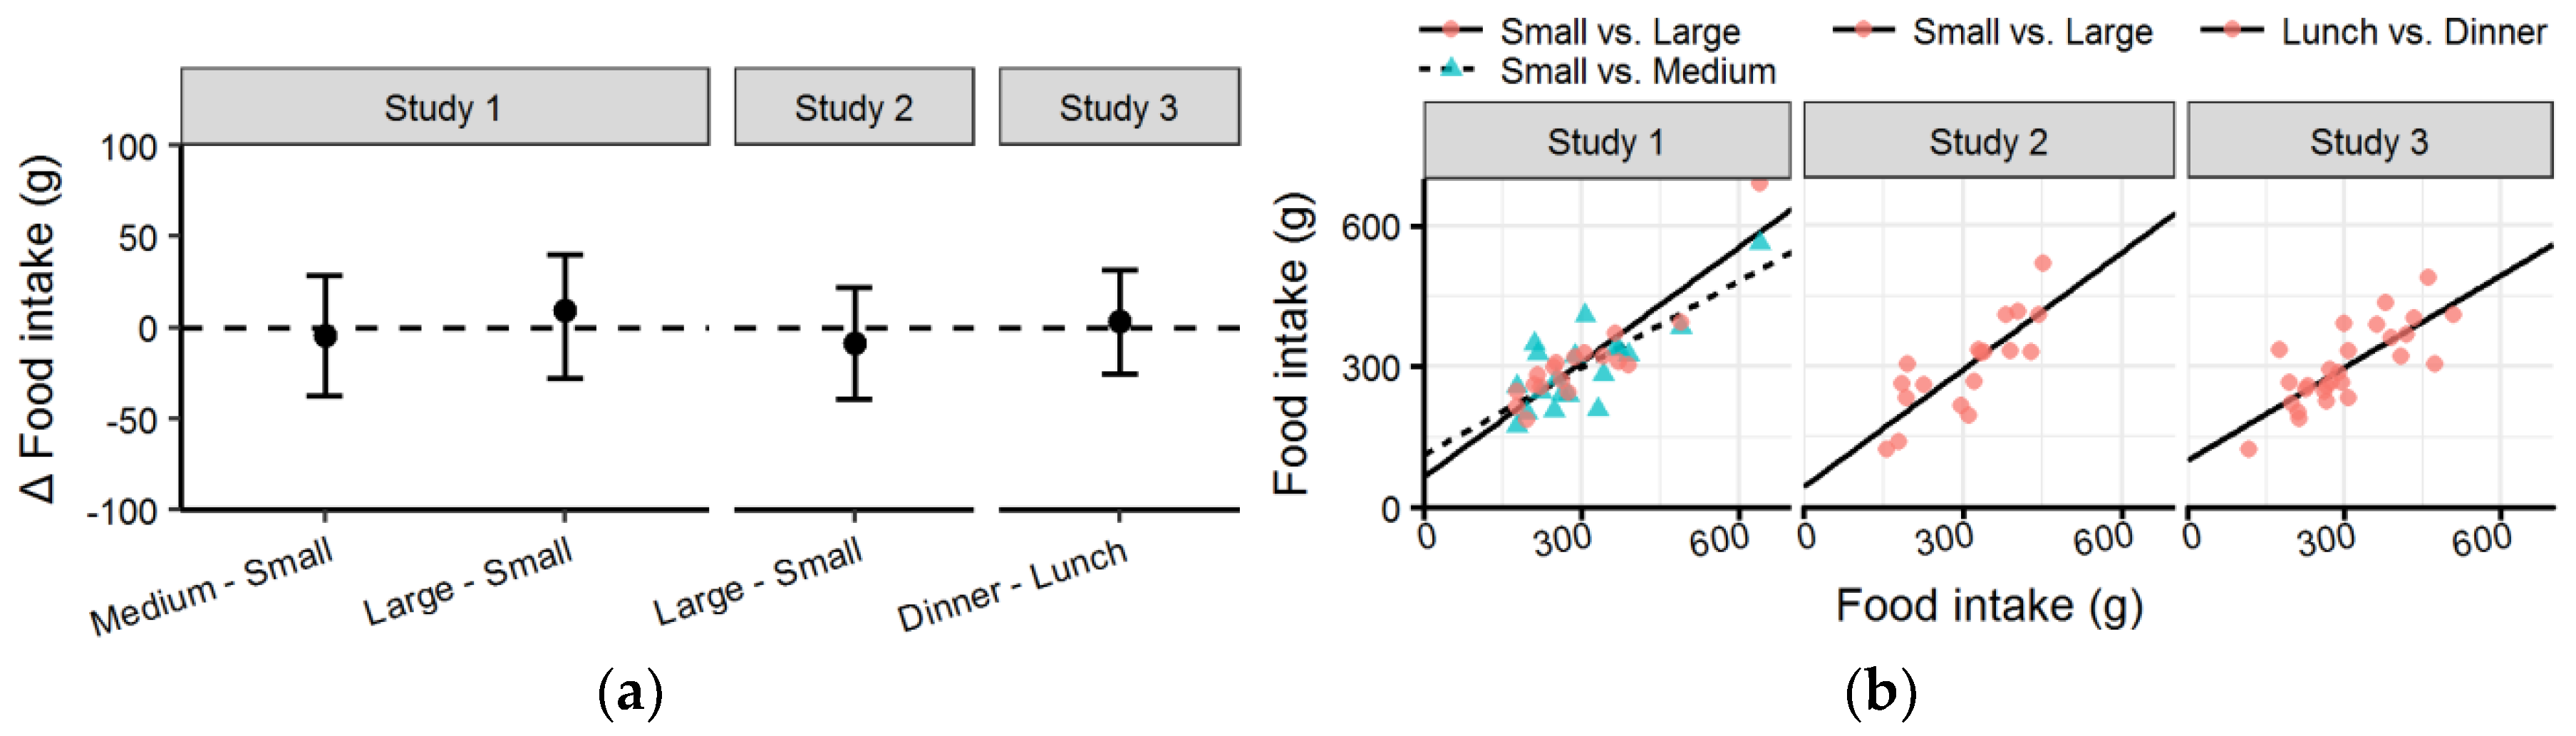
3.3. Food Intake
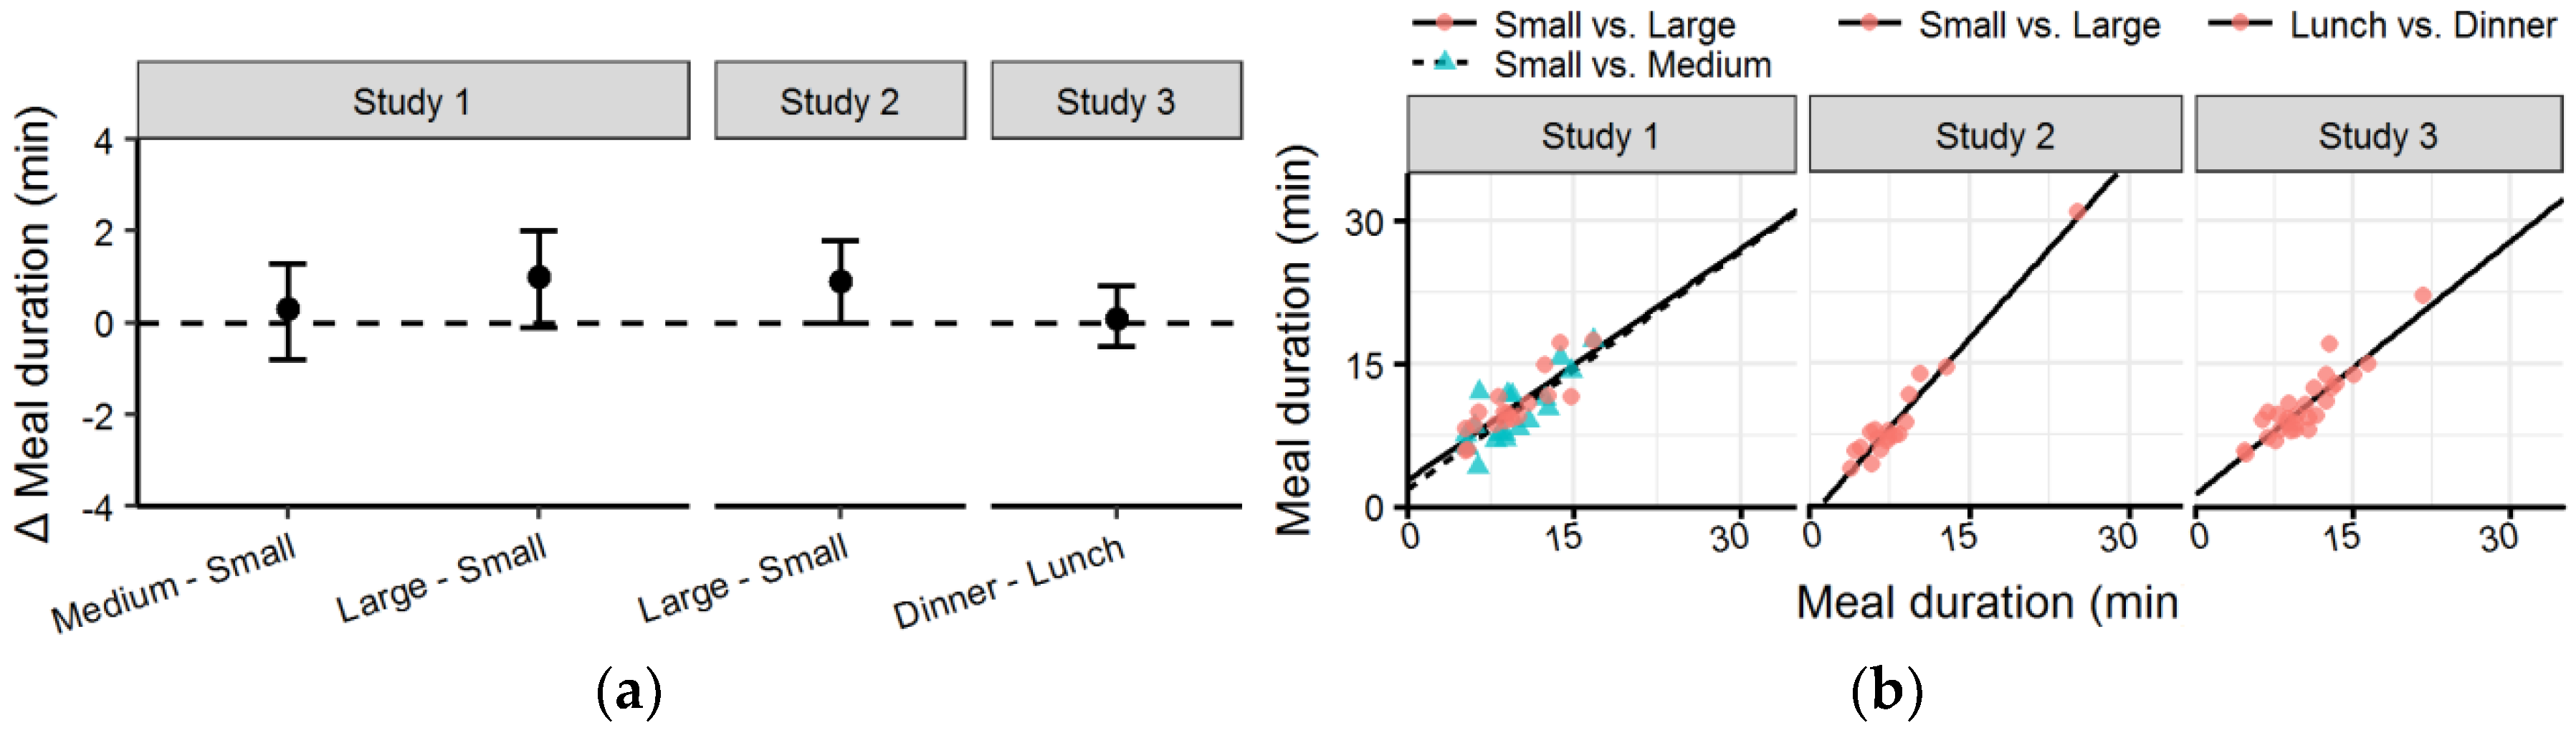
3.4. Meal Duration
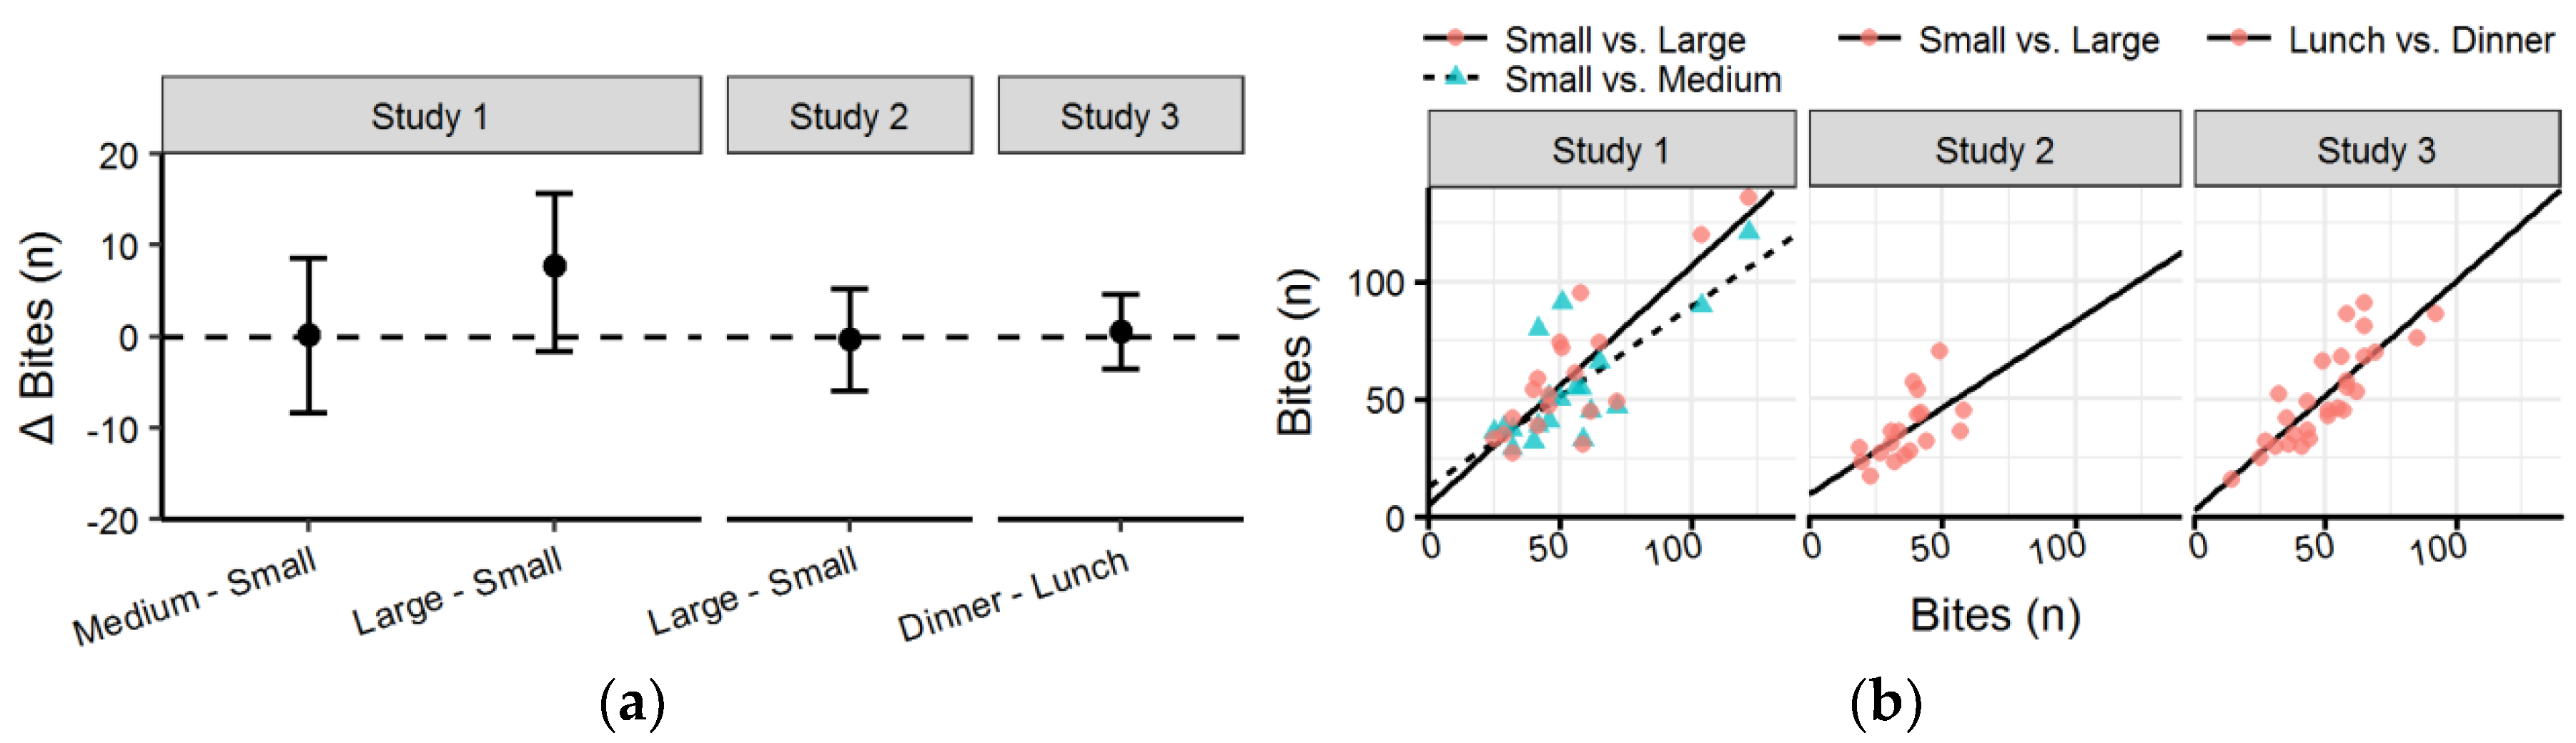
3.5. Bites
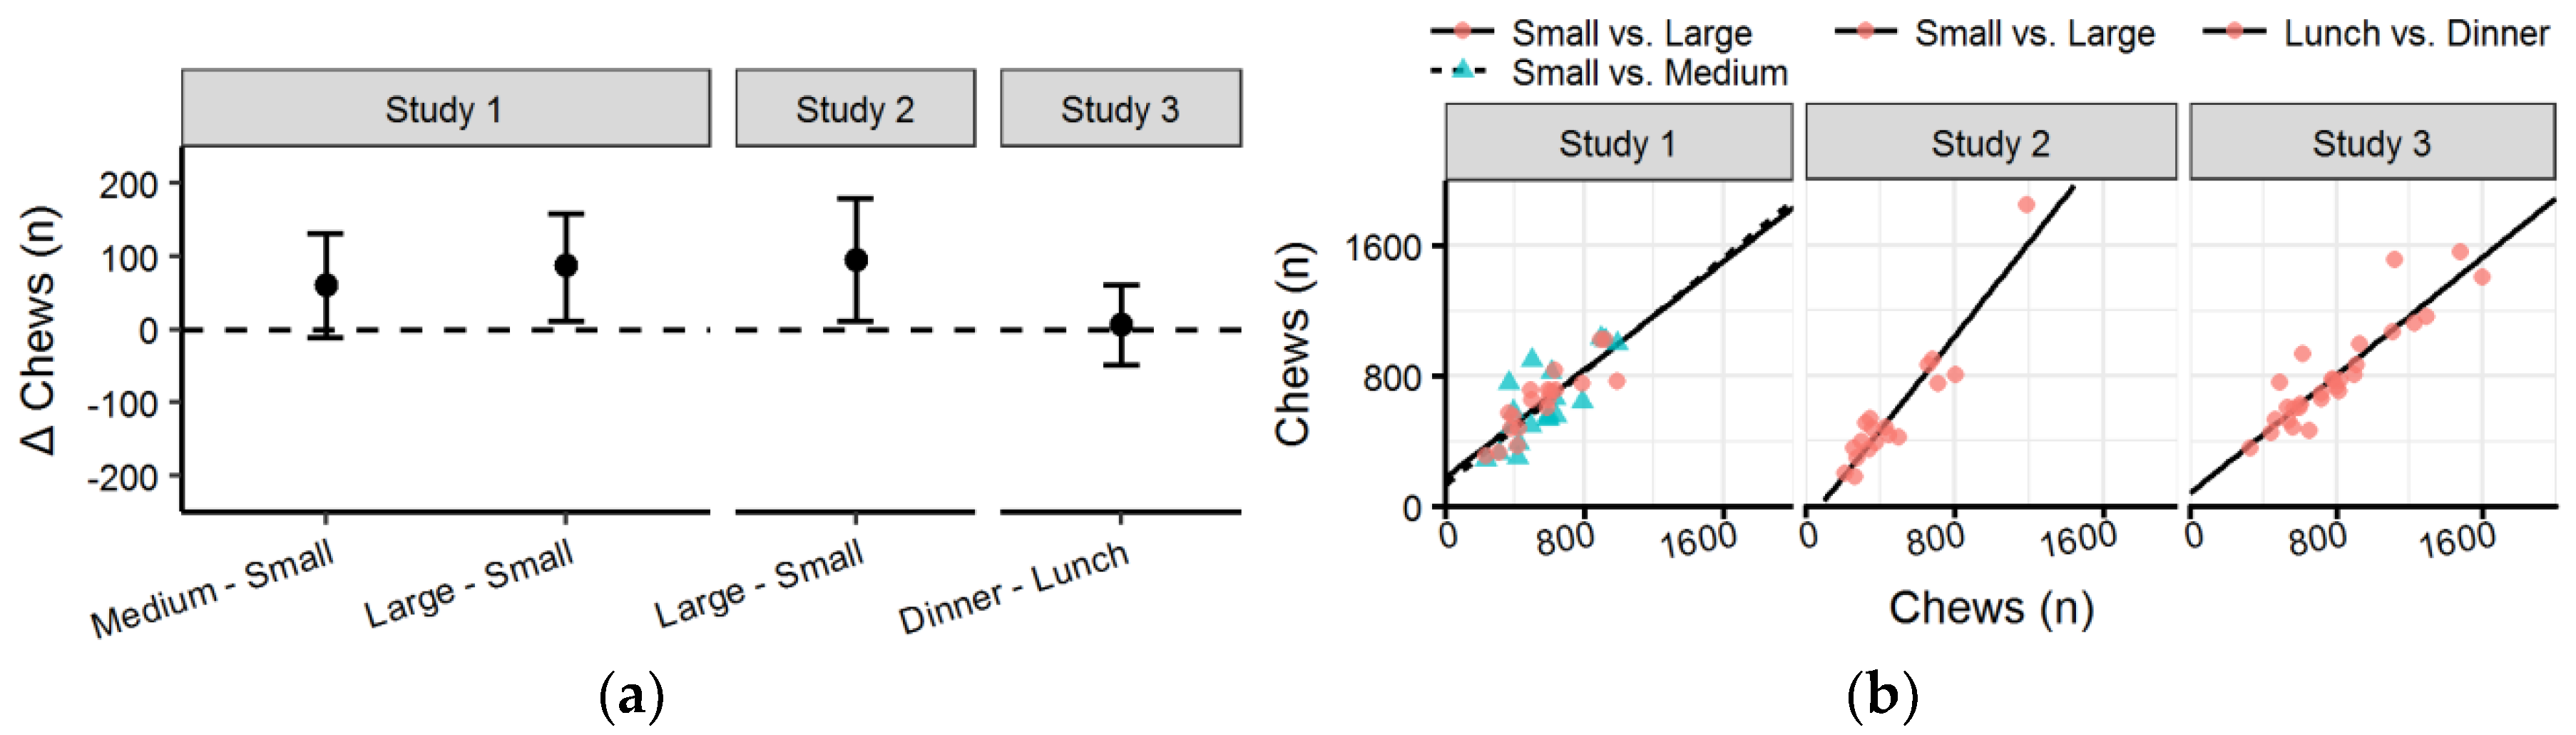
3.6. Chews
3.7. Subjective Scores
4. Discussion
5. Conclusions
Supplementary Materials
Author Contributions
Funding
Conflicts of Interest
References
- Ioakimidis, I.; Zandian, M.; Eriksson-Marklund, L.; Bergh, C.; Grigoriadis, A.; Södersten, P. Description of chewing and food intake over the course of a meal. Physiol. Behav. 2011, 104, 761–769. [Google Scholar] [CrossRef] [PubMed]
- Fontana, J.M.; Farooq, M.; Sazonov, E. Automatic ingestion monitor: A novel wearable device for monitoring of ingestive behavior. IEEE Trans. Biomed. Eng. 2014, 61, 1772–1779. [Google Scholar] [CrossRef] [PubMed]
- Hess, J.M.; Jonnalagadda, S.S.; Slavin, J.L. What is a snack, why do we snack, and how can we choose better snacks? A review of the definitions of snacking, motivations to snack, contributions to dietary intake, and recommendations for improvement. Adv. Nutr. 2016, 7, 466–475. [Google Scholar] [CrossRef] [PubMed]
- Vernarelli, J.A.; Mitchell, D.C.; Rolls, B.J.; Hartman, T.J. Dietary energy density and obesity: How consumption patterns differ by body weight status. Eur. J. Nutr. 2018, 57, 351–361. [Google Scholar] [CrossRef] [PubMed]
- Langlet, B.; Anvret, A.; Maramis, C.; Moulos, I.; Papapanagiotou, V.; Diou, C.; Lekka, E.; Heimeier, R.; Delopoulos, A.; Ioakimidis, I. Objective measures of eating behaviour in a Swedish high school. Behav. Inf. Technol. 2017, 36, 1005–1013. [Google Scholar] [CrossRef]
- Zandian, M.; Ioakimidis, I.; Bergh, C.; Brodin, U.; Södersten, P. Decelerated and linear eaters: Effect of eating rate on food intake and satiety. Physiol. Behav. 2009, 96, 270–275. [Google Scholar] [CrossRef] [PubMed]
- Mills, J.S.; Weinheimer, L.; Polivy, J.; Herman, C.P. Are there different types of dieters? A review of personality and dietary restraint. Appetite 2018, 125, 380–400. [Google Scholar] [CrossRef] [PubMed]
- Timko, C.A.; Juarascio, A.; Chowansky, A. The effect of a pre-load experiment on subsequent food consumption. Caloric and macronutrient intake in the days following a pre-load manipulation. Appetite 2012, 58, 747–753. [Google Scholar] [CrossRef] [PubMed]
- Wallis, D.J.; Hetherington, M.M. Emotions and eating. Self-reported and experimentally induced changes in food intake under stress. Appetite 2009, 52, 355–362. [Google Scholar] [CrossRef] [PubMed]
- Provencher, V.; Polivy, J.; Herman, C.P. Perceived healthiness of food. If it’s healthy, you can eat more! Appetite 2009, 52, 340–344. [Google Scholar] [CrossRef] [PubMed]
- Hopkins, W.G. Individual responses made easy. J. Appl. Physiol. 2015, 118, 1444–1446. [Google Scholar] [CrossRef] [PubMed] [Green Version]
- Schork, N.J.; Goetz, L.H. Single-subject studies in translational nutrition research. Annu. Rev. Nutr. 2017, 37, 395–422. [Google Scholar] [CrossRef] [PubMed]
- Hubel, R.; Laessle, R.G.; Lehrke, S.; Jass, J. Laboratory measurement of cumulative food intake in humans: Results on reliability. Appetite 2006, 46, 57–62. [Google Scholar] [CrossRef] [PubMed]
- Laessle, R.; Geiermann, L. Reliability of laboratory measurement of human food intake. Appetite 2012, 58, 249–251. [Google Scholar] [CrossRef] [PubMed]
- McCrickerd, K.; Forde, C.G. Consistency of eating rate, oral processing behaviours and energy intake across weals. Nutrients 2017, 9, 891. [Google Scholar] [CrossRef] [PubMed]
- De Graaf, C. Why liquid energy results in overconsumption. Proc. Nutr. Soc. 2011, 70, 162–170. [Google Scholar] [CrossRef] [PubMed] [Green Version]
- De Wijk, R.A.; Zijlstra, N.; Mars, M.; de Graaf, C.; Prinz, J.F. The effects of food viscosity on bite size, bite effort and food intake. Physiol. Behav. 2008, 95, 527–532. [Google Scholar] [CrossRef] [PubMed]
- Brennan, I.M.; Luscombe-Marsh, N.D.; Seimon, R.V.; Otto, B.; Horowitz, M.; Wishart, J.M.; Feinle-Bisset, C. Effects of fat, protein, and carbohydrate and protein load on appetite, plasma cholecystokinin, peptide YY, and ghrelin, and energy intake in lean and obese men. Am. J. Physiol. Gastrointest. Liver Physiol. 2012, 303, G129–G140. [Google Scholar] [CrossRef] [PubMed]
- Westerterp-Plantenga, M.S. Eating behavior in humans, characterized by cumulative food intake curves—A review. Neurosci. Biobehav. Rev. 2000, 24, 239–248. [Google Scholar] [CrossRef]
- Ferriday, D.; Bosworth, M.L.; Godinot, N.; Martin, N.; Forde, C.G.; Van Den Heuvel, E.; Appleton, S.L.; Mercer Moss, F.J.; Rogers, P.J.; Brunstrom, J.M. Variation in the oral processing of everyday meals is associated with fullness and meal size; a potential nudge to reduce energy intake? Nutrients 2016, 8, 315. [Google Scholar] [CrossRef] [PubMed]
- Zijlstra, N.; de Wijk, R.A.; Mars, M.; Stafleu, A.; de Graaf, C. Effect of bite size and oral processing time of a semisolid food on satiation. Am. J. Clin. Nutr. 2009, 90, 269–275. [Google Scholar] [CrossRef] [PubMed] [Green Version]
- Robinson, E.; Almiron-Roig, E.; Rutters, F.; de Graaf, C.; Forde, C.G.; Smith, C.T.; Nolan, S.J.; Jebb, S.A. A systematic review and meta-analysis examining the effect of eating rate on energy intake and hunger. Am. J. Clin. Nutr. 2014, 100, 123–151. [Google Scholar] [CrossRef] [PubMed] [Green Version]
- Miquel-Kergoat, S.; Azais-Braesco, V.; Burton-Freeman, B.; Hetherington, M.M. Effects of chewing on appetite, food intake and gut hormones: A systematic review and meta-analysis. Physiol. Behav. 2015, 151, 88–96. [Google Scholar] [CrossRef] [PubMed]
- Fogel, A.; Goh, A.T.; Fries, L.R.; Sadananthan, S.A.; Velan, S.S.; Michael, N.; Tint, M.T.; Fortier, M.V.; Chan, M.J.; Toh, J.Y.; et al. A description of an “obesogenic” eating style that promotes higher energy intake and is associated with greater adiposity in 4.5 year-old children: Results from the GUSTO cohort. Physiol. Behav. 2017, 176, 107–116. [Google Scholar] [CrossRef] [PubMed]
- Zhu, Y.; Hollis, J.H. Relationship between chewing behavior and body weight status in fully dentate healthy adults. Int. J. Food Sci. Nutr. 2015, 66, 135–139. [Google Scholar] [CrossRef] [PubMed]
- Peyron, M.-A.; Mishellany, A.; Woda, A. particle size distribution of food boluses after mastication of six natural foods. J. Dent. Res. 2004, 83, 578–582. [Google Scholar] [CrossRef] [PubMed]
- Geier, A.B.; Rozin, P.; Doros, G. Unit bias: A new heuristic that helps explain the effect of portion size on food intake. Psychol. Sci. 2006, 17, 521–525. [Google Scholar] [CrossRef] [PubMed]
- Kerameas, K.; Vartanian, L.R.; Herman, C.P.; Polivy, J. The effect of portion size and unit size on food intake: Unit bias or segmentation effect? Am. Psychol. Assoc. 2015, 34, 670–676. [Google Scholar] [CrossRef] [PubMed]
- Devitt, A.A.; Mattes, R.D. Effects of food unit size and energy density on intake in humans. Appetite 2004, 42, 213–220. [Google Scholar] [CrossRef] [PubMed]
- Bucher, T.; Rollo, M.E.; Smith, S.P.; Dean, M.; Brown, H.; Sun, M.; Collins, C. Position paper on the need for portion-size education and a standardised unit of measurement. Health Promot. J. Aust. Off. J. Aust. Assoc. Health Promot. Prof. 2017, 28, 260–263. [Google Scholar] [CrossRef] [PubMed]
- Garaulet, M.; Gómez-Abellán, P. Timing of food intake and obesity: A novel association. Physiol. Behav. 2014, 134, 44–50. [Google Scholar] [CrossRef] [PubMed]
- Wang, J.B.; Patterson, R.E.; Ang, A.; Emond, J.A.; Shetty, N.; Arab, L. Timing of energy intake during the day is associated with the risk of obesity in adults. J. Hum. Nutr. Diet. Off. J. Br. Diet. Assoc. 2014, 27 (Suppl. 2), 255–262. [Google Scholar] [CrossRef] [PubMed]
- Jakubowicz, D.; Barnea, M.; Wainstein, J.; Froy, O. High caloric intake at breakfast vs. dinner differentially influences weight loss of overweight and obese women. Obes. 2013, 21, 2504–2512. [Google Scholar] [CrossRef] [PubMed]
- Almoosawi, S.; Vingeliene, S.; Karagounis, L.G.; Pot, G.K. Chrono-nutrition: A review of current evidence from observational studies on global trends in time-of-day of energy intake and its association with obesity. Proc. Nutr. Soc. 2016, 75, 487–500. [Google Scholar] [CrossRef] [PubMed]
- Sjöberg, A.; Hallberg, L.; Höglund, D.; Hulthén, L. Meal pattern, food choice, nutrient intake and lifestyle factors in The Göteborg Adolescence Study. Eur. J. Clin. Nutr. 2003, 57, 1569–1578. [Google Scholar] [CrossRef] [PubMed] [Green Version]
- Zandian, M.; Bergh, C.; Ioakimidis, I.; Esfandiari, M.; Shield, J.; Lightman, S.; Leon, M.; Södersten, P. Control of body weight by eating behavior in children. Front. Pediatr. 2015, 3. [Google Scholar] [CrossRef] [PubMed]
- Ioakimidis, I.; Zandian, M.; Ulbl, F.; Åhlund, C.; Bergh, C.; Södersten, P. Food intake and chewing in women. Neurocomputing 2012, 84, 31–38. [Google Scholar] [CrossRef]
- Green, B.G.; Shaffer, G.S.; Gilmore, M.M. Derivation and evaluation of a semantic scale of oral sensation magnitude with apparent ratio properties. Chem. Senses 1993, 18, 683–702. [Google Scholar] [CrossRef]
- R Core Team. R: A Language and Environment for Statistical Computing; R Foundation for Statistical Computing: Vienna, Austria, 2015; ISBN 3-900051-07-0. [Google Scholar]
- McGill, R.; Tukey, J.W.; Larsen, W.A. Variations of box plots. Am. Stat. 1978, 32, 12–16. [Google Scholar] [CrossRef]
- Hesser, H. Modeling individual differences in randomized experiments using growth models: Recommendations for design, statistical analysis and reporting of results of internet interventions. Internet Interv. 2015, 2, 110–120. [Google Scholar] [CrossRef]
- Lindstrom, M.J.; Bates, D.M. Newton-raphson and EM algorithms for linear mixed-effects models for repeated-measures data. J. Am. Stat. Assoc. 1988, 83, 1014–1022. [Google Scholar] [CrossRef]
- Mukaka, M.M. Statistics corner: A guide to appropriate use of correlation coefficient in medical research. Malawi Med. J. J. Med. Assoc. Malawi 2012, 24, 69–71. [Google Scholar]
- Zou, K.H.; Tuncali, K.; Silverman, S.G. Correlation and simple linear regression. Radiology 2003, 227, 617–622. [Google Scholar] [CrossRef] [PubMed]
- Stroebele, N.; De Castro, J.M. Effect of ambience on food intake and food choice. Nutrition 2004, 20, 821–838. [Google Scholar] [CrossRef] [PubMed]
- Wansink, B. Environmental factors that increase the food intake and consumption volume of unknowing consumers. Annu. Rev. Nutr. 2004, 24, 455–479. [Google Scholar] [CrossRef] [PubMed]
- Whatnall, M.C.; Patterson, A.J.; Ashton, L.M.; Hutchesson, M.J. Effectiveness of brief nutrition interventions on dietary behaviours in adults: A systematic review. Appetite 2018, 120, 335–347. [Google Scholar] [CrossRef] [PubMed]
- Van Kleef, E.; Bruggers, I.; de Vet, E. Encouraging vegetable intake as a snack among children: The influence of portion and unit size. Public Health Nutr. 2015, 18, 2736–2741. [Google Scholar] [CrossRef] [PubMed]
- Van Kleef, E.; Kavvouris, C.; van Trijp, H.C.M. The unit size effect of indulgent food: How eating smaller sized items signals impulsivity and makes consumers eat less. Psychol. Health 2014, 29, 1081–1103. [Google Scholar] [CrossRef] [PubMed]
- Shiozawa, K.; Ohnuki, Y.; Mototani, Y.; Umeki, D.; Ito, A.; Saeki, Y.; Hanada, N.; Okumura, S. Effects of food diameter on bite size per mouthful and chewing behavior. J. Physiol. Sci. JPS 2016, 66, 93–98. [Google Scholar] [CrossRef] [PubMed]
- Lasschuijt, M.P.; Mars, M.; Stieger, M.; Miquel-Kergoat, S.; de Graaf, C.; Smeets, P. Comparison of oro-sensory exposure duration and intensity manipulations on satiation. Physiol. Behav. 2017, 176, 76–83. [Google Scholar] [CrossRef] [PubMed]
- Hetherington, M.M.; Anderson, A.S.; Norton, G.N.M.; Newson, L. Situational effects on meal intake: A comparison of eating alone and eating with others. Physiol. Behav. 2006, 88, 498–505. [Google Scholar] [CrossRef] [PubMed]
- Barkeling, B.; Rössner, S.; Sjöberg, A. Methodological studies on single meal food intake characteristics in normal weight and obese men and women. Int. J. Obes. 1995, 19, 284–290. [Google Scholar]
- Holm, L.; Lauridsen, D.; Lund, T.B.; Gronow, J.; Niva, M.; Mäkelä, J. Changes in the social context and conduct of eating in four Nordic countries between 1997 and 2012. Appetite 2016, 103, 358–368. [Google Scholar] [CrossRef] [PubMed]
- Robinson, E.; Bevelander, K.E.; Field, M.; Jones, A. Methodological and reporting quality in laboratory studies of human eating behavior. Appetite 2018, 125, 486–491. [Google Scholar] [CrossRef] [PubMed]
- Maramis, C.; Diou, C.; Ioakeimidis, I.; Lekka, I.; Dudnik, G.; Mars, M.; van den Boer, J.H.W.; Maglaveras, N.; Bergh, C.; Delopoulos, A. Preventing obesity and eating disorders through behavioural modifications: The SPLENDID vision. Appetite 2016, 101, 234. [Google Scholar] [CrossRef]
- Hecksteden, A.; Kraushaar, J.; Scharhag-Rosenberger, F.; Theisen, D.; Senn, S.; Meyer, T. Individual response to exercise training—A statistical perspective. J. Appl. Physiol. Bethesda Md 1985 2015, 118, 1450–1459. [Google Scholar] [CrossRef] [PubMed]


| Study 1 (n = 19) | Study 2 (n = 18) | Study 3 (n = 29) | |
|---|---|---|---|
| Age, years | 22.5 (1.8) | 25.9 (4.7) | 24.4 (2.7) |
| Weight, kg | 59.1 (5.6) | 60.7 (7.8) | 60.9 (6.2) |
| Height, cm | 167.3 (4.7) | 164.1 (5.4) | 164.4 (6.1) |
| Body mass index, kg/m2 | 21.1 (1.6) | 22.5 (2.2) | 22.5 (2.0) |
| Dutch Eating Behaviour Questionnaire | |||
| Emotional, 1–5 | 2.4 (0.8) | 2.1 (0.8) | 2.5 (0.8) |
| External, 1–5 | 3.3 (0.4) | 3.1 (0.4) | 3.3 (0.5) |
| Restrained, 1–5 | 2.7 (1.0) | 2.5 (0.8) | 2.4 (0.9) |
| Hash 1 | Hash 2 | Meat & Potatoes | |
|---|---|---|---|
| Protein, g/100 | 9.6 | 9.1 | 9.4 |
| Carbohydrate, g/100 | 8.2 | 7.8 | 8.5 |
| Fat, g/100 | 2.0 | 2.8 | 6.8 |
| Energy, kcal (kJ) | 91.7 (383.3) | 92.8 (387.9) | 140.1 (585.6) |
| Food Intake (g) | Meal Duration (min) | Bites (n) | Chews (n) | |
|---|---|---|---|---|
| Study 1—Unit size | ||||
| Small | 304 (116) | 9.4 (3.4) | 54.4 (24.4) | 566 (212) |
| Medium | 300 (92) ns | 9.7 (3.5) ns | 54.5 (24.7) ns | 626 (238) ns |
| Large | 312 (107) ns | 10.5 (3.2) ns | 61.9 (29.6) ns | 662 (195) * |
| Study 2—Unit Size | ||||
| Small | 309 (98) | 8.3 (4.7) | 36.8 (11.1) | 471 (251) |
| Large | 301 (101) ns | 9.2 (6.1) * | 36.5 (13.6) ns | 567 (383) * |
| Study 3—Meal Occasion | ||||
| Lunch | 310 (108) | 10.2 (3.6) | 49.2 (17.9) | 802 (316) |
| Dinner | 315 (112) ns | 10.4 (3.6) ns | 50.8 (19.1) ns | 808 (315) ns |
| Before Meal | After Meal | ||||
|---|---|---|---|---|---|
| Desire to eat | Hunger | Desire to eat | Hunger | Food liking | |
| Study 1 | |||||
| Small | 81.3 (17.8) | 82.7 (17.0) | 20.4 (20.0) a | 12.5 (16.0) a | 54.6 (21.6) |
| Medium | 81.6 (21.2) ns | 81.6 (19.5) ns | 20.8 (19.7) ns,a | 12.3 (13.5) ns,a | 58.3 (12.5) ns |
| Large | 84.3 (21.8) ns | 85.5 (19.7) ns | 19.6 (16.2)ns,a | 9.8 (11.5) ns,a | 56.8 (20.9) ns |
| Study 2 | |||||
| Small | 62.7 (25.0) | 53.3 (26.9) | 10.7 (12.8) a | 5.7 (8.1) a | 47.4 (21.4) |
| Large | 57.8 (23.4) ns | 54.4 (27.8) ns | 11.8 (13.9) ns,a | 5.8 (7.8) ns,a | 48.1 (19.1) ns |
| Study 3 | |||||
| Lunch | 78.2 (16.1) | 77.0 (15.5) | 15.8 (14.7) a | 10.7 (11.2) a | 67.8 (17.8) |
| Dinner | 72.8 (17.4) ns | 72.9 (16.6) ns | 16.5 (14.9) ns,a | 8.9 (9.3) ns,a | 62.9 (22.1) ns |
© 2018 by the authors. Licensee MDPI, Basel, Switzerland. This article is an open access article distributed under the terms and conditions of the Creative Commons Attribution (CC BY) license (http://creativecommons.org/licenses/by/4.0/).
Share and Cite
Langlet, B.; Tang Bach, M.; Odegi, D.; Fagerberg, P.; Ioakimidis, I. The Effect of Food Unit Sizes and Meal Serving Occasions on Eating Behaviour Characteristics: Within Person Randomised Crossover Studies on Healthy Women. Nutrients 2018, 10, 880. https://doi.org/10.3390/nu10070880
Langlet B, Tang Bach M, Odegi D, Fagerberg P, Ioakimidis I. The Effect of Food Unit Sizes and Meal Serving Occasions on Eating Behaviour Characteristics: Within Person Randomised Crossover Studies on Healthy Women. Nutrients. 2018; 10(7):880. https://doi.org/10.3390/nu10070880
Chicago/Turabian StyleLanglet, Billy, Mona Tang Bach, Dorothy Odegi, Petter Fagerberg, and Ioannis Ioakimidis. 2018. "The Effect of Food Unit Sizes and Meal Serving Occasions on Eating Behaviour Characteristics: Within Person Randomised Crossover Studies on Healthy Women" Nutrients 10, no. 7: 880. https://doi.org/10.3390/nu10070880