Impact of Morphological Characteristics of Green Roofs on Pedestrian Cooling in Subtropical Climates


Abstract
:1. Introduction
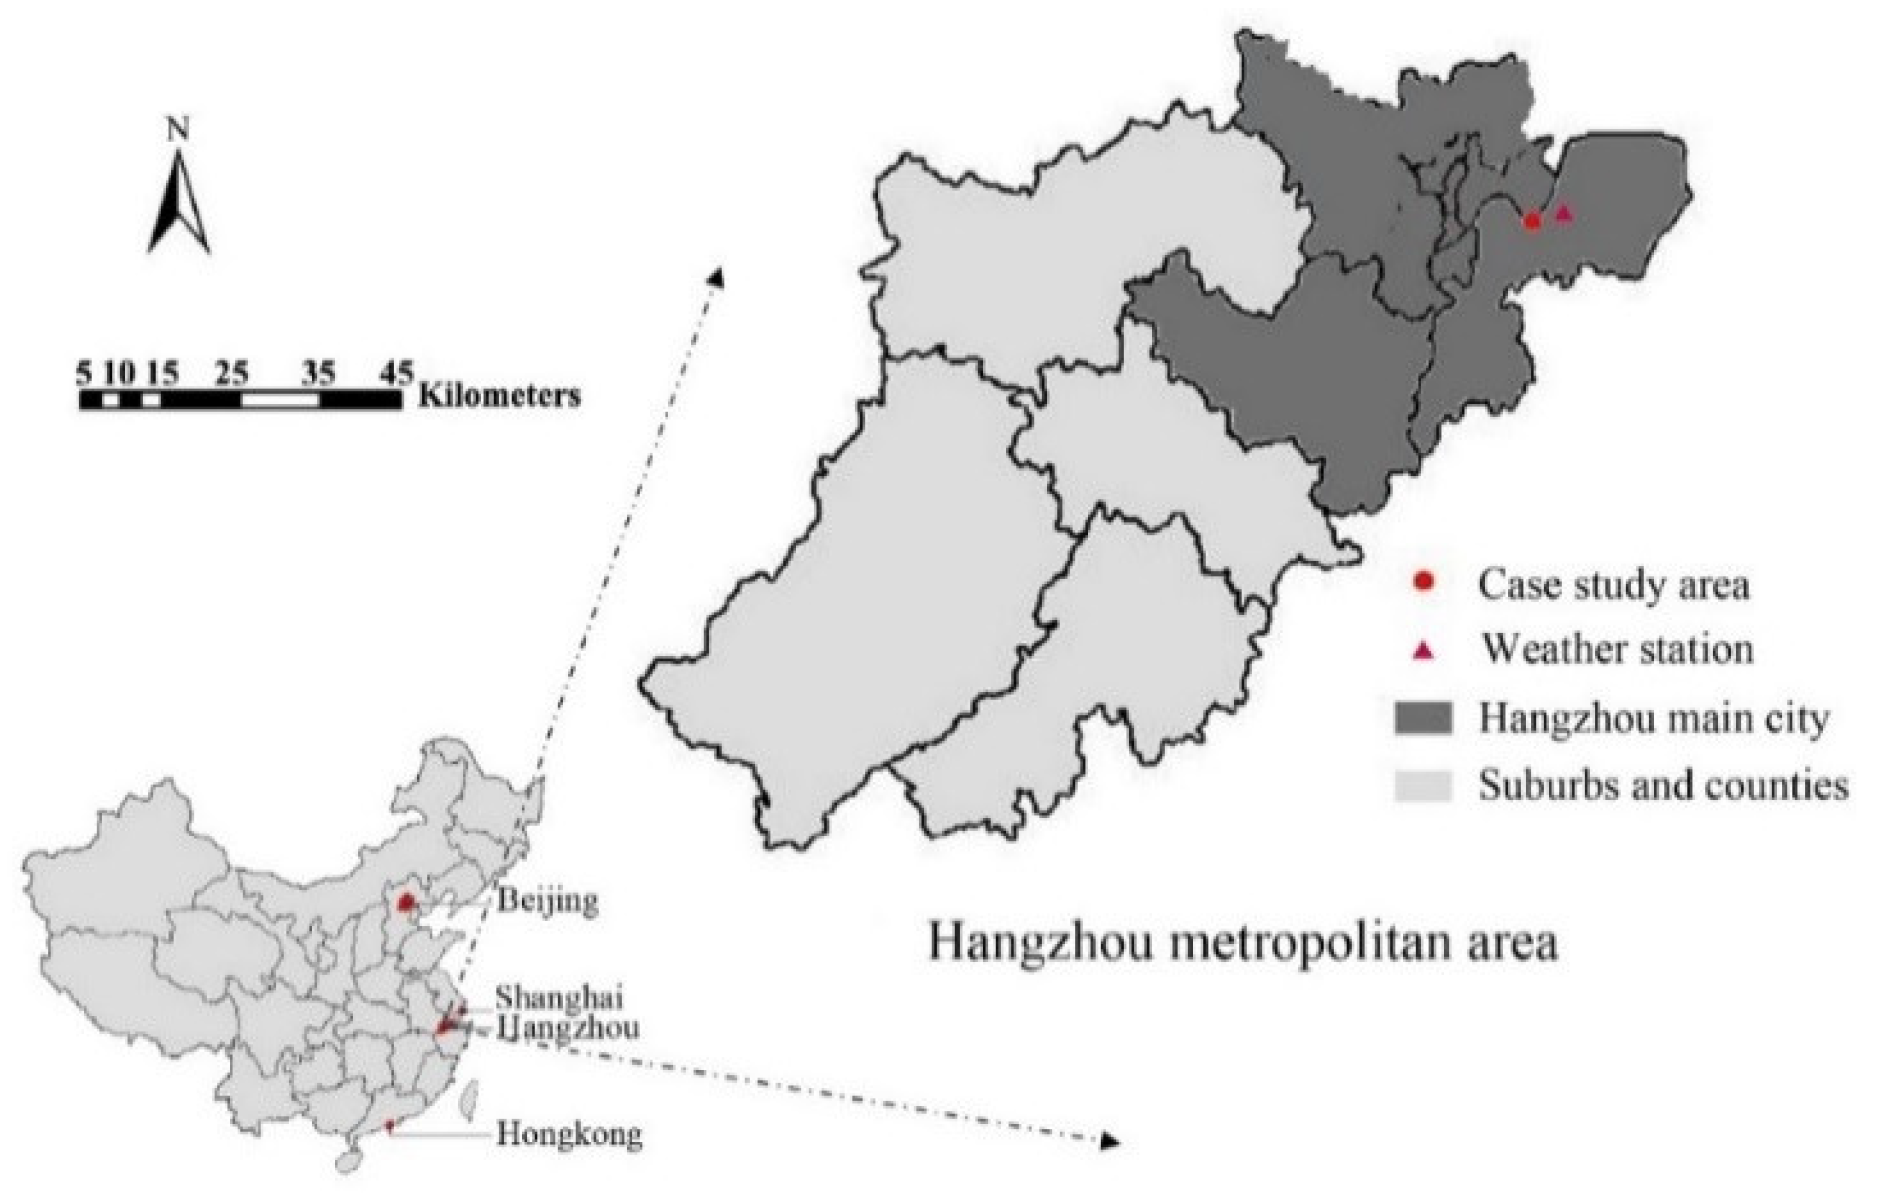
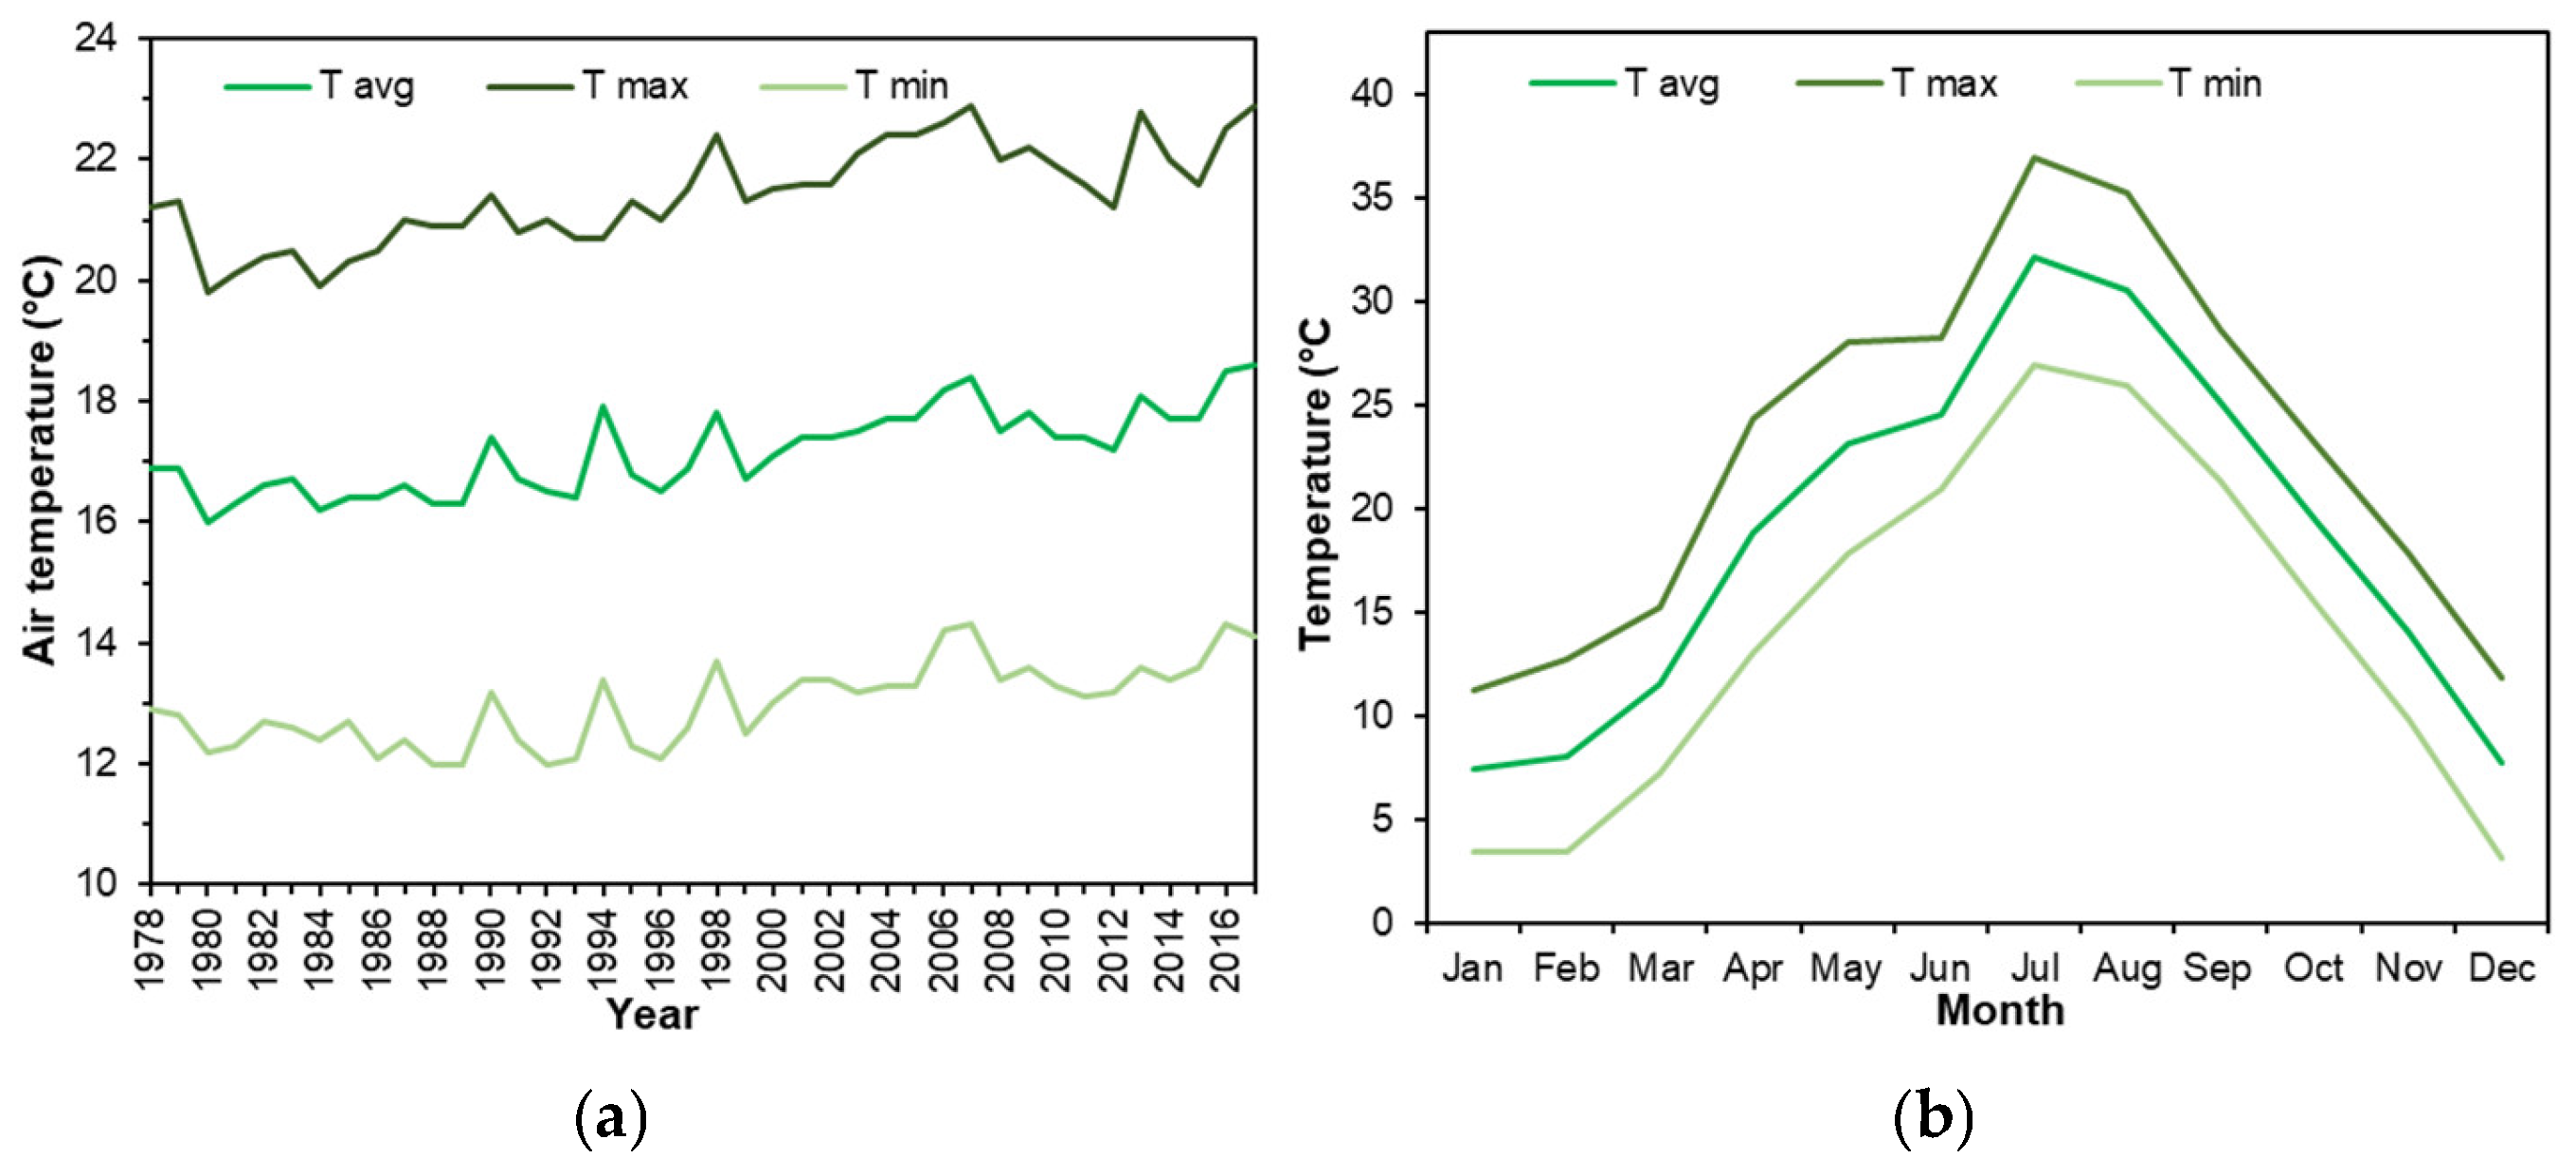
2. Study Area
3. Data and Methodology
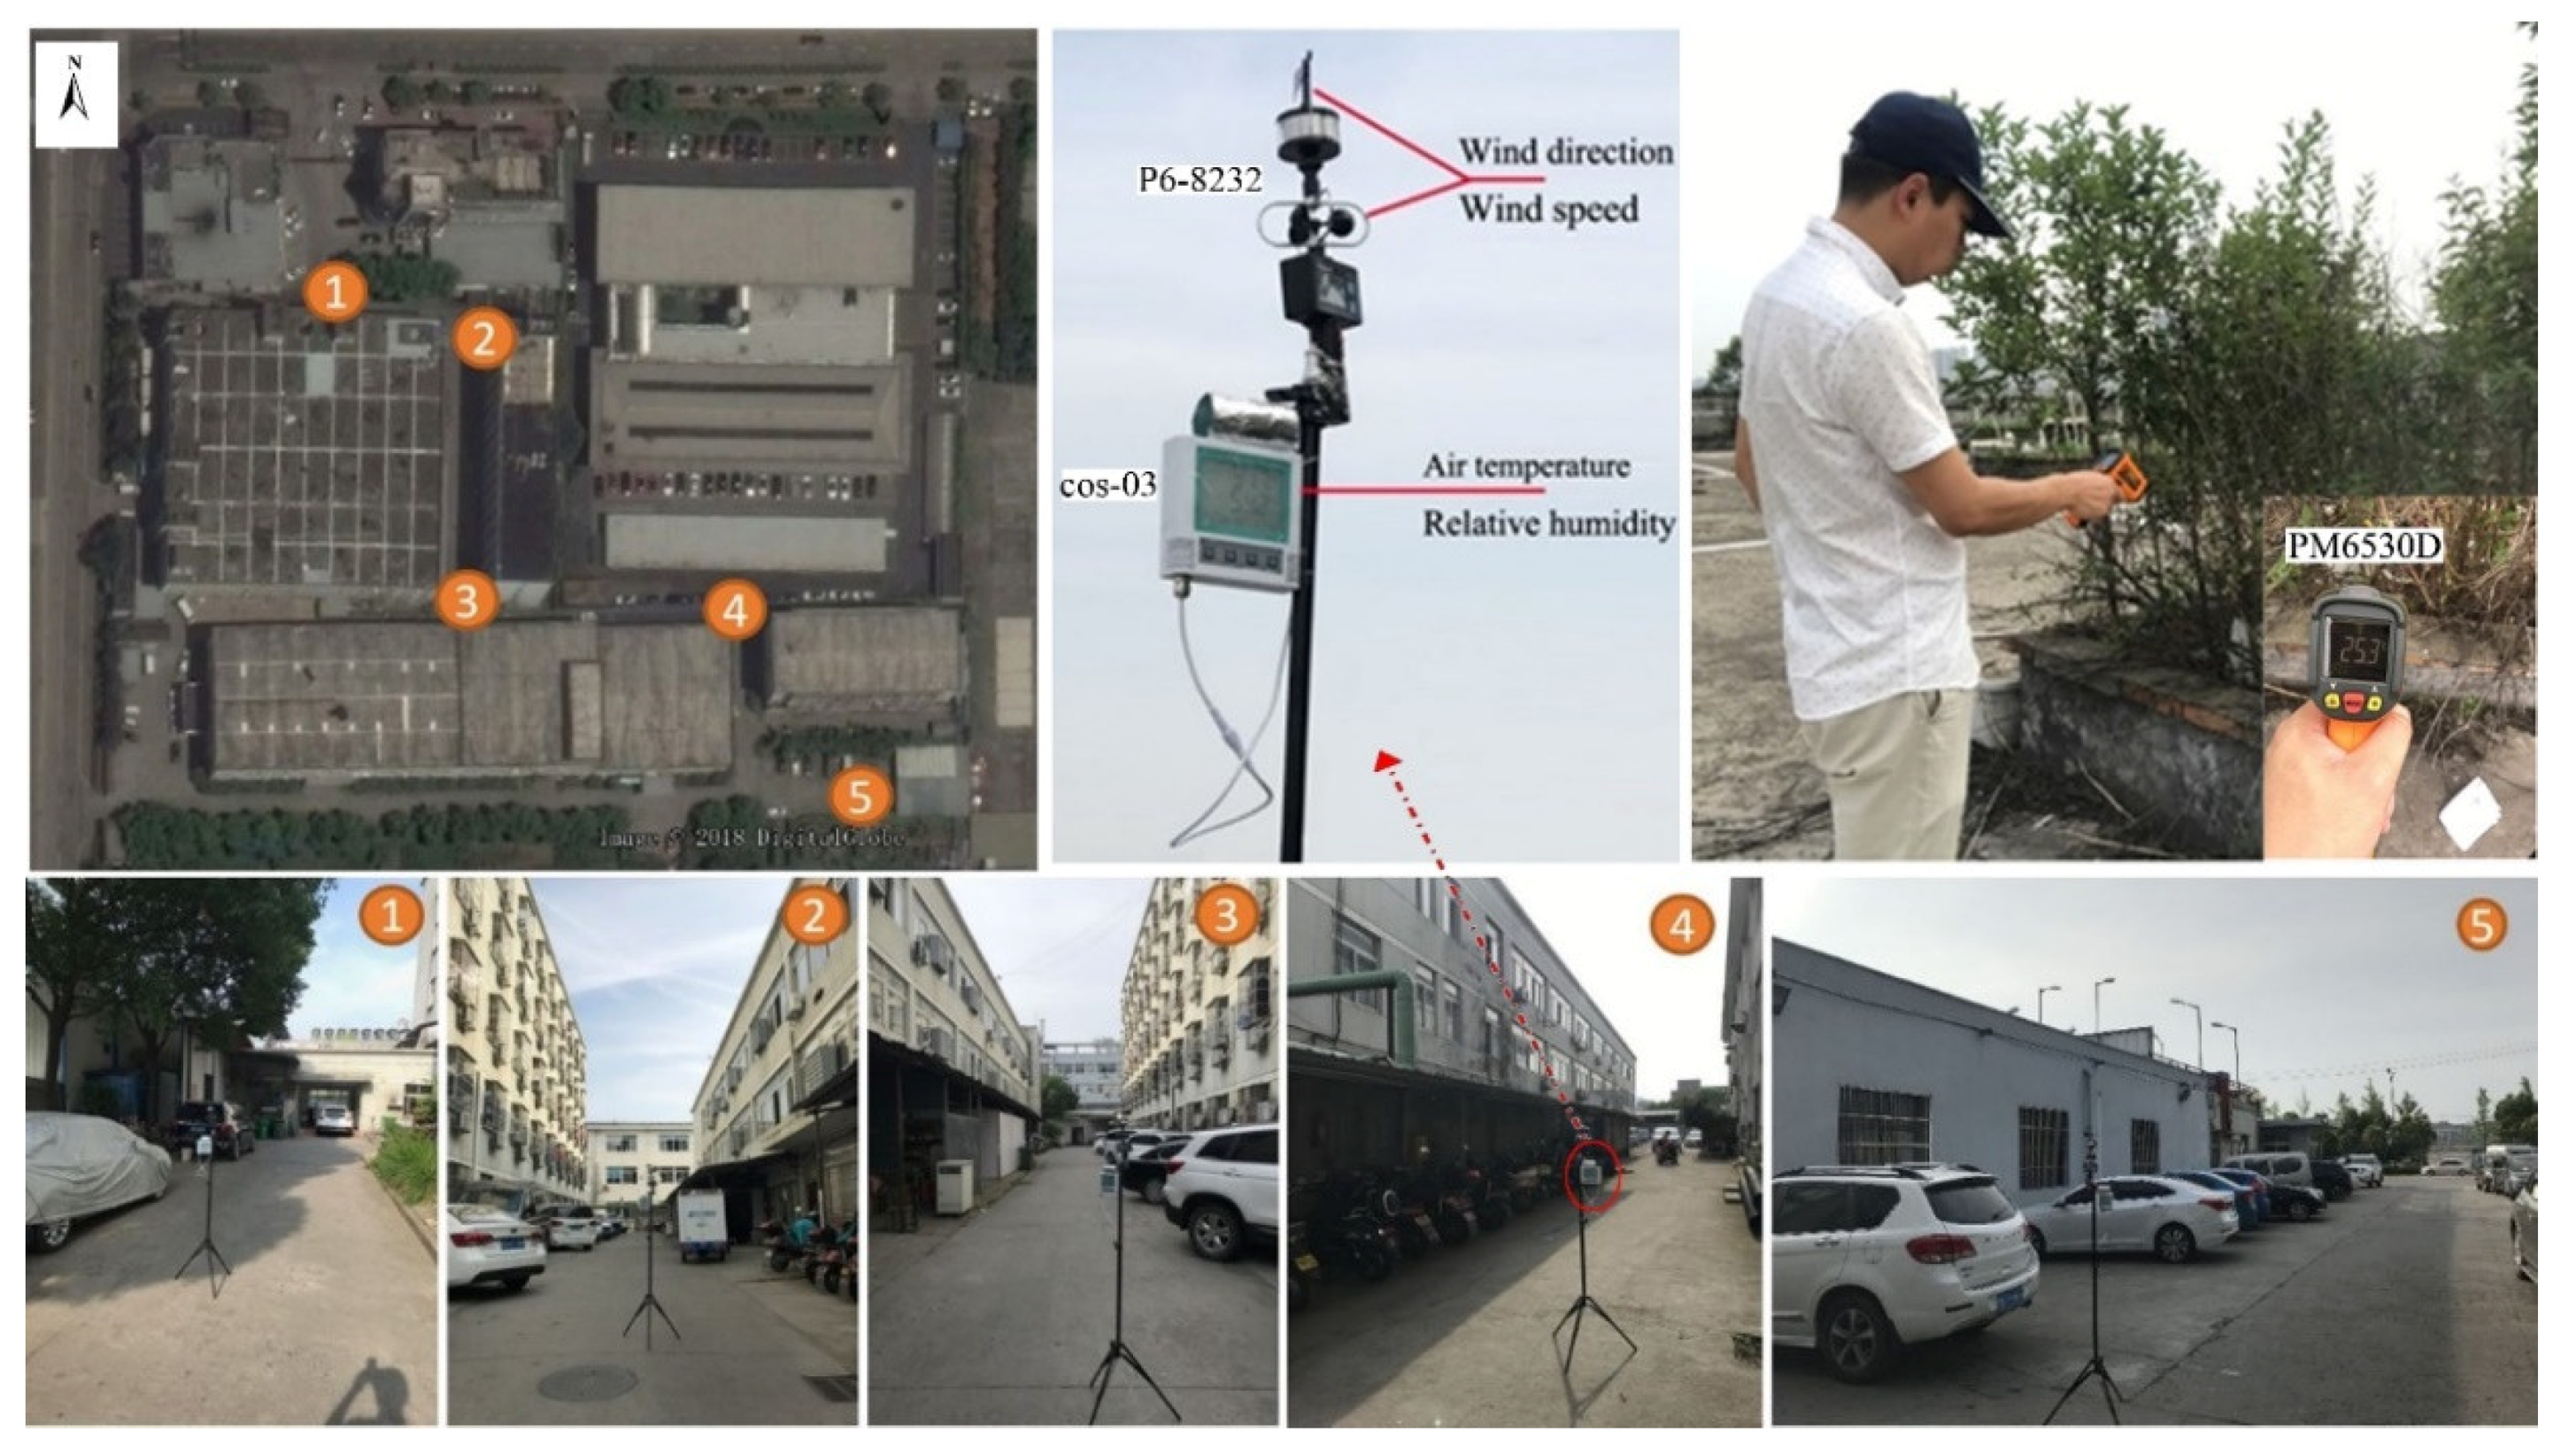
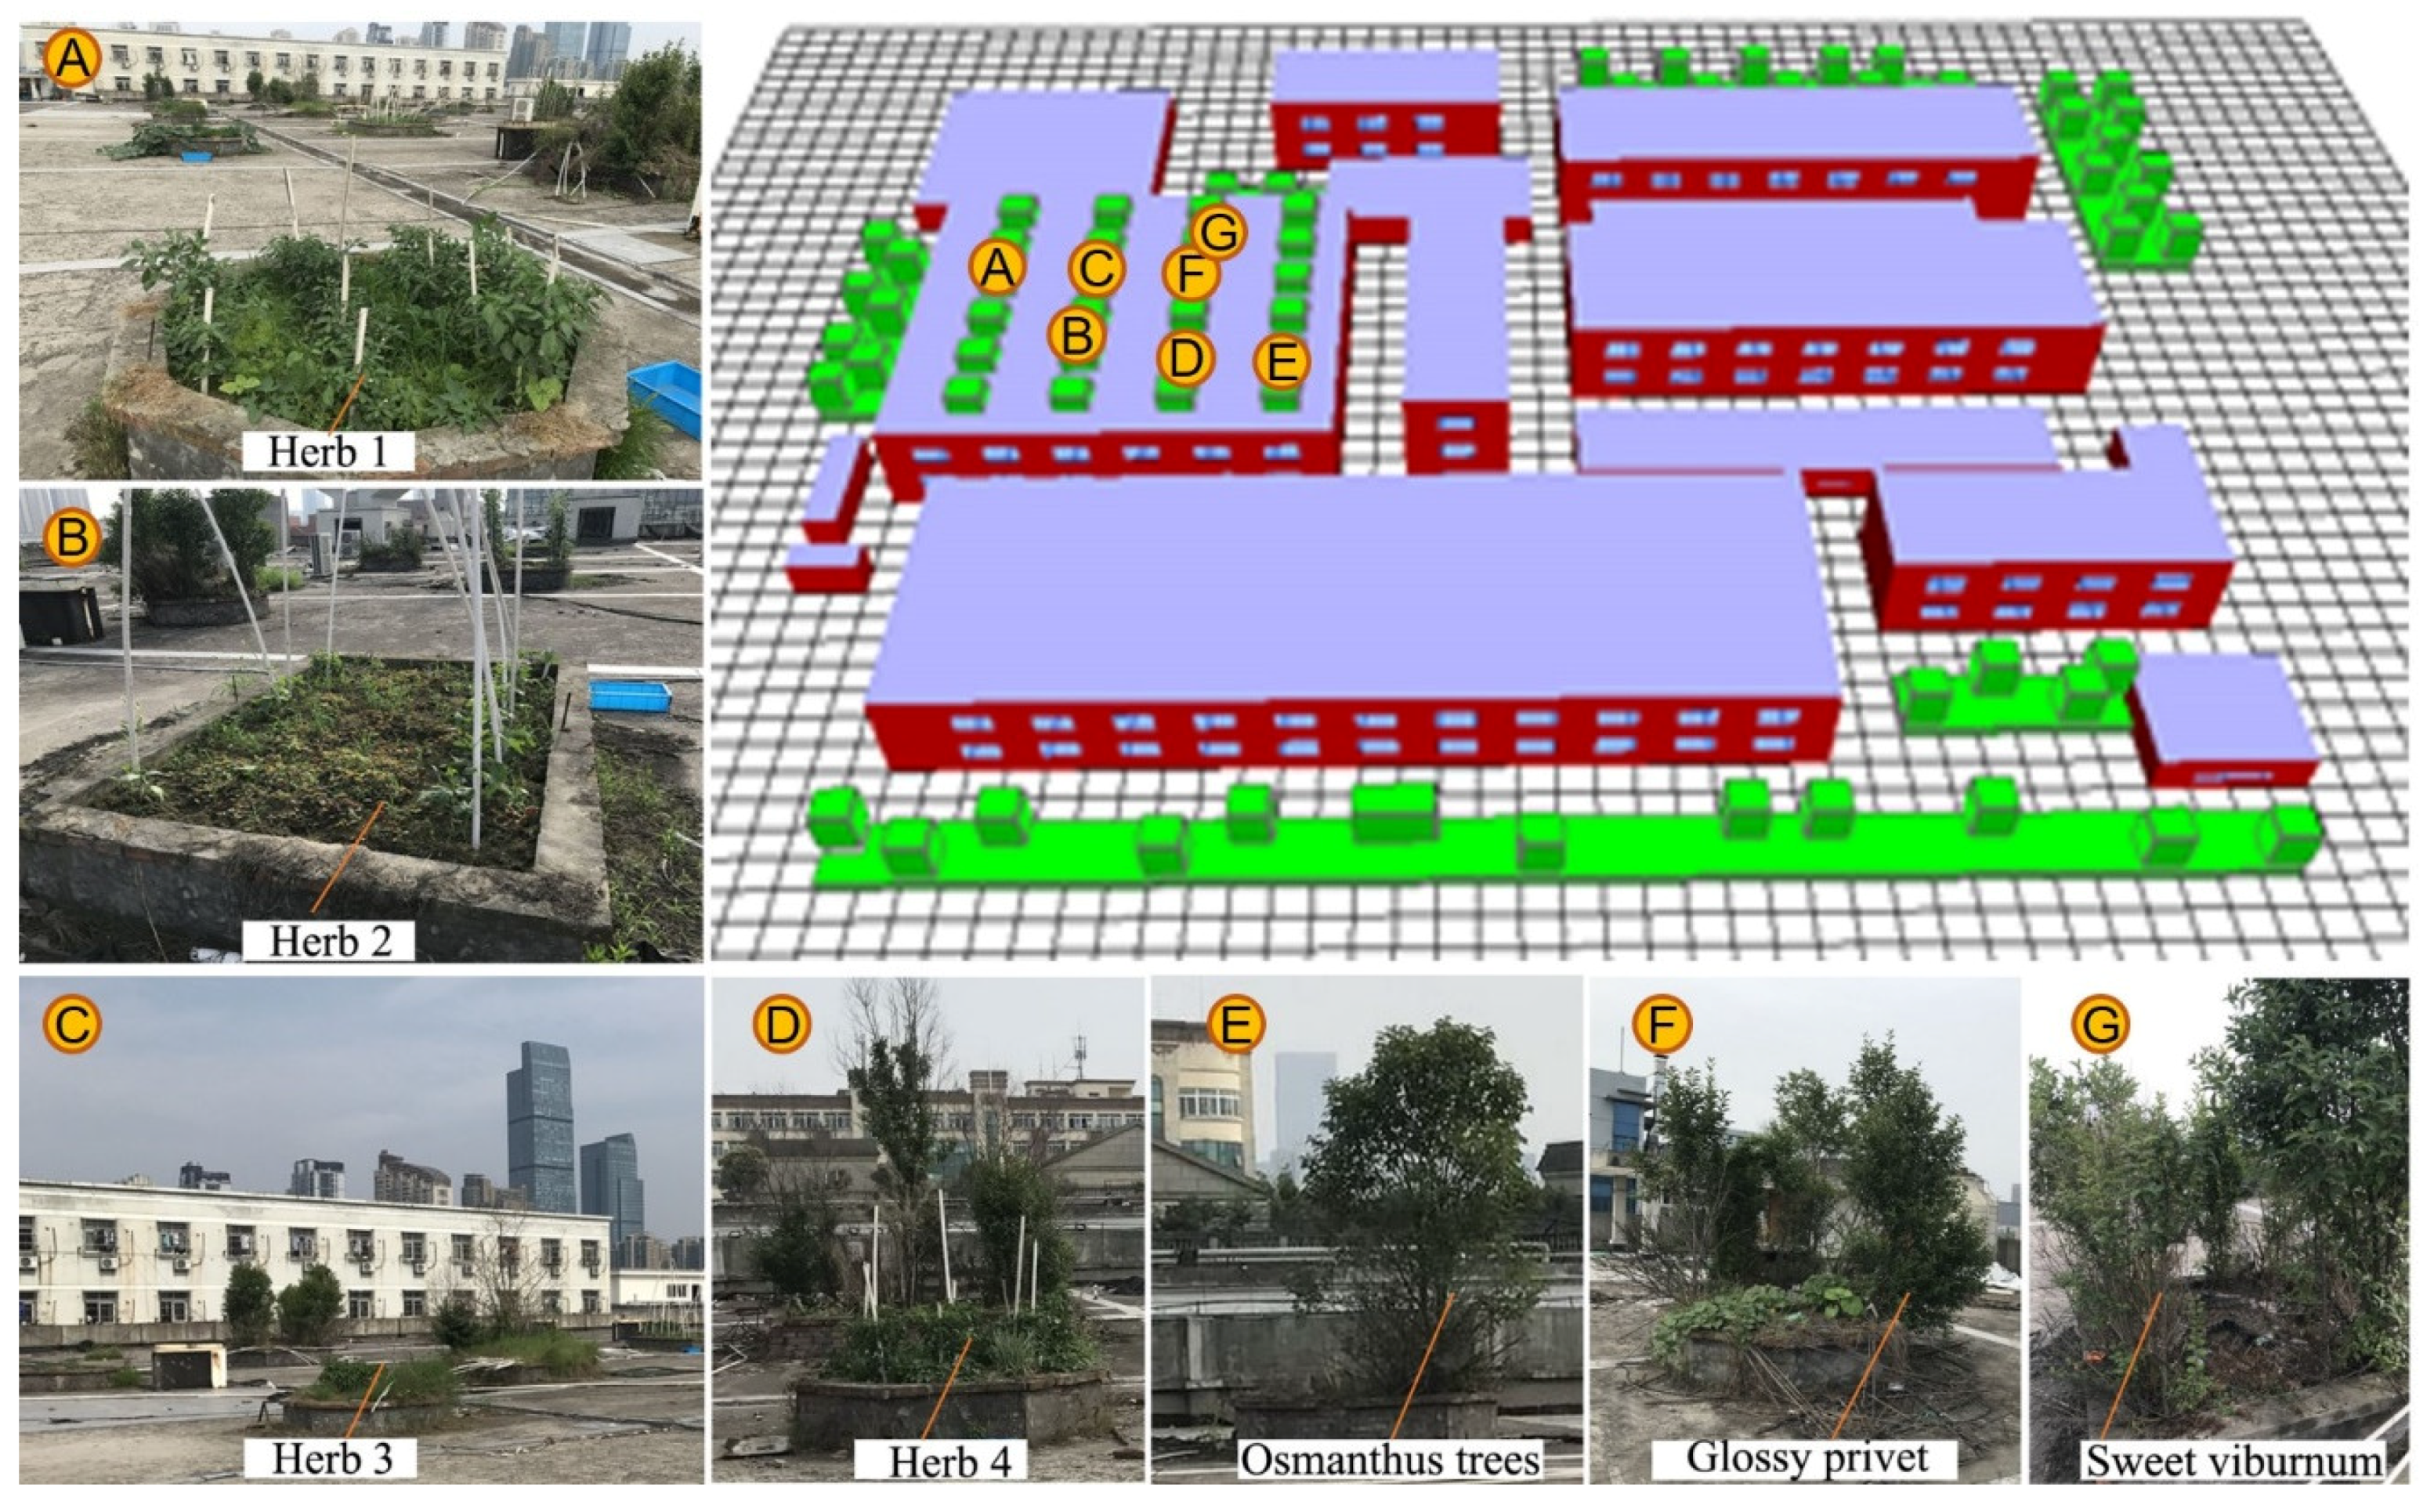
3.1. Field Measurements
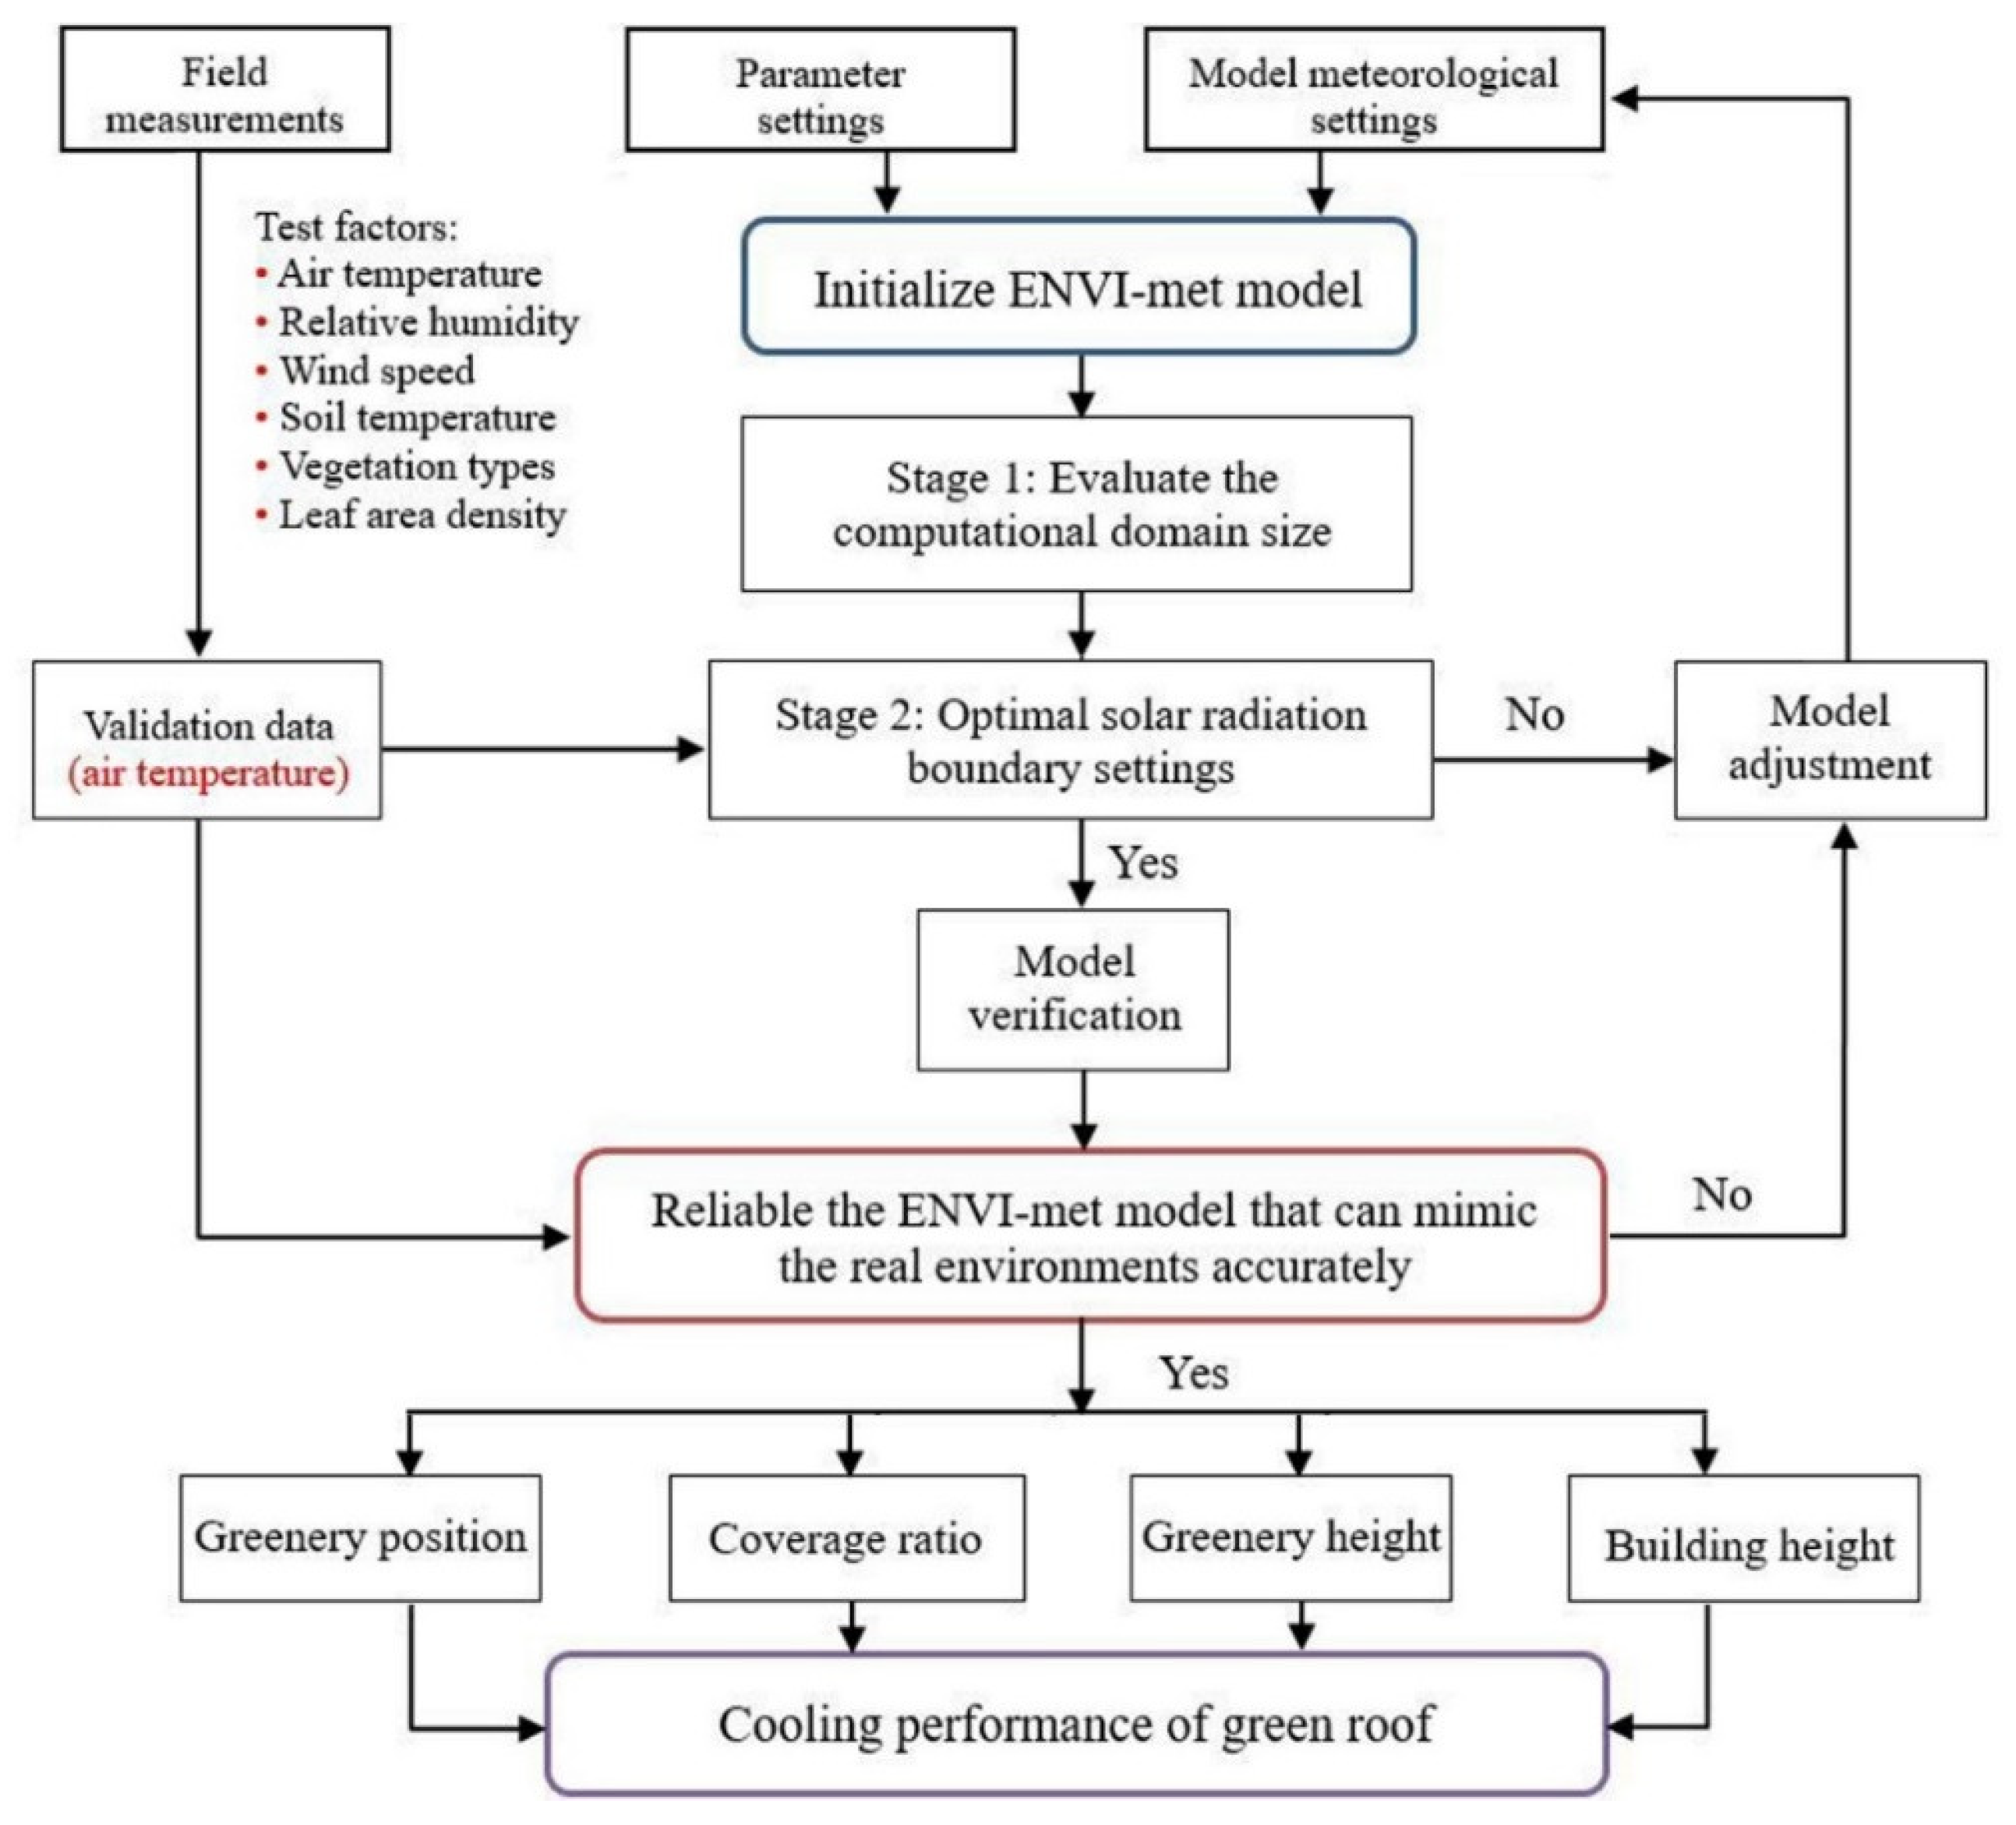
3.2. Settings and the Calibration of ENVI-Met Model
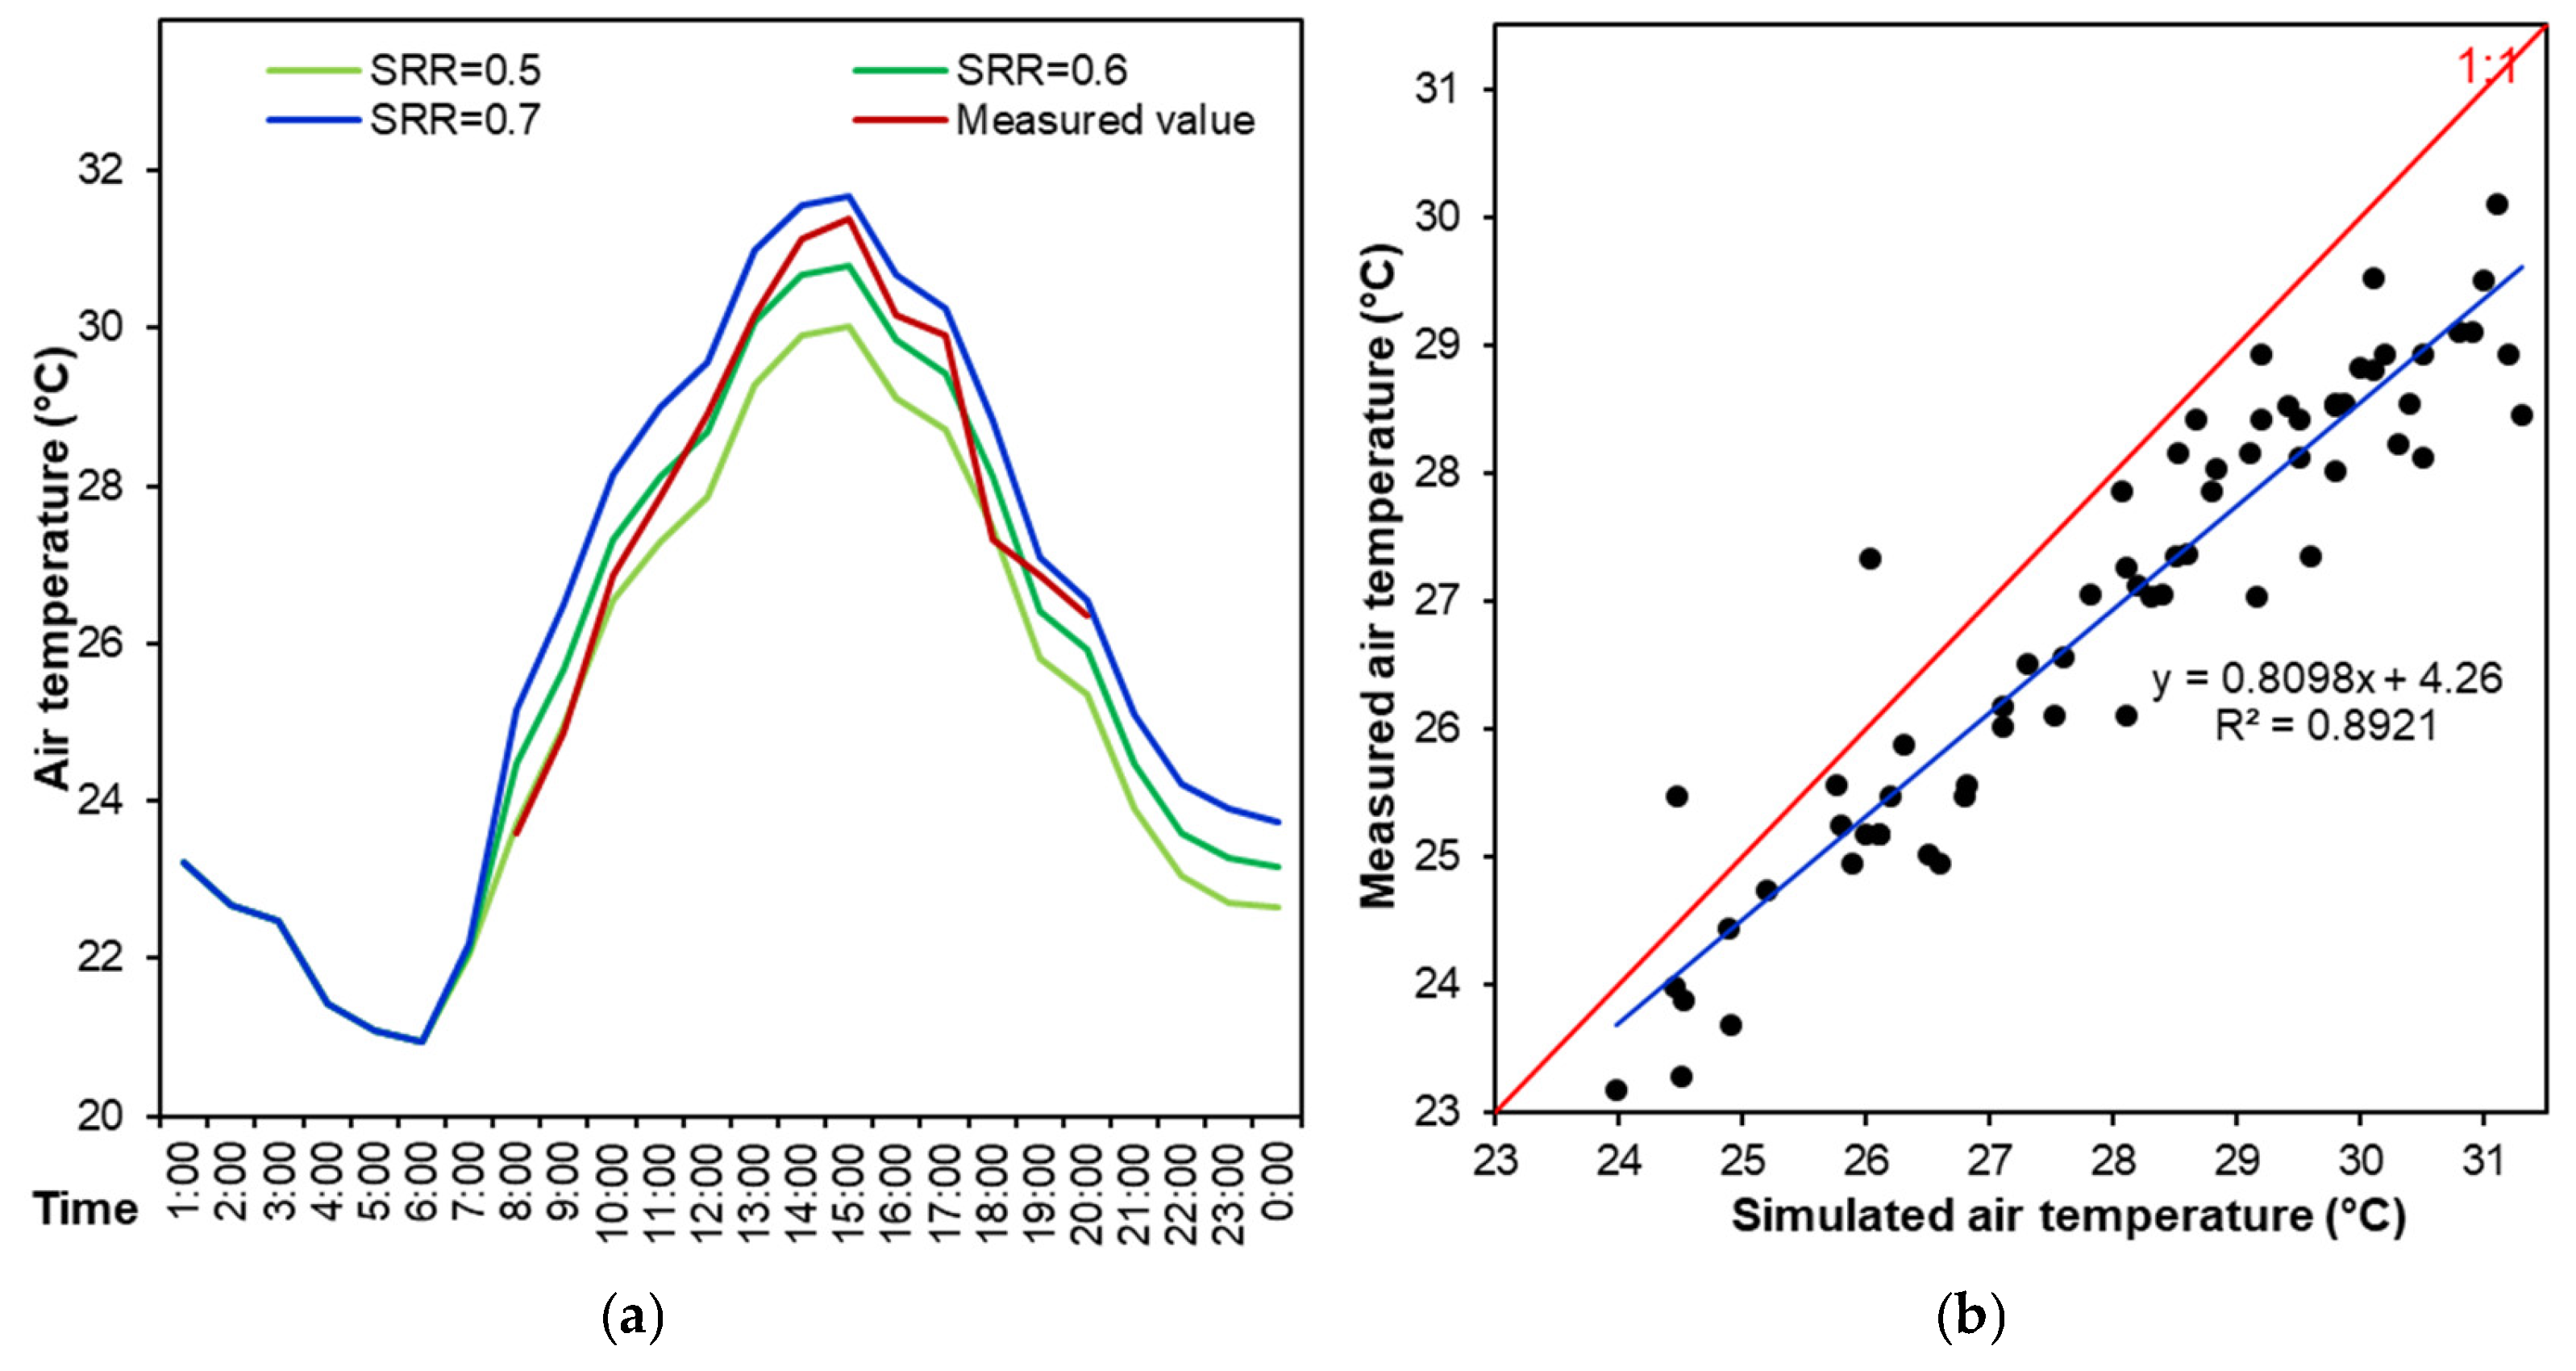
3.3. Accuracy and Uncertainty of the Numerical Model
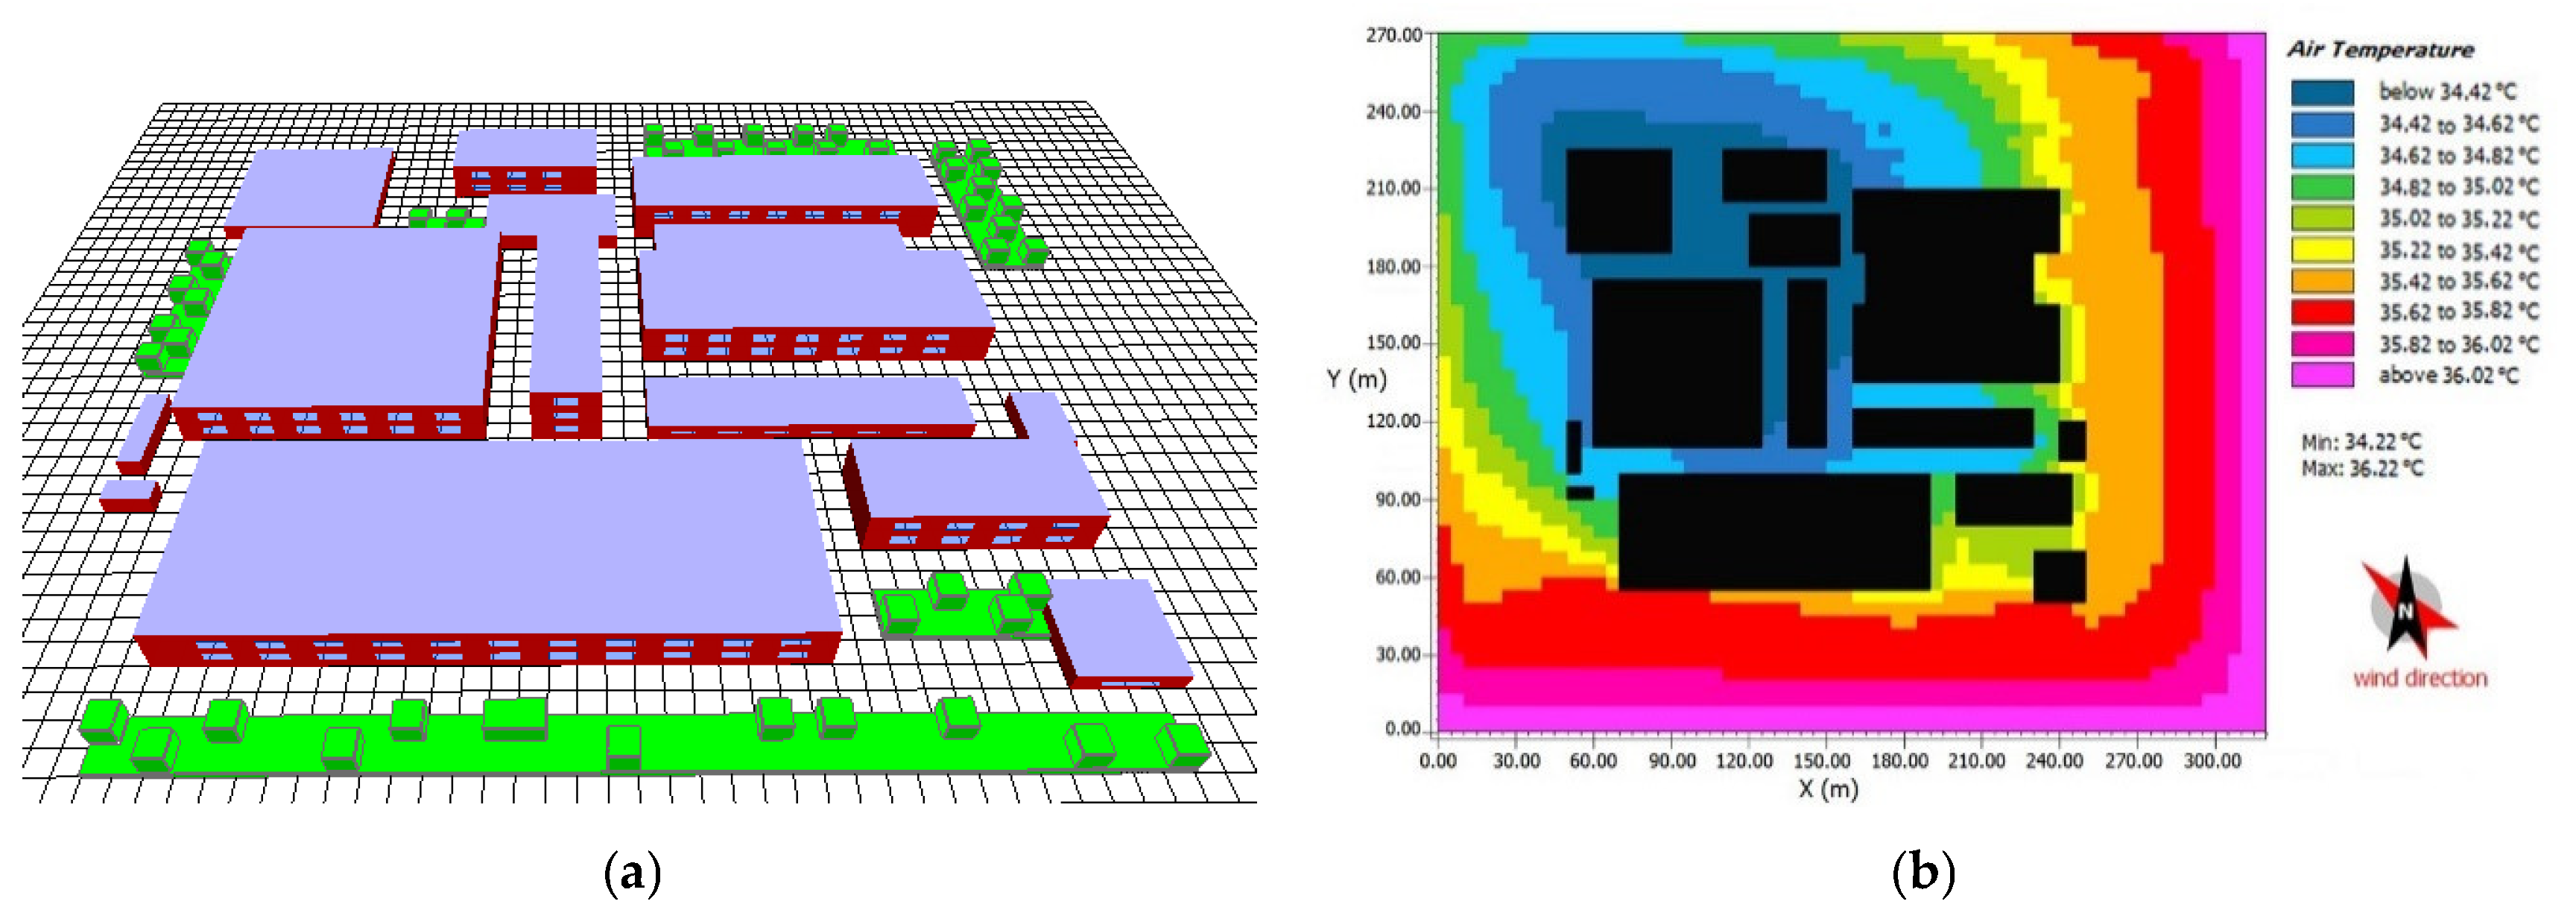
3.4. Base Model and Data
4. Results and Discussion
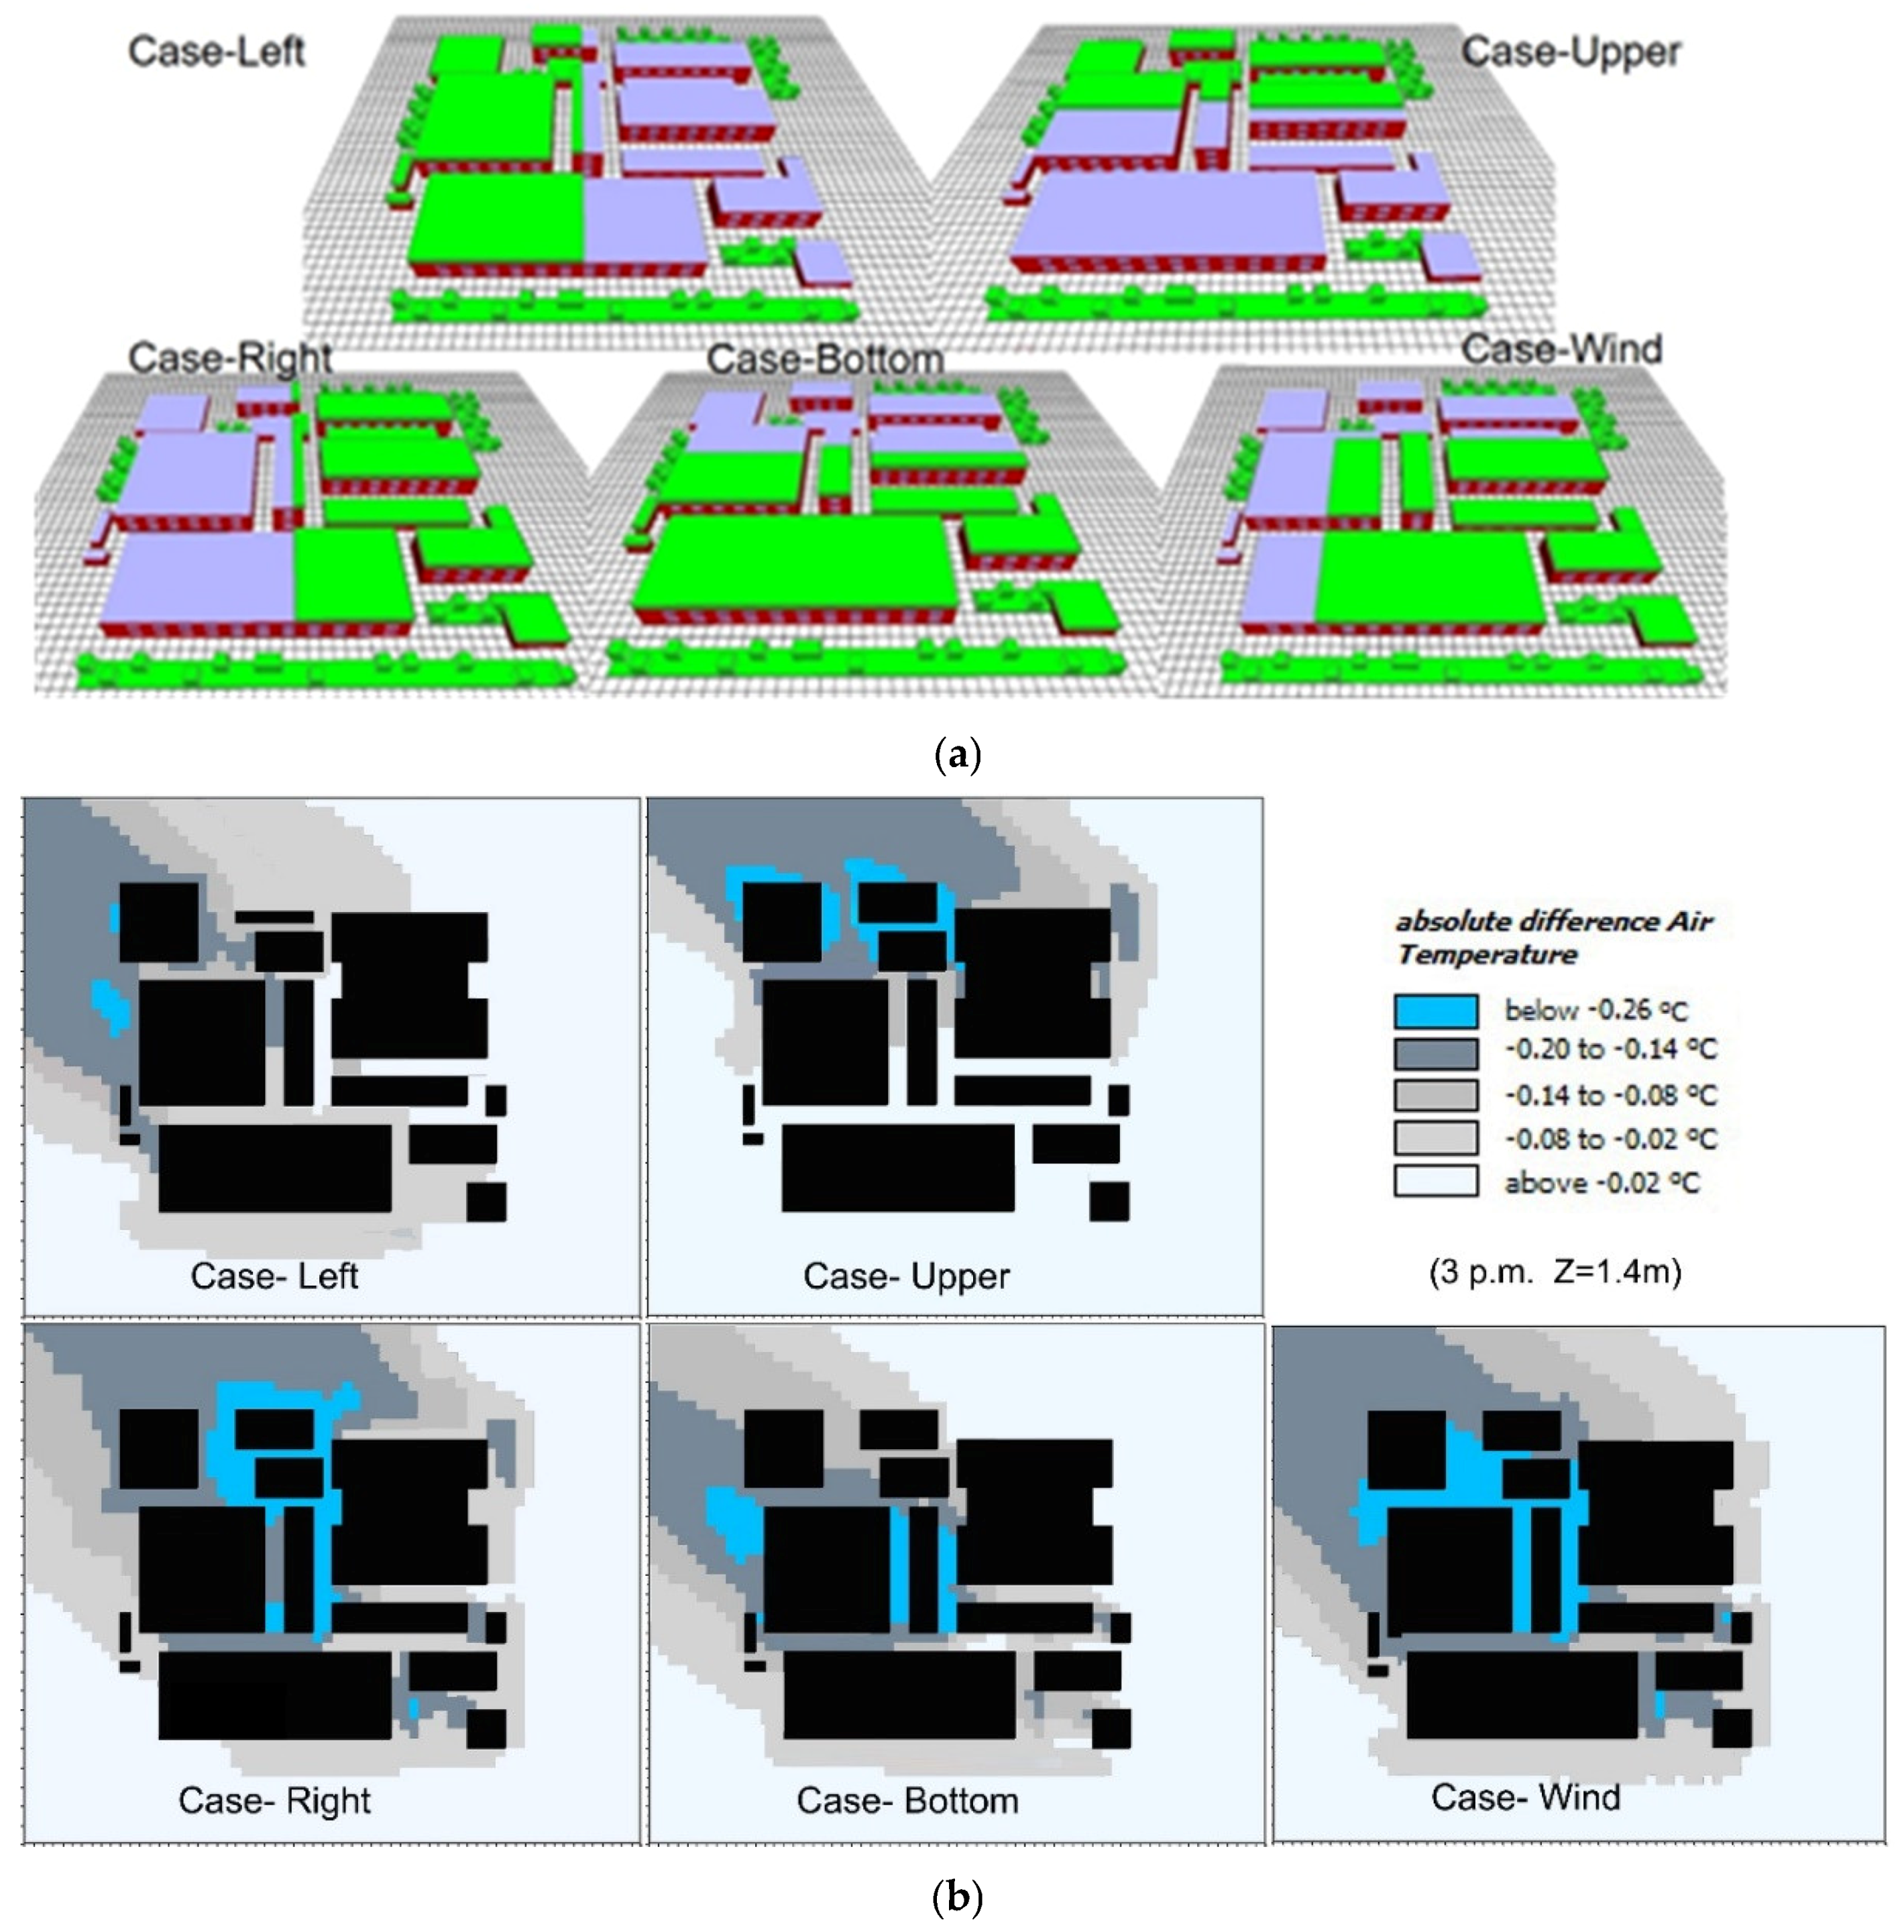
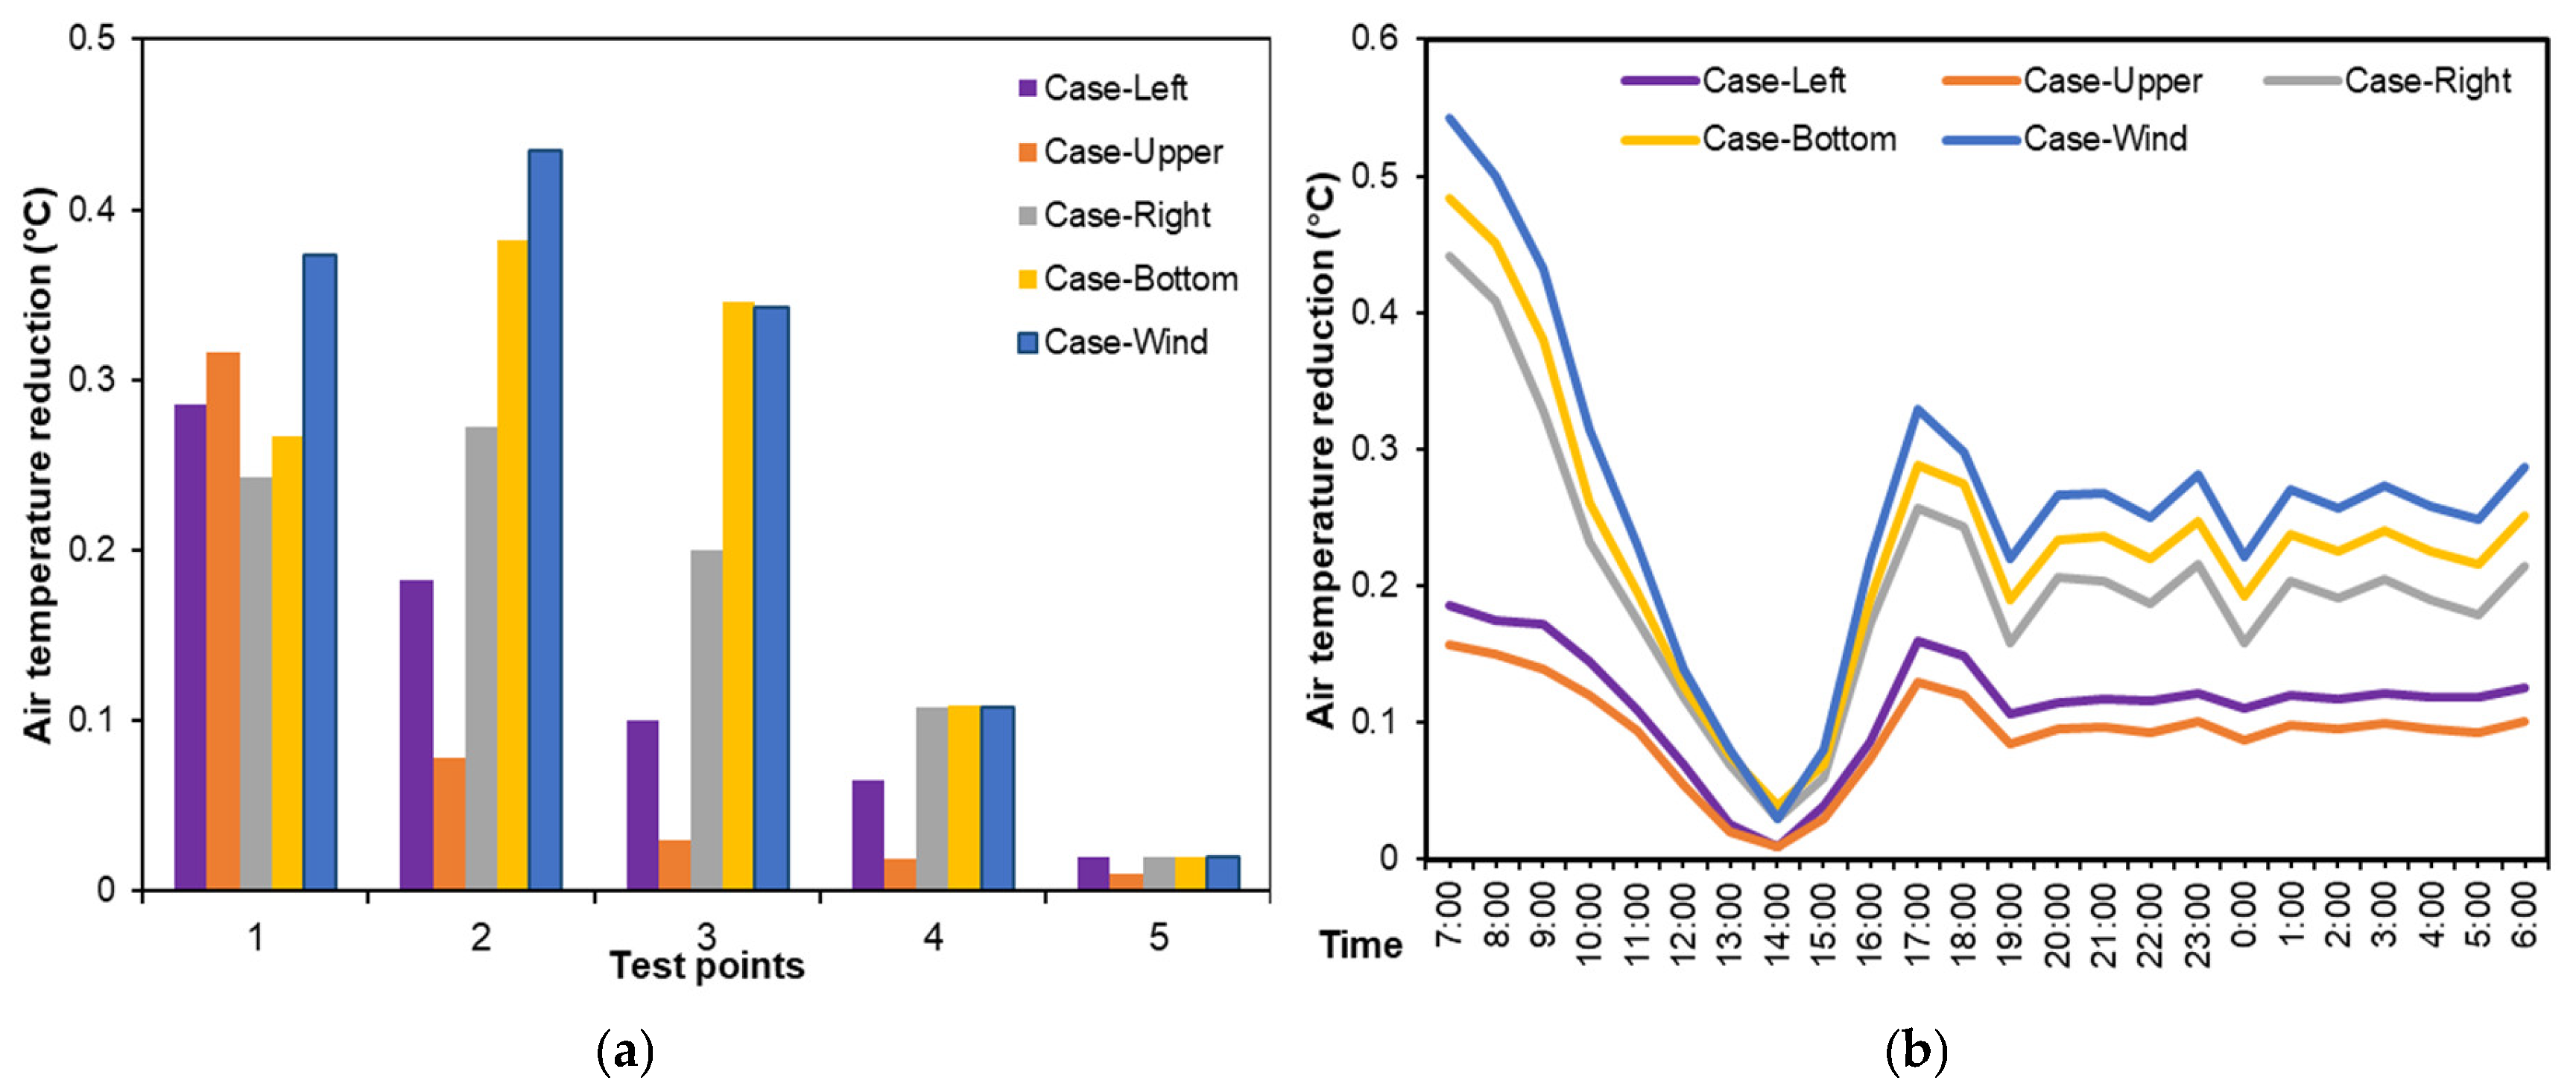
4.1. Effect of Green Roof Layout on Pedestrain Cooling Performance
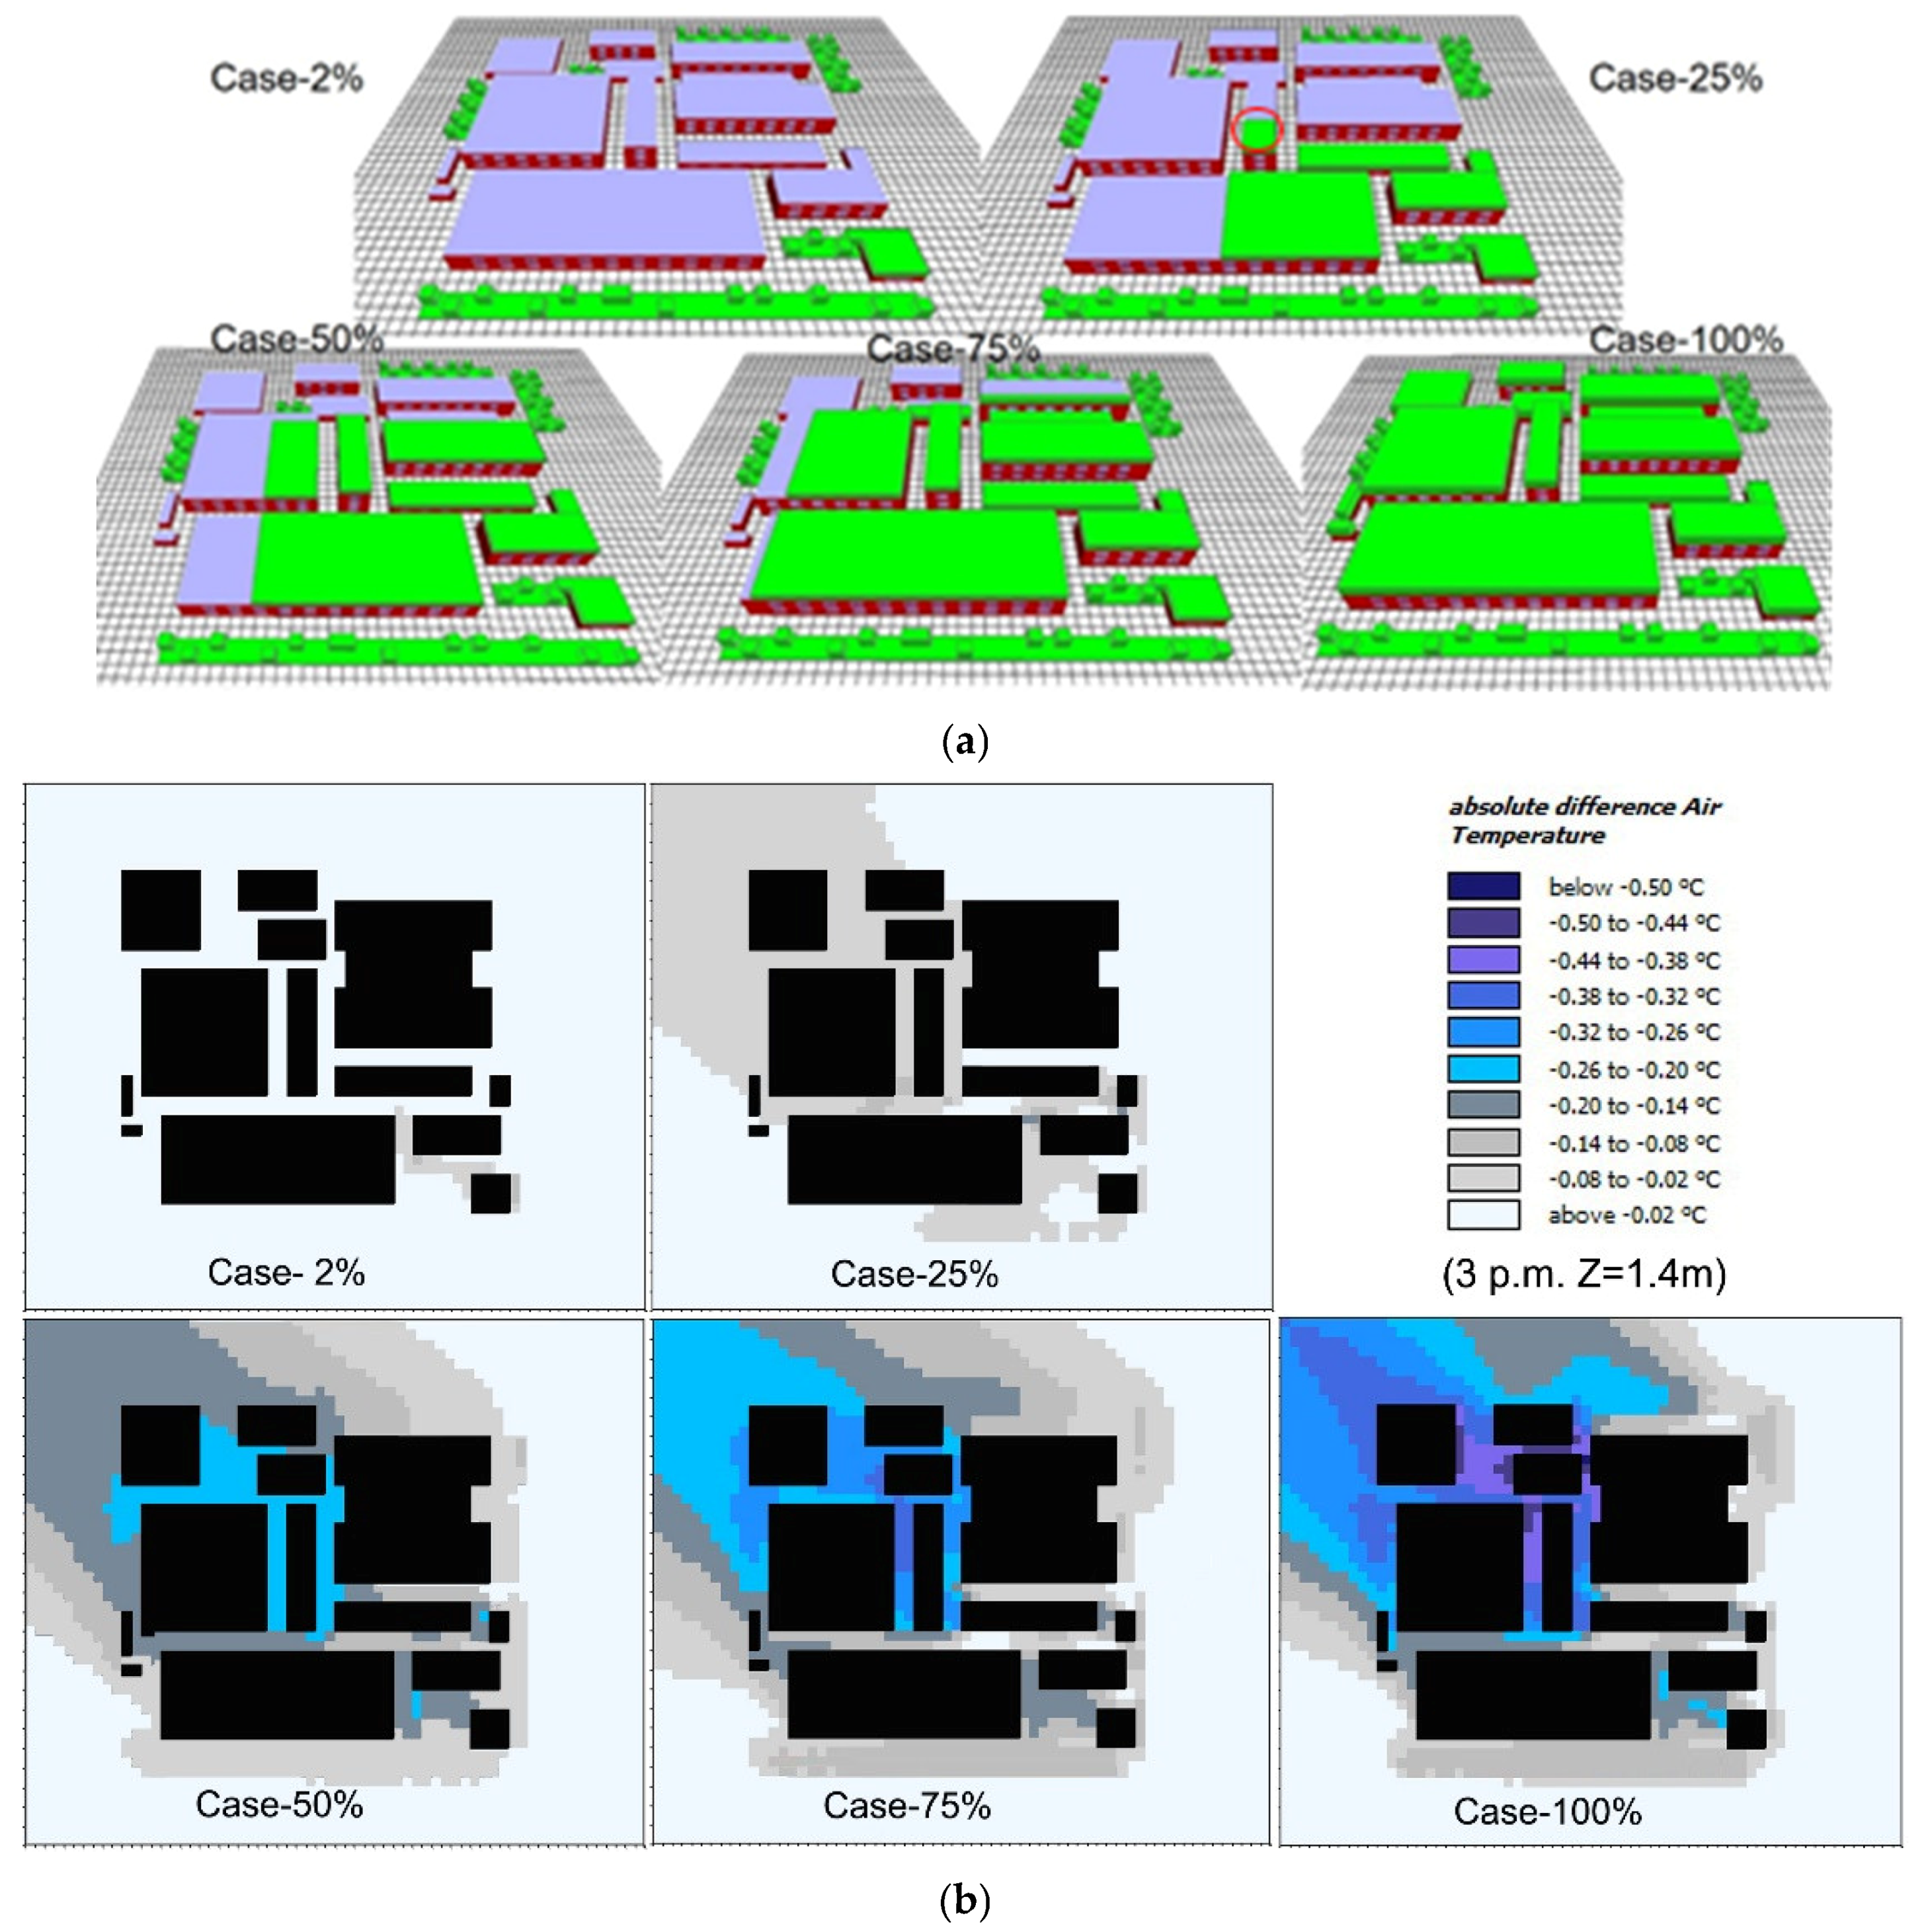
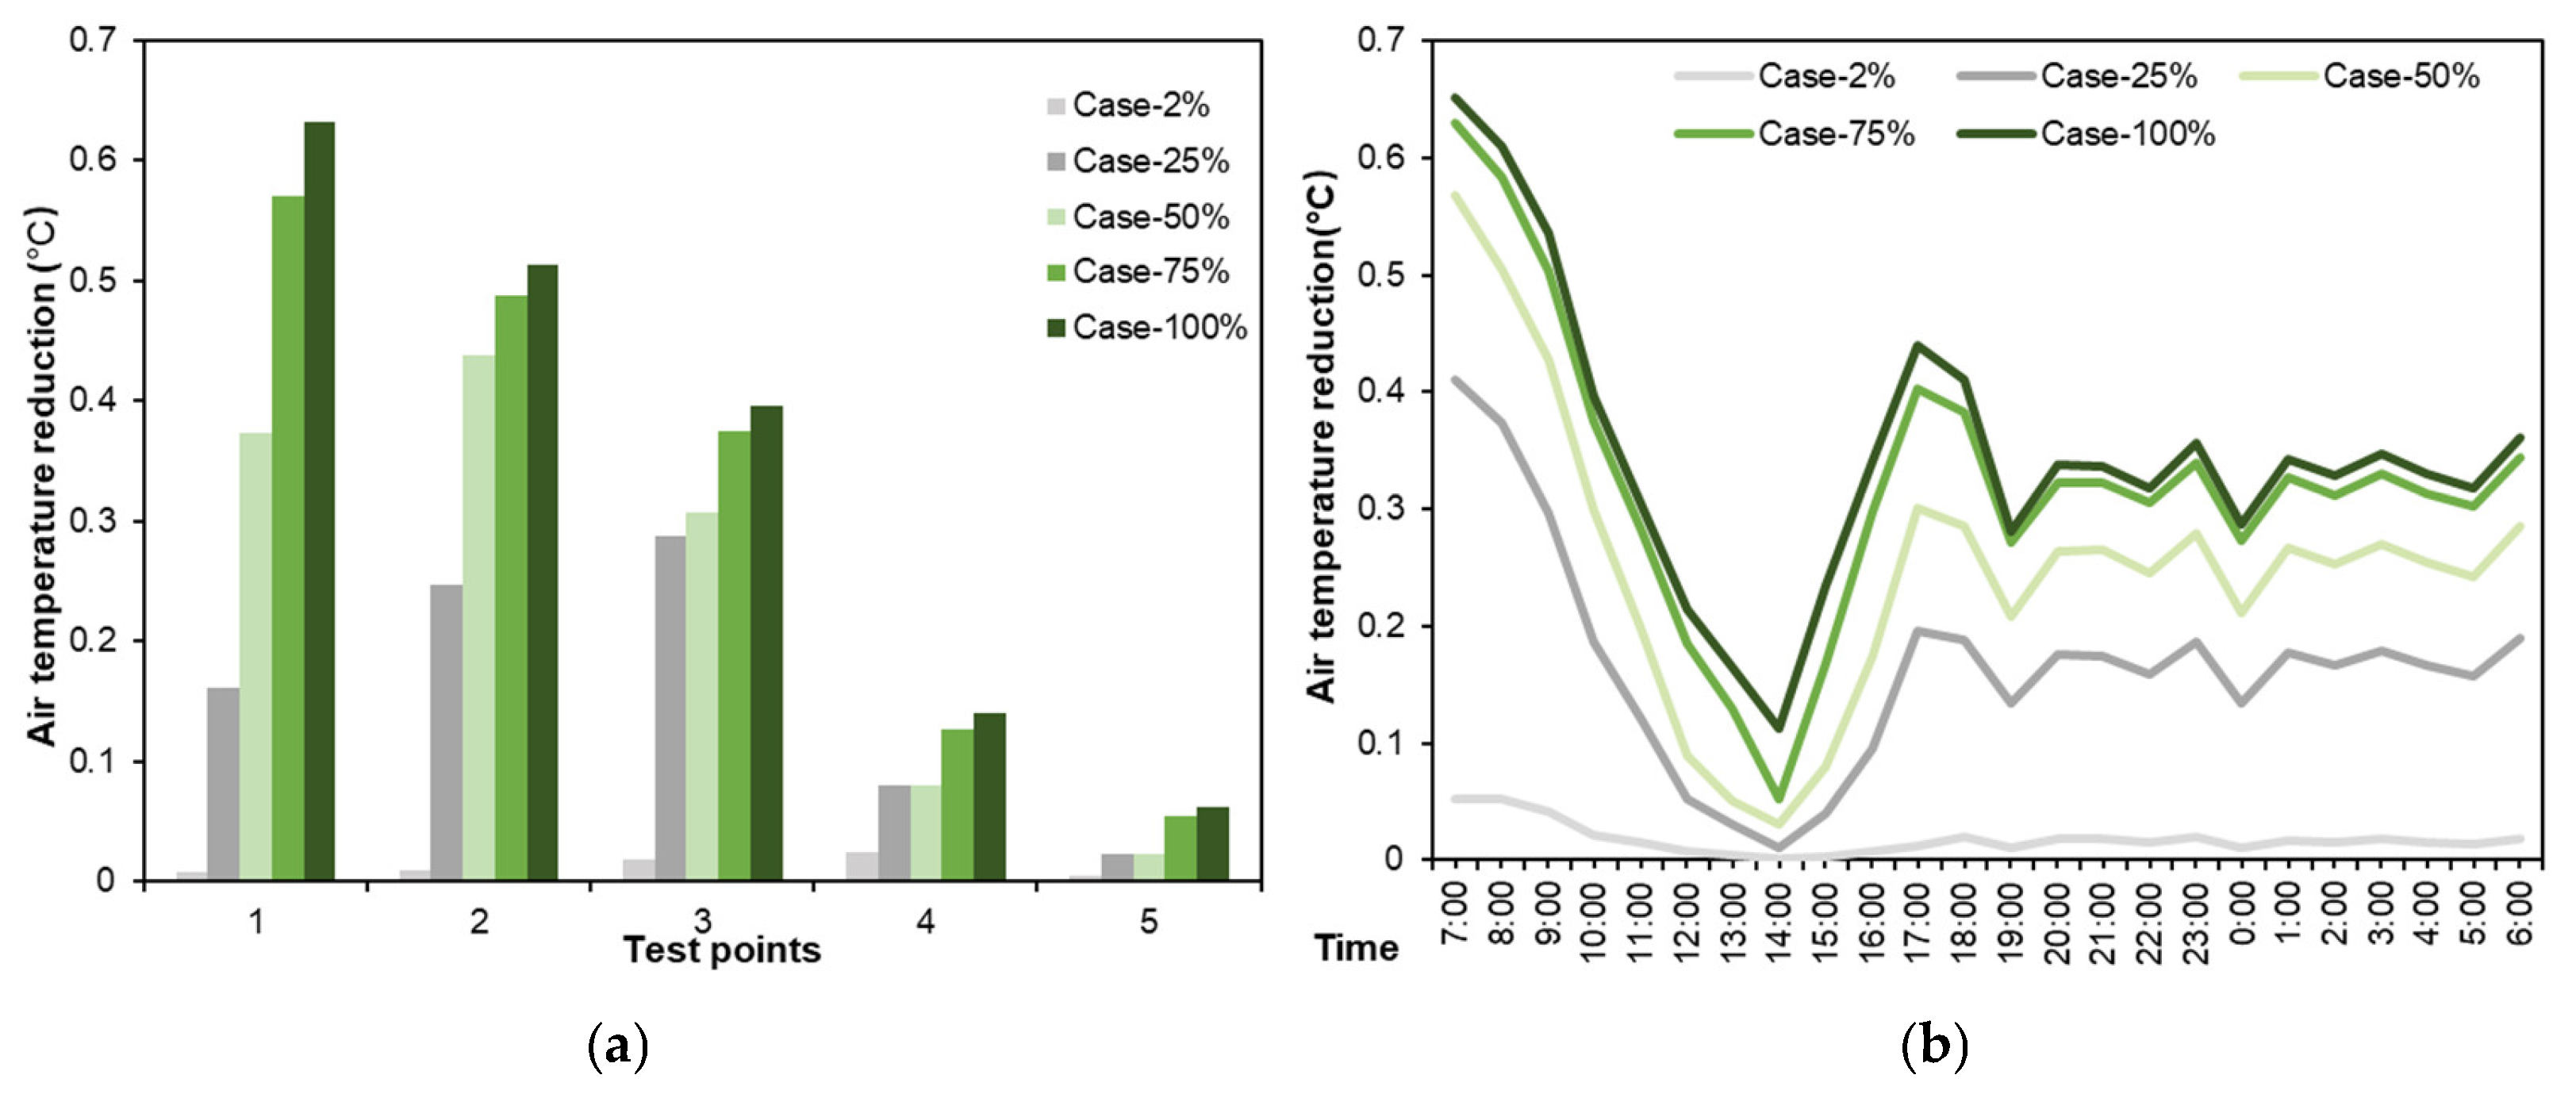
4.2. Effect of Coverage Ratio of Green Roof on Pedestrain Cooling Performance
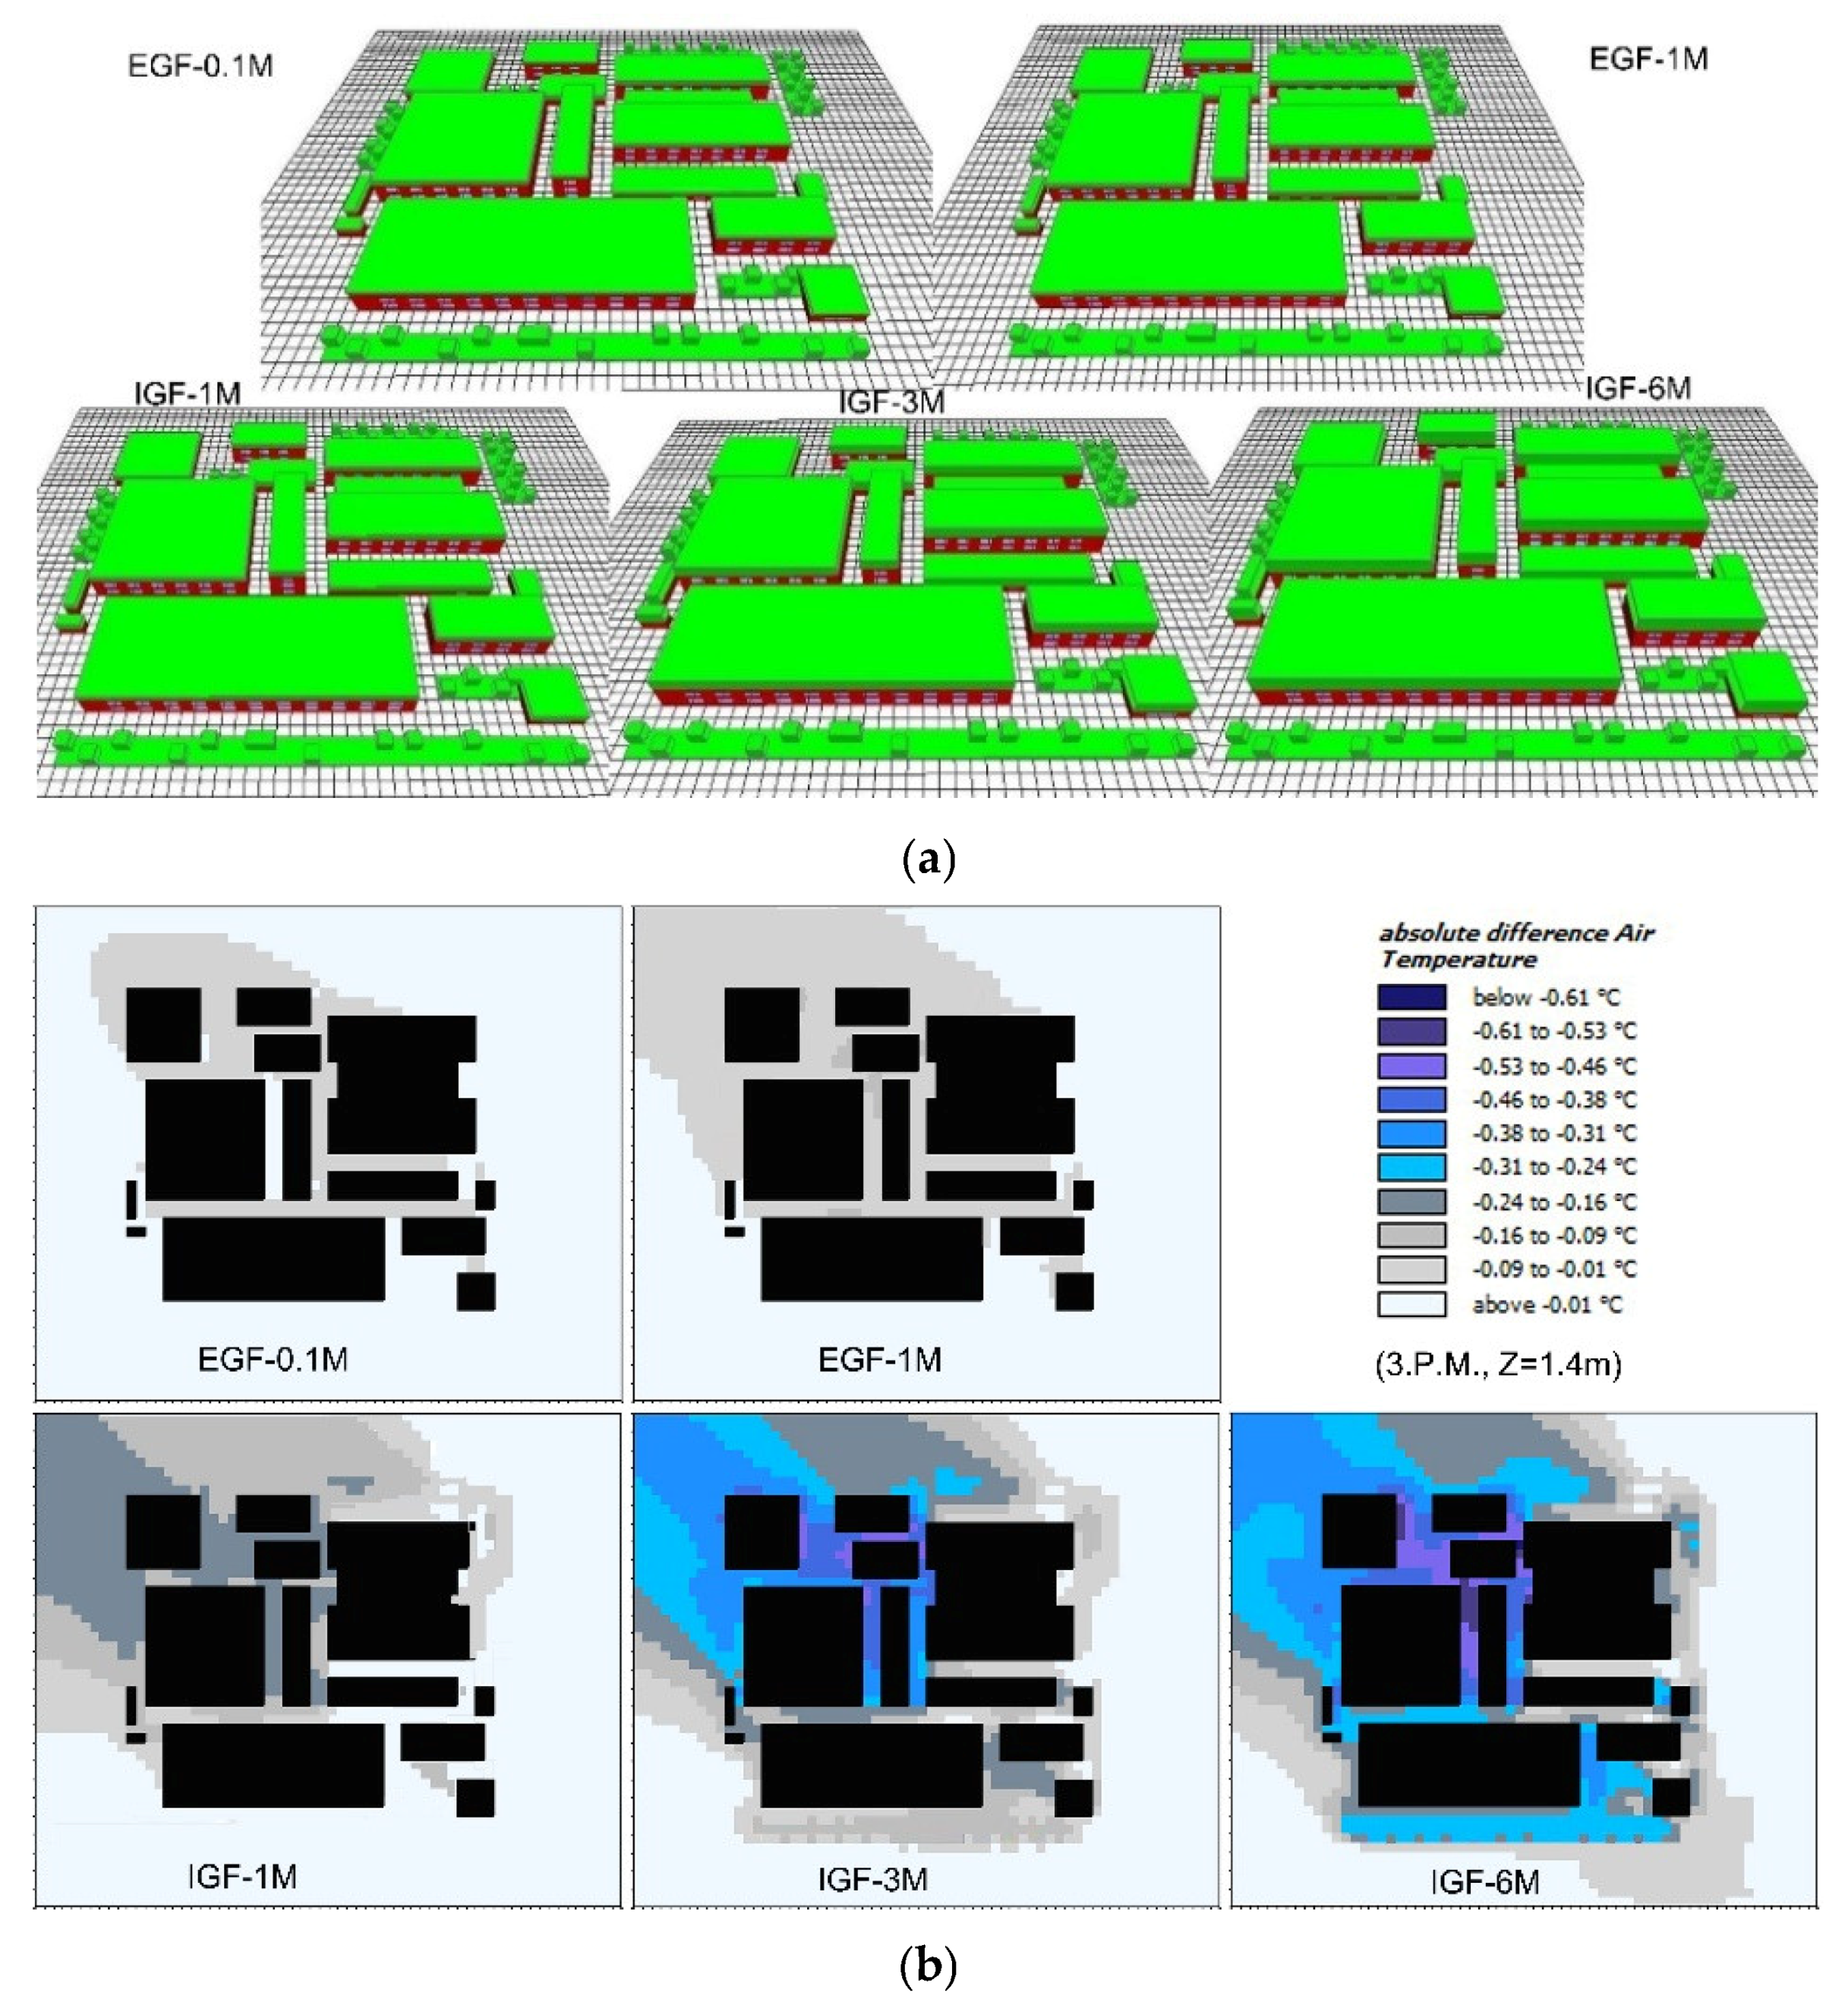
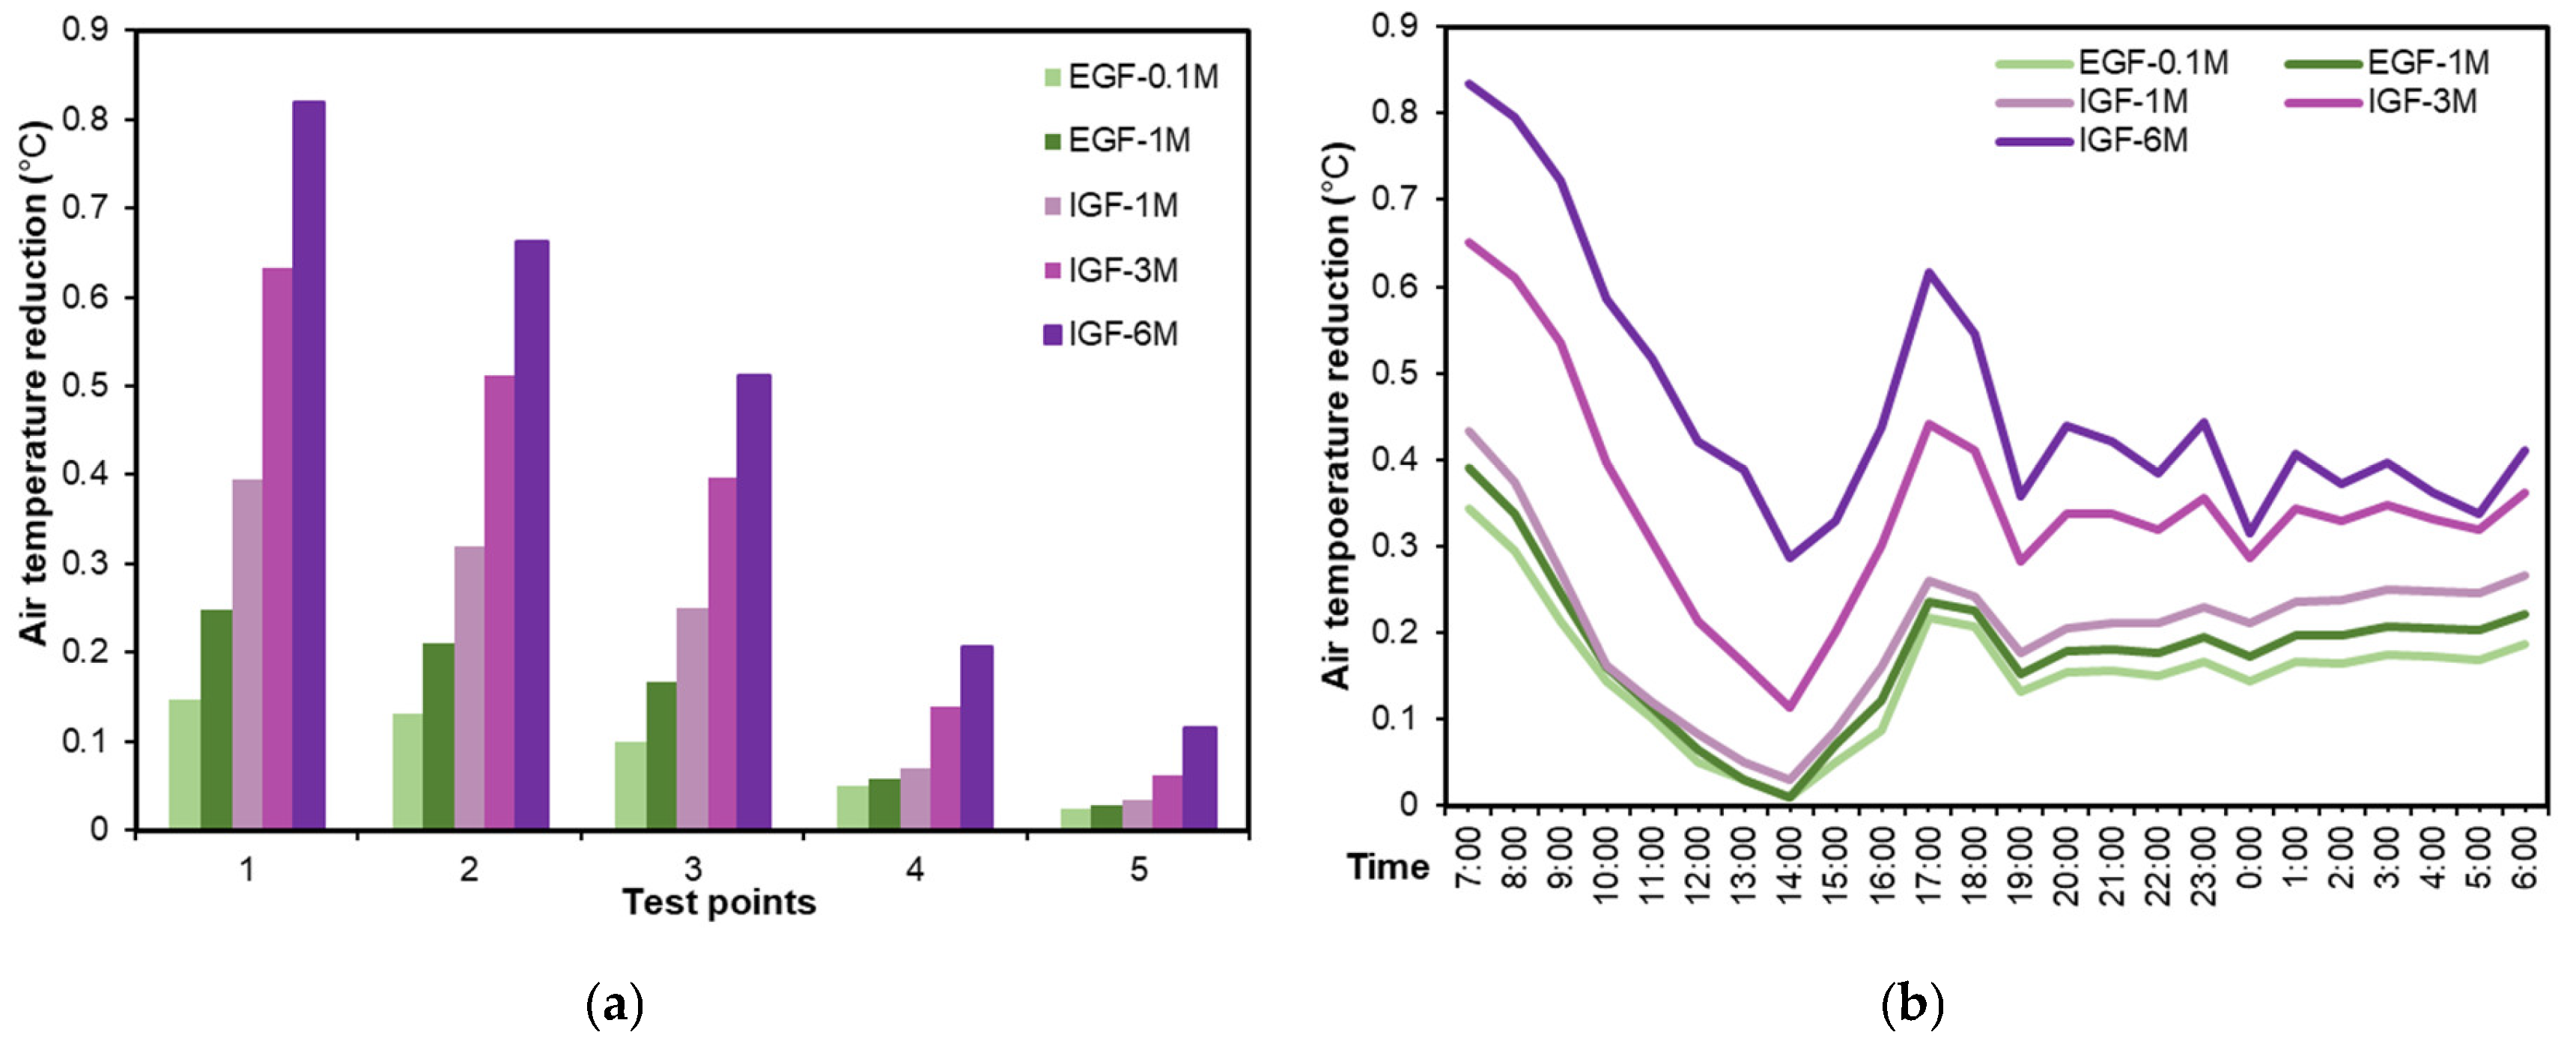
4.3. Effect of Vegetation Height of Green Roof on Pedestrain Cooling Performance
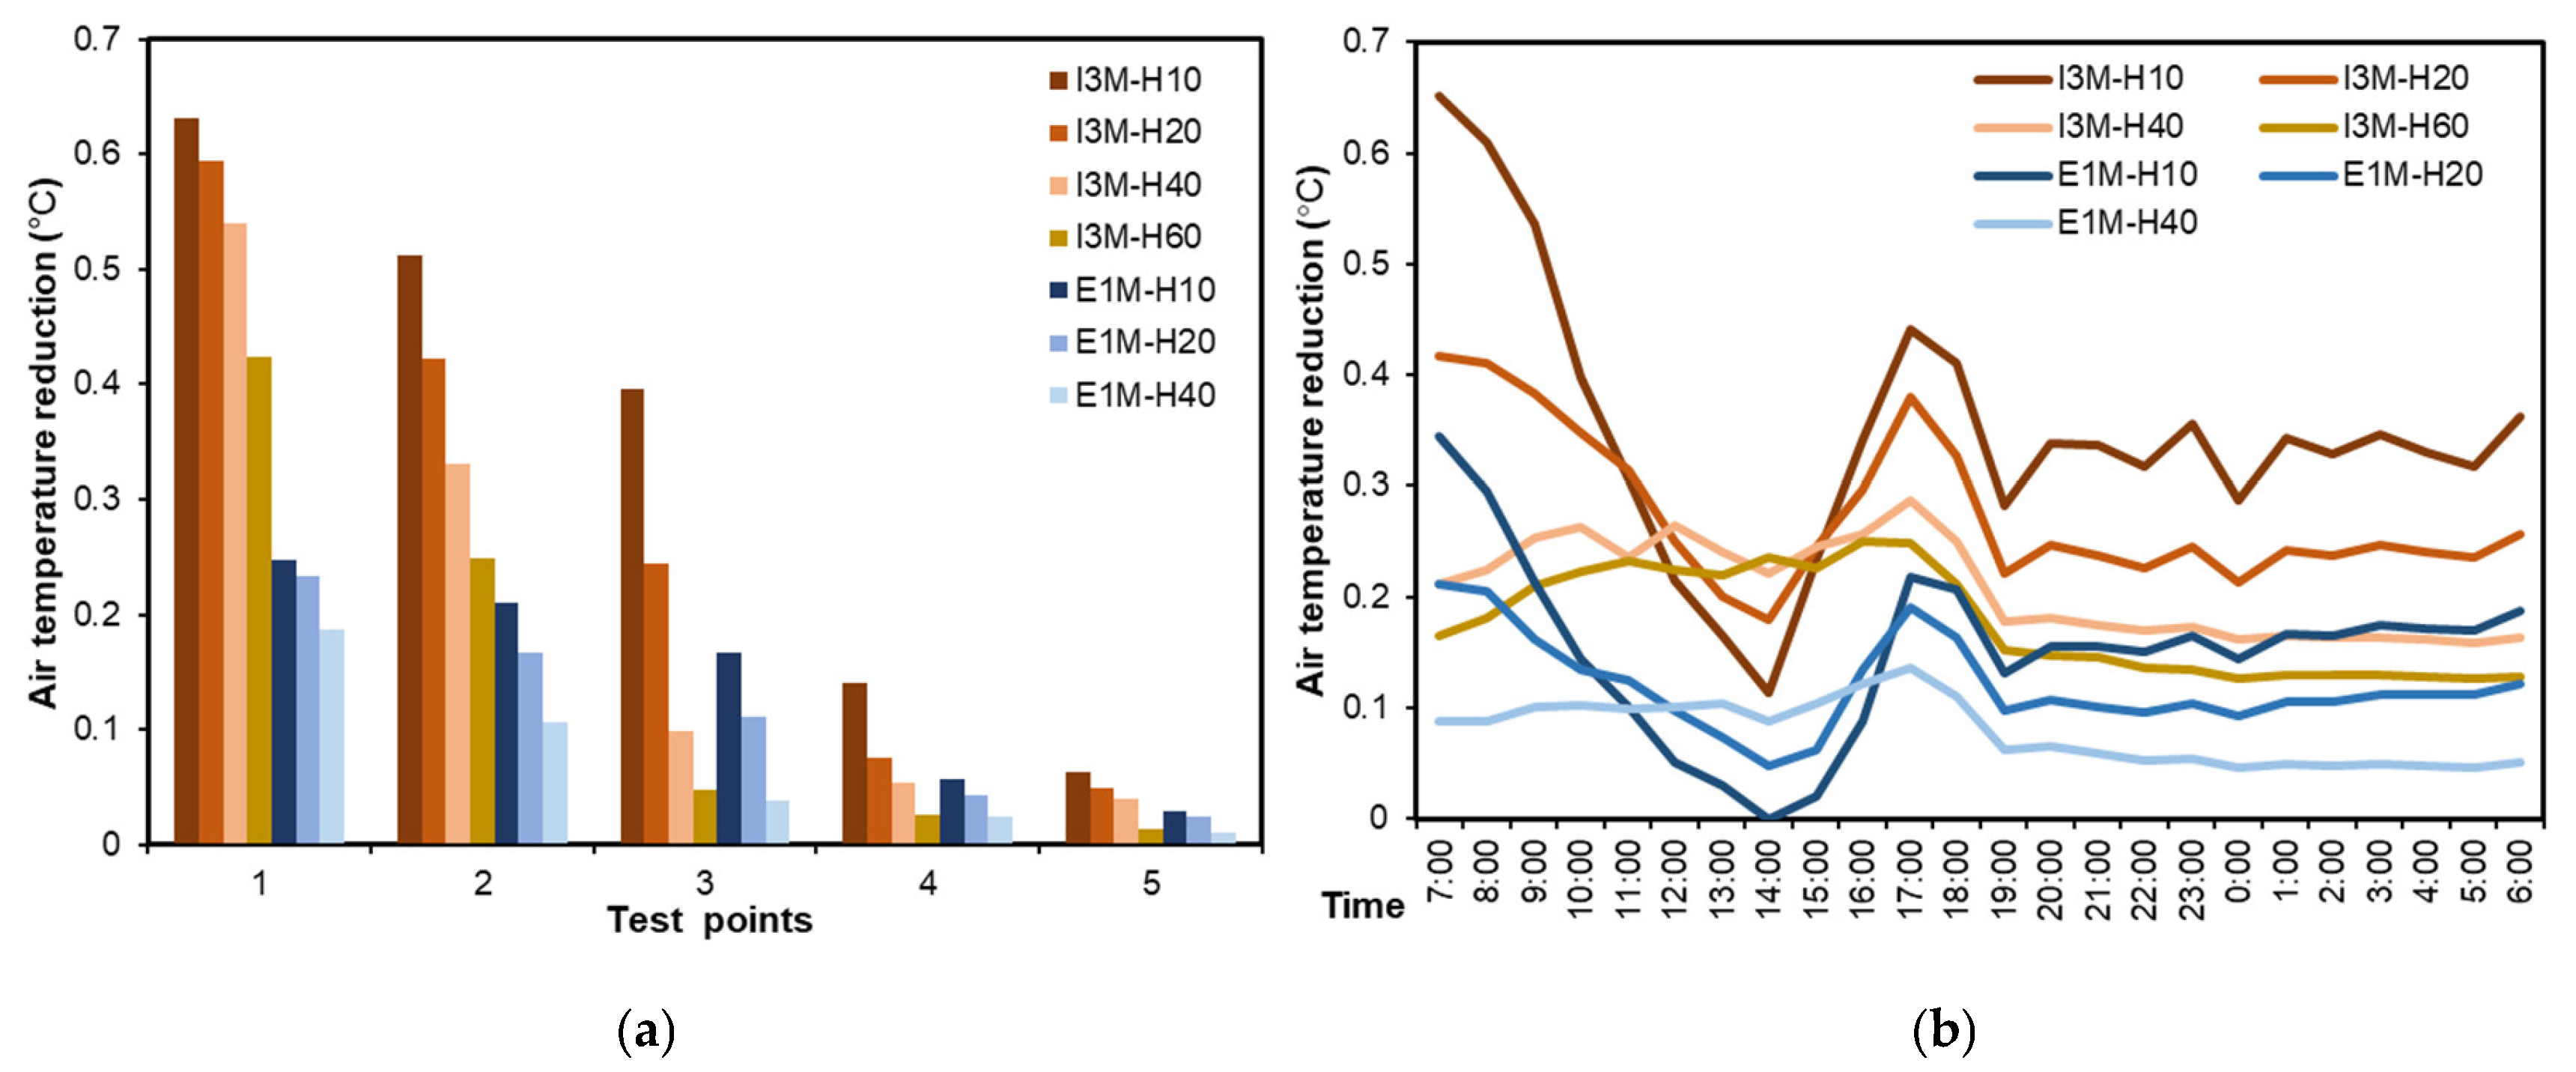
4.4. Effect of Building Height on Green Roof Cooling Performance
4.5. Cooling Performances in All Scenarios
5. Conclusions
- Overall, green roofs could generate a moderate cooling performance at the pedestrian level, while the most favorable cooling performance could reach up to 0.82 °C. To better utilize green roofs for pedestrian cooling, it is essential to simultaneously control the wind, greening layout, coverage ratio, vegetation height, and building height.
- Installing green roofs in upwind zones was favorable for pedestrian-level cooling, while green roofs in the downwind zones could only exert limited cooling effects. Overall, the cooling performance of green roof followed the pattern of Case-Wind > Case-Upper > Case-Left > Case-Bottom > Case-Right.
- A green roof with a low greening coverage ratio was not useful to improve pedestrian thermal environment. The cooling performance increased with the increasing coverage ratio, but the cooling performance reached a threshold when the coverage ratio increased to a certain value. Nevertheless, a neighborhood with a high coverage ratio could experience a “cool island” in the central area. In addition, the horizontal distance from green roofs to the target location could also influence the pedestrian cooling performance, where a short distance corresponded to a better cooling performance.
- Vegetation height played a critical role in improving green roof cooling performance. IGFs exhibited better cooling performances than EGFs, and the increase in vegetation height resulted in better cooling performances. The cooling effects of IGF-6M on the whole area could reach 0.5 °C, and more than 0.3 °C at 14:00 h. However, when greening height was under 1 m, the cooling effects of green roofs were insignificant.
- Building height was also an important factor affecting green roof cooling performance. With the increase of building height, the cooling effects of green roofs generally showed a trend of decrease. At this time, however, buildings and vegetation had combined effects, where higher buildings and vegetation could generate stronger cooling effects at the noon time. Moreover, because of wind effects and building shading, the building height limit for the cooling performance of green roofs was increased.
Author Contributions
Funding
Acknowledgments
Conflicts of Interest
References
- He, B.-J.; Zhao, Z.-Q.; Shen, L.-D.; Wang, H.-B.; Li, L.-G. An approach to examining performances of cool/hot sources in mitigating/enhancing land surface temperature under different temperature backgrounds based on Landsat 8 image. Sustain. Cities Soc. 2019, 44, 416–427. [Google Scholar] [CrossRef]
- Yang, J.; Sun, J.; Ge, Q.; Li, X. Assessing the impacts of urbanization-associated green space on urban land surface temperature: A case study of Dalian, China. Urban For. Urban Green. 2017, 22, 1–10. [Google Scholar] [CrossRef]
- Yang, K.; Pan, M.; Luo, Y.; Chen, K.; Zhao, Y.; Zhou, X. A time-series analysis of urbanization-induced impervious surface area extent in the Dianchi Lake watershed from 1988–2017. Int. J. Remote Sens. 2018, 1–20. [Google Scholar] [CrossRef]
- Yang, J.; Guan, Y.; Xia, J.C.; Jing, C.; Li, X. Spatiotemporal variation characteristics of green space ecosystem service value at urban fringes: A case study on Ganjingzi District in Dalian, China. Sci. Total Environ. 2018, 639, 1453–1461. [Google Scholar] [CrossRef] [PubMed]
- Stewart, I.D.; Oke, T.R. Local climate zones for urban temperature studies. Bull. Am. Meteorol. Soc. 2012, 93, 1879–1900. [Google Scholar] [CrossRef]
- Shahmohamadi, P.; Che-Ani, A.; Maulud, K.; Tawil, N.; Abdullah, N. The impact of anthropogenic heat on formation of urban heat island and energy consumption balance. Urban Stud. Res. 2011, 2011, 497524. [Google Scholar] [CrossRef]
- Oke, T.R. City size and the urban heat island. Atmos. Environ. 1973, 7, 769–779. [Google Scholar] [CrossRef]
- Goggins, W.B.; Chan, E.Y.; Ng, E.; Ren, C.; Chen, L. Effect modification of the association between short-term meteorological factors and mortality by urban heat islands in Hong Kong. PLoS ONE 2012, 7, e38551. [Google Scholar] [CrossRef]
- Santamouris, M.; Haddad, S.; Saliari, M.; Vasilakopoulou, K.; Synnefa, A.; Paolini, R.; Ulpiani, G.; Garshasbi, S.; Fiorito, F. On the energy impact of urban heat island in Sydney: Climate and energy potential of mitigation technologies. Energy Build. 2018, 166, 154–164. [Google Scholar] [CrossRef]
- McGeehin, M.A.; Mirabelli, M. The potential impacts of climate variability and change on temperature-related morbidity and mortality in the United States. Environ. Health Perspect. 2001, 109 (Suppl. 2), 185–189. [Google Scholar]
- Gago, E.J.; Roldan, J.; Pacheco-Torres, R.; Ordóñez, J. The city and urban heat islands: A review of strategies to mitigate adverse effects. Renew. Sustain. Energy Rev. 2013, 25, 749–758. [Google Scholar] [CrossRef]
- Wang, J.; Meng, Q.; Tan, K.; Zhang, L.; Zhang, Y. Experimental investigation on the influence of evaporative cooling of permeable pavements on outdoor thermal environment. Build. Environ. 2018, 140, 184–193. [Google Scholar] [CrossRef]
- He, B.-J. Potentials of meteorological characteristics and synoptic conditions to mitigate urban heat island effects. Urban Clim. 2018, 24, 26–33. [Google Scholar] [CrossRef]
- Tan, C.L.; Wong, N.H.; Tan, P.Y.; Jusuf, S.K.; Chiam, Z.Q. Impact of plant evapotranspiration rate and shrub albedo on temperature reduction in the tropical outdoor environment. Build. Environ. 2015, 94, 206–217. [Google Scholar] [CrossRef]
- Susca, T.; Gaffin, S.R.; Dell’Osso, G. Positive effects of vegetation: Urban heat island and green roofs. Environ. Pollut. 2011, 159, 2119–2126. [Google Scholar] [CrossRef]
- Cascone, S.; Coma, J.; Gagliano, A.; Pérez, G. The evapotranspiration process in green roofs: A review. Build. Environ. 2018, 147, 337–355. [Google Scholar] [CrossRef]
- Song, J.; Wang, Z.H.; Wang, C. The Regional Impact of Urban Heat Mitigation Strategies on Planetary Boundary-Layer Dynamics over a Semi-arid City. J. Geophys. Res. 2018, 123, 6410–6422. [Google Scholar]
- Sharma, A.; Conry, P.; Fernando, H.J.S.; Hamlet, A.F.; Hellmann, J.J.; Chen, F. Green and cool roofs to mitigate urban heat island effects in the Chicago metropolitan area: Evaluation with a regional climate model. Environ. Res. Lett. 2016, 11, 064004. [Google Scholar] [CrossRef]
- Li, D.; Bou-Zeid, E.; Oppenheimer, M. The effectiveness of cool and green roofs as urban heat island mitigation strategies. Environ. Res. Lett. 2014, 9, 055002. [Google Scholar] [CrossRef] [Green Version]
- Cox, B.K. The Influence of Ambient Temperature on Green Roof R-Values. Master’s Thesis, Portland State University, Portland, OR, USA, 2010. [Google Scholar]
- Ng, E.; Chen, L.; Wang, Y.; Yuan, C. A study on the cooling effects of greening in a high-density city: An experience from Hong Kong. Build. Environ. 2012, 47, 256–271. [Google Scholar] [CrossRef]
- Peng, L.L.; Jim, C. Green-roof effects on neighborhood microclimate and human thermal sensation. Energies 2013, 6, 598–618. [Google Scholar] [CrossRef]
- Abuseif, M.; Gou, Z. A Review of Roofing Methods: Construction Features, Heat Reduction, Payback Period and Climatic Responsiveness. Energies 2018, 11, 3196. [Google Scholar] [CrossRef]
- Morakinyo, T.E.; Dahanayake, K.K.C.; Ng, E.; Chow, C.L. Temperature and cooling demand reduction by green-roof types in different climates and urban densities: A co-simulation parametric study. Energy Build. 2017, 145, 226–237. [Google Scholar] [CrossRef]
- Jim, C.; Peng, L.L. Weather effect on thermal and energy performance of an extensive tropical green roof. Urban For. Urban Green. 2012, 11, 73–85. [Google Scholar] [CrossRef]
- Chen, H.; Ooka, R.; Huang, H.; Tsuchiya, T. Study on mitigation measures for outdoor thermal environment on present urban blocks in Tokyo using coupled simulation. Build. Environ. 2009, 44, 2290–2299. [Google Scholar] [CrossRef]
- Sodoudi, S.; Zhang, H.; Chi, X.; Müller, F.; Li, H. The influence of spatial configuration of green areas on microclimate and thermal comfort. Urban For. Urban Green. 2018, 34, 85–96. [Google Scholar] [CrossRef]
- Jin, C.; Bai, X.; Luo, T.; Zou, M. Effects of green roofs’ variations on the regional thermal environment using measurements and simulations in Chongqing, China. Urban For. Urban Green. 2018, 29, 223–237. [Google Scholar] [CrossRef]
- Oke, T.R. The micrometeorology of the urban forest. Philos. Trans. R. Soc. 1989, 324, 335–349. [Google Scholar] [CrossRef]
- Conry, P.; Sharma, S.; Potosnak, M.J.; Leo, L.S.; Bensman, E.; Hellmann, J.J.; Fernando, H.J.S. Chicago’s heat island and climate change: Bridging the scales via dynamical downscaling. J. Appl. Meteorol. Climatol. 2015, 54, 1430–1448. [Google Scholar] [CrossRef]
- Yang, J.; Su, J.; Xia, J.; Jin, C.; Li, X.; Ge, Q. The Impact of Spatial Form of Urban Architecture on the Urban Thermal Environment: A Case Study of the Zhongshan District, Dalian, China. IEEE J. Select. Top. Appl. Earth Obs. Remote Sens. 2018, 11, 2709–2716. [Google Scholar] [CrossRef]
- Hangzhou Statistical Bureau. Statistical Yearbook of Hangzhou; China Statistical Press: Beijing, China, 2017.
- He, B.; Zhu, J. Constructing community gardens? Residents’ attitude and behaviour towards edible landscapes in emerging urban communities of China. Urban For. Urban Green. 2018, 34, 154–165. [Google Scholar] [CrossRef]
- Bruse, M.; Fleer, H. Simulating surface–plant–air interactions inside urban environments with a three dimensional numerical model. Environ. Model. Softw. 1998, 13, 373–384. [Google Scholar] [CrossRef]
- Qaid, A.; Lamit, H.B.; Ossen, D.R.; Shahminan, R.N.R. Urban heat island and thermal comfort conditions at micro-climate scale in a tropical planned city. Energy Build. 2016, 133, 577–595. [Google Scholar] [CrossRef]
- Jonckheere, I.; Fleck, S.; Nackaerts, K.; Muys, B.; Coppin, P. Methods for leaf area index determination. Part I: Theories, techniques and instruments. Agric. For. Meteorol. 2004, 121, 19–35. [Google Scholar] [CrossRef]
- Wu, Z.; Kong, F.; Wang, Y.; Sun, R.; Chen, L. The impact of greenspace on thermal comfort in a residential quarter of Beijing, China. Int. J. Environ. Res. Public Health 2016, 13, 1217. [Google Scholar] [CrossRef]
- Zhang, X.-Q.; Zhao, M.-S.; Xu, D.-Y. Spatial distribution and seasonal changes of needle-leaf area density within 17-year-old Chinese fir crown. For. Res.-Chin. Acad. For. 1999, 12, 612–619. [Google Scholar]
- Hosoi, F.; Omasa, K. Factors contributing to accuracy in the estimation of the woody canopy leaf area density profile using 3D portable lidar imaging. J. Exp. Bot. 2007, 58, 3463–3473. [Google Scholar] [CrossRef] [Green Version]
- Ministry of Housing and Urban-Rural Development (MOHURD). Design Standard for Energy Efficiency of Residential Buildings in Hot Summer and Cold Winter Zone, in Ministry of Housing and Urban-Rural Development; China Building Industry Press: Beijing, China, 2012.
- Zhao, D.; Zhao, X.; Khongnawang, T.; Arshad, M.; Triantafilis, J. A Vis-NIR spectral library to predict clay in Australian cotton growing soil. Soil Sci. Soc. Am. J. 2018, 82, 1347–1357. [Google Scholar] [CrossRef]
- Morakinyo, T.E.; Kong, L.; Lau, K.K.-L.; Yuan, C.; Ng, E. A study on the impact of shadow-cast and tree species on in-canyon and neighborhood’s thermal comfort. Build. Environ. 2017, 115, 1–17. [Google Scholar] [CrossRef]
- Mou, B.; He, B.-J.; Zhao, D.-X.; Chau, K.-W. Numerical simulation of the effects of building dimensional variation on wind pressure distribution. Eng. Appl. Comput. Fluid Mech. 2017, 11, 293–309. [Google Scholar] [CrossRef] [Green Version]
- Mirzaei, P.A.; Haghighat, F. Approaches to study urban heat island–abilities and limitations. Build. Environ. 2010, 45, 2192–2201. [Google Scholar] [CrossRef]
- Heidarinejad, G.; Esmaili, A. Numerical simulation of the dual effect of green roof thermal performance. Energy Convers. Manag. 2015, 106, 1418–1425. [Google Scholar] [CrossRef]
- Alexandri, E.; Jones, P. Temperature decreases in an urban canyon due to green walls and green roofs in diverse climates. Build. Environ. 2008, 43, 480–493. [Google Scholar] [CrossRef]
- Krüger, E.; Minella, F.; Rasia, F. Impact of urban geometry on outdoor thermal comfort and air quality from field measurements in Curitiba, Brazil. Build. Environ. 2011, 46, 621–634. [Google Scholar] [CrossRef]
- Jin, H.; Liu, Z.; Jin, Y.; Kang, J.; Liu, J. The effects of residential area building layout on outdoor wind environment at the pedestrian level in severe cold regions of China. Sustainability 2017, 9, 2310. [Google Scholar] [CrossRef]
- Berardi, U. The outdoor microclimate benefits and energy saving resulting from green roofs retrofits. Energy Build. 2016, 121, 217–229. [Google Scholar] [CrossRef]
- Moore, R.; Clark, W.D.; Vodopich, D.S. Botany; McGraw-Hill Companies: New York, NY, USA, 2003. [Google Scholar]
- Herrera-Gomez, S.S.; Quevedo-Nolasco, A.; Pérez-Urrestarazu, L. The role of green roofs in climate change mitigation. A case study in Seville (Spain). Build. Environ. 2017, 123, 575–584. [Google Scholar] [CrossRef]
- Smith, K.R.; Roebber, P.J. Green roof mitigation potential for a proxy future climate scenario in Chicago, Illinois. J. Appl. Meteorol. Climatol. 2011, 50, 507–522. [Google Scholar] [CrossRef]
- Ambrosini, D.; Galli, G.; Mancini, B.; Nardi, I.; Sfarra, S. Evaluating mitigation effects of urban heat islands in a historical small center with the ENVI-Met® climate model. Sustainability 2014, 6, 7013–7029. [Google Scholar] [CrossRef]
- Dwivedi, A.; Mohan, B.K. Impact of green roof on micro climate to reduce Urban Heat Island. Remote Sens. Appl. 2018, 10, 56–69. [Google Scholar] [CrossRef]
- Del Barrio, E.P. Analysis of the green roofs cooling potential in buildings. Energy Build. 1998, 27, 179–193. [Google Scholar] [CrossRef]
- Wong, N.H.; Cheong, D.K.W.; Yan, H.; Soh, J.; Ong, C.L.; Sia, A. The effects of rooftop garden on energy consumption of a commercial building in Singapore. Energy Build. 2003, 35, 353–364. [Google Scholar] [CrossRef]
- Onmura, S.; Matsumoto, M.; Hokoi, S. Study on evaporative cooling effect of roof lawn gardens. Energy Build. 2001, 33, 653–666. [Google Scholar] [CrossRef]
- Berardi, U.; GhaffarianHoseini, A.; GhaffarianHoseini, A. State-of-the-art analysis of the environmental benefits of green roofs. Appl. Energy 2014, 115, 411–428. [Google Scholar] [CrossRef]


| Item | Instrument | Parameter | Resolution/Range | Frequency |
|---|---|---|---|---|
| Temperature | Cos-03 | Air temperature | ±0.1 °C (−20 °C–60 °C) | 5 min |
| Humidity | Cos-03 | Relative humidity | ±1.5% (0–100%) | 5 min |
| Wind | P6-8232 | Wind speed Wind direction | ±0.9 m/s (0–30 m/s) ±0.5° (0–360°) | 30 min |
| Soil | PM 6530D | Soil temperature | ±0.5 °C (−20 °C–60 °C) | 1 h |
| LAI | LAI-2000 | Leaf area density | 2.5 m CEP (50% deviation) | 1 D |
| Item | Parameter | Value |
|---|---|---|
| Meteorological | Solar radiation | 0.5; 0.6; 0.8 |
| parameters | Initial wind direction | 45°(SE) |
| Wind speed at 10 m | 2 m/s | |
| Initial air temperature | 22.0 °C | |
| Relative humidity | 71% | |
| Air moisture content (2500.0 m) | 6.5 g·kg−1 | |
| Roughness length | 0.1 m | |
| Roof | LAD of IGFs LAD of EGFs | 1.5 m2·m−3 1.0 m2·m−3 |
| Average albedo of green/roof | 0.2/0.3 | |
| Soil | Initial surface temperature/humidity (0–20 cm) | 25.0 °C/50% |
| Initial temperature/humidity in middle depth (0–20 cm) Initial temperature/humidity in deep depth (>50 cm) | 26.0 °C/60% 26.0 °C/60% |
| Scenarios | Daily Average Temperature (°C) | Average Temperature of Five Points (°C) | |||||||
|---|---|---|---|---|---|---|---|---|---|
| 1 | 2 | 3 | 4 | 5 | T24h | Tmax | Tmin | ||
| Layout | Left | 0.29 | 0.18 | 0.10 | 0.07 | 0.02 | 0.13 | 0.29 | 0.02 |
| Upper | 0.32 | 0.08 | 0.03 | 0.02 | 0.01 | 0.09 | 0.32 | 0.01 | |
| Right | 0.24 | 0.27 | 0.20 | 0.11 | 0.02 | 0.17 | 0.27 | 0.02 | |
| Bottom | 0.27 | 0.38 | 0.35 | 0.11 | 0.02 | 0.22 | 0.38 | 0.02 | |
| Wind | 0.37 | 0.43 | 0.34 | 0.11 | 0.02 | 0.26 | 0.43 | 0.02 | |
| Coverage ratio | Case 2% | 0.01 | 0.01 | 0.02 | 0.02 | 0.01 | 0.01 | 0.02 | 0.01 |
| Case 25% | 0.16 | 0.25 | 0.29 | 0.08 | 0.02 | 0.16 | 0.29 | 0.02 | |
| Case 50% | 0.37 | 0.44 | 0.31 | 0.08 | 0.02 | 0.24 | 0.44 | 0.02 | |
| Case 75% | 0.57 | 0.49 | 0.38 | 0.13 | 0.05 | 0.32 | 0.57 | 0.05 | |
| Case 100% | 0.63 | 0.51 | 0.40 | 0.14 | 0.06 | 0.35 | 0.63 | 0.06 | |
| Vegetation height | EGF-0.1M | 0.15 | 0.13 | 0.10 | 0.05 | 0.03 | 0.10 | 0.15 | 0.03 |
| EGF-1M | 0.25 | 0.21 | 0.17 | 0.06 | 0.03 | 0.15 | 0.25 | 0.03 | |
| IGF-1M | 0.39 | 0.32 | 0.25 | 0.07 | 0.04 | 0.21 | 0.39 | 0.04 | |
| IGF-3M | 0.63 | 0.51 | 0.40 | 0.14 | 0.06 | 0.35 | 0.63 | 0.06 | |
| IGF-6M | 0.82 | 0.66 | 0.51 | 0.21 | 0.12 | 0.46 | 0.82 | 0.12 | |
| Building height | E1M-H10 | 0.25 | 0.21 | 0.17 | 0.06 | 0.03 | 0.15 | 0.25 | 0.03 |
| E1M-H20 | 0.23 | 0.17 | 0.11 | 0.04 | 0.02 | 0.12 | 0.23 | 0.02 | |
| E1M-H40 | 0.19 | 0.11 | 0.04 | 0.02 | 0.01 | 0.07 | 0.19 | 0.01 | |
| I3M-H10 | 0.63 | 0.51 | 0.40 | 0.14 | 0.06 | 0.35 | 0.63 | 0.06 | |
| I3M-H20 | 0.59 | 0.42 | 0.24 | 0.08 | 0.05 | 0.28 | 0.59 | 0.05 | |
| I3M-H40 | 0.54 | 0.33 | 0.10 | 0.05 | 0.04 | 0.21 | 0.54 | 0.04 | |
| I3M-H60 | 0.42 | 0.25 | 0.05 | 0.03 | 0.01 | 0.15 | 0.42 | 0.01 | |
© 2019 by the authors. Licensee MDPI, Basel, Switzerland. This article is an open access article distributed under the terms and conditions of the Creative Commons Attribution (CC BY) license (http://creativecommons.org/licenses/by/4.0/).
Share and Cite
Zhang, G.; He, B.-J.; Zhu, Z.; Dewancker, B.J. Impact of Morphological Characteristics of Green Roofs on Pedestrian Cooling in Subtropical Climates. Int. J. Environ. Res. Public Health 2019, 16, 179. https://doi.org/10.3390/ijerph16020179
Zhang G, He B-J, Zhu Z, Dewancker BJ. Impact of Morphological Characteristics of Green Roofs on Pedestrian Cooling in Subtropical Climates. International Journal of Environmental Research and Public Health. 2019; 16(2):179. https://doi.org/10.3390/ijerph16020179
Chicago/Turabian StyleZhang, Gaochuan, Bao-Jie He, Zongzhou Zhu, and Bart Julien Dewancker. 2019. "Impact of Morphological Characteristics of Green Roofs on Pedestrian Cooling in Subtropical Climates" International Journal of Environmental Research and Public Health 16, no. 2: 179. https://doi.org/10.3390/ijerph16020179