Article

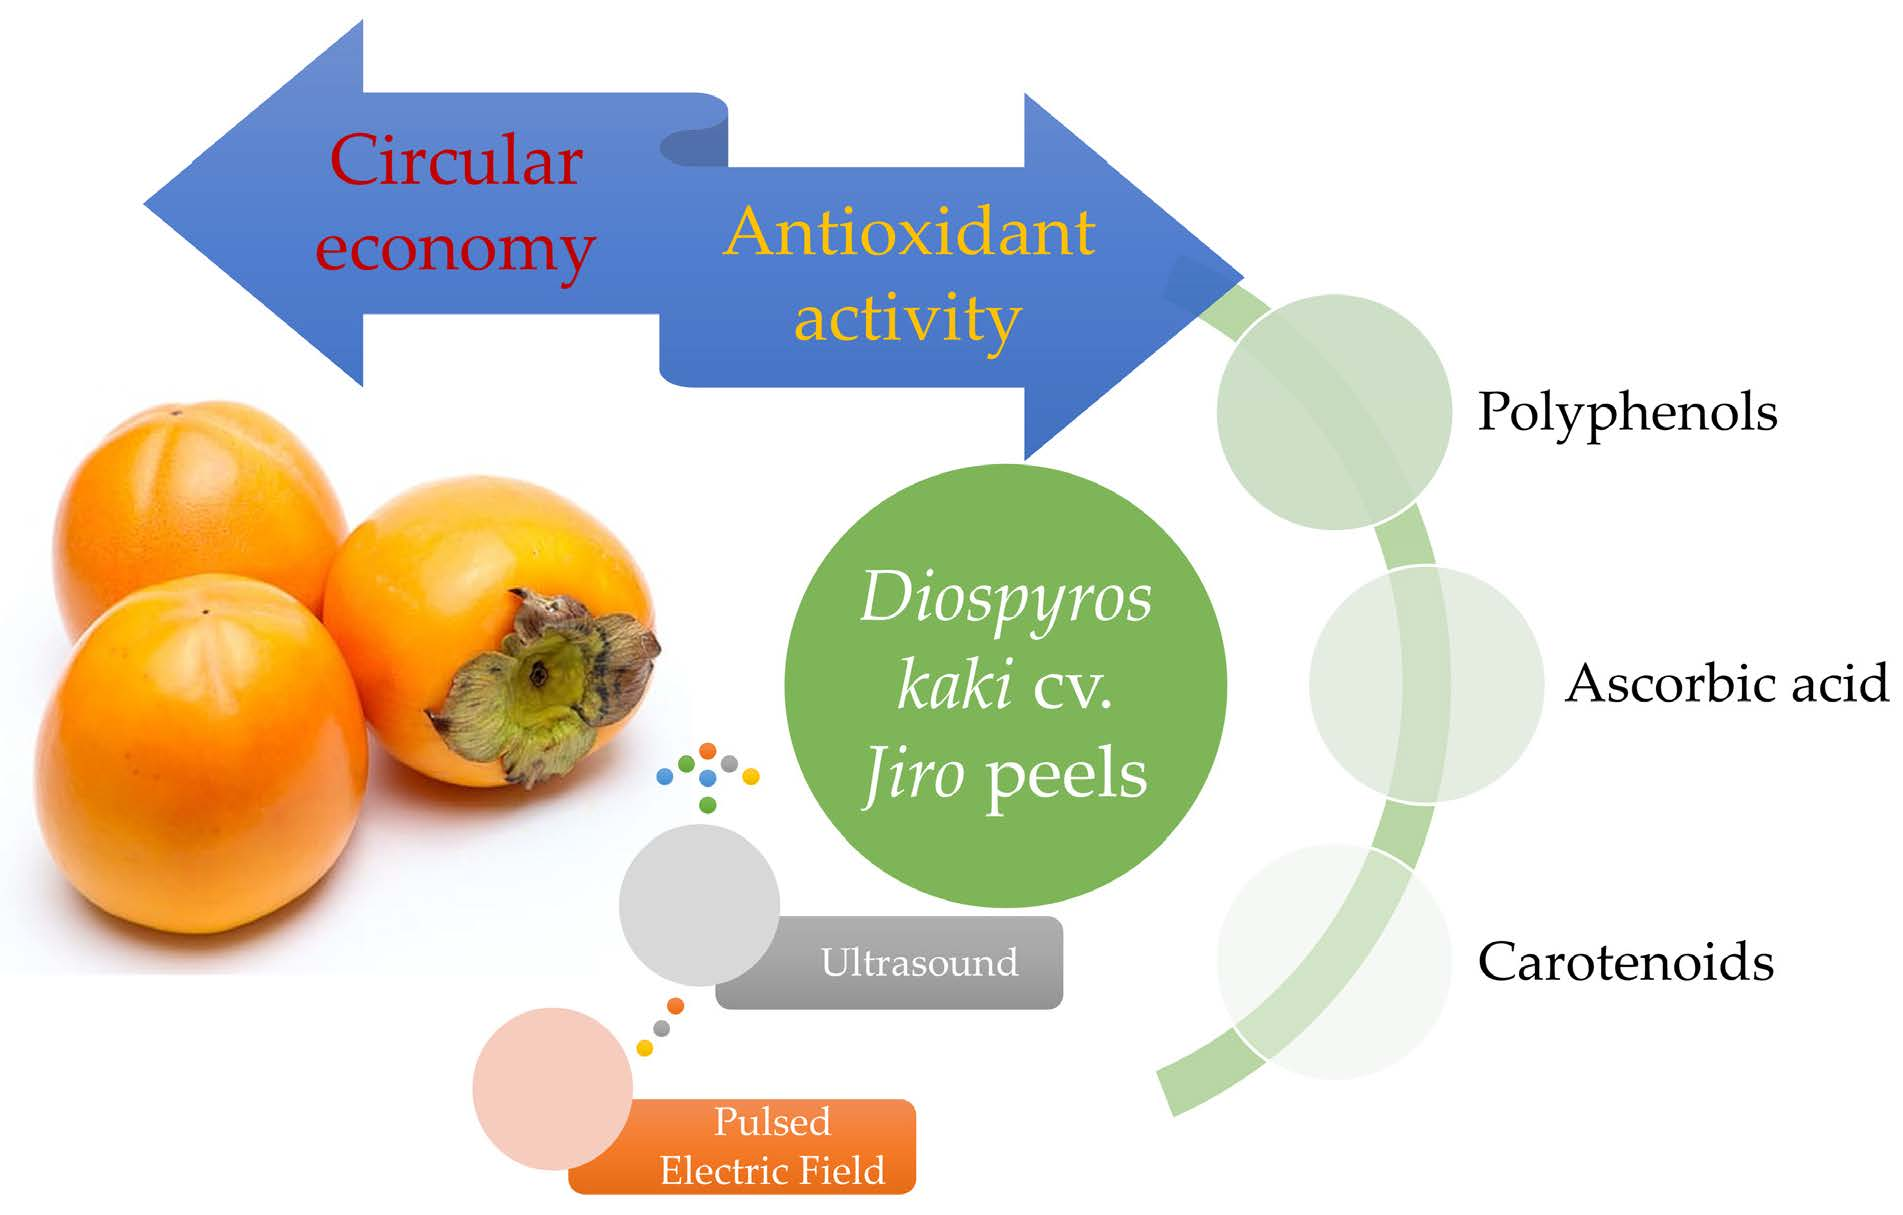
Maximizing the Extraction of Bioactive Compounds from Diospyros kaki Peel through the Use of a Pulsed Electric Field and Ultrasound Extraction

by
Vassilis Athanasiadis
,
Theodoros Chatzimitakos
,
Eleni Bozinou
,
Konstantina Kotsou
,
Dimitrios Palaiogiannis
and
Stavros I. Lalas
*
Department of Food Science & Nutrition, University of Thessaly, Terma N. Temponera Str., 43100 Karditsa, Greece
*
Author to whom correspondence should be addressed.
Biomass 2023, 3(4), 422-440; https://doi.org/10.3390/biomass3040025
Submission received: 26 July 2023 / Revised: 26 August 2023 / Accepted: 2 November 2023 / Published: 4 December 2023
(This article belongs to the Special Issue Food Science and Emerging Technologies in Biomass Processing)

Abstract

:
The persimmon fruit (Diospyros kaki Thunb.) is renowned for its exceptional health benefits, which can be attributed to its abundance of bioactive compounds. This study aimed to optimize the extraction of bioactive compounds from persimmon peel, an underexplored waste biomass, within the frame of sustainability and a circular economy. For this reason, a comprehensive multi-factor extraction approach was employed. Specifically, diverse methods including a pulsed electric field and ultrasonication combined with simple stirring were explored. Through this systematic approach, the most efficient extraction process was determined, resulting in elevated yields of bioactive compounds, including polyphenols, ascorbic acid, and total carotenoids. Among the identified phenolic compounds, rutin emerged as the most abundant, with concentrations reaching up to 172.86 μg/g. Utilizing partial least squares analysis, the maximum predicted values for the bioactive compounds were determined, with total polyphenols reaching 7.17 mg GAE/g, ascorbic acid at 4.93 mg/g, and total carotenoids at 386.47 μg CtE/g. The antioxidant activity of the extracts was evaluated with the ferric reducing antioxidant power (FRAP), 2,2-diphenyl-1-picrylhydrazyl (DPPH) radical, and H2O2 scavenging assays. The recorded antioxidant performance underscored the substantial potential of persimmon peels as a source of cost-effective extracts with high antioxidant activity. This study not only contributes to optimizing the bioactive compounds’ extraction from persimmon peel but also highlights the process’s viability by producing valuable extracts with antioxidant properties at low cost.

Graphical Abstract

1. Introduction

Persimmon belongs to the genus Diospyros (Ebenaceae), which comprises about 500 economically significant species [1,2]. Among these, Diospyros kaki, Diospyros virginiana, Diospyros oleifera, and Diospyros lotus are considered highly valuable [3]. However, Diospyros kaki, commonly known as Japanese persimmon, is one of the most commercially recognized species [3,4]. Although persimmons share similarities with berries in terms of morphology, they are not commonly categorized as such. The Latin name “Diospyros” can be translated to “food of the Gods”, combining “Dios” (God) and “pyros” (food) [5]. Persimmons contain an abundance of nutrients, including vitamins A and C, as well as complex B vitamins, making them highly beneficial [6,7,8]. Additionally, they are an excellent source of essential minerals such as calcium (16 ± 4.33 mg/100 g), phosphorus (27 ± 2.66 mg/100 g), manganese (11 ± 1.80 mg/100 g), and potassium (203 ± 24.10 mg/100 g) [9]. Furthermore, persimmon fruits are renowned for their health-promoting properties. These properties are attributed to the presence of antioxidant compounds, such as polyphenols, in the fruit [10].
Originally native to Asia, and particularly China, the cultivation of Diospyros kaki has now spread across various nations [11]. Key producing countries include Korea, Japan, Brazil, Turkey, and Italy [12], with China leading global production, accounting for over 75% of the world’s output, and producing more than 3 million tons of persimmons annually [13]. Food waste represents a significant global challenge, with approximately 1.3 billion tons of food being discarded annually, often including fruit peels [14]. Consequently, Japanese persimmon fruits generate considerable waste, especially in Asia. Considering the persimmon’s various health benefits, such as its ability to combat free radicals, diabetes, cancer, and dermatological issues [15], it becomes evident that the peel could be utilized in the pharmaceutical and cosmetics sectors.
Although previous attempts to prepare persimmon peel extracts have been made, they only implement conventional extraction methods, such as stirring [16,17]. In particular, dried persimmon peels were extracted in distilled water by stirring at 100 °C for 60 min, and the antioxidant activity was found to be 86% using the DPPH free radical scavenging assay [18]. However, high energy consumption was recorded. Green extraction techniques are a hot topic in this research field since they require less extraction time, energy, and solvent; therefore, they are aligned with sustainable development strategies [19]. Moreover, in a large number of experimental processes, better results have been shown to be achieved by using and/or combining green extraction techniques [14]. Ultrasound (US) constitutes a green technique and is widely used [20]. Another upcoming extraction technique that ensures the maximum isolation of bioactive substances is the pulsed electric field (PEF). Essentially, the principle of PEF is based on the phenomenon of electrodeposition, which occurs periodically in a non-destructive way for the element via the application of a high-voltage pulsed electric field. Disruption of the cell membrane structure occurs, meaning that increased extraction yields can be achieved [21].
The aim of this study was to investigate and optimize the extraction of essential bioactive compounds, such as vitamin C, vitamin A, carotenoids, polyphenols, and other antioxidants from persimmon peels (specifically from Diospyros kaki), utilizing various extraction techniques including PEF and US. Additionally, the study aimed to determine the most suitable conditions, such as temperature, time, and solvent compositions (ethanol–water mixtures), to maximize the yield of these beneficial compounds. The ultimate goal was to encourage and facilitate the exploitation of persimmon peel as a valuable nutritional product or ingredient in various industries, thereby contributing to waste reduction and promoting sustainable practices and a circular economy.

2. Materials and Methods

2.1. Chemicals and Reagents

All solvents used were at least of HPLC grade and were obtained from Carlo Erba (Val de Reuil, France). Gallic acid, anhydrous sodium carbonate, 2,2-diphenyl-1-picrylhydrazyl (DPPH), 2,4,6-tri-2-pyridinyl-1,3,5-triazine (TPTZ), phosphate buffer, and Folin–Ciocalteu reagent were obtained from Penta (Prague, Czech Republic). Chemical standards for the HPLC-based determination of polyphenols (i.e., chlorogenic acid, neochlorogenic acid, cryptochlorogenic acid, rutin, quercetin 3-O-galactoside, and kaempferol 3-O-β-rutinoside), iron (III) chloride, hydrochloric acid, ascorbic acid, and trichloroacetic acid were purchased from Sigma-Aldrich (Steinheim, Germany). Deionized water was used for all conducted experiments.

2.2. Sample and Extract Preparation

Jiro persimmons (Diospyros kaki) were provided by local farmers in the province of Pella (Central Macedonia, Greece). The persimmon fruits were randomly chosen. The persimmons were washed with tap water and dried with paper towels. The peels were manually removed, sliced into smaller pieces, and lyophilized in a Biobase BK-FD10P lyophilizer (Jinan, China). For the lyophilization process, the peels were frozen at −40 °C for 2 h before insertion into the lyophilizer. Lyophilization was carried out for 24 h. The peels were crushed into a fine powder (with an approximate average particle diameter of 500 μm) and stored in the freezer until further usage.
A glass bottle was filled with 20 mL of the extraction solvent and 1 g of powdered persimmon peels and then the extractions followed. Table 1 shows the extraction solvent composition (percentage concentration of ethanol in water). Extraction was carried out using stirring (ST) at 500 rpm at varied temperatures and times (Table 1). Prior to extraction, some samples were also treated with PEF and/or US, as indicated in Table 1. Prior to the 20-min treatment with either technique (US or PEF treatments), the dried material was hydrated for 10 min by submerging it in the solvent. In all cases, after the extraction, the mixture was centrifuged for 10 min at 4500 rpm, then the supernatant was retracted and stored at −40 °C until further analysis.
A mode/arbitrary waveform generator (UPG100, ELV Elektronik AG, Leer, Germany), a digital oscilloscope (Rigol DS1052E, Beaverton, OR, USA), a high-voltage power generator (Leybold, LD Didactic GmbH, Huerth, Germany), and two custom stainless-steel chambers (Val-Electronic, Athens, Greece) were used for the PEF processing of the samples [22,23,24]. The pulse period was set to 1 ms (frequency: 1 kHz), the pulse duration to 10 μs, and the electric field density to 1.0 kV/cm. The Elmasonic P machine (Elma Schmidbauer GmbH, Singen, Germany) was kept at 30 °C, running at 37 kHz for the US treatment [25,26].

2.3. Design of the Experiment and the Response Surface Methodology (RSM) Optimization

The RSM was used to extract the total polyphenols (TPC), ascorbic acid, and total carotenoids with the highest yield achievable [24,25,26]. The antioxidant activity was measured using the FRAP, DPPH, and H2O2 scavenging assays. Optimizing the concentration of rutin as well as the values of TPC, FRAP, DPPH, H2O2 scavenging, ascorbic acid, and total carotenoids was the experimental design’s goal. The extraction method, the solvent concentration (C, % v/v), the extraction duration (t, min), and the extraction temperature (T, °C) were all optimized to achieve this goal. An experiment with a main-effect screening design and 20 design points served as the foundation for the optimization. Working according to the experimental design, the process variables were set up in five tiers. Table 1 contains a list of the coded and real levels. Using an analysis of variance (ANOVA) and summary-of-fit tests, the overall model significance (R2, p) and the significance of the model (equation) coefficients were evaluated at a minimum level of 95%.
The response variable was also predicted using a second-order polynomial model, as indicated in Equation (1), as a function of the analyzed independent factors:
Y k = β 0 + i = 1 2 β i X i + i = 1 2 β ii X i 2 + i = 1 2 j = i + 1 3 β ij X i X j
where Yk is the predicted response variable; Xi and Xj are the independent variables; β0, βi, βii, and βij are the intercept and the regression coefficients of the linear, quadratic, and interaction terms of the model, respectively.
The RSM was used to calculate the largest peak area and the influence of a significant independent variable on the response.

2.4. Sample Analyses

All information regarding the analyses conducted on the samples [14,27,28,29,30], such as the total polyphenol content (TPC), ferric reducing antioxidant power (FRAP), DPPH, radical scavenging activity, a hydrogen peroxide (H2O2) scavenging assay, ascorbic acid (AA) content, total carotenoid content (TCC), and HPLC-DAD are given in the Supplementary Materials.

2.5. Statistical Analysis

JMP® Pro 16 software (SAS, Cary, NC, USA) was used for the experimental design, as well as the statistical analysis pertaining to the response surface methodology and the distribution analysis. The partial least squares (PLS) analysis was based on the nonlinear iterative partial least squares (NIPALS) algorithm. The quantitative analysis was performed in triplicate and the extraction processes were performed at least twice. The results are shown as medians and standard deviations.

3. Results and Discussion

3.1. Extraction Optimization

Persimmon holds significant commercial value, being extensively studied and utilized across various industrial sectors [31]. Notably, the peel of persimmon appears to be even more nutritious than the pulp. The persimmon pulp was analyzed, and the pH value was measured to be 6.47 ± 0.03, and the total soluble solids value (°Brix) was 18.6 ± 0.12. However, to maximize the yield of the bioactive compounds present in the peel extract, including the total polyphenols, ascorbic acid, and total carotenoids, various parameters were examined. These parameters (Table 1) included solvent composition (water, ethanol, and their mixtures at 25, 50, and 75% v/v), extraction time (ranging from 30 to 150 min), and extraction temperature (ranging from a low of 20 °C to a high of 80 °C). In order to ensure optimum results, the solid-to-liquid ratio was 1:20, i.e., 1 g of persimmon powdered peel to 20 mL of each solvent (this ratio was selected based on the preliminary results). Additionally, low-energy-consumption extraction techniques such as PEF and US prior to ST were employed, either individually or in various combinations. The results obtained from the analyses of the prepared extracts are given in Table 2, whereas the contents of the prepared extracts in polyphenolic compounds are given in Table 3. Moreover, a representative chromatogram of the extracts is given in Figure 1.
Through the evaluation of various extraction parameters, a significant reduction in resource waste (e.g., solvents, time, and energy) can be achieved, rendering the processing of food by-products more environmentally friendly [23]. For the extraction, the solvent composition is of paramount importance, since the extraction capacity of different bioactive compounds varies, depending on their polarity [30]. Polyphenols are one of the best-known examples since they are unable to be effectively extracted with water, while ethanol is among the solvents that easily improve the extraction performance of samples to be extracted [14,28,32]. By using extraction methods such as PEF and US, further disruption of the fruit cell membranes is induced and, therefore, the nutrients are more easily extracted. However, in the present study, their use was not considered the optimal extraction method for all compounds (vide infra), which results in the completion of the extraction process of persimmon within a shorter time than with other fruits [14,28,32,33].

3.2. Total Polyphenol Content of the Extracts

Persimmon fruit is a good source of polyphenols [34]. Polyphenolic compounds are secondary metabolites in plants [35,36] that can exist either in free or bound forms within the fruit [37]. According to the results (Table 2), it is clear that using the ST technique alone was sufficient to achieve the maximum extractable polyphenol content from persimmon peels. Employing a 50% ethanol:water mixture and conducting the extraction at 35 °C for 90 min proved to be the most suitable conditions for total polyphenol isolation. The TPC obtained ranged from 2.55 to 6.47 mg GAE/g, resulting in an increase in a TPC of up to 153.73% (Table 2). In a previous study, where a methanolic solvent was used to increase polyphenol content to retrieve extracts for incorporation into biscuits, the TPC was found to be 0.339 mg/g [38]. Our findings suggest that the use of ethanol was of significant importance, regardless of the extraction technique utilized. In a previous study, where several persimmon subspecies such as D. kaki cv. Mopan, D. kaki cv. Jiro, and D. kaki cv. Zenjimaru were examined, the TPC values found in the flesh were 0.32, 1.68, and 3.48 mg GAE/g, respectively [39]. However, these amounts are far lower than the optimum value of 6.47 mg GAE/g that can be obtained from the peel by following conditions that ensure higher nutrient isolation. By applying the optimum combination of parameters (X1:1, X2:3, X3:3, and X4:3) (Table 4 and Table 5), an even higher quantity of polyphenols can be achieved (7.17 mg GAE/g). This represents a further ~10% increase compared to the maximum values for total polyphenols among the initial 20 samples. The significance of these findings lies in the potential value of persimmon peel as a rich source of polyphenols, surpassing the polyphenol content found in the flesh. Such insights into the optimal extraction conditions can open new avenues for utilizing persimmon peel in the development of functional foods, dietary supplements, and pharmaceutical products, promoting sustainable practices and reducing food waste. However, it must be taken into account that in our case, only free phenolics were studied. As such, further studies are needed to explore bound phenolics to provide a more comprehensive overview.

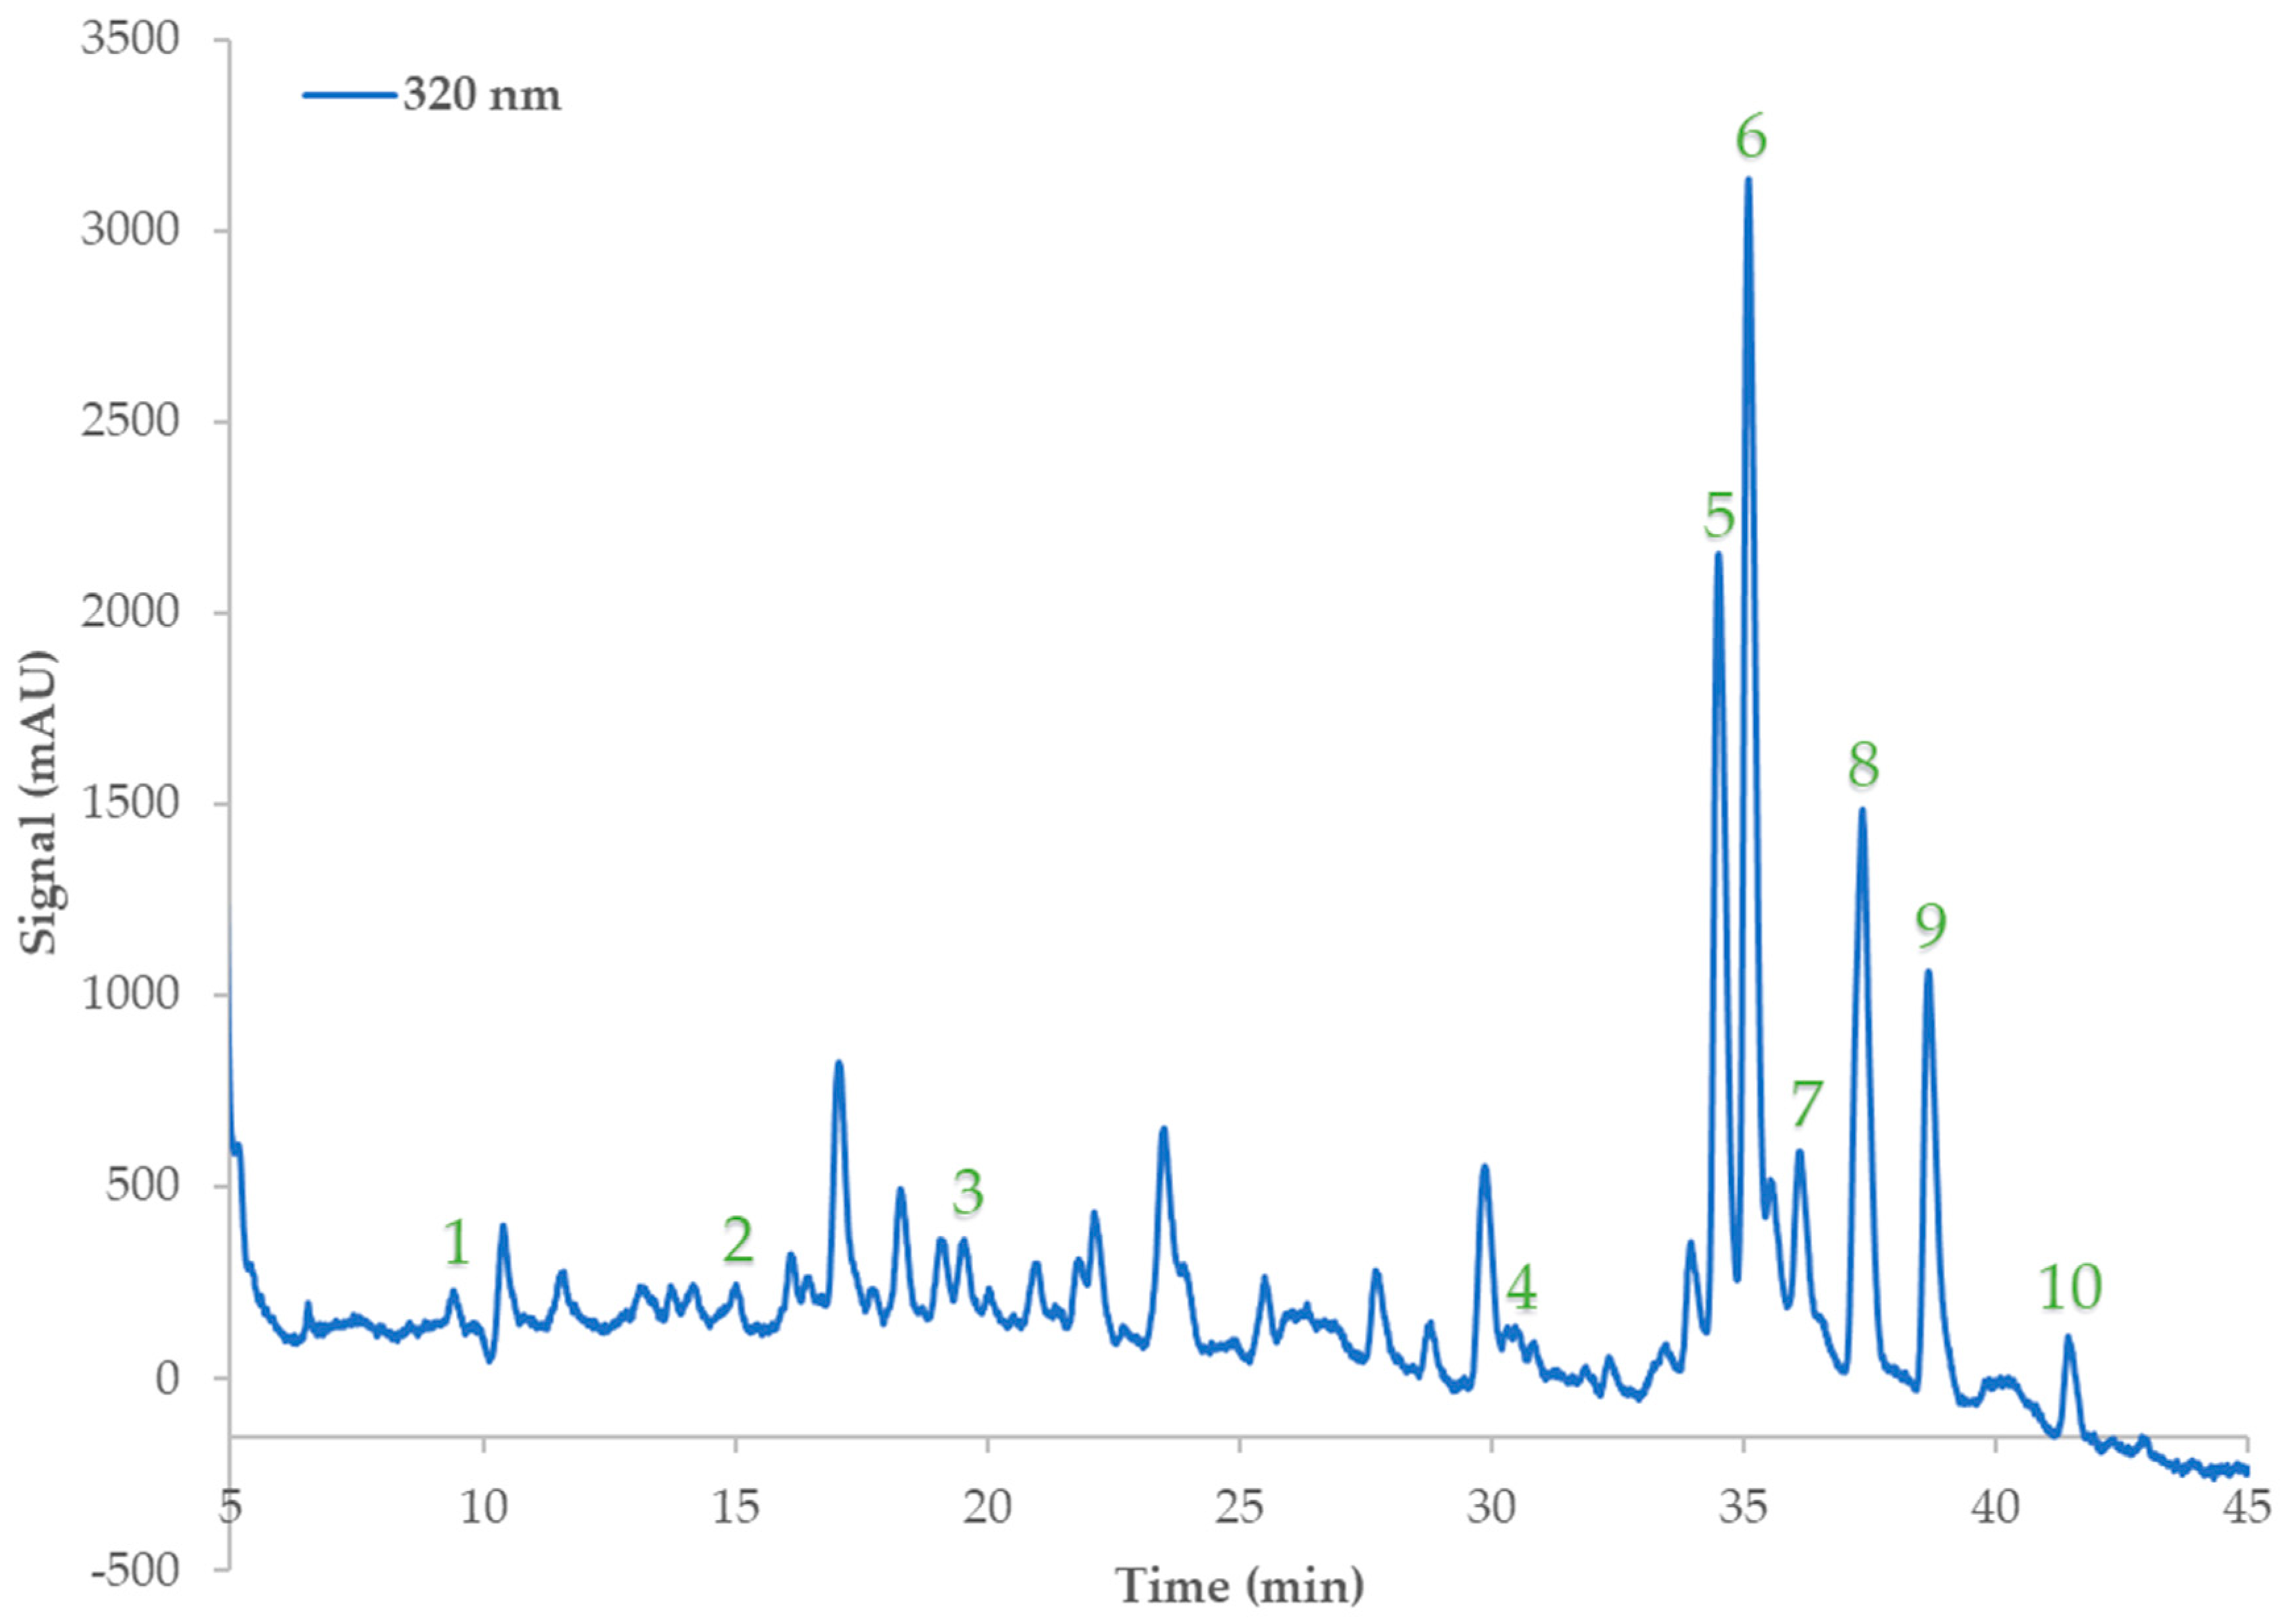
3.3. Content of Rutin and Other Polyphenols in the Extracts

Rutin, a prominent polyphenol used in traditional Chinese medicine [40], is well-known for its anti-inflammatory and antioxidant properties, as well as its potential to reduce blood fat and cholesterol levels [41,42]. Moreover, rutin is widely recognized for its anti-cancer abilities [43]. Interestingly, a recent study reported that rutin was among the polyphenols that were not detected in persimmon [44], albeit suggesting that further investigation was recommended. However, in this study, it was revealed that rutin was the main polyphenol, with quantities reaching as high as 164.24 μg/g and no less than 90 μg/g (Table 2). It was found that the combination of US and ST techniques, coupled with high temperature (80 °C) and higher ethanol content in the solvent (75%), yielded the maximum rutin content. Notably, the extraction time did not significantly impact the maximum isolation, as only 1 h was sufficient. Moreover, it transpired that the maximum predicted amount of rutin that can be obtained was found to be 172.86 μg/g (Table 4 and Table 5). The presence of this valuable polyphenol reinforces the potential of the extract as a source of essential compounds with numerous health benefits, making it a promising candidate for pharmaceutical and functional food applications.
Among the polyphenolic compounds, significant quantities of caffeic acid, p-coumaric acid, ferulic acid, and gallic acid were previously found in persimmon peels [45,46]. Our results align with these previous findings, as we detected all these polyphenolic compounds in the majority of our samples (Table 3). For compounds such as gallic acid, protocatechuic acid, and caffeic acid, simple ST was proven to be insufficient for their identification, necessitating the use of US in the case of gallic acid and a combination of PEF and US for identifying protocatechuic acid and caffeic acid. In addition, the use of pure ethanol did not yield higher amounts of these three polyphenols. The optimum isolated amounts for gallic acid, protocatechuic acid, and caffeic acid were 54.62, 76.85, and 22.88 μg/g, respectively (Table 3). These values far surpassed previous studies focused on the flesh of the fruit, where gallic acid values amounted to only 9.53 and 27.94 μg/g [47,48], demonstrating the effectiveness of the currently proposed extraction method. According to previous research, persimmon fruits contain low amounts of protocatechuic acid at about 0.13 μg/g [47], an amount that is almost negligible compared to what can be ensured using this study’s proposed extraction method. Finally, regarding caffeic acid, the amount previously recorded was 1 μg/g [49], which is also low compared to the amount that can be extracted from the peel using techniques such as PEF and high temperatures (80 °C).
Moreover, the polyphenolic compounds of p-coumaric acid, ferulic acid, and myricetin were identified and quantified in the extracts. The use of US before ST as the extraction mode yielded maximum results for p-coumaric acid and myricetin, while water was the most suitable solvent. The recorded amounts for p-coumaric acid, ferulic acid, and myricetin were 13.94, 56.21, and 18.04 μg/g, respectively (Table 3). These values greatly exceeded previous studies’ results, which were focused on the flesh of the fruit, wherein p-coumaric acid was found at 0.97 μg/g [48] and ferulic acid at 0.08 μg/g [10]. Myricetin lowers the risk of prostate cancer and diabetes in humans [50], so its high amounts in products are of major importance. In the present study, the amount of myricetin increased from 16.29 to 18.04 μg/g, i.e., by 10.74%, increasing its positive effects on human health.
Lastly, quercetin 3-β-D-glucoside, kaempferol 3-O-β-rutinoside, and kaempferol 3-glycoside were identified in relatively high amounts (Table 3). Such polyphenols are well known to exist in persimmons [51]. Among these polyphenols, kaempferol-3-O-glycoside is a flavonoid known for its biological properties and is commonly found in various plants [52]. ST was found to be adequate for obtaining substantial amounts of all three compounds, with the solvent comprising 25% ethanol exhibiting the optimum results. Temperature played a significant role in extracting kaempferol 3-glycoside, with the maximum amount being recorded at 80 °C, while a temperature of 35 °C was adequate for the other two compounds. The amounts of quercetin 3-β-D-glucoside ranged from 7 to 12.78 μg/g (an 82.57% increase) (Table 3), kaempferol 3-O-β-rutinoside ranged from 53.81 to 80.11 μg/g (a 48.88% increase), and kaempferol 3-glycoside ranged from 25.08 to 55.59 μg/g (a 121.65% increase), signifying the need for optimal extraction conditions.

3.4. Antioxidant Properties of the Extracts

According to Yaqub et al., the genus Diospyros is extremely rich in antioxidants, with the peel being richer than the pulp [53]. To assess the antioxidant properties of the extracts, three different methods were used. In all cases, the significance of using US before ST was highlighted, to ensure the highest antioxidant activity. In particular, the combination of PEF + US + ST proved to be the most effective method for H2O2 scavenging assays (Table 2). As regards the FRAP method, the antioxidant activity in the peel reached a maximum value of 42.19 μmol/g (Table 2). In a study on a related species, Diospyros virginiana, the antioxidant activity using the same method was found to be 45.06 μmol/g [54]. The difference between the two species’ values is no more than 7%, which can be attributed to the variation in species. In a study evaluating the antioxidant activity of the fruit of the Diospyros kaki cv. Mopan subspecies using the DPPH method, a value of 0.09 μmol/g was recorded [55]. In contrast, the present study’s samples exhibited values ranging from 5.58 to 34.29 μmol/g (Table 2), validating the notion that the peel holds significantly enhanced antioxidant activity compared to the pulp. The scavenging activity of H2O2 showed variable values, with an increase of up to 114%, with values ranging from 15.46 to 33.03 μmol of AAE/g (Table 2). Considering the crucial importance of antioxidant activity in the food, medicinal, and cosmetic industries [56,57], persimmon peel emerges as a good alternative source of antioxidant compounds. The maximum predicted values in all three methods of measuring antioxidant capacity, as well as the optimal extraction parameters, are presented in Table 5. In fact, comparing these values with the optimum values of the 20 samples (Table 2), it was found that when using the FRAP method, the value can be increased by 13.18%, while when using the H2O2 method, the value increased by 7.69%. Remarkably, the optimum value for antioxidant capacity, established through the DPPH free radical scavenging assay, is the same as the maximum value from the 20 samples. These findings underscore the antioxidant potential of persimmon peel, which can be harnessed for various applications in the food and health industries.

3.5. Total Carotenoid Content (TCC) of the Extracts

The substantial abundance of carotenoids in persimmon peel significantly contributes to the fruit’s high antioxidant activity [58,59]. In persimmon peels, the identified carotenoids, listed in ascending order of content, include β-cryptoxanthin, zeaxanthin, lutein, and β-carotene [60]. In a prior study examining TCC in persimmon peel, the reported amount was 340 μg/g [53]. According to Table 2, the amount of TCC in the current extracts surpassed this value, revealing the maximum TCC to be 392.17 μg/g, indicating a 15.34% increase. By using ethanol in combination with ST and a relatively elevated temperature (65 °C) for a short extraction time (30 min), the highest TCC extraction could be achieved. The fact that the lowest amount of TCC determined in the extracts was 3.51 μg/g underscores the feasibility of maximizing the isolation of these bioactive compounds using a better combination of techniques. According to Table 5, the predicted amount of TCC can reach up to 386.47 μg/g.

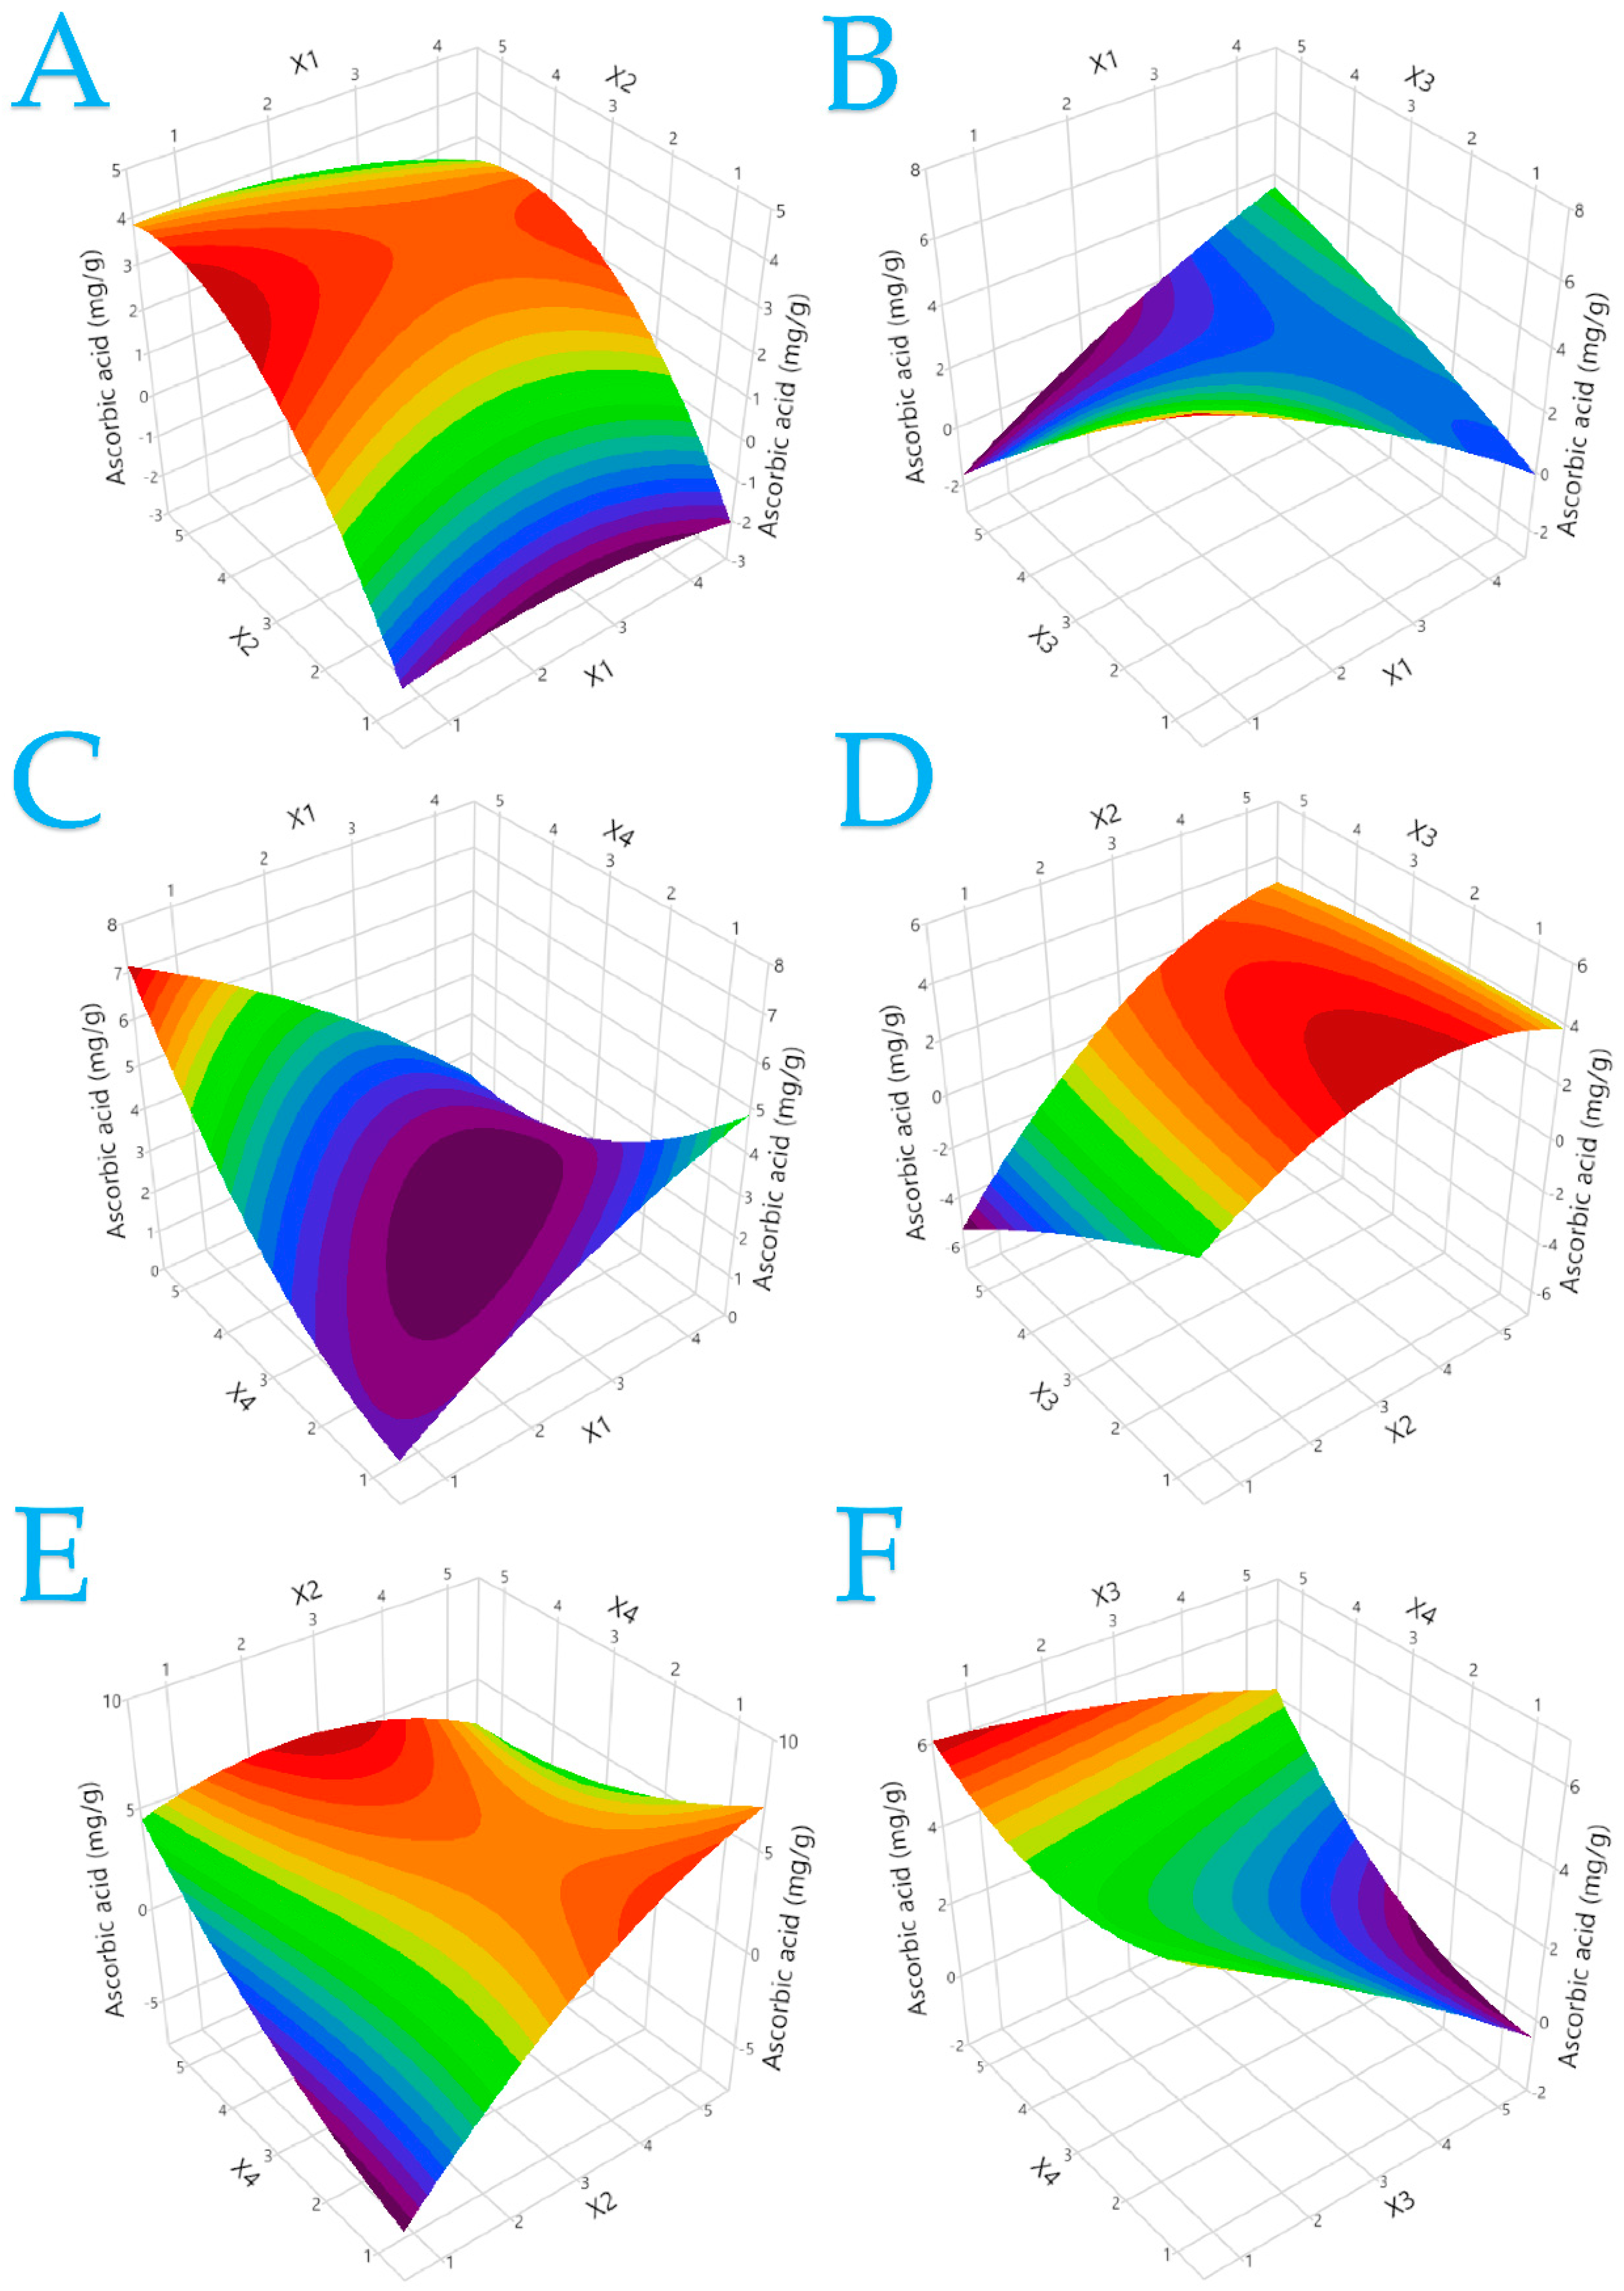
3.6. Ascorbic Acid Content of the Extracts

The bioactive compounds in persimmons and their notably high content of ascorbic acid make them ideal for producing products with functional characteristics [61]. The pulp of the plant contains approximately 0.70 mg/g of ascorbic acid [62]. According to our results (Table 2), it is evident that the persimmon peels contained varying amounts of ascorbic acid, ranging from 0.62 to 5.34 mg/g. This significant finding highlights two important aspects. Firstly, the ascorbic acid content in the peel extracts can differ from the flesh by as little as 13% and as much as 663%. Secondly, the optimal conditions for ascorbic acid extraction were determined to include ethanol, ST, a short extraction time, and a temperature set at 65 °C. Under these conditions, an increase in the ascorbic acid content of the extracts of up to 790% can be achieved.
Finally, in Table 4, the statistically significant parameters, second-order polynomial equations (models), and coefficients (coefficients > 0.94) generated for each model are shown, indicating the reliability and accuracy of the developed models. Figures S1–S7 in the Supplementary Materials provide plots of the actual responses compared to the expected response for each investigated parameter, alongside the desirability values. Figure 2 and Figure 3 illustrate three-dimensional response plots for TPC and ascorbic acid, while Figures S8–S12 exhibit three-dimensional response plots for the additional responses.

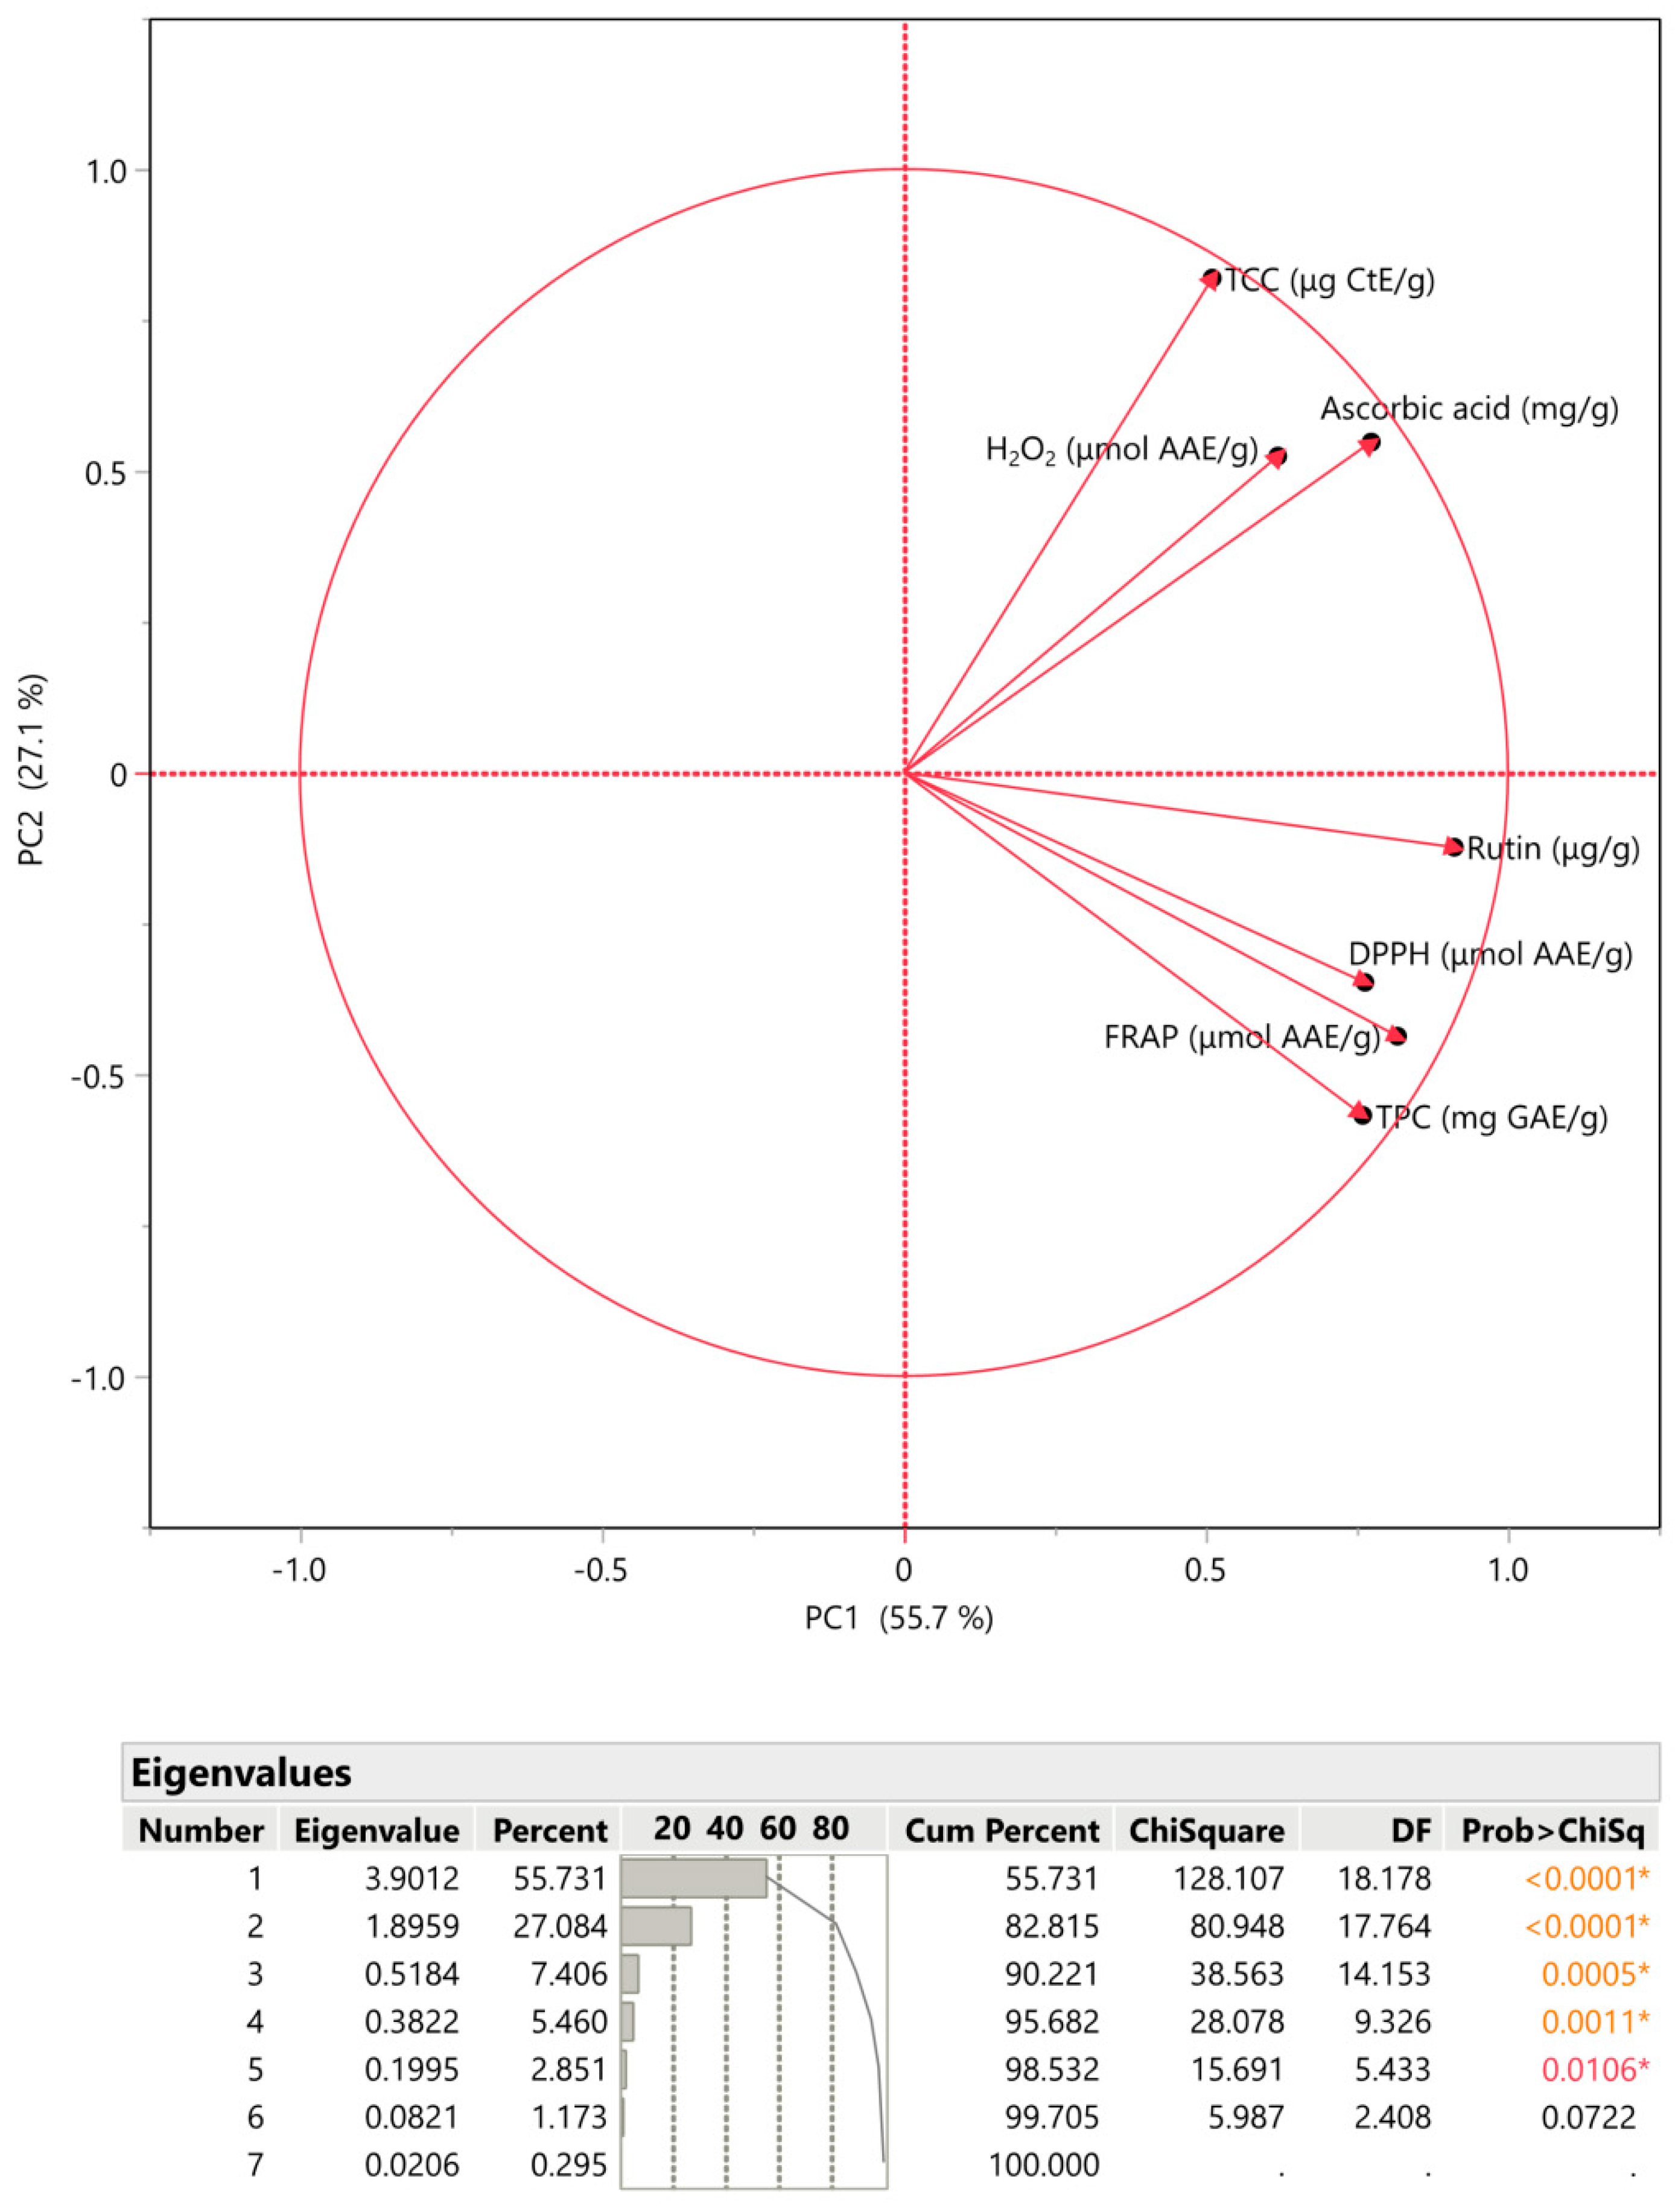
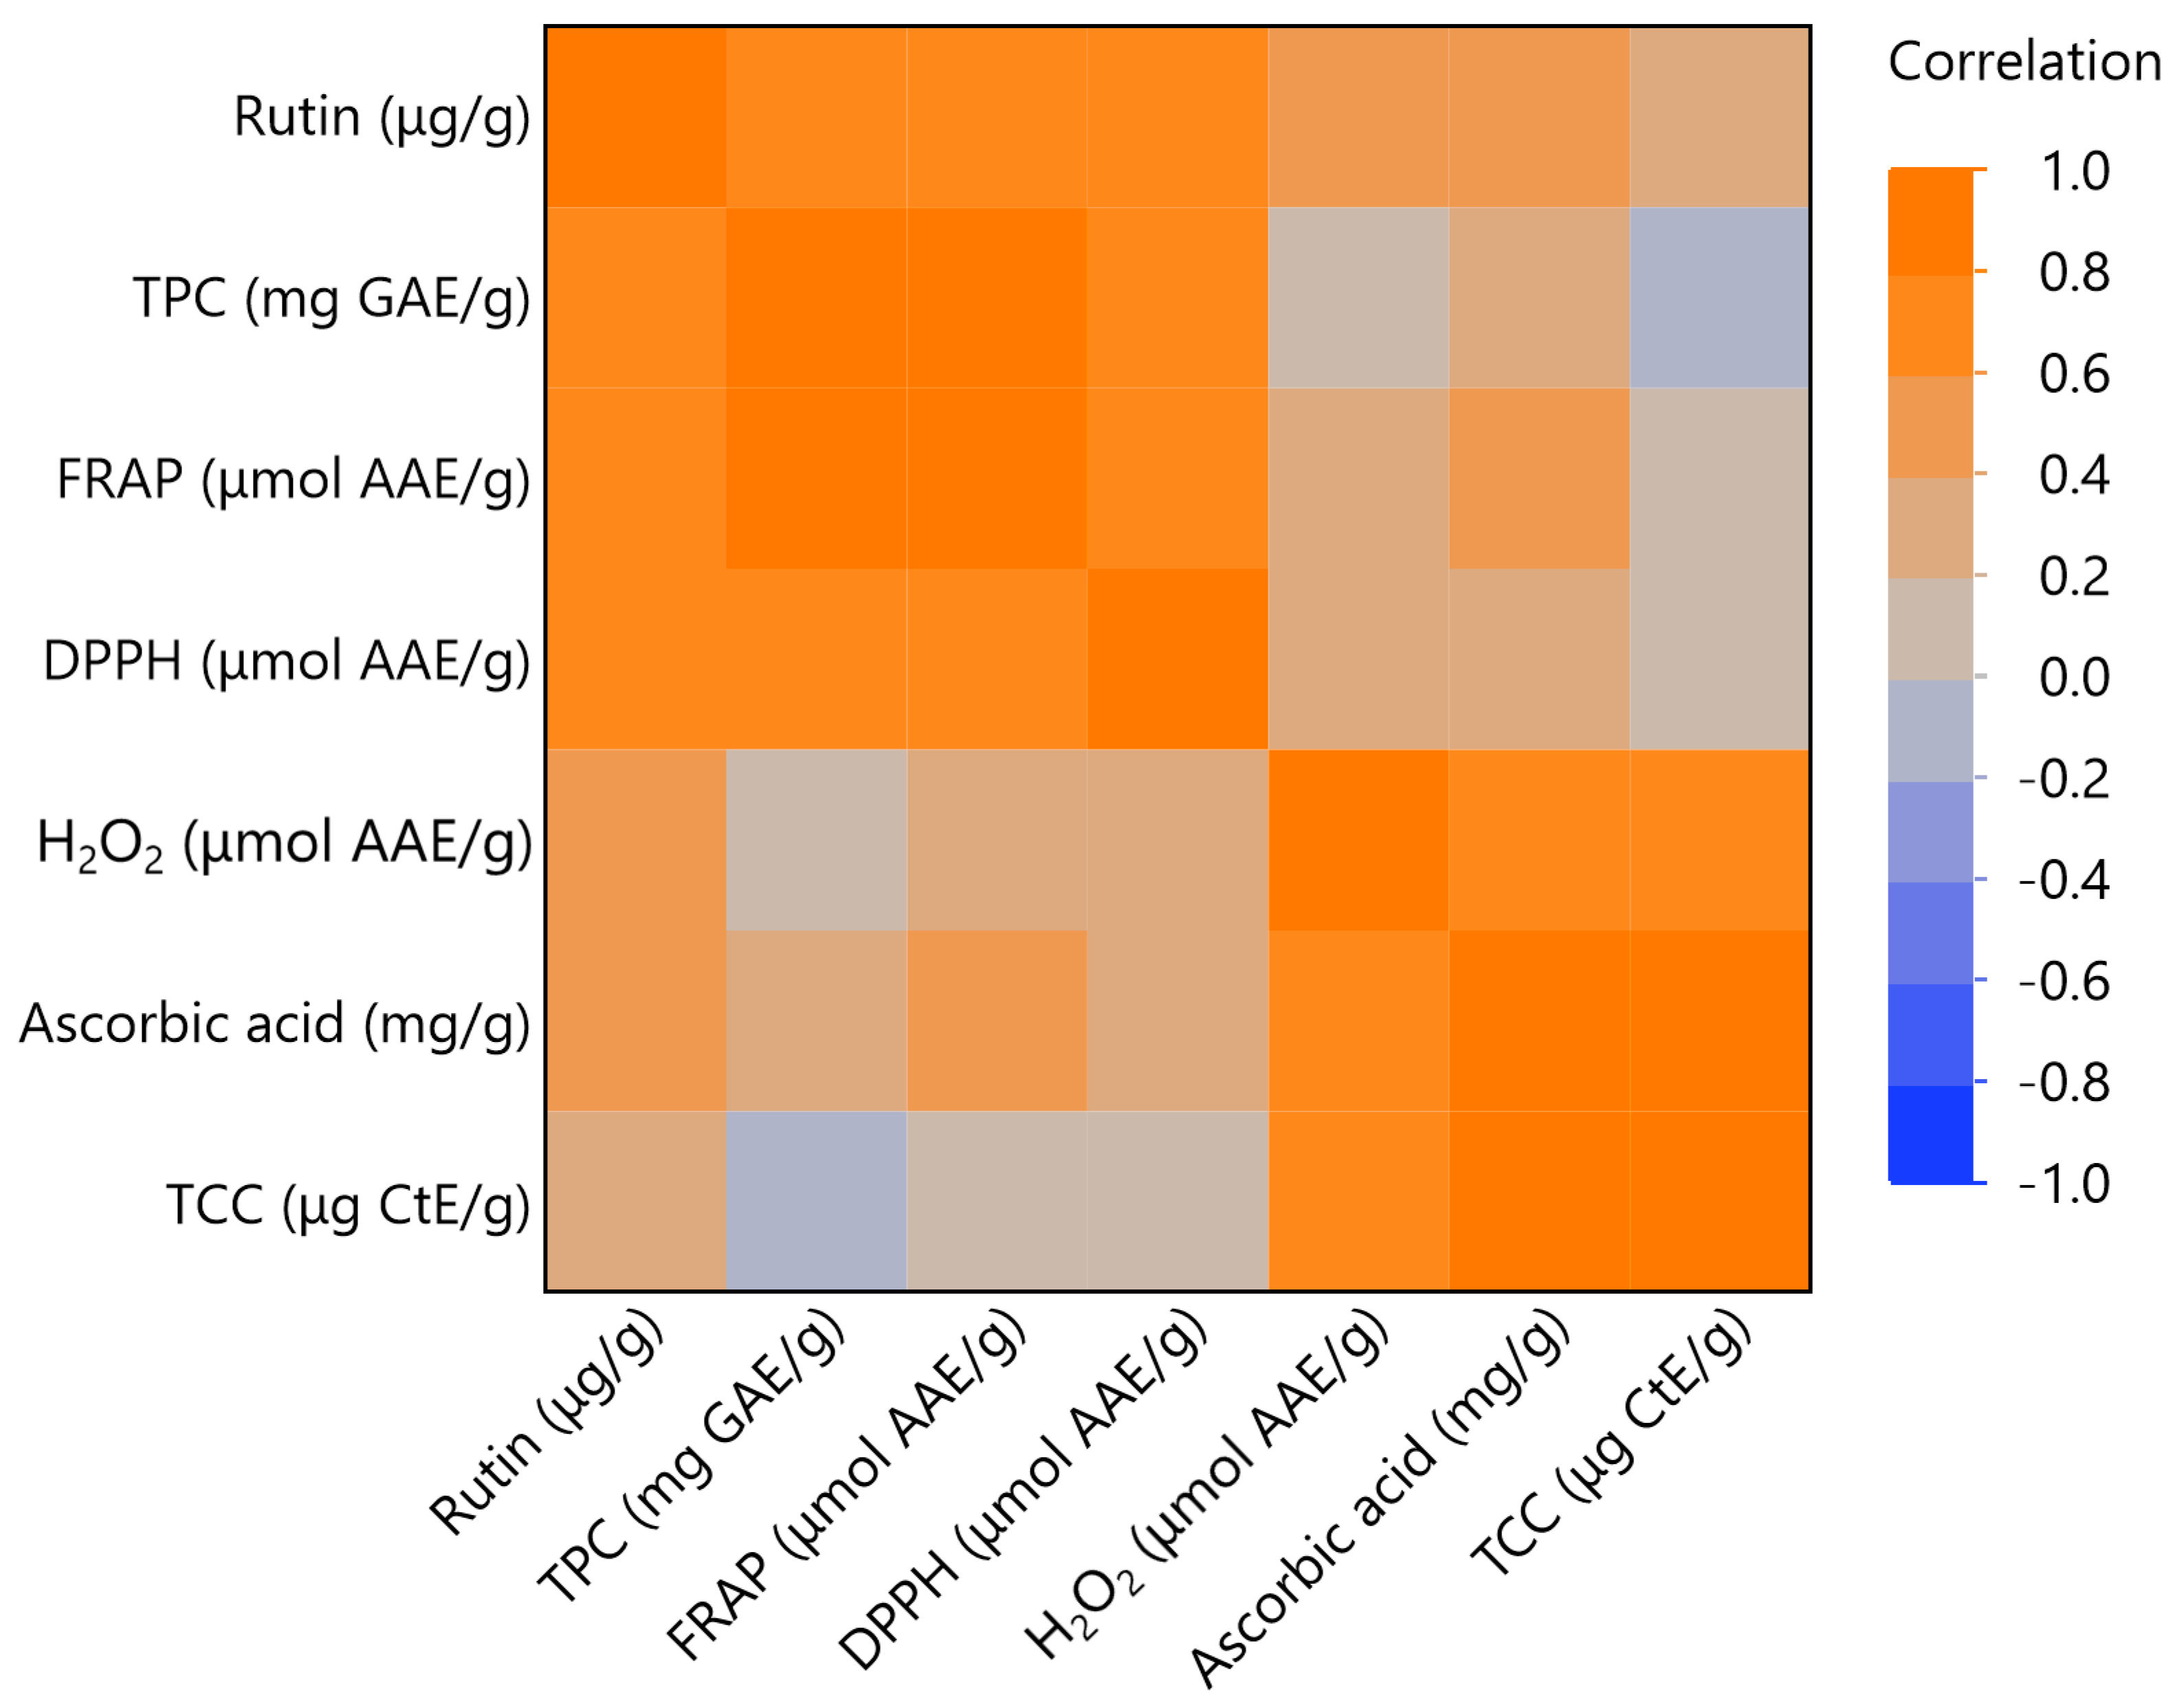
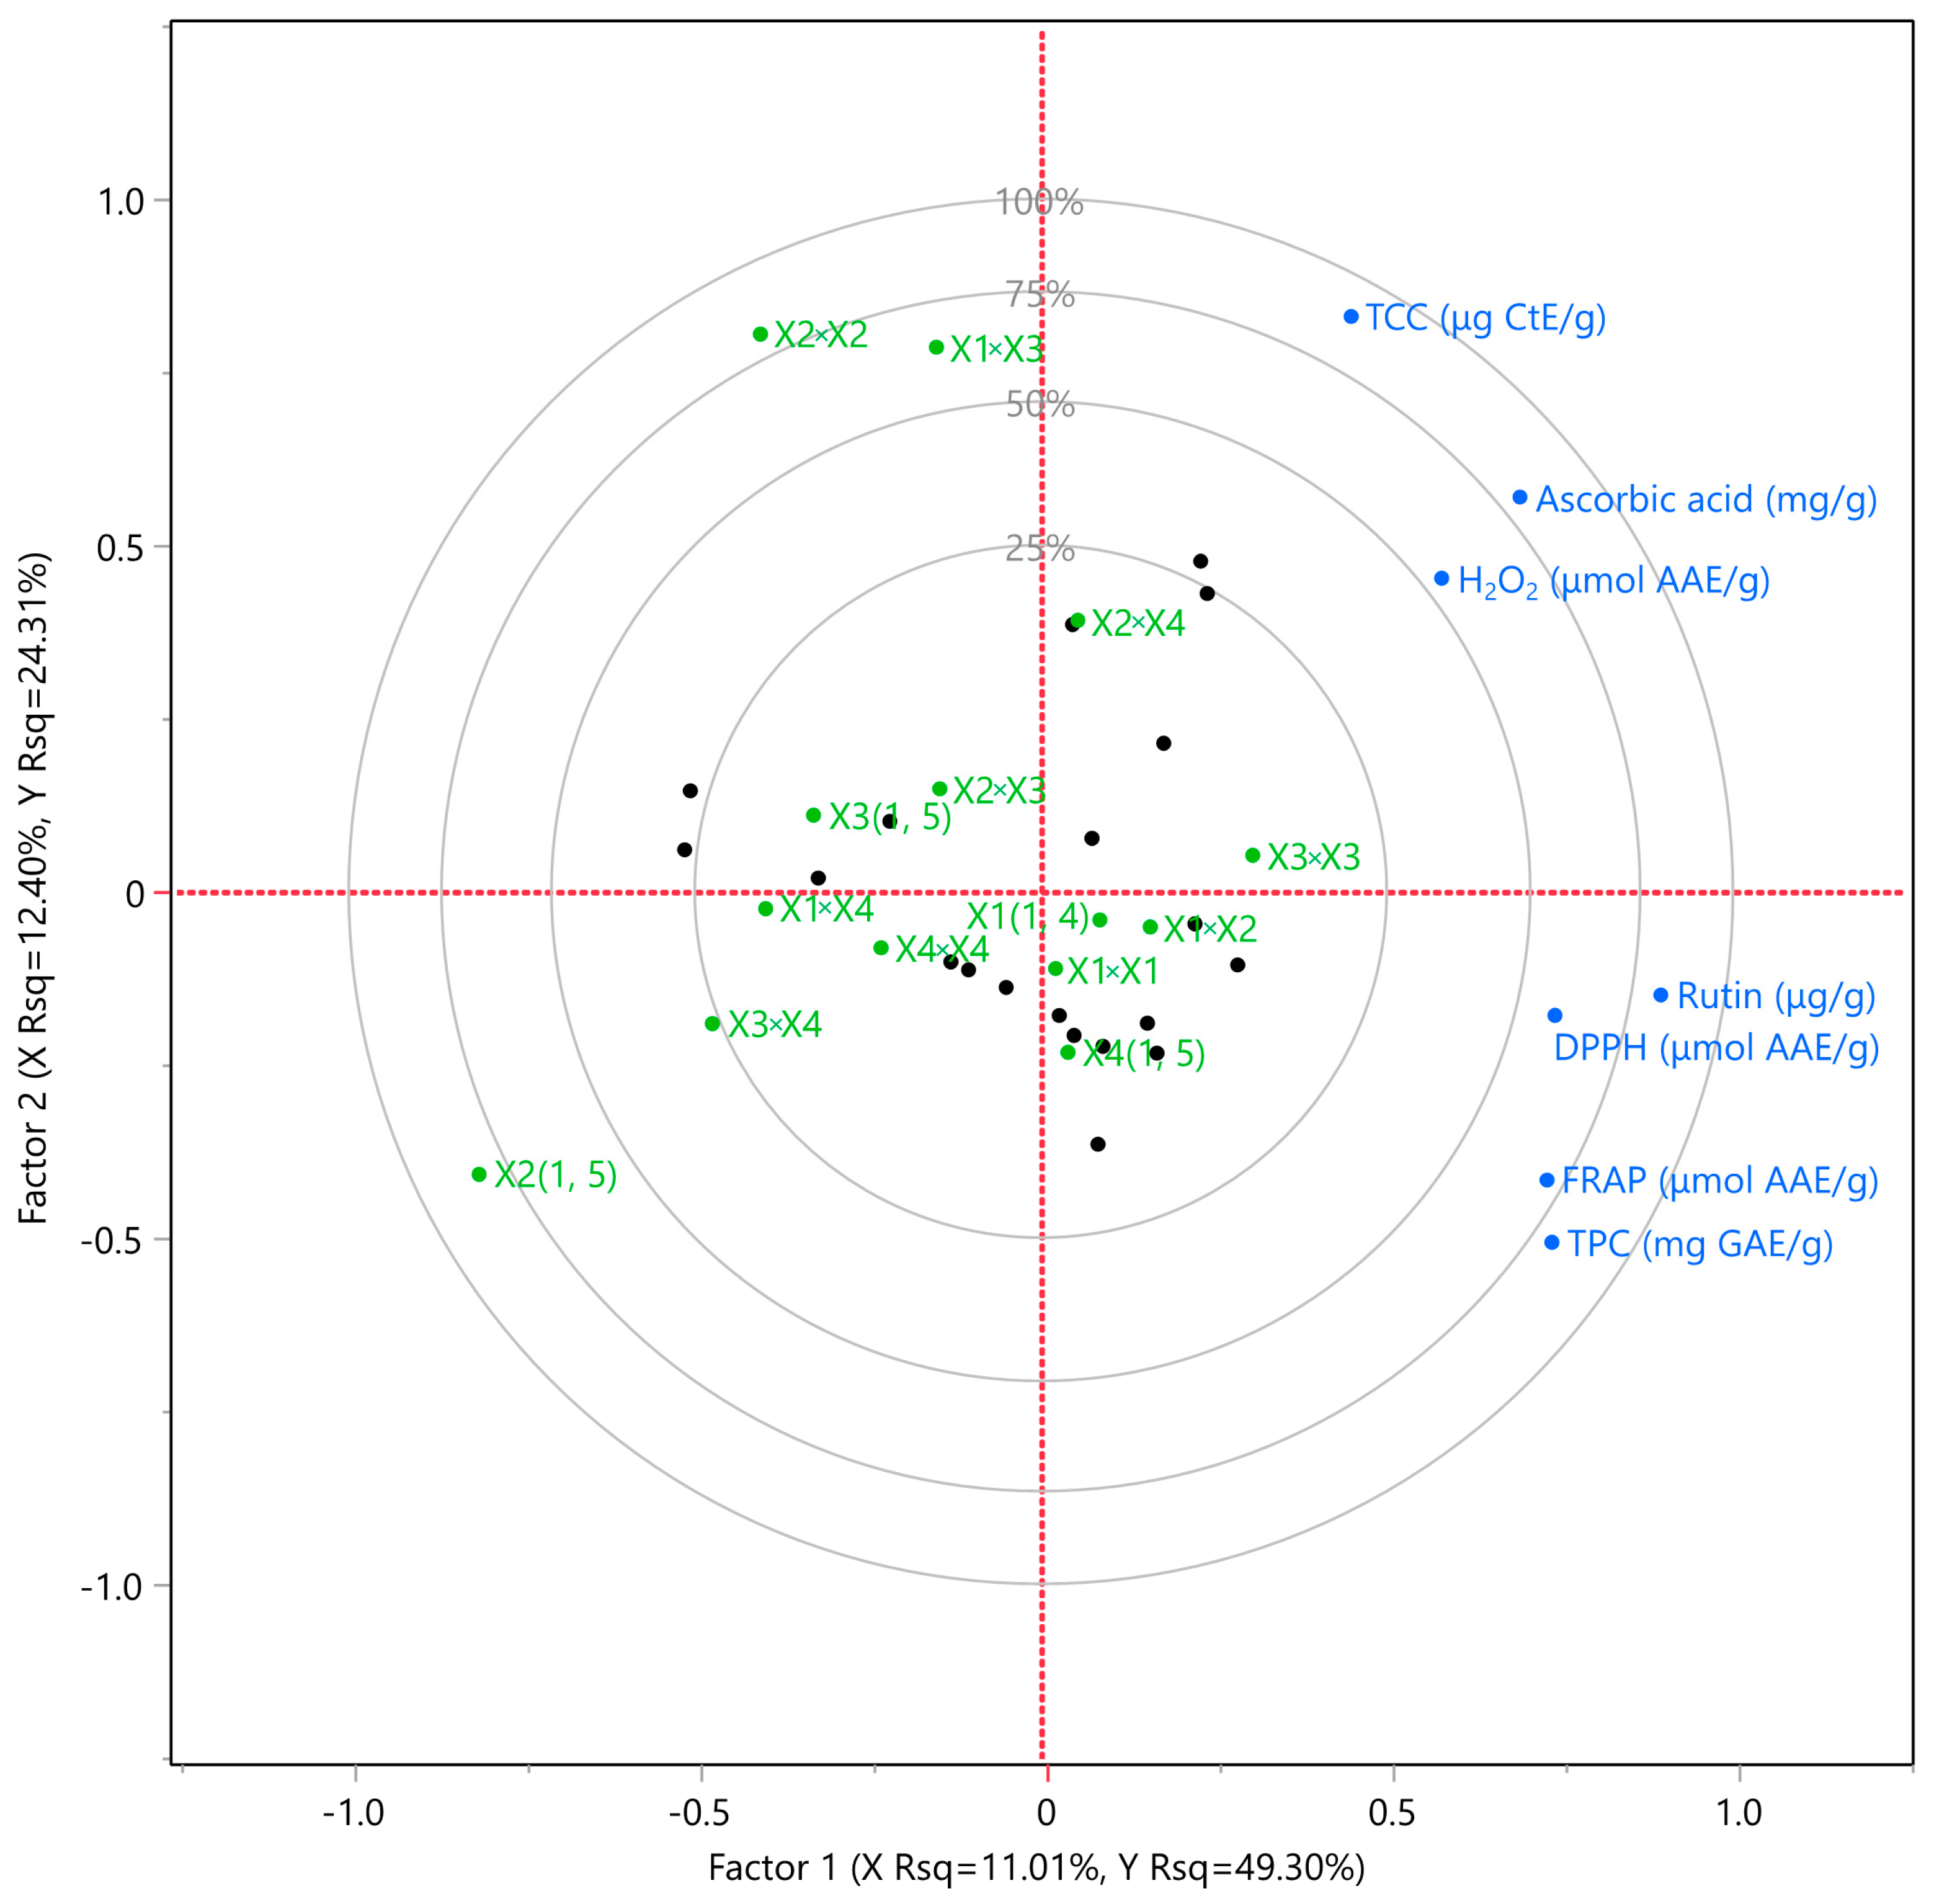
3.7. Principal Component Analysis (PCA) and Multivariate Correlation Analysis (MCA)

Figure 4 and Figure 5 provide summary indicators reflecting the correlation among the various examined responses. The closer the correlation value is to 1, the stronger the relationship among the measured variables. In all cases, all variables, except for the correlation between total polyphenols and total carotenoids, exhibited positive correlations. Most of the correlations were 0.6 and above, while in some cases, the correlation among variables was smaller or even negative [14]. A particularly noteworthy discovery is the correlation found between ascorbic acid content and TCC, indicating a strong association between these two. Furthermore, a definitive relationship was observed between TPC and antioxidant activity, as measured by the FRAP method. Rutin also displayed positive correlations with all other compounds, with correlation values not falling below 0.4. Lastly, it is evident that antioxidant activity is highly correlated with rutin, total carotenoids, and the FRAP method.

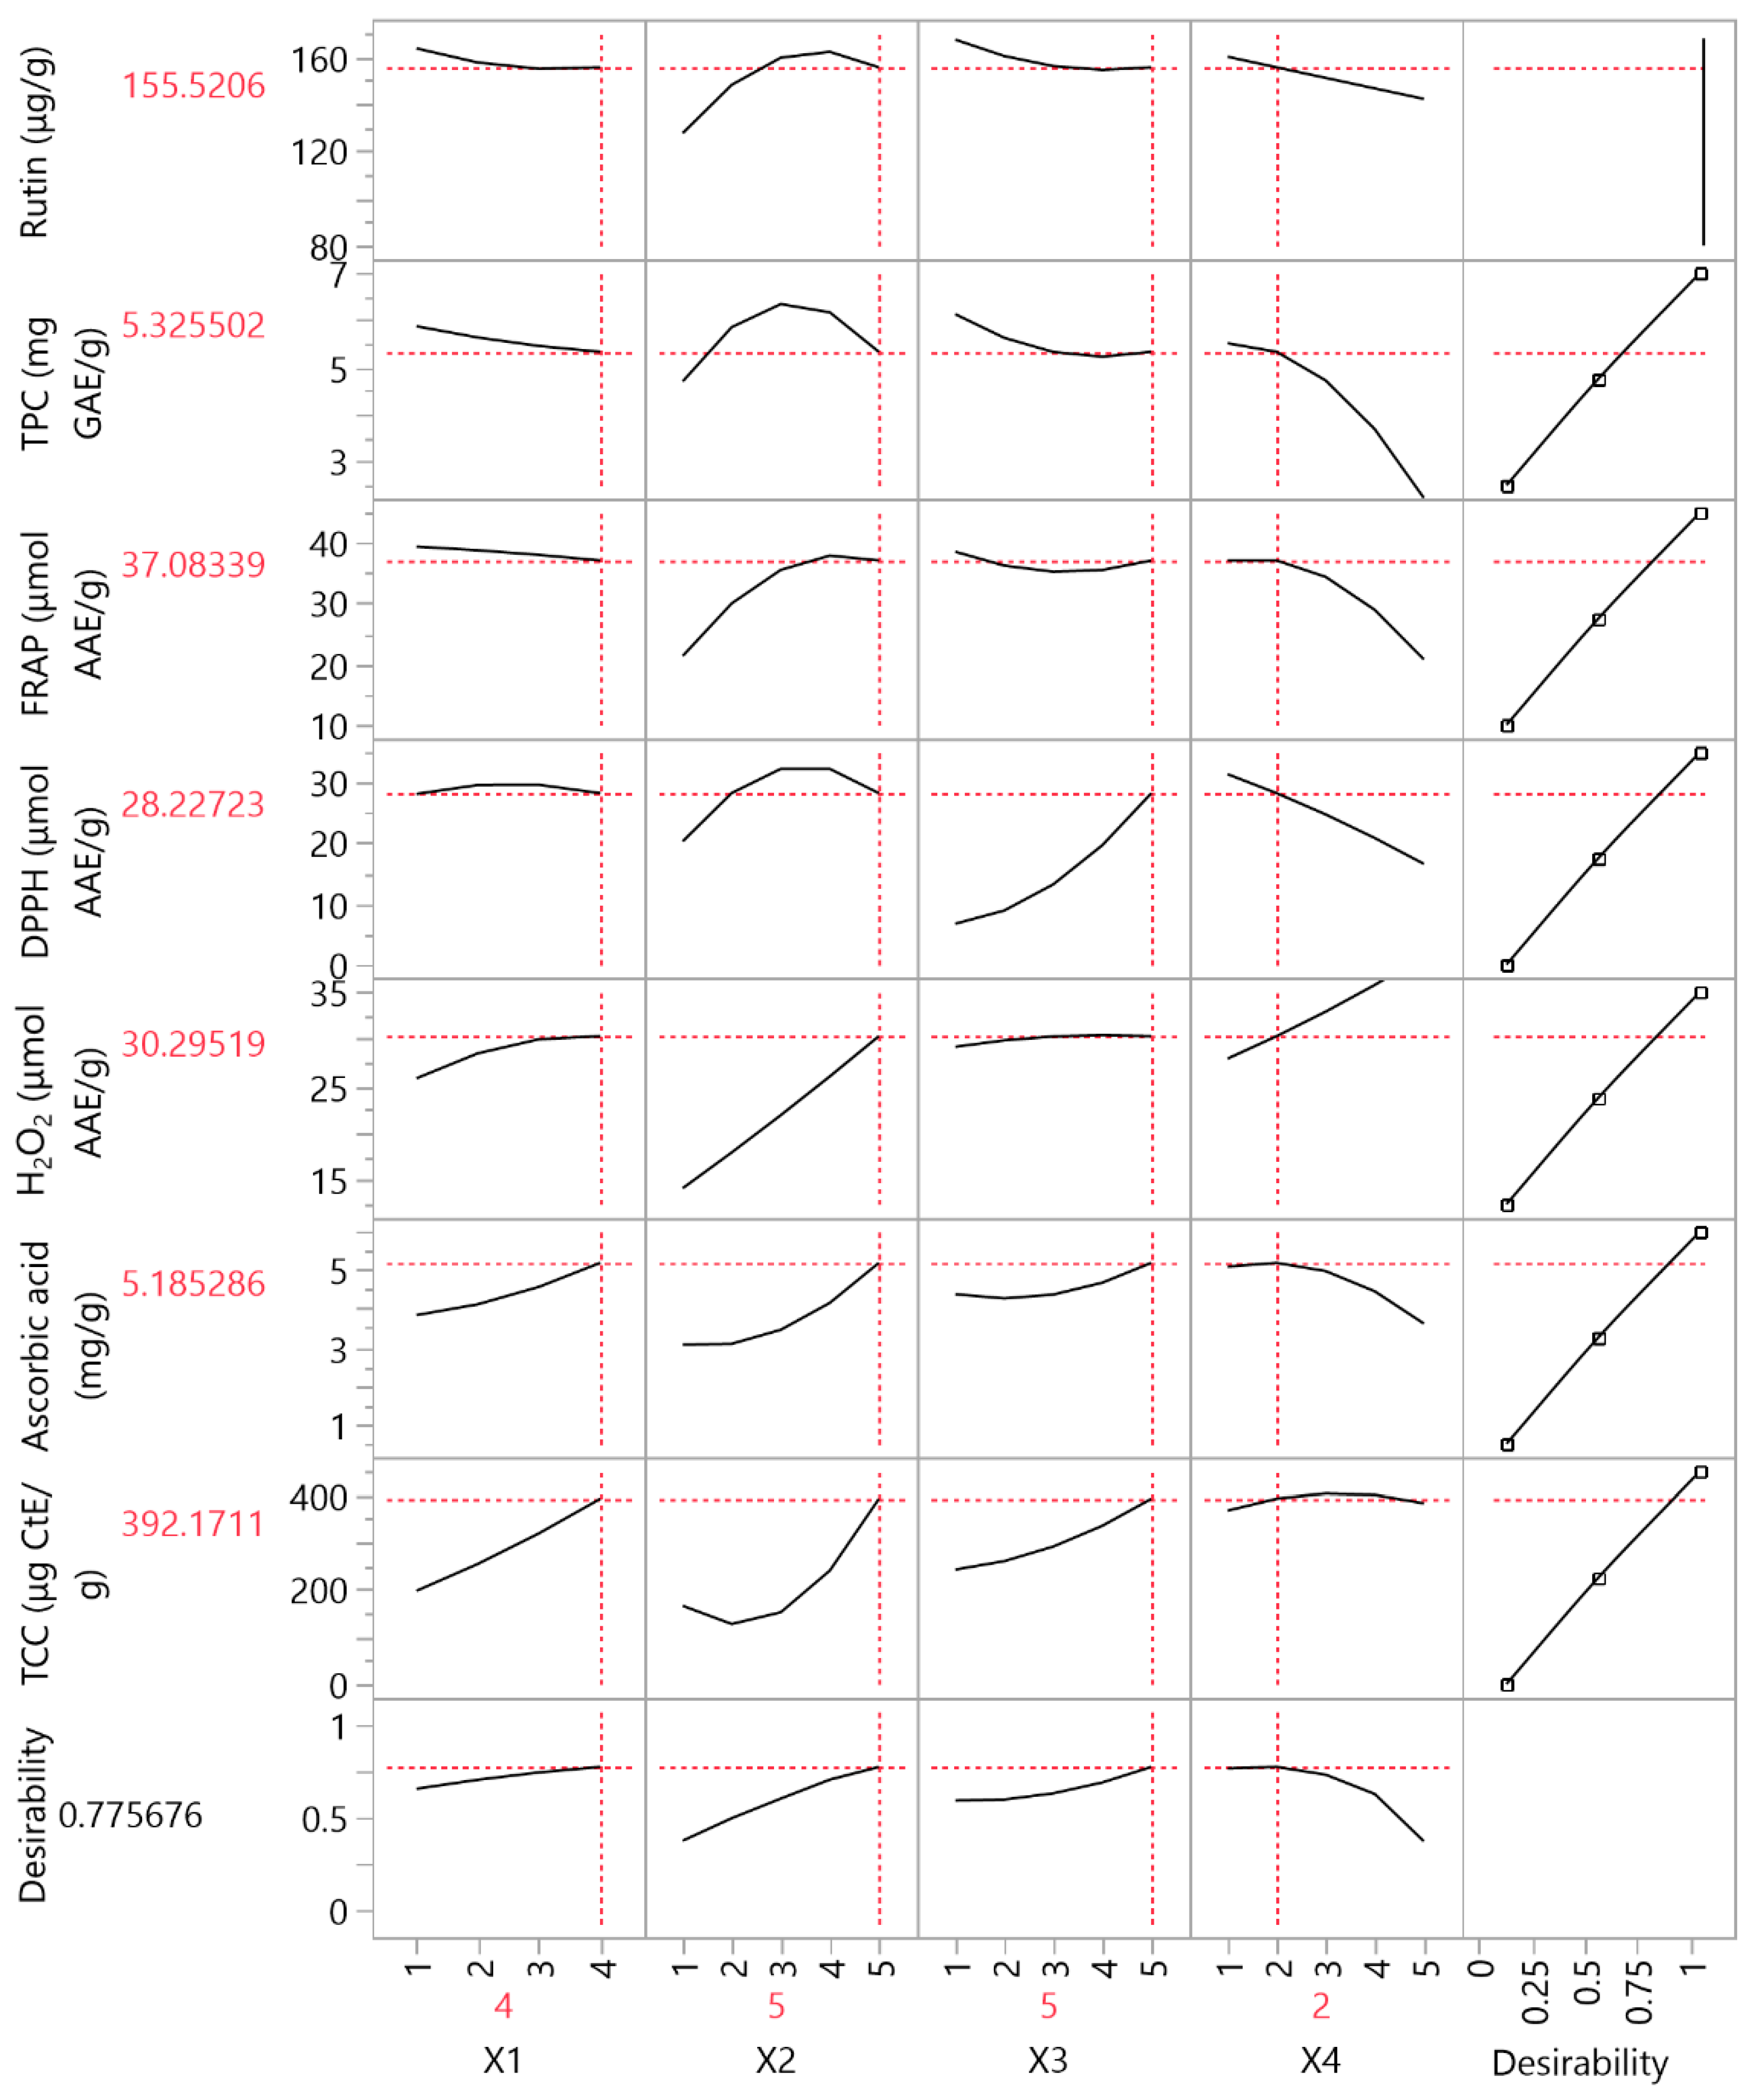
3.8. Partial Least Squares (PLS) Analysis

To comprehensively evaluate all parameters (X1, X2, X3, X4) and determine the optimal extraction mode, partial least squares (PLS) analysis was employed. As depicted in Figure 6 and Figure 7, the parameter combination X1:4, X2:5, X3:5, and X4:2 emerged as the most suitable one. In particular, the PEF + US + ST combination was identified as the optimal extraction mode, providing the highest extraction quantities of bioactive compounds. This finding aligns with the fact that the application of additional pretreatment methods can promote the disruption of plant cell structures and facilitate the release of intracellular compounds, including polyphenols and carotenoids. Notably, the use of ethanol and an extended extraction time (150 min) were deemed essential components for achieving optimal results. The achievement of a higher yield when ethanol is used in the extraction process is consistent with previous research that highlights the solubilizing effect of ethanol on hydrophobic bioactive compounds. The ability of ethanol to interact with non-polar compounds aids in extracting a wide range of polyphenols, carotenoids, and other antioxidant compounds from plant matrices [26,27]. Additionally, a temperature of 35 °C was found to play a critical role in facilitating the optimal extraction of bioactive compounds. The importance of temperature in optimizing the extraction process is in accordance with the well-established principle that temperature influences the kinetics of extraction reactions. Moderate temperatures promote the release of bioactive compounds, while minimizing potential thermal degradation [27]. By adhering to the optimal parameters, the amounts of all bioactive compounds shown in Figure 7 can be effectively achieved. The desirability approaches approximately 0.77, indicating a strong correlation between the highest concentrations attainable and those derived from the system specified as X1:4, X2:5, X3:5, and X4:2. Moreover, upon comparing the values obtained from the PLS model with those resulting from experimental analysis, a remarkable correlation coefficient of 0.999 was observed, signifying a high degree of agreement. The p-value being <0.0001 further supports the reliability and accuracy of the PLS model. The optimum results can be seen in Table 6 and Table 7. When ideal conditions are followed, as per the PLS model, protocatechuic acid was not detected in the sample, in contrast to other polyphenolic compounds that were detected in significant quantities. Overall, PLS analysis offers a systematic approach to optimize the extraction of bioactive compounds from persimmon peels. Various factors have been thoroughly investigated and used in a predictive model that can pave the way for future investigations in maximizing the utilization of persimmon waste biomass for the production of antioxidant-rich extracts.

4. Conclusions

In this study, the extraction of bioactive compounds from Japanese persimmon peel waste, while focusing on sustainable and efficient methodologies, was systematically explored. According to the results, it was showcased that these fruit peel by-products are a good source of valuable bioactive compounds. Among the techniques tested, the combination of PEF, US, and ST, with a 10-min hydration process followed by 150 min of extraction at 35 °C, proved to be the most efficient approach.
Our research highlights the feasibility of transforming persimmon peel waste into a valuable resource, which can be used to obtain bioactive compounds that have potential applications in various industries, including as functional foods, pharmaceuticals, and nutraceuticals. The incorporation of green extraction methods like PEF underscores the ongoing shift toward more sustainable and environmentally friendly practices. While this study provides valuable insights into the extraction process, further exploration is needed to maximize the utilization of persimmon peel extracts. Future research topics could include exploring novel product development, establishing formulation strategies, and identifying target markets that align with the extracted bioactive compounds. By capitalizing on these findings, industries can introduce new products that promote health and contribute to the principles of the circular economy. In conclusion, our study emphasizes the significance of efficiently extracting bioactive compounds from fruit peel waste, with a specific focus on persimmon peels. By optimizing the extraction techniques and engaging in innovative research directions, the potential of these natural resources can be harnessed, fostering sustainable practices and creating products that address the changing needs of consumer demands and health-conscious trends.

Supplementary Materials

The following supporting information can be downloaded at: https://www.mdpi.com/article/10.3390/biomass3040025/s1. Figures S1–S7 comprise plots that illustrate the comparison between the actual response and the predicted response for each parameter under examination, accompanied by the desirability functions. Figures S8–S12 present three-dimensional response plots for the remaining responses.

Author Contributions

Conceptualization, T.C., V.A. and S.I.L.; methodology, T.C. and V.A.; software, V.A.; validation, V.A.; formal analysis, T.C. and V.A.; investigation, K.K., V.A., T.C., D.P. and E.B.; resources, S.I.L.; data curation, V.A.; writing—original draft preparation, K.K.; writing—review and editing, K.K., V.A., T.C., D.P., E.B. and S.I.L.; visualization, V.A.; supervision, S.I.L.; project administration, V.A. and T.C.; funding acquisition, S.I.L. All authors have read and agreed to the published version of the manuscript.

Funding

This research was funded by the Special Account for Research Grants of the University of Thessaly under the project title “Research for the optimization of methods for the extraction of bioactive compounds from plant material” (project code: 7346).

Institutional Review Board Statement

Not applicable.

Informed Consent Statement

Not applicable.

Data Availability Statement

All related data and methods are presented in this paper. Additional inquiries should be addressed to the corresponding author.

Conflicts of Interest

The authors declare no conflict of interest.

References

  1. Rauf, A.; Uddin, G.; Patel, S.; Khan, A.; Halim, S.A.; Bawazeer, S.; Ahmad, K.; Muhammad, N.; Mubarak, M.S. Diospyros, an under-utilized, multi-purpose plant genus: A review. Biomed. Pharmacother. 2017, 91, 714–730. [Google Scholar] [CrossRef] [PubMed]
  2. Kosseva, M.R.; Joshi, V.K.; Panesar, P.S. Science and Technology of Fruit Wine Production; Elsevier: Amsterdam, The Netherlands, 2017; ISBN 9780128008508. [Google Scholar]
  3. Bibi, N.; Khattak, A.B.; Mehmood, Z. Quality improvement and shelf life extension of persimmon fruit (Diospyros kaki). J. Food Eng. 2007, 79, 1359–1363. [Google Scholar] [CrossRef]
  4. Zheng, Q.L.; Nakatsuka, A.; Itamura, H. Involvement of negative feedback regulation in wound-induced ethylene synthesis in “Saijo” persimmon. J. Agric. Food Chem. 2006, 54, 5875–5879. [Google Scholar] [CrossRef] [PubMed]
  5. Intrigliolo, D.S.; Visconti, F.; Bonet, L.; Parra, M.; Besada, C.; Abrisqueta, I.; Rubio, J.S.; de Paz, J.M. Persimmon (Diospyros kaki) Trees Responses to Restrictions in Water Amount and Quality. In Water Scarcity and Sustainable Agriculture in Semiarid Environment; Elsevier: Amsterdam, The Netherlands, 2018; pp. 149–177. ISBN 9780128131640. [Google Scholar]
  6. Rashwan, M.R.; Khalifa, A.H.; Abo Zeiad, F.K.; Mohamed, M.I. Nutrient and Phytochemical Compounds of Persimmon and Husk Tomato. Assiut J. Agric. Sci. 2017, 48, 102–112. [Google Scholar] [CrossRef]
  7. Dommisch, H.; Kuzmanova, D.; Jönsson, D.; Grant, M.; Chapple, I. Effect of micronutrient malnutrition on periodontal disease and periodontal therapy. Periodontol. 2000 2018, 78, 129–153. [Google Scholar] [CrossRef] [PubMed]
  8. Shikano, H.; Miyama, Y.; Ikeda, R.; Takeshi, H.; Suda, J.; Yoshinaga, K.; Taira, S. Localization analysis of multiple vitamins in dried persimmon (Diospyros kaki) using matrix-assisted laser desorption/ionization mass spectrometry imaging. J. Oleo Sci. 2020, 69, 959–964. [Google Scholar] [CrossRef] [PubMed]
  9. Celik, A.; Ercisli, S. Persimmon cv. Hachiya (Diospyros kaki Thunb.) fruit: Some physical, chemical and nutritional properties. Int. J. Food Sci. Nutr. 2008, 59, 599–606. [Google Scholar] [CrossRef]
  10. Direito, R.; Rocha, J.; Sepodes, B.; Eduardo-Figueira, M. From Diospyros kaki L. (Persimmon) Phytochemical Profile and Health Impact to New Product Perspectives and Waste Valorization. Nutrients 2021, 13, 3283. [Google Scholar] [CrossRef]
  11. Chen, Y.; Zhang, X.; Luo, Z.; Sun, J.; Li, L.; Yin, X.; Li, J.; Xu, Y. Effects of inside-out heat-shock via microwave on the fruit softening and quality of persimmon during postharvest storage. Food Chem. 2021, 349, 129161. [Google Scholar] [CrossRef]
  12. Yokozawa, T.; Kim, Y.A.; Kim, H.Y.; Lee, Y.A.; Nonaka, G. ichiro Protective effect of persimmon peel polyphenol against high glucose-induced oxidative stress in LLC-PK1 cells. Food Chem. Toxicol. 2007, 45, 1979–1987. [Google Scholar] [CrossRef]
  13. Dong, Y.; Yu, X.; Ye, X.; Gao, Z.; Wang, S.; Qu, S. Current status and perspective of persimmon research in China. Technol. Hortic. 2022, 2, 4. [Google Scholar] [CrossRef]
  14. Athanasiadis, V.; Chatzimitakos, T.; Kotsou, K.; Palaiogiannis, D.; Bozinou, E.; Lalas, S.I. Optimization of the Extraction Parameters for the Isolation of Bioactive Compounds from Orange Peel Waste. Sustainability 2022, 14, 13926. [Google Scholar] [CrossRef]
  15. Butt, M.S.; Sultan, M.T.; Aziz, M.; Naz, A.; Ahmed, W.; Kumar, N.; Imran, M. Persimmon (Diospyros kaki) fruit: Hidden phytochemicals and health claims. EXCLI J. 2015, 14, 542–561. [Google Scholar] [CrossRef] [PubMed]
  16. Bozkir, H.; Rayman Ergün, A.; Serdar, E.; Metin, G.; Baysal, T. Influence of ultrasound and osmotic dehydration pretreatments on drying and quality properties of persimmon fruit. Ultrason. Sonochem. 2019, 54, 135–141. [Google Scholar] [CrossRef] [PubMed]
  17. Dash, K.K.; Bhagya Raj, G.V.S. Ultrasound assisted microwave vacuum drying of persimmon fruit: Modeling by artificial neural network and optimization by genetic algorithm. J. Food Process Eng. 2023, 46, e14315. [Google Scholar] [CrossRef]
  18. Yoo, D.I.; Shin, Y. Application of persimmon (Diospyros kaki L.) peel extract in indigo dyeing as an eco-friendly alternative reductant. Fash. Text. 2020, 7, 28. [Google Scholar] [CrossRef]
  19. Picot-Allain, C.; Mahomoodally, M.F.; Ak, G.; Zengin, G. Conventional versus green extraction techniques—A comparative perspective. Curr. Opin. Food Sci. 2021, 40, 144–156. [Google Scholar] [CrossRef]
  20. Koina, I.M.; Sarigiannis, Y.; Hapeshi, E. Green Extraction Techniques for the Determination of Active Ingredients in Tea: Current State, Challenges, and Future Perspectives. Separations 2023, 10, 121. [Google Scholar] [CrossRef]
  21. Pappas, V.M.; Lakka, A.; Palaiogiannis, D.; Bozinou, E.; Ntourtoglou, G.; Batra, G.; Athanasiadis, V.; Makris, D.P.; Dourtoglou, V.G.; Lalas, S.I. Use of Pulsed Electric Field as a Low-Temperature and High-Performance “Green” Extraction Technique for the Recovery of High Added Value Compounds from Olive Leaves. Beverages 2021, 7, 45. [Google Scholar] [CrossRef]
  22. Pappas, V.M.; Lakka, A.; Palaiogiannis, D.; Athanasiadis, V.; Bozinou, E.; Ntourtoglou, G.; Makris, D.P.; Dourtoglou, V.G.; Lalas, S.I. Optimization of Pulsed Electric Field as Standalone “Green” Extraction Procedure for the Recovery of High Value-Added Compounds from Fresh Olive Leaves. Antioxidants 2021, 10, 1554. [Google Scholar] [CrossRef]
  23. Athanasiadis, V.; Pappas, V.M.; Palaiogiannis, D.; Chatzimitakos, T.; Bozinou, E.; Makris, D.P.; Lalas, S.I. Pulsed Electric Field-Based Extraction of Total Polyphenols from Sideritis raiseri Using Hydroethanolic Mixtures. Oxygen 2022, 2, 91–98. [Google Scholar] [CrossRef]
  24. Chatzimitakos, T.; Athanasiadis, V.; Kotsou, K.; Bozinou, E.; Lalas, S.I. Response Surface Optimization for the Enhancement of the Extraction of Bioactive Compounds from Citrus limon Peel. Antioxidants 2023, 12, 1605. [Google Scholar] [CrossRef] [PubMed]
  25. Kotsou, K.; Stoikou, M.; Athanasiadis, V.; Chatzimitakos, T.; Mantiniotou, M.; Sfougaris, A.I.; Lalas, S.I. Enhancing Antioxidant Properties of Prunus spinosa Fruit Extracts via Extraction Optimization. Horticulturae 2023, 9, 942. [Google Scholar] [CrossRef]
  26. Athanasiadis, V.; Chatzimitakos, T.; Bozinou, E.; Kotsou, K.; Palaiogiannis, D.; Lalas, S.I. Optimization of Extraction Parameters for Enhanced Recovery of Bioactive Compounds from Quince Peels Using Response Surface Methodology. Foods 2023, 12, 2099. [Google Scholar] [CrossRef] [PubMed]
  27. Lakka, A.; Grigorakis, S.; Kaltsa, O.; Karageorgou, I.; Batra, G.; Bozinou, E.; Lalas, S.; Makris, D.P. The effect of ultrasonication pretreatment on the production of polyphenol-enriched extracts from Moringa oleifera L. (drumstick tree) using a novel bio-based deep eutectic solvent. Appl. Sci. 2020, 10, 220. [Google Scholar] [CrossRef]
  28. Chatzimitakos, T.; Athanasiadis, V.; Kotsou, K.; Palaiogiannis, D.; Bozinou, E.; Lalas, S.I. Optimized Isolation Procedure for the Extraction of Bioactive Compounds from Spent Coffee Grounds. Appl. Sci. 2023, 13, 2819. [Google Scholar] [CrossRef]
  29. Al-Amiery, A.A.; Al-Majedy, Y.K.; Kadhum, A.A.H.; Mohamad, A.B. Hydrogen peroxide scavenging activity of novel coumarins synthesized using different approaches. PLoS ONE 2015, 10, e0132175. [Google Scholar] [CrossRef]
  30. Jagota, S.K.; Dani, H.M. A new colorimetric technique for the estimation of vitamin C using Folin phenol reagent. Anal. Biochem. 1982, 127, 178–182. [Google Scholar] [CrossRef]
  31. Hosseininejad, S.; González, C.M.; Hernando, I.; Moraga, G. Valorization of Persimmon Fruit Through the Development of New Food Products. Front. Food Sci. Technol. 2022, 2, 914952. [Google Scholar] [CrossRef]
  32. Athanasiadis, V.; Palaiogiannis, D.; Poulianiti, K.; Bozinou, E.; Lalas, S.I.; Makris, D.P. Extraction of Polyphenolic Antioxidants from Red Grape Pomace and Olive Leaves: Process Optimization Using a Tailor-Made Tertiary Deep Eutectic Solvent. Sustainability 2022, 14, 6864. [Google Scholar] [CrossRef]
  33. Xi, W.; Lu, J.; Qun, J.; Jiao, B. Characterization of phenolic profile and antioxidant capacity of different fruit part from lemon (Citrus limon Burm.) cultivars. J. Food Sci. Technol. 2017, 54, 1108–1118. [Google Scholar] [CrossRef] [PubMed]
  34. Zillich, O.V.; Schweiggert-Weisz, U.; Eisner, P.; Kerscher, M. Polyphenols as Active Ingredients for Cosmetic Products. Int. J. Cosmet. Sci. 2015, 37, 455–464. [Google Scholar] [CrossRef] [PubMed]
  35. Ratz-Yko, A.; Arct, J.; Majewski, S.; Pytkowska, K. Influence of polyphenols on the physiological processes in the skin. Phytother. Res. 2015, 29, 509–517. [Google Scholar] [CrossRef] [PubMed]
  36. Yang, J.; Liu, R.H.; Halim, L. Antioxidant and antiproliferative activities of common edible nut seeds. LWT 2009, 42, 1–8. [Google Scholar] [CrossRef]
  37. Sentandreu, E.; Cerdán-Calero, M.; Halket, J.M.; Navarro, J.L. Rapid screening of low-molecular-weight phenols from persimmon (Diospyros kaki) pulp using liquid chromatography/UV-visible/electrospray mass spectrometry analysis. J. Sci. Food Agric. 2015, 95, 1648–1654. [Google Scholar] [CrossRef] [PubMed]
  38. Tsurunaga, Y.; Takahashi, T.; Nagata, Y. Production of persimmon and mandarin peel pastes and their uses in food. Food Sci. Nutr. 2021, 9, 1712–1719. [Google Scholar] [CrossRef] [PubMed]
  39. Pérez-Burillo, S.; Oliveras, M.J.; Quesada, J.; Rufián-Henares, J.A.; Pastoriza, S. Relationship between composition and bioactivity of persimmon and kiwifruit. Food Res. Int. 2018, 105, 461–472. [Google Scholar] [CrossRef]
  40. Korkmaz, A.; Kolankaya, D. Protective effect of rutin on the ischemia/reperfusion induced damage in rat kidney. J. Surg. Res. 2010, 164, 309–315. [Google Scholar] [CrossRef]
  41. Chen, S.S.; Gong, J.; Liu, F.-T.; Mohammed, U. Naturally occurring polyphenolic antioxidants modulate IgE-mediated mast cell activation. Immunology 2000, 100, 471–480. [Google Scholar] [CrossRef]
  42. Chan, H.J.; Ji, Y.L.; Chul, H.C.; Chang, J.K. Anti-asthmatic action of quercetin and rutin in conscious guinea-pigs challenged with aerosolized ovalbumin. Arch. Pharm. Res. 2007, 30, 1599–1607. [Google Scholar] [CrossRef]
  43. Satari, A.; Ghasemi, S.; Habtemariam, S.; Asgharian, S.; Lorigooini, Z. Rutin: A Flavonoid as an Effective Sensitizer for Anticancer Therapy; Insights into Multifaceted Mechanisms and Applicability for Combination Therapy. Evid. Based Complement. Altern. Med. 2021, 2021, 9913179. [Google Scholar] [CrossRef] [PubMed]
  44. Choudhary, R.; Singh, A.; Upadhyay, A.; Singh, R.; Thangalakshmi, S.; Dar, A.H.; Bajpai, V.K.; Shukla, S. Exotic god fruit, persimmon (Diospyros kaki): Pharmacological importance and human health aspects. eFood 2023, 4, e52. [Google Scholar] [CrossRef]
  45. Leontowicz, H.; Gorinstein, S.; Lojek, A.; Leontowicz, M.; Číž, M.; Soliva-Fortuny, R.; Park, Y.S.; Jung, S.T.; Trakhtenberg, S.; Martin-Belloso, O. Comparative content of some bioactive compounds in apples, peaches and pears and their influence on lipids and antioxidant capacity in rats. J. Nutr. Biochem. 2002, 13, 603–610. [Google Scholar] [CrossRef]
  46. Lee, Y.A.; Cho, E.J.; Yokozawa, T. Protective effect of persimmon (Diospyros kaki) peel proanthocyanidin against oxidative damage under H2O2-induced cellular senescence. Biol. Pharm. Bull. 2008, 31, 1265–1269. [Google Scholar] [CrossRef] [PubMed]
  47. Esteban-Muñoz, A.; Sánchez-Hernández, S.; Samaniego-Sánchez, C.; Giménez-Martínez, R.; Olalla-Herrera, M. Differences in the phenolic profile by uplc coupled to high resolution mass spectrometry and antioxidant capacity of two Diospyros kaki varieties. Antioxidants 2021, 10, 31. [Google Scholar] [CrossRef]
  48. Direito, R.; Reis, C.; Roque, L.; Gonçalves, M.; Sanches-Silva, A.; Gaspar, M.M.; Pinto, R.; Rocha, J.; Sepodes, B.; Rosário Bronze, M.; et al. Phytosomes with Persimmon (Diospyros kaki L.) Extract: Preparation and Preliminary Demonstration of In Vivo Tolerability. Pharmaceutics 2019, 11, 296. [Google Scholar] [CrossRef]
  49. Pu, F.; Ren, X.L.; Zhang, X.P. Phenolic compounds and antioxidant activity in fruits of six Diospyros kaki genotypes. Eur. Food Res. Technol. 2013, 237, 923–932. [Google Scholar] [CrossRef]
  50. Taheri, Y.; Suleria, H.A.R.; Martins, N.; Sytar, O.; Beyatli, A.; Yeskaliyeva, B.; Seitimova, G.; Salehi, B.; Semwal, P.; Painuli, S.; et al. Myricetin bioactive effects: Moving from preclinical evidence to potential clinical applications. BMC Complement. Med. Ther. 2020, 20, 241. [Google Scholar] [CrossRef]
  51. Maulidiani, M.; Abdul-Hamid, N.A.; Abas, F.; Park, Y.S.; Park, Y.K.; Kim, Y.M.; Gorinstein, S. Detection of bioactive compounds in persimmon (Diospyros kaki) using UPLC-ESI-Orbitrap-MS/MS and fluorescence analyses. Microchem. J. 2019, 149, 103978. [Google Scholar] [CrossRef]
  52. Meng, X.; Zhang, A.; Wang, X.; Sun, H. A kaempferol-3-O-β-D-glucoside, intervention effect of astragalin on estradiol metabolism. Steroids 2019, 149, 108413. [Google Scholar] [CrossRef]
  53. Yaqub, S.; Farooq, U.; Shafi, A.; Akram, K.; Murtaza, M.A.; Kausar, T.; Siddique, F. Chemistry and Functionality of Bioactive Compounds Present in Persimmon. J. Chem. 2016, 2016, 3424025. [Google Scholar] [CrossRef]
  54. Grygorieva, O.; Kucharska, A.Z.; Piórecki, N.; Klymenko, S.; Vergun, O.; Brindza, J. Antioxidant activities and phenolic compounds in fruits of various genotypes of American persimmon (Diospyros virginiana L.). Acta Sci. Pol. Technol. Aliment. 2018, 17, 117–124. [Google Scholar] [CrossRef] [PubMed]
  55. Chen, X.N.; Fan, J.F.; Yue, X.; Wu, X.R.; Li, L.T. Radical scavenging activity and phenolic compounds in persimmon (Diospyros kaki L. cv. Mopan). J. Food Sci. 2008, 73, C24–C28. [Google Scholar] [CrossRef] [PubMed]
  56. Zehiroglu, C.; Ozturk Sarikaya, S.B. The importance of antioxidants and place in today’s scientific and technological studies. J. Food Sci. Technol. 2019, 56, 4757–4774. [Google Scholar] [CrossRef] [PubMed]
  57. Carpena, M.; Garcia-Oliveira, P.; Pereira, A.G.; Soria-Lopez, A.; Chamorro, F.; Collazo, N.; Jarboui, A.; Simal-Gandara, J.; Prieto, M.A. Plant Antioxidants from Agricultural Waste: Synergistic Potential with Other Biological Properties and Possible Applications. In Plant Antioxidants and Health; Springer: Cham, Switzerland, 2022; ISBN 9783030781606. [Google Scholar]
  58. De Ancos, B.; Gonzalez, E.; Cano, M.P. Effect of high-pressure treatment on the carotenoid composition and the radical scavenging activity of persimmon fruit purees. J. Agric. Food Chem. 2000, 48, 3542–3548. [Google Scholar] [CrossRef]
  59. Gorinstein, S.; Zachwieja, Z.; Folta, M.; Barton, H.; Piotrowicz, J.; Zemser, M.; Weisz, M.; Trakhtenberg, S.; Màrtín-Belloso, O. Comparative contents of dietary fiber, total phenolics, and minerals in persimmons and apples. J. Agric. Food Chem. 2001, 49, 952–957. [Google Scholar] [CrossRef]
  60. Fukushima, Y.; Taguchi, C.; Kishimoto, Y.; Kondo, K. Japanese carotenoid database with α- and β-carotene, β-cryptoxanthin, lutein, zeaxanthin, lycopene, and fucoxanthin and intake in adult women. Int. J. Vitam. Nutr. Res. 2023, 93, 42–53. [Google Scholar] [CrossRef]
  61. Karaman, S.; Toker, Ö.S.; Yüksel, F.; Çam, M.; Kayacier, A.; Dogan, M. Physicochemical, bioactive, and sensory properties of persimmon-based ice cream: Technique for order preference by similarity to ideal solution to determine optimum concentration. J. Dairy Sci. 2014, 97, 97–110. [Google Scholar] [CrossRef]
  62. Kondo, S.; Yoshikawa, H.; Katayama, R. Antioxidant activity in astringent and non-astringent persimmons. J. Hortic. Sci. Biotechnol. 2004, 79, 390–394. [Google Scholar] [CrossRef]
Figure 1. Exemplary HPLC chromatogram at 320 nm of the persimmon peel waste extract, demonstrating the polyphenolic compounds that were identified. 1: Gallic acid; 2: protocatechuic acid; 3: caffeic acid; 4: p-coumaric acid; 5: ferulic acid; 6: rutin; 7: quercetin 3-β-D-glucoside; 8: kaempferol 3-O-β-rutinoside; 9: kaempferol 3-glycoside; 10: myricetin.
Biomass 03 00025 g001
Figure 2. The optimal extraction of persimmon peel waste extracts, using different extraction methods and hydroethanolic solutions, is depicted in 3D graphs that show the impact of the process variables considered in the response (total polyphenol content—TPC, mg GAE/g). Plot (A) shows the covariation of X1 and X2; plot (B) shows the covariation of X1 and X3; plot (C) shows the covariation of X1 and X4; plot (D) shows the covariation of X2 and X3; plot (E) shows the covariation of X2 and X4; plot (F) shows the covariation of X3 and X4.
Biomass 03 00025 g002
Figure 3. The optimal extraction of persimmon peel waste extracts, using different extraction methods and hydroethanolic solutions, is depicted in 3D graphs that show the impact of the process variables considered in the response (ascorbic acid, mg/g). Plot (A) shows the covariation of X1 and X2; plot (B) shows the covariation of X1 and X3; plot (C) shows the covariation of X1 and X4; plot (D) shows the covariation of X2 and X3; plot (E) shows the covariation of X2 and X4; plot (F) shows the covariation of X3 and X4.
Biomass 03 00025 g003
Figure 4. Principal component analysis (PCA) for the measured variables. The inset table includes the eigenvalues. Asterisks and colored values denote statistically significant values.
Biomass 03 00025 g004
Figure 5. Multivariate correlation analysis of the measured variables.
Biomass 03 00025 g005
Figure 6. Partial least squares (PLS) analysis was used to create a correlation loading plot showing persimmon peel waste extraction using different extraction methods and hydroethanolic solutions.
Biomass 03 00025 g006
Figure 7. Partial least squares (PLS) prediction profiler of each variable and desirability function, with extrapolation control for the optimization of persimmon peel waste extracts using different extraction methods and hydroethanolic solutions.
Biomass 03 00025 g007
Table 1. The actual and coded levels of the independent variables used to optimize the extraction process of bioactive compounds from persimmon peels.
Independent VariablesCode UnitsCoded Variable Level
12345
TechniqueX1STPEF + STUS + STPEF + US + ST
C (%, v/v)X20255075100
t (min)X3306090120150
T (°C)X42035506580
Table 2. Combinations of the four independent variables under consideration (X1: extraction technique, X2: composition of the solvent, X3: extraction time, and X4: extraction temperature) and the dependent variables’ responses.
Design PointIndependent VariablesResponses
X1X2X3X4Rutin
(μg/g)
TPC
(mg GAE/g)
FRAP
(μmol AAE/g)
DPPH
(μmol AAE/g)
H2O2
(μmol AAE/g)
Asc. Acid
(mg/g)
TCC
(μg CtE/g)
1313493.253.2420.165.5815.720.966.41
23213140.176.2835.4419.9517.082.2719.19
32343150.186.3038.6127.5425.662.138.00
42454160.595.7837.1929.9325.392.94127.65
53542150.575.4642.1919.8928.654.89366.24
64145108.532.7318.286.7517.011.5335.67
74231141.955.3524.0714.0815.461.6251.86
81332160.506.4736.8226.9824.852.2419.12
91441163.855.5532.6322.8122.662.1157.45
101514162.245.4026.6821.2926.295.34389.84
111123107.613.9021.2016.7617.701.7057.36
121255158.965.5840.0129.5415.542.593.51
134324157.345.6027.0515.9325.221.3922.32
143425164.244.8628.7422.6433.012.65121.95
152535149.573.4721.2814.4331.023.40326.15
16211191.902.5510.095.7822.340.624.16
172222133.965.7734.5621.4824.082.0513.09
183351154.325.7531.4034.2924.052.1719.51
194412159.056.1934.738.0228.042.9358.50
204553156.134.7230.8426.7933.034.74382.41
TPC: total polyphenol content; FRAP: ferric reducing antioxidant power; DPPH radical scavenging activity; hydrogen peroxide (H2O2) scavenging assay; ascorbic acid content; TCC: total carotenoid content.
Table 3. Combinations of the four independent variables under consideration (X1: extraction technique, X2: composition of the solvent, X3: extraction time, and X4: extraction temperature) for the 20 samples being prepared and the concentration of individual polyphenolic compounds (μg/g dw) quantified in each sample.
Design PointIndependent VariablesResponses (μg/g)
X1X2X3X4GAPCACFApCAFAQGKRKGMYR
1313454.6212.4122.6513.9429.998.3958.6226.3518.04
2321310.28nd22.2212.1450.9711.5874.3137.9917.41
323438.419.0521.7211.8753.3711.8775.6443.9617.39
424548.769.6921.5511.9354.4311.6176.5649.6417.33
535428.858.7821.8611.6453.6511.0470.6940.1617.12
6414515.2710.0022.8813.5540.757.5760.6539.7317.01
74231nd *76.8522.6512.4650.4512.0573.8235.9117.64
81332nd16.2922.4811.7056.2112.7880.1143.4417.46
91441nd12.0521.8011.6055.8112.1678.3141.9917.41
101514ndnd19.8611.4953.719.6271.2941.9416.88
111123nd12.5022.4013.7939.759.9665.6329.7017.65
12125546.4812.9420.8813.1253.8610.8268.5555.5916.86
13432411.7417.4421.9311.8854.9912.1074.8842.5616.93
14342515.3813.0821.3512.1554.8211.7776.7552.1917.45
15253510.2110.6520.1212.0151.999.9768.6450.2016.29
1621118.9911.2521.3312.4137.737.0053.8125.0817.17
17222228.9712.1221.6512.2047.609.9567.8533.8317.19
183351nd15.8722.2511.8354.9911.9777.3541.2517.17
194412nd11.5121.6211.5555.3212.2975.4542.3317.07
2045538.52nd19.5311.5252.228.9167.8940.2116.64
* nd: not detected; GA: gallic acid; PCA: protocatechuic acid; CFA: caffeic acid; pCA: p-coumaric acid; FA: ferulic acid; QG: quercetin 3-β-D-glucoside; KR: kaempferol 3-O-β-rutinoside; KG: kaempferol 3-glycoside; MYR: myricetin.
Table 4. Mathematical models created using RSM were used to optimize the extraction from persimmon peel waste with hydroethanolic solutions using various techniques. The models contained only the significant terms.
ResponsesSecond-Order Polynomial Equations (Models)R2pEquation
RutinY = 55.94 − 19.28X1 + 93.3X2 − 29.42X3 + 6.54X4 + 3.64X12 − 12.27X22 − 0.42X32 + 3.86X42 − 0.77X1X2 + 4.73X1X3 − 4.72X1X4 + 4.16X2X3 − 5.1X2X4 + 0.82X3X40.98470.0013(2)
TPCY = −3.47 + 0.48X1 + 6.38X2 − 2.06X3 + 2.25X4 − 0.04X12 − 0.83X22 − 0.06X32 − 0.01X42 − 0.12X1X2 + 0.35X1X3 − 0.42X1X4 + 0.27X2X3 − 0.46X2X4 + 0.1X3X40.9490.0235(3)
FRAPY = −39.09 + 10.4X1 + 49.14X2 − 18.74X3 + 15.43X4 − 2.53X12 − 5.8X22 − 1.11X32 + 0.98X42 − 0.12X1X2 + 3.49X1X3 − 3.54X1X4 + 2.56X2X3 − 5.46X2X4 + 1.82X3X40.94210.0313(4)
DPPHY = −1.4 − 6.98X1 + 34.34X2 − 18.64X3 + 7.66X4 − 0.67X12 − 5.45X22 + 0.51X32 + 1.21X42 + 0.41X1X2 + 3.93X1X3 − 2.1X1X4 + 2.1X2X3 − 2.21X2X4 − 0.21X3X40.94330.0299(5)
H2O2Y = 36.36 − 5.37X1 − 0.19X2 + 3.02X3 − 9.32X4 − 1.35X12 − 0.07X22 − 0.1X32 − 0.19X42 + 1.92X1X2 + 0.53X1X3 + 1.95X1X4 − 1.55X2X3 + 1.23X2X4 + 0.49X3X40.96820.0078(6)
Ascorbic acidY = −0.83 − 0.03X1 + 3.67X2 − 3.16X3 + 1.46X4 − 0.1X12 − 0.29X22 − 0.04X32 + 0.18X42 − 0.04X1X2 + 0.62X1X3 − 0.47X1X4 + 0.27X2X3 − 0.55X2X4 + 0.17X3X40.93660.0383(7)
TCCY = 34.27 − 5.2X1 + 63.98X2 − 195.12X3 + 85.7X4 − 0.55X12 + 8.74X22 − 10.52X32 + 15.56X42 − 9.32X1X2 + 45.75X1X3 − 37.4X1X4 + 28.45X2X3 − 29.51X2X4 + 8.83X3X40.96440.0102(8)
TPC: total polyphenol content; FRAP: ferric reducing antioxidant power; DPPH radical scavenging activity; hydrogen peroxide (H2O2) scavenging assay; TCC: total carotenoid content.
Table 5. Maximum predicted responses and optimum extraction conditions for the dependent variables when using different extraction methods and hydroethanolic solutions.
ResponsesOptimal Conditions
Maximum Predicted ResponseTechnique
(X1)
C (%, v/v)
(X2)
t (min)
(X3)
T (°C)
(X4)
Rutin (μg/g)172.86 ± 11.93ST (1)50 (3)120 (4)65 (4)
TPC (mg GAE/g)7.17 ± 1.16ST (1)50 (3)90 (3)50 (3)
FRAP (μmol AAE/g)47.75 ± 9.97PEF + ST (2)75 (4)90 (3)35 (2)
DPPH (μmol AAE/g)34.29 ± 9.87US + ST (3)50 (3)150 (5)20 (1)
H2O2 (μmol AAE/g)35.57 ± 4.79US + ST (3)100 (5)120 (4)65 (4)
Ascorbic acid (mg/g)4.93 ± 1.58US + ST (3)100 (5)150 (5)35 (2)
TCC (μg CtE/g)386.47 ± 118.99ST (1)100 (5)60 (2)65 (4)
TPC: total polyphenol content; FRAP: ferric reducing antioxidant power; DPPH radical scavenging activity; hydrogen peroxide (H2O2) scavenging assay; TCC: total carotenoid content.
Table 6. Maximum desirability values for all variables, using the partial least squares (PLS) prediction profiler under the optimal extraction conditions (X1:4, X2:5, X3:5, and X4:2).
VariablesPLS Model ValuesExperimental Values
Rutin (μg/g)155.52156.76 ± 8.15
TPC (mg GAE/g)5.335.74 ± 0.21
FRAP (μmol AAE/g)37.0838.1 ± 0.52
DPPH (μmol AAE/g)28.2329.96 ± 0.22
H2O2 (μmol AAE/g)30.334.17 ± 3.06
Ascorbic acid (mg/g)5.196.22 ± 0.86
TCC (μg CtE/g)392.17399.07 ± 22.75
TPC: total polyphenol content; FRAP: ferric reducing antioxidant power; DPPH radical scavenging activity; hydrogen peroxide (H2O2) scavenging assay; TCC: total carotenoid content.
Table 7. Polyphenolic compound values under optimal extraction conditions.
Polyphenolic Compounds (μg/g)Optimal Extract
Gallic acid8.19 ± 0.46
Protocatechuic acidNot detected
Caffeic acid21.43 ± 1.54
p-Coumaric acid11.82 ± 0.31
Ferulic acid51.25 ± 1.08
Quercetin 3-β-D-glucoside5.62 ± 0.19
Kaempferol 3-O-β-rutinoside68.88 ± 3.24
Kaempferol 3-glycoside36.74 ± 2.2
Myricetin16.96 ± 1.2
Disclaimer/Publisher’s Note: The statements, opinions and data contained in all publications are solely those of the individual author(s) and contributor(s) and not of MDPI and/or the editor(s). MDPI and/or the editor(s) disclaim responsibility for any injury to people or property resulting from any ideas, methods, instructions or products referred to in the content.

