
A Comparison of Forest Biomass and Conventional Harvesting Effects on Estimated Erosion, Best Management Practice Implementation, Ground Cover, and Residual Woody Debris in Virginia
 , ,
, ,
Abstract
:1. Introduction
2. Methods
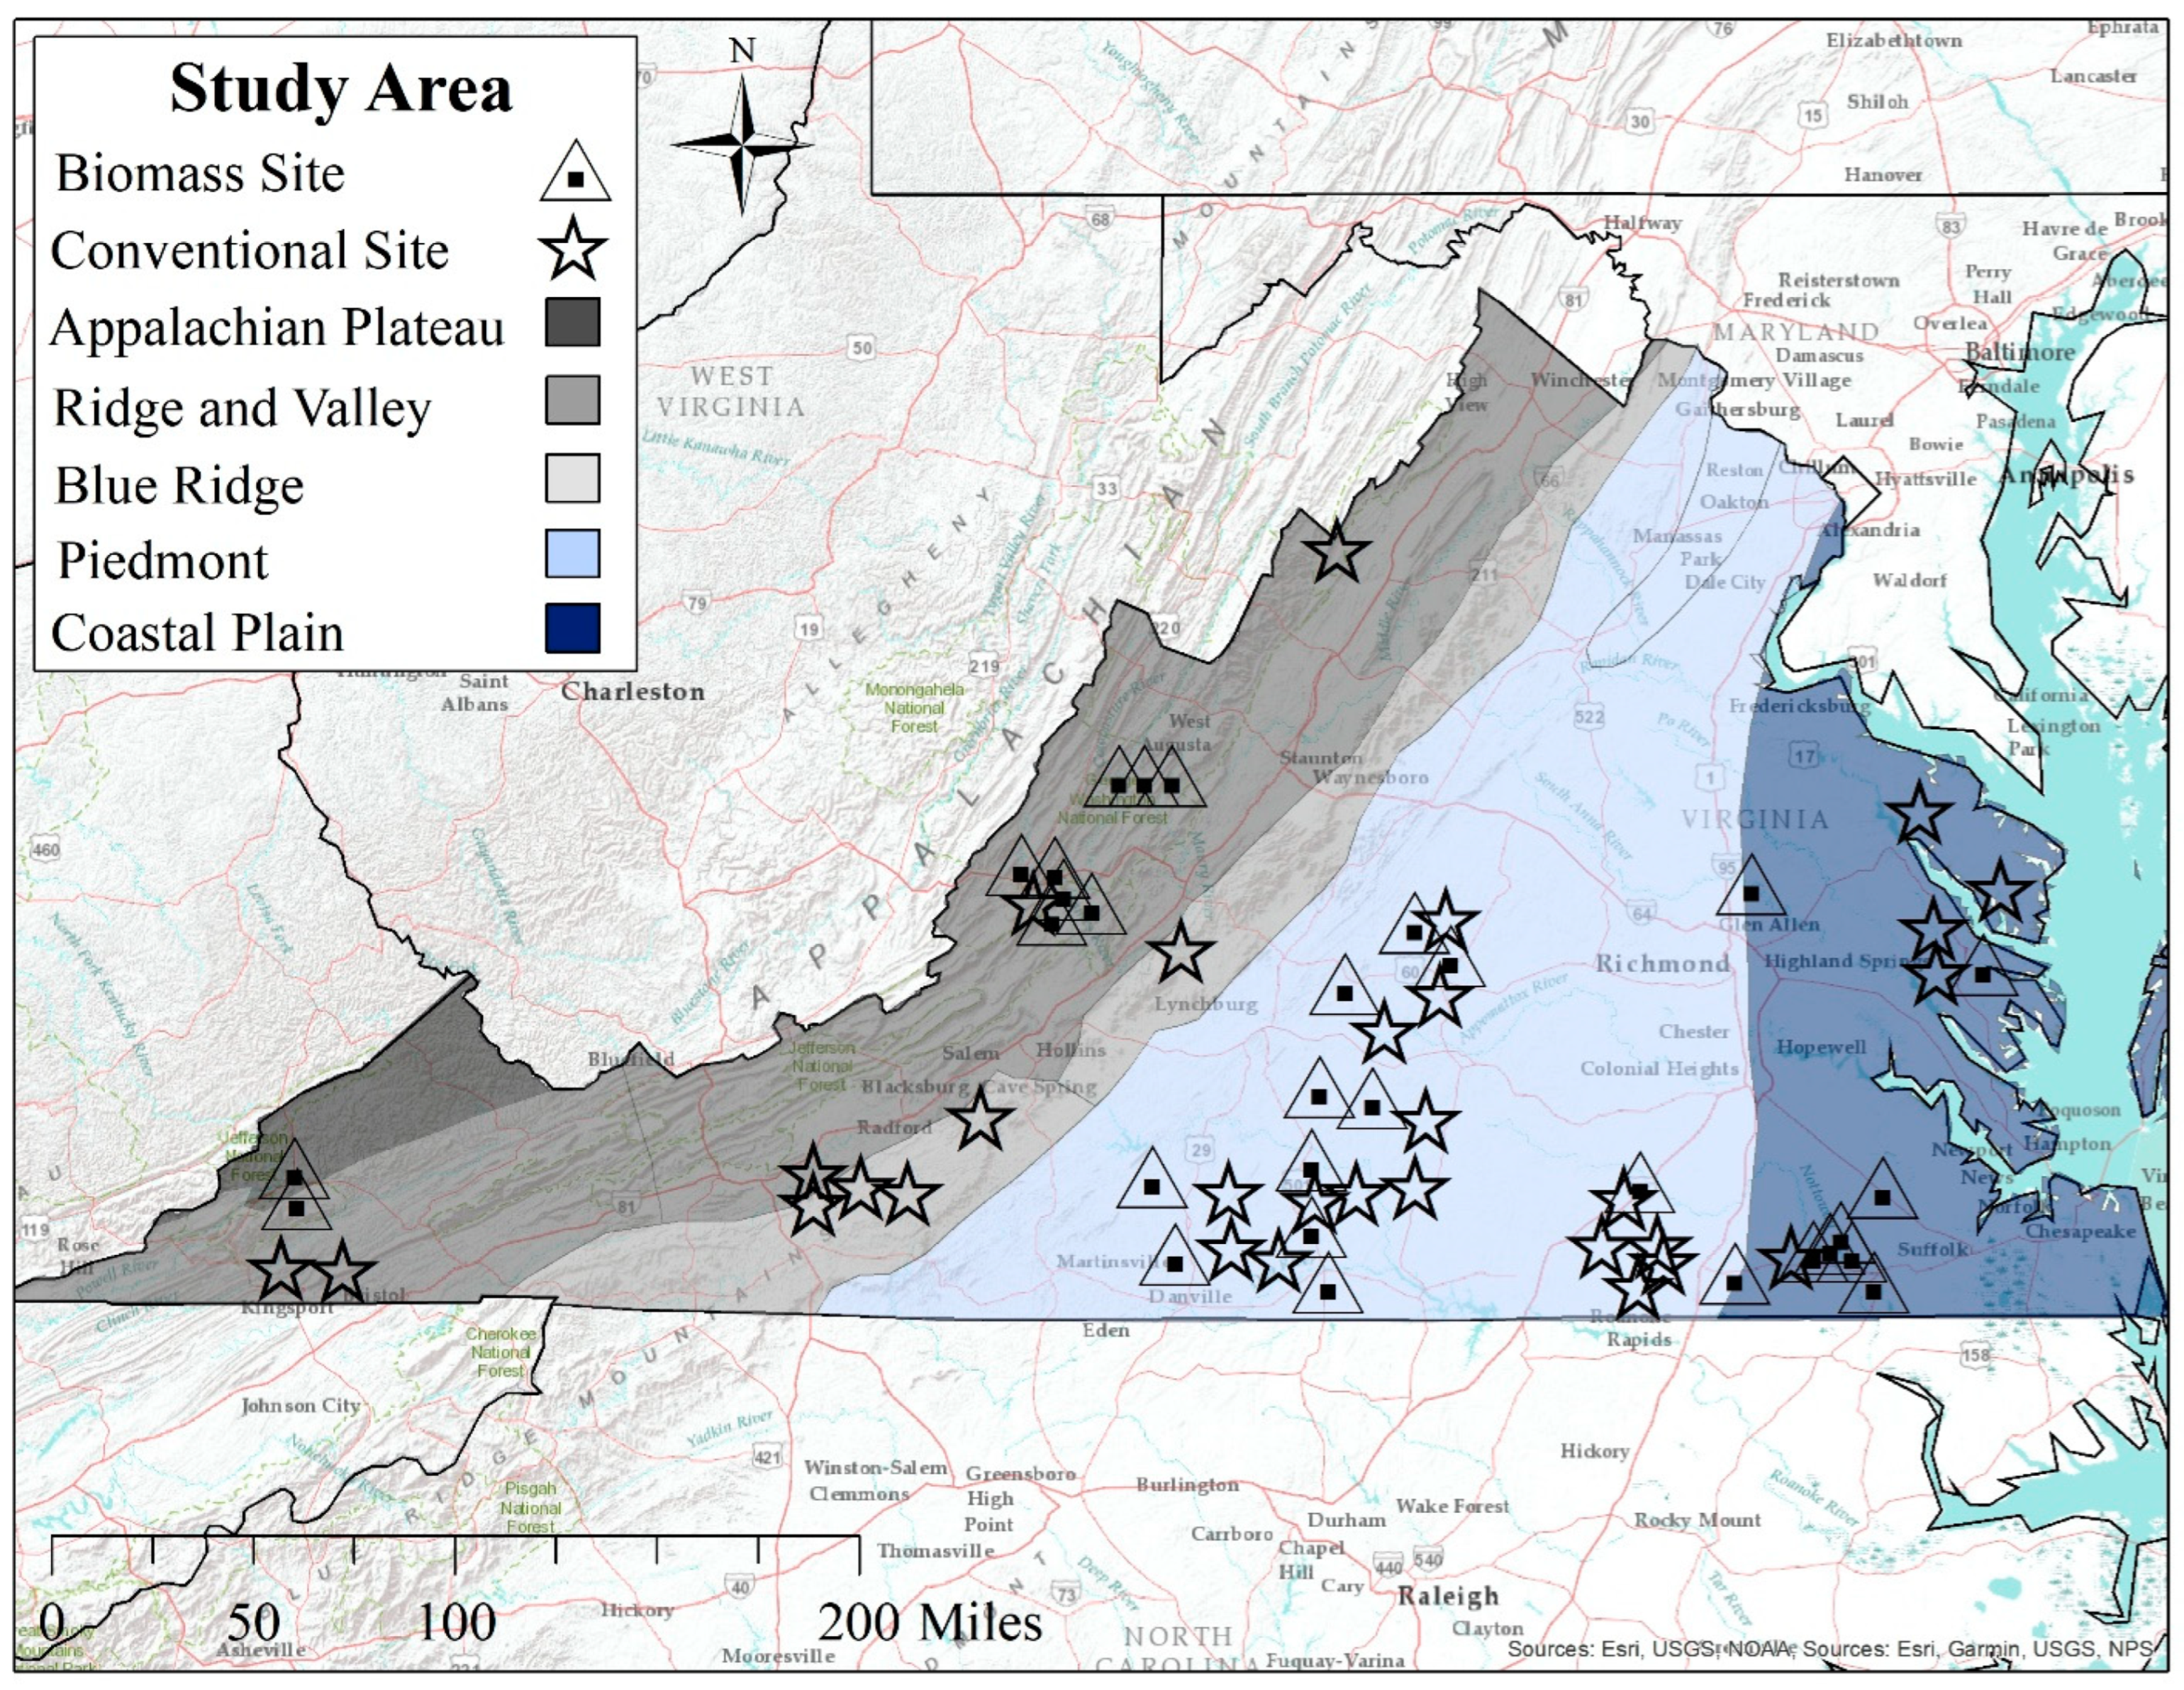
2.1. Site Selection
2.2. Erosion Estimates
2.3. BMP Implementation
2.4. Ground Cover
2.5. Downed Woody Debris
2.6. Data Analysis
3. Results and Discussion
3.1. Estimated Erosion Rates
3.2. Operational Feature Areas
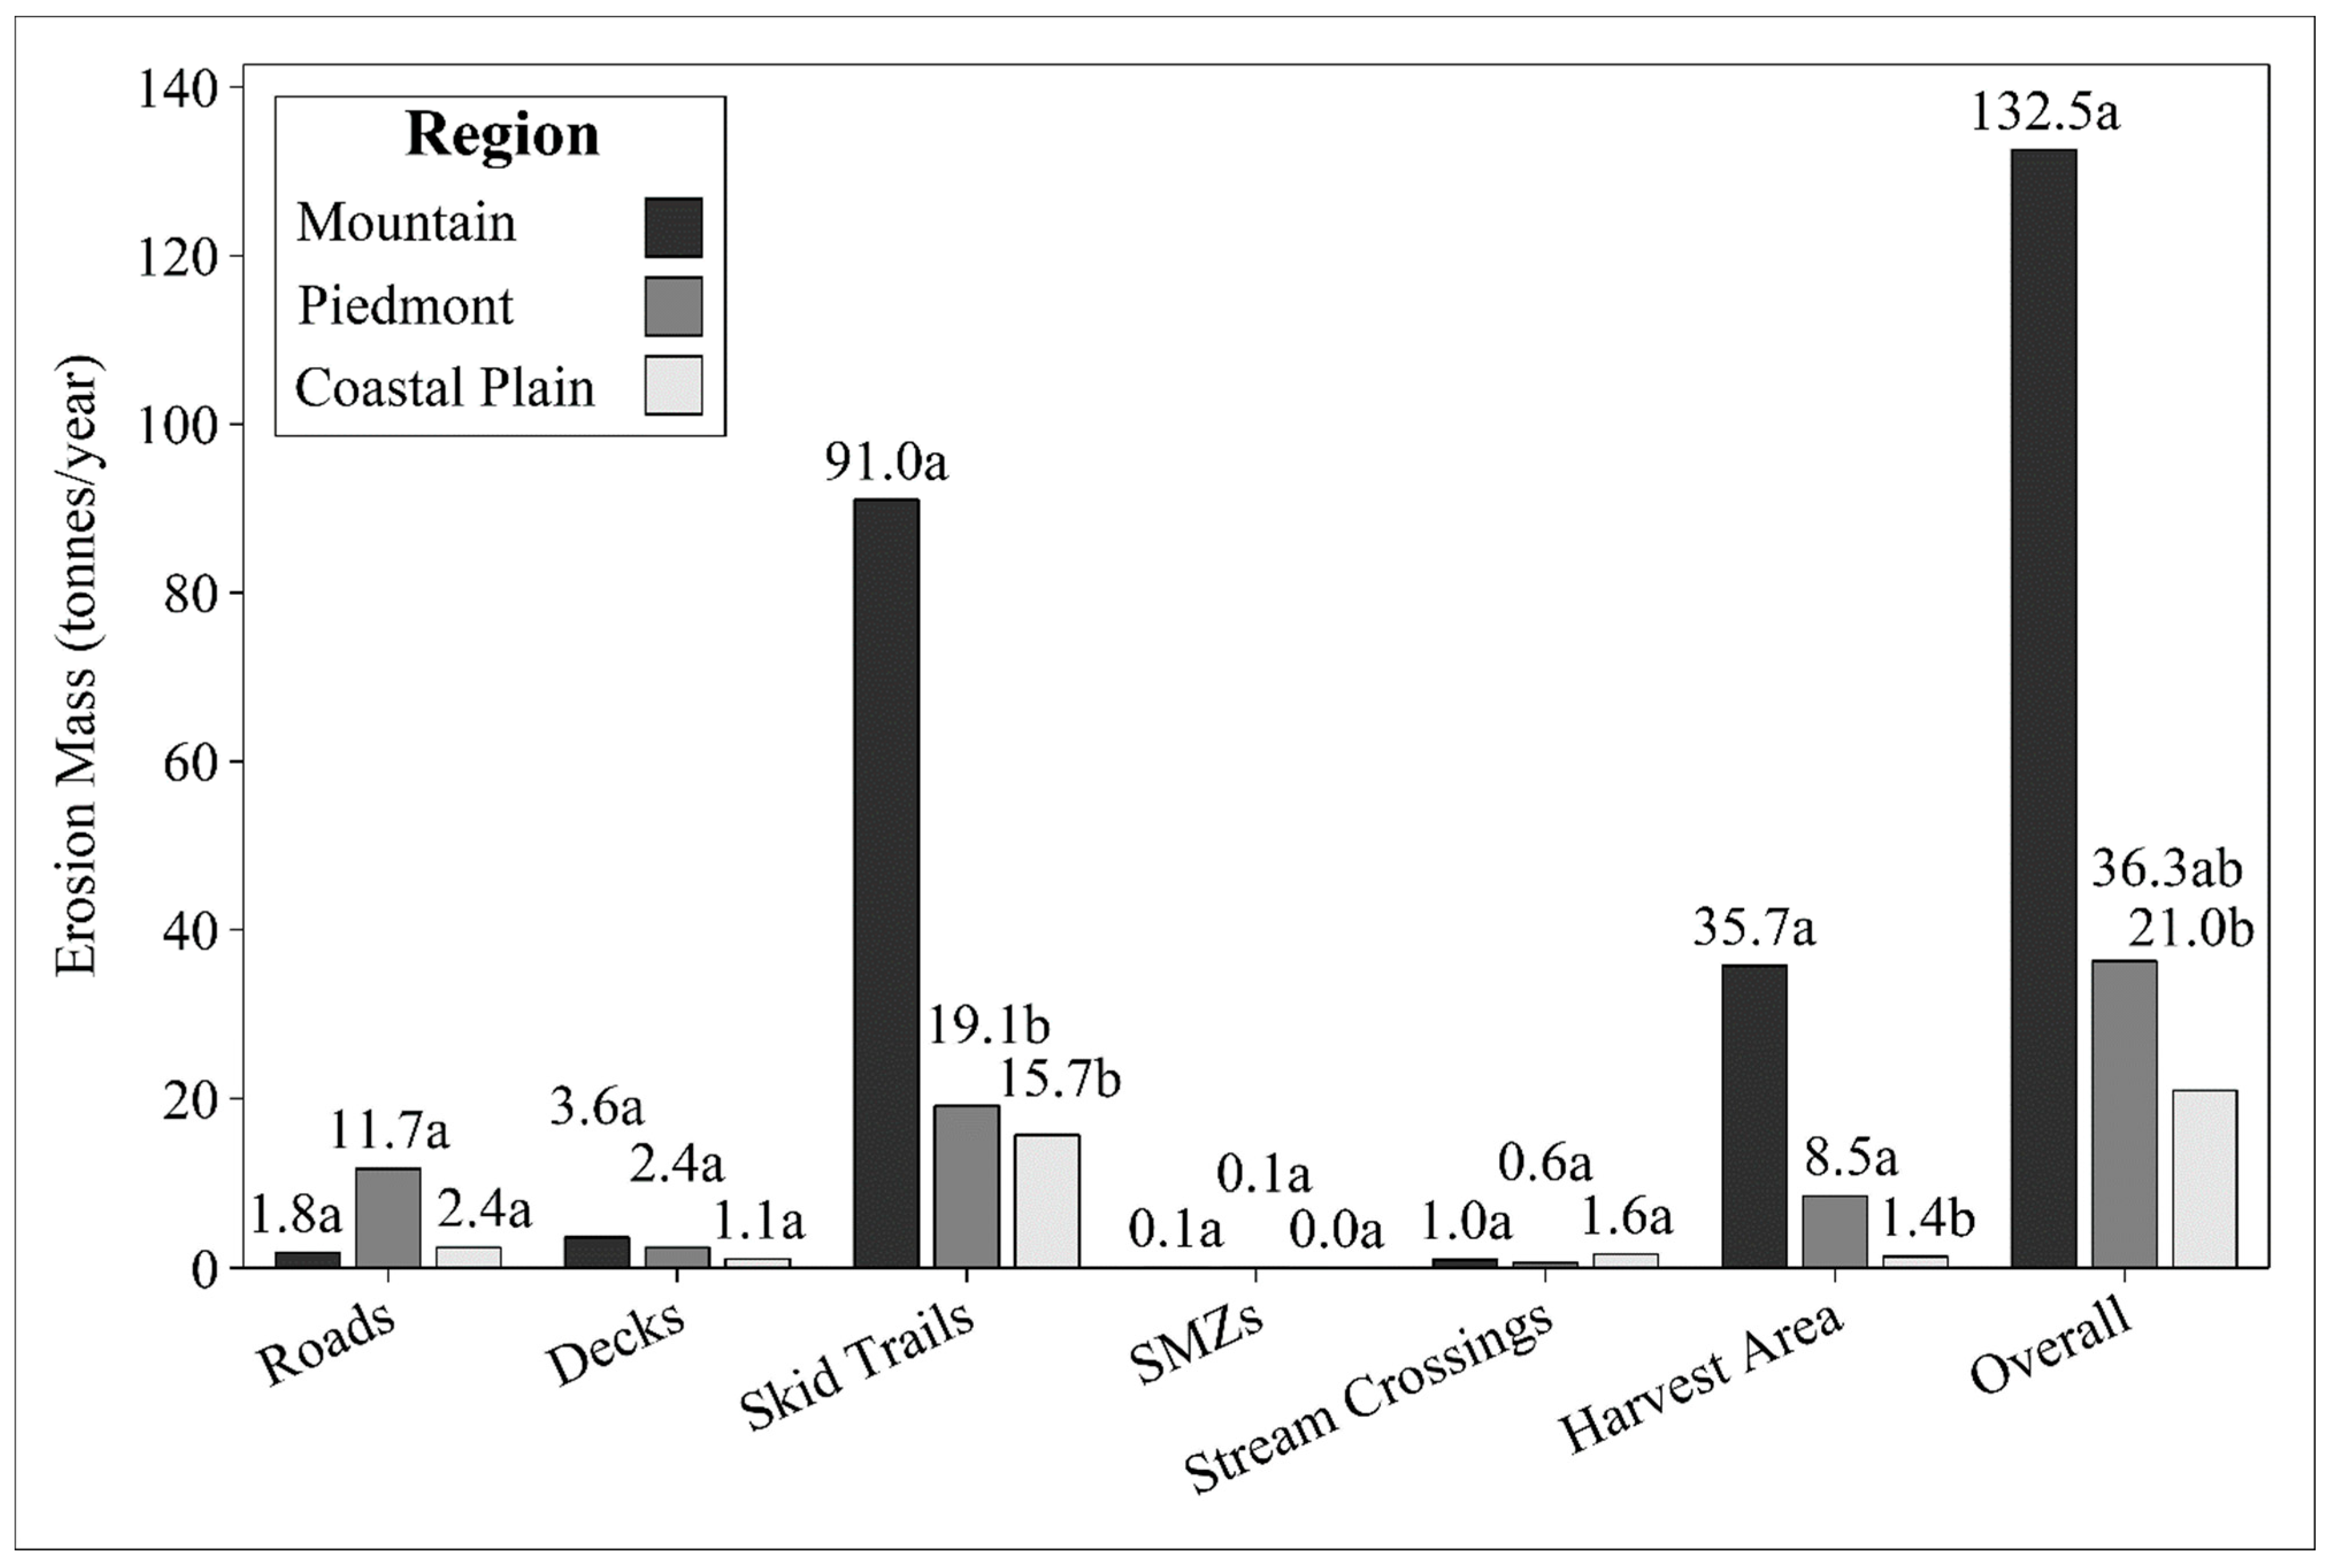
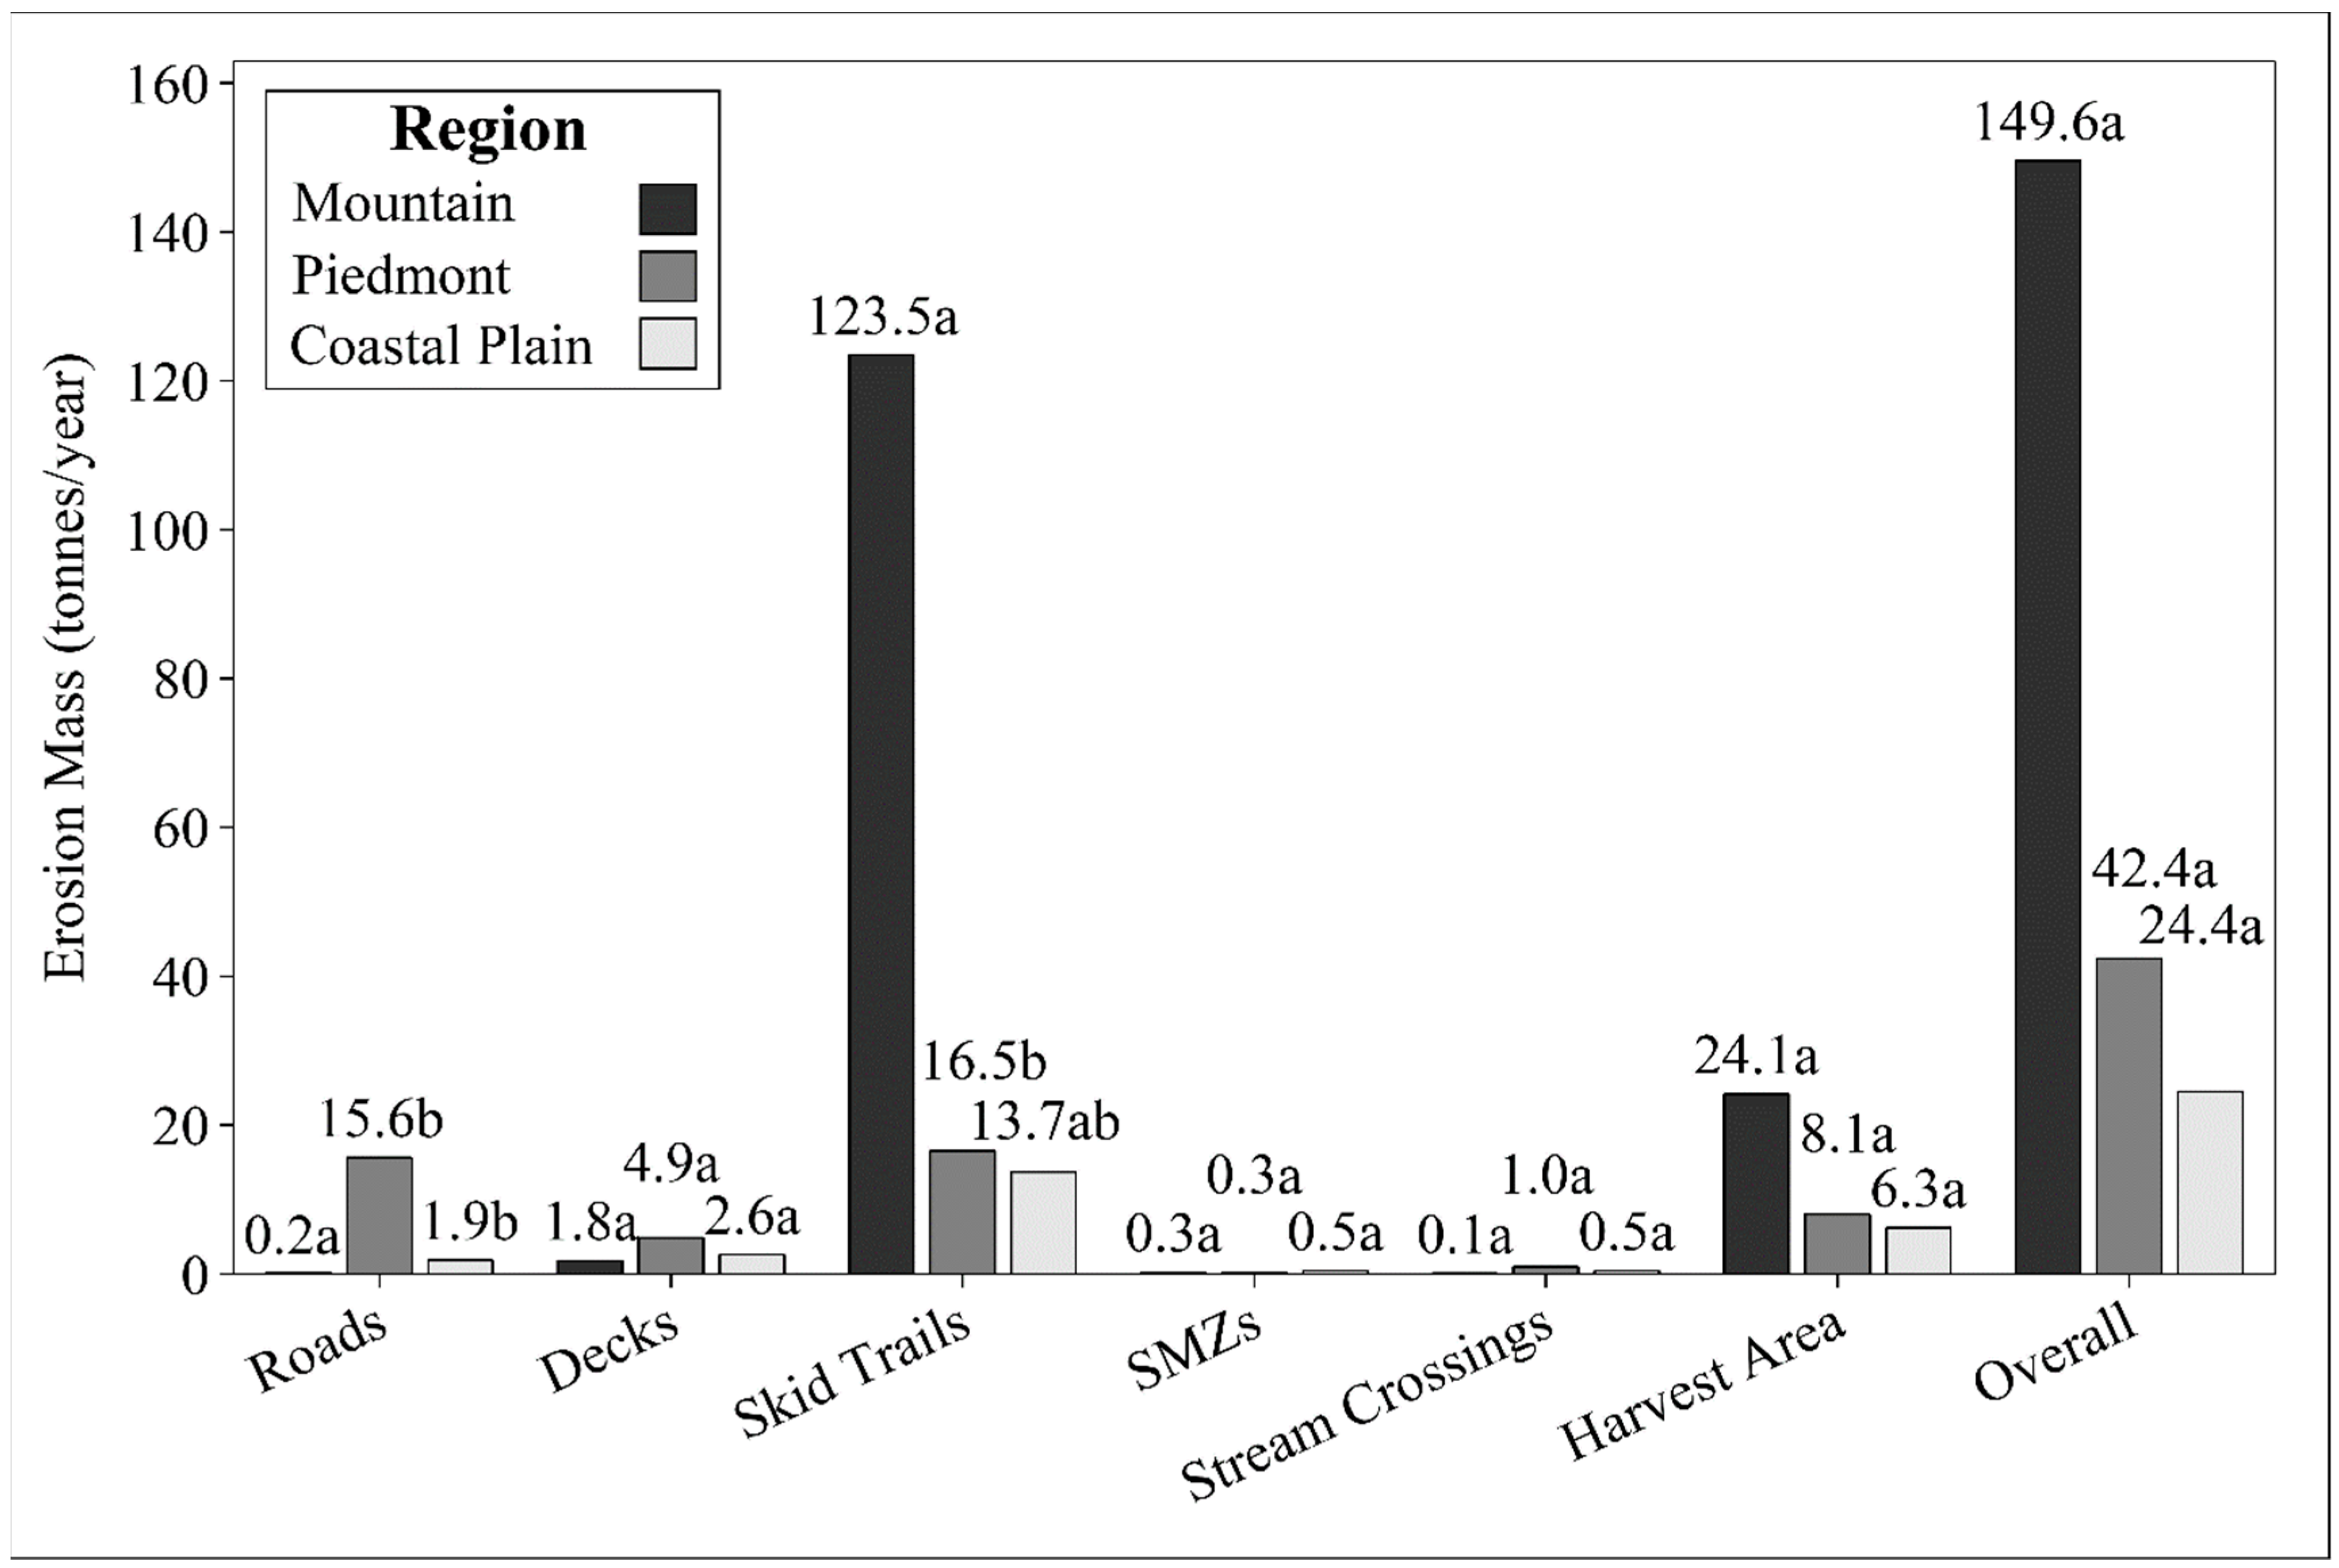
3.3. Contribution of Operational Features to Total Estimated Erosion Mass
3.4. BMP Implementation
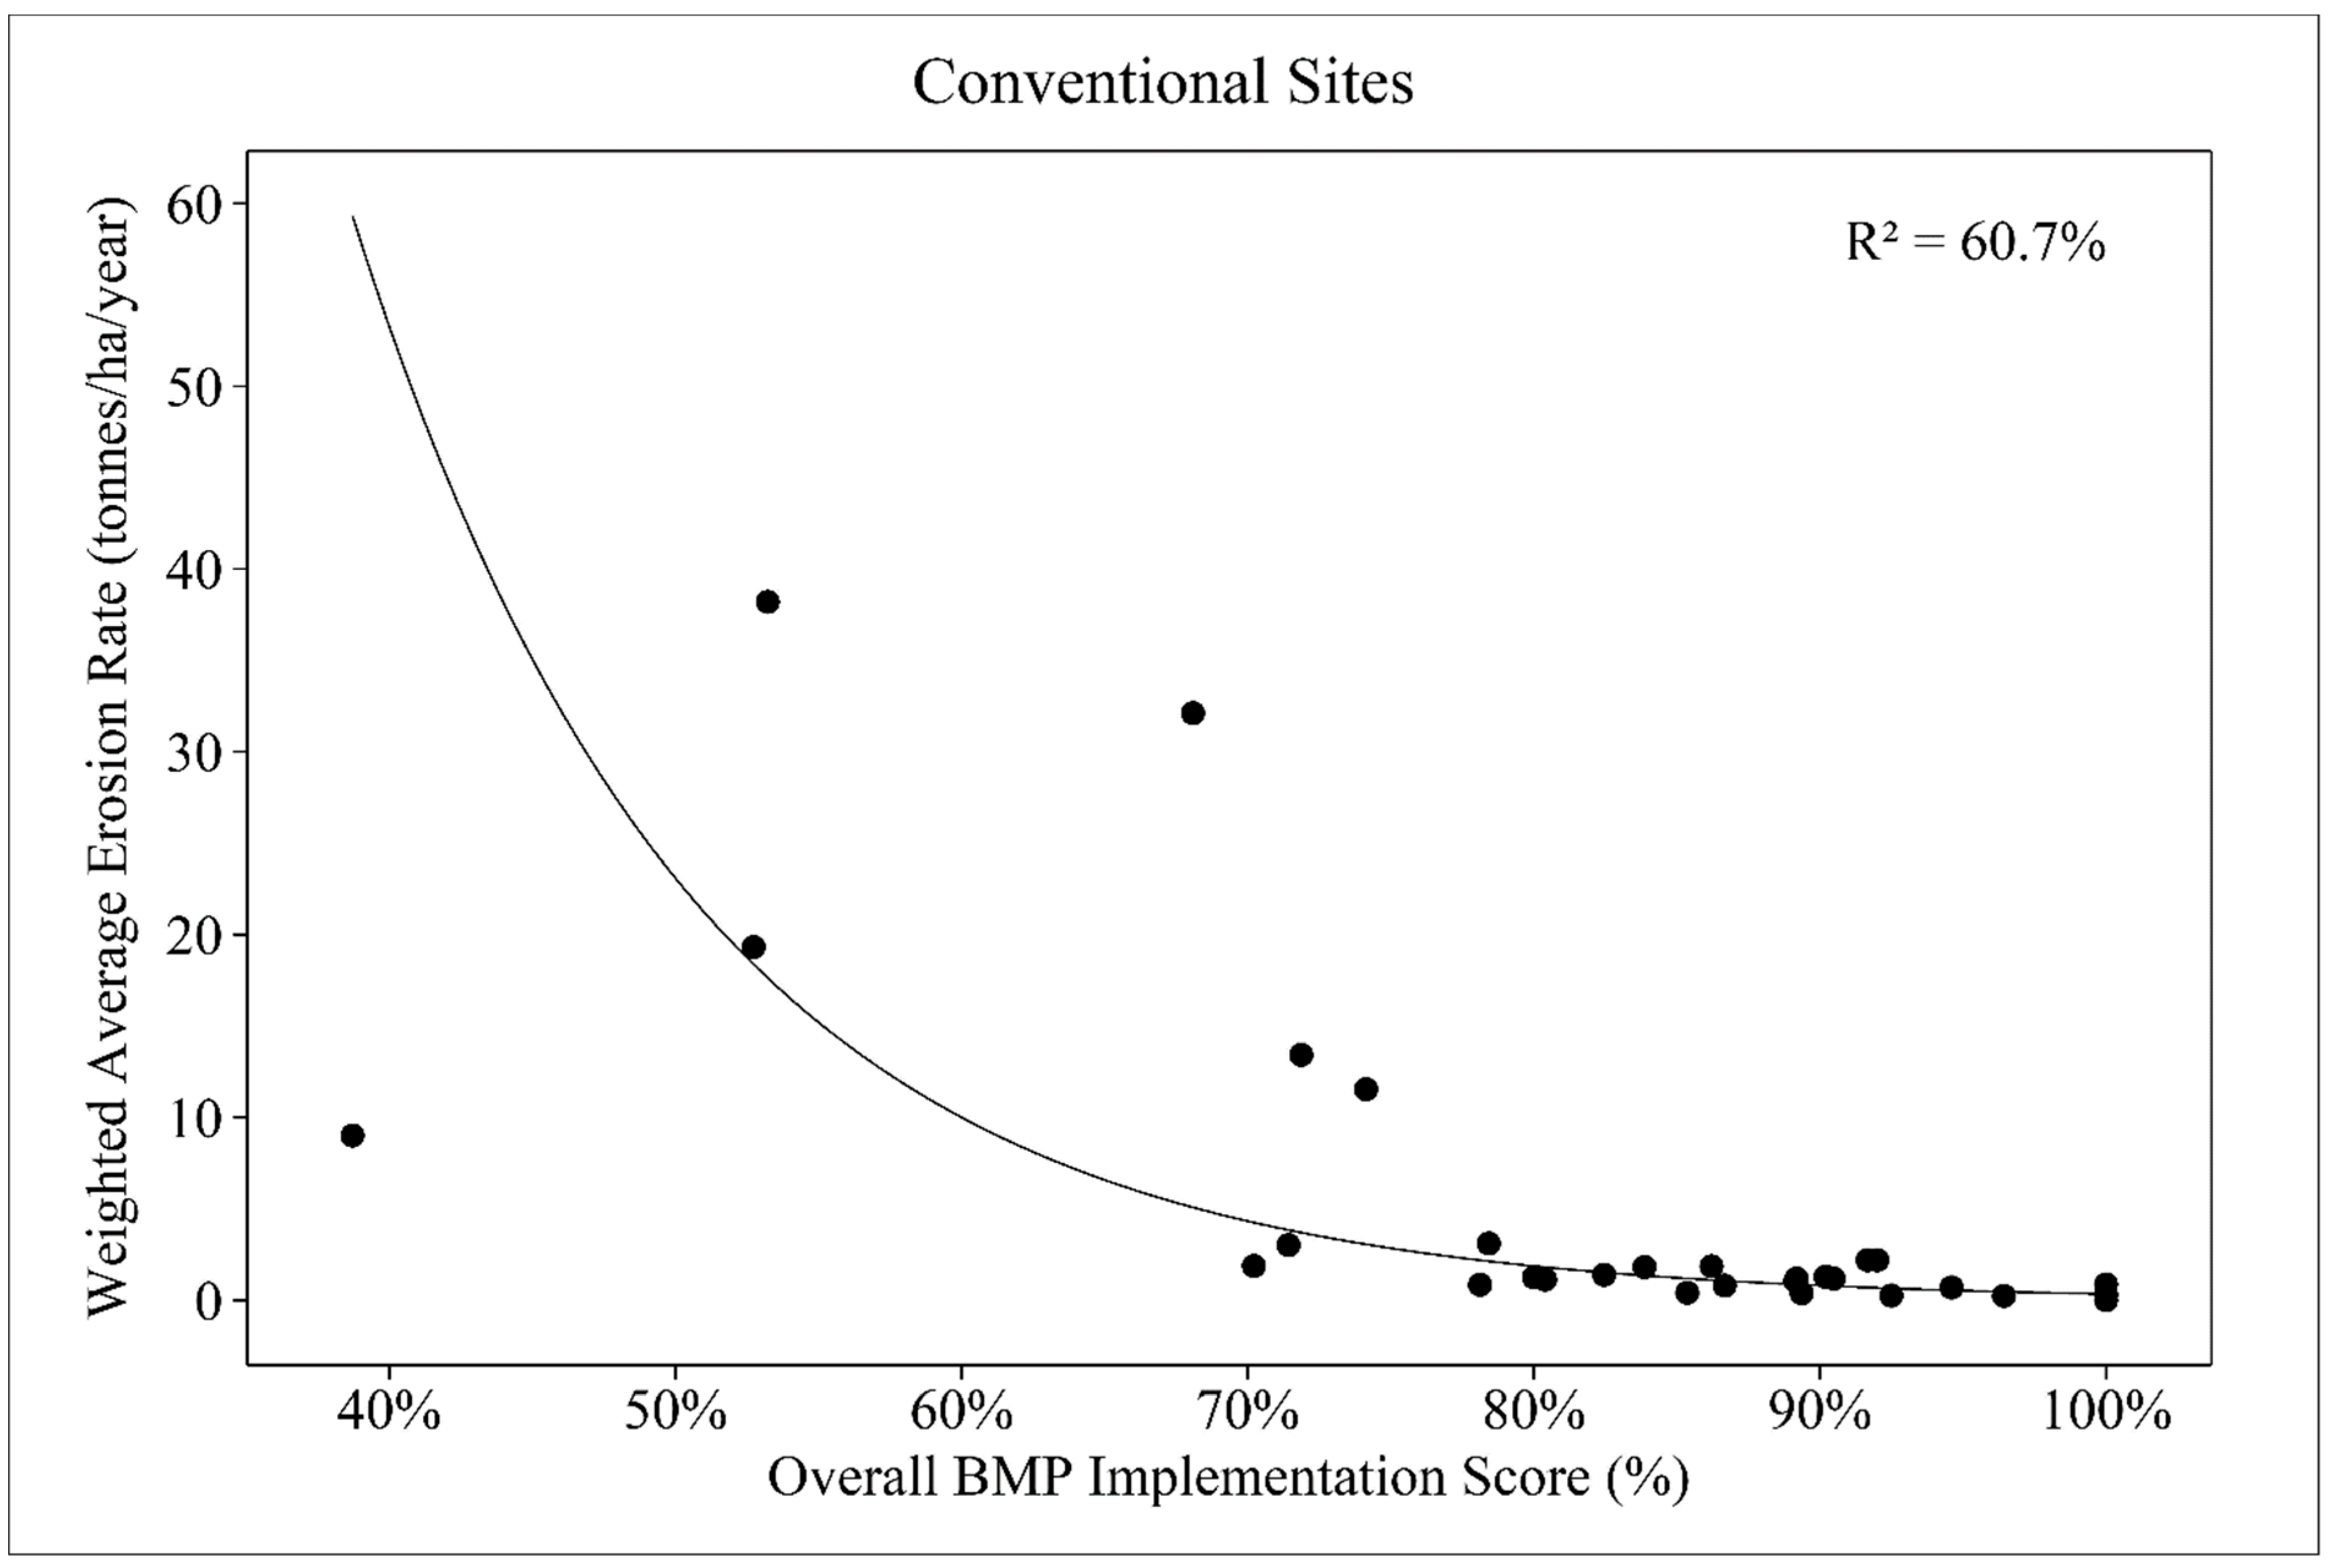
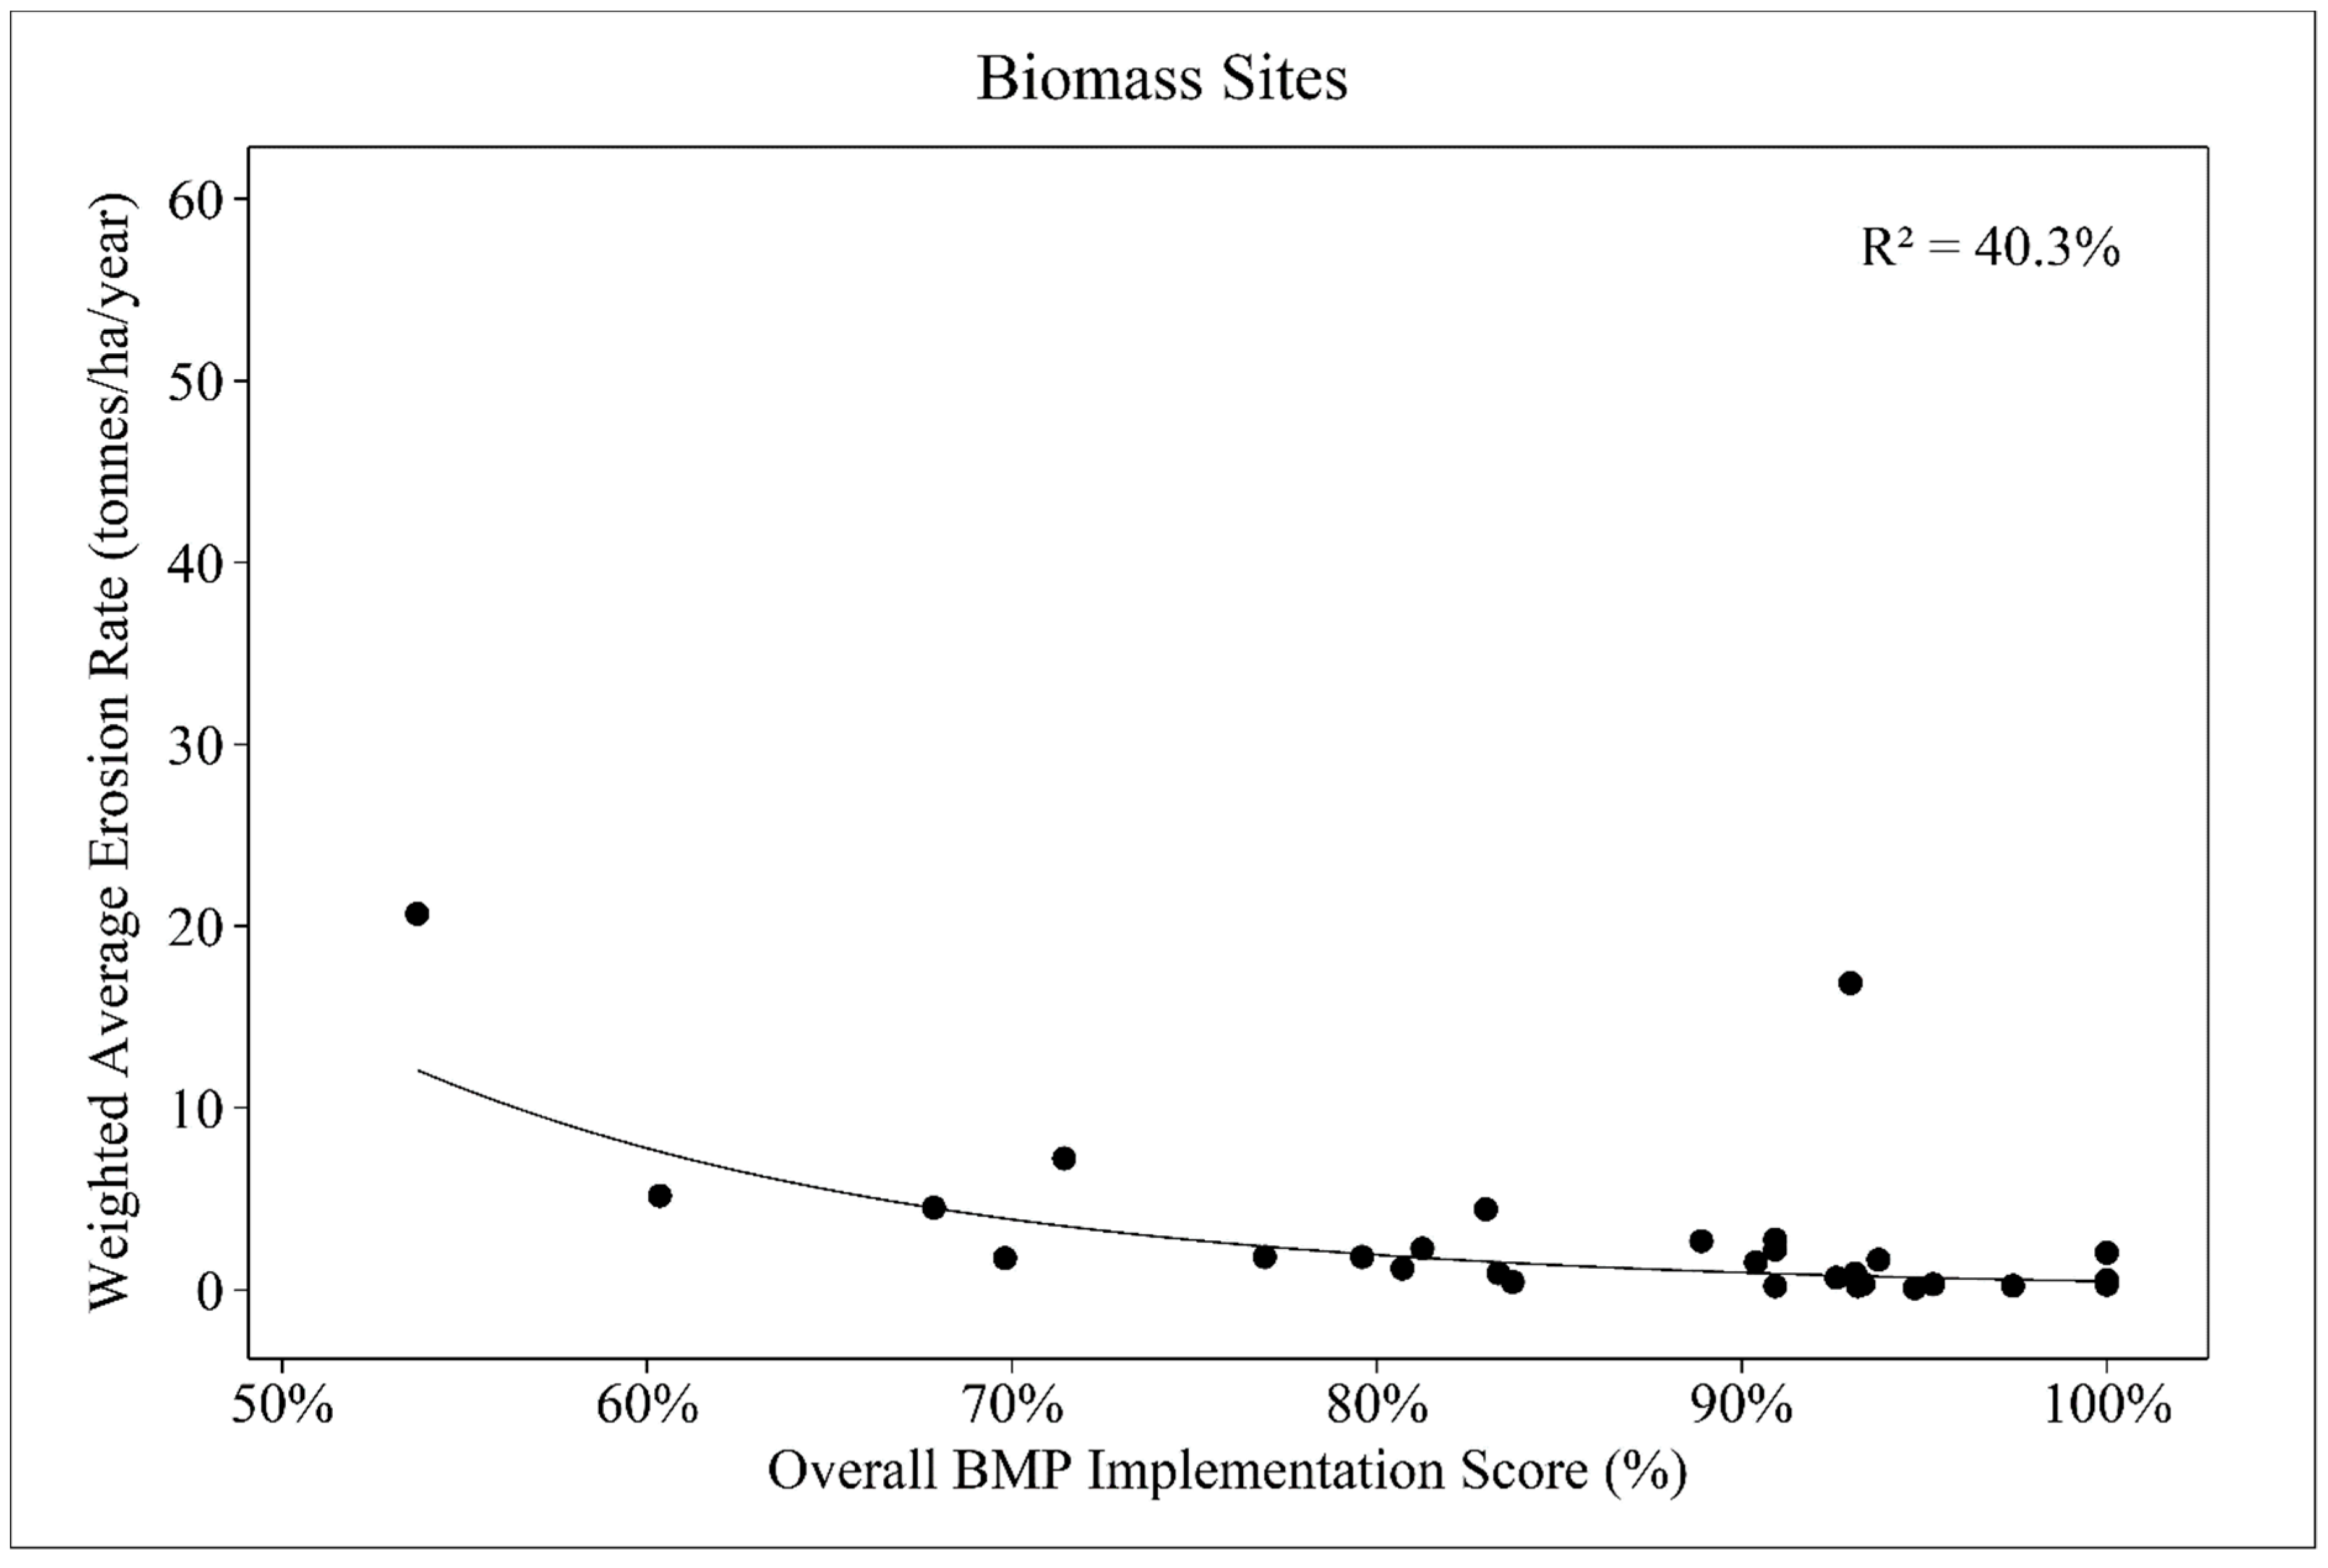
3.5. Overall BMP Implementation Compared to Estimated Erosion Rates
3.6. Slash Usage for BMPs
3.7. Harvest Area Ground Cover
3.8. Downed Woody Debris
4. Conclusions
Author Contributions
Funding
Data Availability Statement
Conflicts of Interest
References
- US EIA. Monthly Energy Review May 2023. US Energy Information Administration. 2023. Available online: https://www.eia.gov/totalenergy/data/monthly/pdf/mer.pdf (accessed on 8 February 2022).
- McKendry, P. Energy production from biomass (part 1): Overview of biomass. Bioresour. Technol. 2002, 83, 37–46. [Google Scholar] [CrossRef]
- US EIA. Annual Energy Outlook 2020 [Internet]. US Energy Information Administration. 2020. Available online: www.eia.gov/aeo (accessed on 23 November 2021).
- Ice, G.; Schilling, E.; Vowell, J. Trends for forestry best management practices implementation. J. For. 2010, 108, 267–273. [Google Scholar]
- Cristan, R.; Aust, W.M.; Bolding, M.C.; Barrett, S.M.; Munsell, J.F. National status of state developed and implemented forestry best management practices for protecting water quality in the United States. For. Ecol. Manag. 2018, 418, 73–84. [Google Scholar] [CrossRef]
- Aust, W.M.; Blinn, C.R. Forestry best management practices for timber harvesting and site preparation in the eastern United States: An overview of water quality and productivity research during the past 20 years (1982–2002). Water Air Soil Pollut. Focus 2004, 4, 5–36. [Google Scholar] [CrossRef]
- Edwards, P.J.; Williard, K.W.J. Efficiencies of forestry best management practices for reducing sediment and nutrient losses in the Eastern United States. J. For. 2010, 108, 245–249. [Google Scholar]
- Anderson, C.J.; Lockaby, B.G. The effectiveness of forestry best management practices for sediment control in the Southeastern United States: A literature review. South. J. Appl. For. 2011, 35, 170–177. [Google Scholar] [CrossRef]
- Wear, L.R.; Aust, W.M.; Bolding, M.C.; Strahm, B.D.; Dolloff, C.A. Effectiveness of best management practices for sediment reduction at operational forest stream crossings. For. Ecol. Manag. 2013, 289, 551–561. [Google Scholar] [CrossRef]
- Cristan, R.; Aust, W.M.; Bolding, M.C.; Barrett, S.M.; Munsell, J.F.; Schilling, E. Effectiveness of forestry best management practices in the United States: Literature review. For. Ecol. Manag. 2016, 360, 133–151. [Google Scholar] [CrossRef]
- Shepard, J.P. Water quality protection in bioenergy production: The US system of forestry best management practices. Biomass Bioenergy 2006, 30, 378–384. [Google Scholar] [CrossRef]
- Fielding, D.; Cubbage, F.; Peterson, M.N.; Hazel, D.; Gugelmann, B.; Moorman, C. Opinions of forest managers, loggers, and forest landowners in North Carolina regarding biomass harvesting guidelines. Int. J. For. Res. 2012, 2012, 15. [Google Scholar] [CrossRef]
- Rau, B.; Muwamba, A.; Trettin, C.; Panda, S.; Amatya, D.M.; Tollner, E.W. Water quality response to forest biomass utilization. In 2016 Billion-Ton Report: Advancing Domestic Resources for a Thriving Bioeconomy, Volume 2: Environmental Sustainability Effects of Select Scenarios from Volume 1; Efroymson, R.A., Langholtz, M.H., Johnson, K.E., Stokes, B.J., Eds.; ORNL/TM-2016/727; Oak Ridge National Laboratory: Oak Ridge, TN, USA, 2017; pp. 183–209. [Google Scholar]
- Ice, G.; McBroom, M.; Schweitzer, P. A Review of Best Management Practices for Forest Watershed Biomass Harvests with an Emphasis on Recommendations for Leaving Residual Wood Onsite; Center for Bioenergy Sustainability, Oak Ridge National Laboratory: Oak Ridge, TN, USA, 2010; p. 5.
- Abbas, D.; Current, D.; Phillips, M.; Rossman, R.; Hoganson, H.; Brooks, K.N. Guidelines for harvesting forest biomass for energy: A synthesis of environmental considerations. Biomass Bioenergy 2011, 35, 4538–4546. [Google Scholar] [CrossRef]
- Evans, A.M.; Perschel, R.T.; Kittler, B.A. Overview of forest biomass harvesting guidelines. J. Sustain. For. 2013, 32, 89–107. [Google Scholar] [CrossRef]
- Bessaad, A.; Bilger, I.; Korboulewsky, N. Assessing biomass removal and woody debris in whole-tree harvesting system: Are the recommended levels of residues ensured? Forests 2021, 12, 807. [Google Scholar] [CrossRef]
- Titus, B.D.; Brown, K.; Helmisaari, H.S.; Vanguelova, E.; Stupak, I.; Evans, A.; Clarke, N.; Guidi, C.; Bruckman, V.J.; Varnagiryte-Kabasinskiene, I.; et al. Sustainable forest biomass: A review of current residue harvesting guidelines. Energy Sustain. Soc. 2021, 11, 10. [Google Scholar] [CrossRef]
- Barrett, S.M.; Bolding, M.C.; Aust, W.M.; Munsell, J.F. Characteristics of logging businesses that harvest biomass for energy production. For. Prod. J. 2014, 64, 265–272. [Google Scholar] [CrossRef]
- Briedis, J.I.; Wilson, J.S.; Benjamin, J.G.; Wagner, R.G. Logging residue volumes and characteristics following integrated roundwood and energy-wood whole-tree harvesting in central Maine. North. J. Appl. For. 2011, 28, 66–71. [Google Scholar] [CrossRef]
- Fritts, S.R.; Moorman, C.E.; Hazel, D.W.; Jackson, B.D. Biomass Harvesting Guidelines affect downed woody debris retention. Biomass Bioenergy 2014, 70, 382–391. [Google Scholar] [CrossRef]
- Barrett, S.M.; Aust, W.M.; Bolding, M.C.; Lakel, W.A.; Munsell, J.F. Estimated erosion, ground cover, and best management practices audit details for postharvest evaluations of biomass and conventional clearcut harvests. J. For. 2016, 114, 9–16. [Google Scholar] [CrossRef]
- Garren, A.M.; Bolding, M.C.; Barrett, S.M.; Aust, W.M.; Coates, T.A. Best management practices, estimated erosion, residual woody debris, and ground cover characteristics following biomass and conventional clearcut harvests in Virginia’s Mountains. For. Sci. 2022, 68, 299–311. [Google Scholar] [CrossRef]
- Hawks, E.M.; Bolding, M.C.; Aust, W.M.; Barrett, S.M. Best Management Practices, Erosion, Residual Woody Biomass, and Soil Disturbances within Biomass and Conventional Clearcut Harvests in Virginia’s Coastal Plain. For. Sci. 2023, 69, 200–212. [Google Scholar] [CrossRef]
- Sawyers, B.C.; Bolding, M.C.; Aust, W.M.; Lakel, W.A., III. Effectiveness and implementation costs of overland skid trail closure techniques in the Virginia Piedmont. J. Soil Water Conserv. 2012, 67, 300–310. [Google Scholar] [CrossRef]
- Wade, C.R.; Bolding, M.C.; Aust, W.M.; Lakel, W.A., III. Comparison of five erosion control techniques for bladed skid trails in Virginia. South. J. Appl. For. 2012, 36, 191–197. [Google Scholar] [CrossRef]
- Wade, C.R.; Bolding, M.C.; Aust, W.M.; Lakel, W.A., III; Schilling, E.B. Comparing sediment trap data with the USLE-Forest, RUSLE2, and WEPP-Road erosion models for evaluation of bladed skid trail BMPs. Am. Soc. Agric. Biol. Eng. 2012, 55, 403–414. [Google Scholar]
- Vinson, J.A.; Barrett, S.M.; Aust, W.M.; Bolding, M.C. Evaluation of bladed skid trail closure methods in the Ridge and Valley region. For. Sci. 2017, 63, 432–440. [Google Scholar] [CrossRef]
- Turk, Y. The effects of using wood chips and slash in reducing sheet erosion on forest road slopes. Forests 2018, 9, 712. [Google Scholar] [CrossRef]
- McDonald, T.P.; Seixas, F. Effect of slash on forwarder soil compaction. J. For. Eng. 1997, 8, 15–26. [Google Scholar]
- Han, H.; Page-Dumroese, D.; Han, S.; Tirocke, J. Effects of slash, machine passes, and soil moisture on penetration resistance in a cut-to-length harvesting. Int. J. For. Eng. 2006, 17, 11–24. [Google Scholar] [CrossRef]
- Eliasson, L.; Wästerlund, I. Effects of slash reinforcement of strip roads on rutting and soil compaction on a moist fine-grained soil. For. Ecol. Manag. 2007, 252, 118–123. [Google Scholar] [CrossRef]
- Labelle, E.R.; Jaeger, D. Quantifying the use of brush mats in reducing forwarder peak loads and surface contact pressures. Croat. J. For. Eng. 2012, 33, 249–274. [Google Scholar]
- Parkhurst, B.M.; Aust, W.M.; Bolding, M.C.; Barrett, S.M.; Carter, E.A. Soil response to skidder trafficking and slash application. Int. J. For. Eng. 2018, 29, 31–40. [Google Scholar] [CrossRef]
- Johnson, D.W. The effects of harvesting intensity on nutrient depletion in forests. In IUFRB Symposium on Forest Site and Continuous Productivity; Ballard, R., Gessel, S.P., Eds.; USDA Forest Service: Washington, DC, USA, 1983; pp. 157–166. [Google Scholar]
- Mann, L.; Tolbert, V. Soil sustainability in renewable biomass plantings. R. Swed. Acad. Sci. 2000, 29, 492–498. [Google Scholar] [CrossRef]
- Hall, J.P. Sustainable production of forest biomass for energy. For. Chron. 2002, 78, 391–396. [Google Scholar] [CrossRef]
- Thiffault, E.; Hannam, K.D.; Paré, D.; Titus, B.D.; Hazlett, P.W.; Maynard, D.G.; Brais, S. Effects of forest biomass harvesting on soil productivity in boreal and temperate forests—A review. Environ. Rev. 2011, 19, 278–309. [Google Scholar] [CrossRef]
- Ouimet, R.; Duchesne, L.; Tremblay, S. Long-term soil fertility and site productivity in stem-only and whole-tree harvested stands in boreal forest of Quebec (Canada). Forests 2021, 12, 583. [Google Scholar] [CrossRef]
- Holub, S.M.; Terry, T.A.; Harrington, C.A.; Harrison, R.B.; Meade, R. Tree growth ten years after residual biomass removal, soil compaction, tillage, and competing vegetation control in a highly-productive Douglas-fir plantation. For. Ecol. Manag. 2013, 305, 60–66. [Google Scholar] [CrossRef]
- Barrett, S.M.; Aust, W.M.; Bolding, M.C.; Lakel, W.A.; Munsell, J.F. Implementation of forestry best management practices on biomass and conventional harvesting operations in Virginia. Water 2016, 8, 89. [Google Scholar] [CrossRef]
- Megahan, W.F.; Kidd, W.J. Effects of logging and logging roads on erosion and sediment deposition from steep terrain. J. For. 1972, 70, 136–141. [Google Scholar]
- Christopher, E.A.; Visser, R. Methodology for evaluating post harvest erosion risk for the protection of water quality. N. Z. J. For. 2007, 52, 20–25. [Google Scholar]
- VA DEQ. Virginia Physiographic Regions [GIS Data]. Virginia Department of Environmental Quality. 2021. Available online: https://apps.deq.virginia.gov/arcgis/rest/services/public/EDMA/MapServer (accessed on 14 December 2021).
- Cooper, J.A.; Becker, C.W. Virginia’s Timber Industry—An Assessment of Timber Product Output and Use, 2007; Resource Bulletin SRS-155; USDA Forest Service Southern Research Station: Asheville, NC, USA, 2007; pp. 1–33.
- Dissmeyer, G.E.; Foster, G.R. A Guide for Predicting Sheet and Rill Erosion on Forest Land; USDA Forest Service General Technical Publication SA-TP-11; Southern Region: Atlanta, GA, USA, 1980; p. 40. [Google Scholar]
- USDA NRCS. Web Soil Survey. USDA Natural Resource Conservation Service. 2021. Available online: http://websoilsurvey.nrcs.usda.gov/ (accessed on 10 December 2021).
- Lakel, W.A., III; Poirot, M. Silvicultural Best Management Practices Implementation Monitoring for Virginia-2013; Virginia Department of Forestry: Charlottesville, VA, USA, 2014; pp. 1–10.
- Eisenbies, M.H.; Burger, J.A.; Aust, W.M.; Patterson, S.C. Soil physical disturbance and logging residue effects on changes in soil productivity in five-year-old pine plantations. Soil Sci. Soc. Am. J. 2005, 69, 1833–1843. [Google Scholar] [CrossRef]
- Brown, J.K. Handbook for Inventorying Downed Woody Material; USDA Forest Service General Technical Report, INT-16; Forest and Range Experiment Station: Ogden, UT, USA, 1974; pp. 1–24.
- Coates, T.A.; Johnson, A.; Aust, W.M.; Hagan, D.L.; Chow, A.T.; Trettin, C. Forest composition, fuel loading, and soil chemistry resulting from 50 years of forest management and natural disturbance in two southeastern Coastal Plain watersheds, USA. For. Ecol. Manag. 2020, 473, 118337. [Google Scholar] [CrossRef]
- JMP®. JMP Pro 16; SAS Institute Inc.: Cary, NC, USA, 2022. [Google Scholar]
- Stefano, J.D. Power analysis and sustainable forest management. For. Ecol. Manag. 2001, 154, 141–153. [Google Scholar] [CrossRef]
- Minitab LLC. Minitab Software; Minitab LLC: State College, PA, USA, 2021. [Google Scholar]
- Bolding, M.C.; Barrett, S.M.; Munsell, J.F.; Groover, M.C. Characteristics of Virginia’s logging businesses in a changing timber market. For. Prod. J. 2010, 60, 86–93. [Google Scholar] [CrossRef]
- Barrett, S.M.; Bolding, M.C.; Munsell, J.F. Characteristics of logging businesses across Virginia’s diverse physiographic regions. Forests 2017, 8, 468. [Google Scholar] [CrossRef]
- Dangle, C.L.; Vinson, J.A.; Barrett, S.M. Regional Forest Harvest Characteristics across Virginia; Virginia Cooperative Extension; Virginia Tech: Blacksburg, VA, USA, 2017; pp. 1–6. Available online: https://vtechworks.lib.vt.edu/handle/10919/80667 (accessed on 1 March 2022).
- VDOF. State of the Forest: Annual Report on Virginia’s Forests; Virginia Department of Forestry: Charlottesville, VA, USA, 2020; pp. 1–21.
- Garren, A.M.; Bolding, M.C.; Barrett, S.M.; Aust, W.M.; Coates, T.A. Characteristics of forest biomass harvesting businesses in Virginia. Biomass Bioenergy 2022, 163, 106501. [Google Scholar] [CrossRef]
- Croke, J.; Harisine, P.; Fogarty, P. Sediment transport, redistribution and storage on logged forest hillslopes in south-eastern Australia. Hydrol. Process. 1999, 13, 2705–2720. [Google Scholar] [CrossRef]
- Garren, A.M.; Bolding, M.C.; Aust, W.M.; Moura, A.C.; Barrett, S.M. Soil disturbance effects from tethered forwarding on steep slopes in Brazilian eucalyptus plantations. Forests 2019, 10, 721. [Google Scholar] [CrossRef]
- Solgi, A.; Naghdi, R.; Zenner, E.K.; Hemmati, V.; Behjou, F.K.; Masumian, A. Evaluating the effectiveness of mulching for reducing soil erosion in cut slope and fill slope of forest roads in Hyrcanian Forests. Croat. J. For. Eng. 2021, 42, 259–268. [Google Scholar] [CrossRef]
- Dangle, C.L.; Aust, W.M.; Bolding, M.C.; Barrett, S.M.; Schilling, E.B.; Poirot, M. Characteristics, predicted erosion, and costs for different levels of forestry best management practices at skidder and truck stream crossings in the Mountains, Piedmont, and Coastal Plains of Virginia, USA. Int. J. For. Eng. 2019, 30, 76–86. [Google Scholar] [CrossRef]
- Hawks, B.S.; Aust, W.M.; Bolding, M.C.; Barrett, S.M.; Schilling, E.; Fielding, J.A.H. Linkages between forestry best management practices and erosion in the southeastern U.S. J. Environ. Manag. 2022, 305, 114411. [Google Scholar] [CrossRef]
- Hawks, B.S.; Bolding, M.C.; Aust, W.M.; Barrett, S.M.; Schilling, E.; Horton, C.N. Implementation of forestry best management practices and sediment delivery in three regions of North Carolina and Virginia. For. Sci. 2022, 68, 63–74. [Google Scholar] [CrossRef]
- Horton, C.N.; Barrett, S.M.; Aust, W.M.; Bolding, M.C. Sediment Delivery Ratios and Areas of Forest Operational Features by Physiographic Groupings in the Southeastern U.S. Master’s Thesis, Virginia Tech, Blacksburg, VA, USA, 2021. Available online: https://vtechworks.lib.vt.edu/handle/10919/103884 (accessed on 1 February 2022).
- Sidle, R.C.; Ziegler, A.D.; Negishi, J.N.; Nik, A.R.; Siew, R.; Turkelboom, F. Erosion processes in steep terrain—Truths, myths, and uncertainties related to forest management in Southeast Asia. For. Ecol. Manag. 2006, 224, 199–225. [Google Scholar] [CrossRef]
- Dangle, C.L.; Bolding, M.C.; Aust, W.M.; Barrett, S.M.; Schilling, E.B. Best management practices influence modeled erosion rates at forest haul road stream crossings in Virginia. J. Am. Water Resour. Assoc. 2019, 55, 1169–1182. [Google Scholar] [CrossRef]
- Shaffer, R.M.; Haney, H.L., Jr.; Worrell, E.G.; Aust, W.M. Forestry BMP implementation costs for Virginia. For. Prod. J. 1998, 48, 27–29. [Google Scholar]
- McKee, S.E.; Shenk, L.A.; Bolding, M.C.; Aust, W.M. Stream crossing methods, costs, and closure best management practices for Virginia loggers. South. J. Appl. For. 2012, 36, 33–37. [Google Scholar] [CrossRef]
- Greene, D.; Baker, S.; Cutshall, J.; Enrich, A. Regional approaches for harvesting forest biomass: A report on field studies to the Wood Supply Research Institute. For. Oper. Rev. 2011, 13, 14–25. [Google Scholar]
- Lang, A.J.; Aust, W.M.; Bolding, M.C.; McGuire, K.J.; Schilling, E.B. Best Management Practices Influence Sediment Delivery from Road Stream Crossings to Mountain and Piedmont Streams. For. Sci. 2018, 64, 682–695. [Google Scholar] [CrossRef]
- Schuler, J.L.; Briggs, R.D. Assessing application and effectiveness of forestry best management practices in New York. North. J. Appl. For. 2000, 17, 125–134. [Google Scholar] [CrossRef]


| Operational Feature | Estimated Erosion Rate (Tonnes/ha/Year) | |||||
|---|---|---|---|---|---|---|
| Biomass | Conventional | |||||
| Mountain | Piedmont | Coastal Plain | Mountain | Piedmont | Coastal Plain | |
| M [SE] (n) | M [SE] (n) | M [SE] (n) | M [SE] (n) | M [SE] (n) | M [SE] (n) | |
| Roads | 9.4 a [4.1] (10) | 20.8 a [8.8] (5) | 8.5 a [2.5] (8) | 1.3 a [0.5] (10) | 26.5 b [10.4] (8) | 13.5 b [2.1] (7) |
| Decks | 9.9 a [2.7] (10) | 8.3 a [3.4] (10) | 5.2 a [2.3] (10) | 5.6 a [1.5] (10) | 14.3 a [7.0] (10) | 7.4 a [2.4] (10) |
| Skid trails | 30.0 a [10.6] (10) | 20.4 ab [7.7] (10) | 9.2 b [3.6] (10) | 74.9 a [24.6] (10) | 24.2 ab [13.6] (10) | 8.7 b [2.4] (10) |
| SMZs | 0.0 a [0.0] (6) | 0.2 a [0.1] (4) | 0.0 a [0.0] (8) | 0.7 a [0.7] (4) | 0.2 a [0.1] (5) | 0.2 a [0.2] (7) |
| Stream crossings | 63.9 a [59.0] (4) | 17.3 a [11.7] (3) | 26.5 a [18.2] (5) | 3.8 a [1.7] (4) | 7.6 a [3.6] (2) | 7.8 a [3.1] (4) |
| Harvest area | 1.6 a [1.1] (10) | 0.4 a [0.2] (10) | 0.2 b [0.1] (10) | 2.7 a [1.8] (10) | 0.4 a [0.1] (10) | 0.4 a [0.2] (10) |
| Overall | 5.4 a [2.3] (10) | 1.6 ab [0.6] (10) | 1.6 b [0.7] (10) | 12.1 a [4.4] (10) | 1.8 a [0.8] (10) | 1.3 a [0.3] (10) |
| Operational Feature | Percentage of Total Tract Area | |||||
|---|---|---|---|---|---|---|
| Biomass | Conventional | |||||
| Mountain | Piedmont | Coastal Plain | Mountain | Piedmont | Coastal Plain | |
| M [SE] | M [SE] | M [SE] | M [SE] | M [SE] | M [SE] | |
| Roads | 0.8 a [0.2] | 0.7 a [0.3] | 1.4 a [0.5] | 1.0 a [0.3] | 0.9 a [0.4] | 0.5 a [0.2] |
| Decks | 1.9 a [0.4] | 1.3 a [0.3] | 2.0 a [0.2] | 2.6 a [0.4] | 1.3 b [0.2] | 1.9 ab [0.4] |
| Skid trails | 10.6 a [1.3] | 3.9 b [0.5] | 10.9 a [1.3] | 10.9 a [1.4] | 3.5 b [0.7] | 10.1 a [0.7] |
| SMZs | 4.9 ab [2.0] | 1.1 a [0.5] | 7.0 b [2.1] | 1.9 a [0.7] | 4.5 a [2.6] | 7.4 a [2.4] |
| Stream crossings | 0.0 a [0.0] | 0.1 a [0.0] | 0.3 a [0.1] | 0.1 a [0.0] | 0.1 a [0.1] | 0.1 a [0.1] |
| Harvest area | 81.8 a [1.9] | 93.0 b [0.9] | 78.5 a [2.3] | 83.5 a [1.6] | 89.6 b [2.6] | 80.0 a [2.1] |
| Operational Feature | Percentage Contribution to Total Estimated Erosion | |||||
|---|---|---|---|---|---|---|
| Biomass | Conventional | |||||
| Mountain | Piedmont | Coastal Plain | Mountain | Piedmont | Coastal Plain | |
| M [SE] | M [SE] | M [SE] | M [SE] | M [SE] | M [SE] | |
| Roads | 6.2 a [3.1] | 7.9 ab [4.8] | 10.2 a [3.0] | 1.7 a [1.2] | 16.0 a [6.8] | 7.4 a [2.8] |
| Decks | 9.8 a [3.7] | 6.8 a [1.7] | 11.7 a [7.7] | 7.4 a [4.1] | 8.4 a [3.5] | 11.8 a [3.7] |
| Skid trails | 67.2 a [6.5] | 48.7 a [8.4] | 63.7 a [7.5] | 81.1 a [5.5] | 37.9 b [5.0] | 59.4 c [8.4] |
| SMZs | 0.3 a [0.2] | 0.1 a [0.1] | 0.2 a [0.1] | 0.1 a [0.1] | 0.7 a [0.4] | 0.8 a [0.8] |
| Stream crossings | 0.1 a [0.1] | 2.4 a [2.3] | 2.5 a [1.0] | 0.0 a [0.0] | 0.5 a [0.3] | 0.4 a [0.3] |
| Harvest area | 16.4 ab [5.3] | 34.1 a [6.3] | 11.7 b [4.5] | 9.7 a [3.6] | 36.6 b [6.5] | 20.1 ab [7.5] |
| BMP Category | Percentage BMP Implementation | |||||
|---|---|---|---|---|---|---|
| Biomass | Conventional | |||||
| Mountain | Piedmont | Coastal Plain | Mountain | Piedmont | Coastal Plain | |
| M [SE] (n) | M [SE] (n) | M [SE] (n) | M [SE] (n) | M [SE] (n) | M [SE] (n) | |
| Roads | 93.1 a [2.1] (10) | 75.4 a [9.1] (5) | 90.4 a [2.3] (8) | 90.4 a [2.6] (10) | 79.6 a [8.3] (8) | 87.8 a [4.7] (7) |
| Decks | 86.6 a [4.0] (10) | 93.6 a [3.3] (10) | 96.7 a [2.4] (10) | 84.2 a [3.7] (10) | 82.6 ab [5.2] (10) | 95.6 b [1.8] (10) |
| Stream crossings | 79.2 a [20.8] (4) | 91.7 a [8.3] (3) | 76.2 a [7.5] (5) | 65.9 a [15.1] (4) | 76.4 a [1.4] (2) | 80.4 a [10.7] (4) |
| SMZs | 74.0 a [11.2] (9) | 82.3 a [8.4] (9) | 85.0 a [4.1] (9) | 41.7 a [6.8] (7) | 97.2 b [7.9] (8) | 83.4 c [5.8] (10) |
| Harvest planning | 100.0 a [0.0] (10) | 78.3 b [9.0] (10) | 93.3 ab [4.4] (10) | 100.0 a [0.0] (10) | 80.0 b [8.2] (10) | 100.0 a [0.0] (10) |
| Skidding | 82.6 a [6.5] (10) | 81.5 a [6.1] (10) | 79.1 a [6.1] (10) | 60.9 a [8.9] (10) | 71.1 ab [8.0] (10) | 87.5 b [4.9] (10) |
| Overall | 86.2 a [4.1] (10) | 85.2 a [4.8] (10) | 87.5 a [2.8] (10) | 75.4 a [4.7] (10) | 81.3 ab [5.5] (10) | 89.1 b [2.1] (10) |
| Ground Cover | Percentage of Harvest Area | |||||
|---|---|---|---|---|---|---|
| Biomass | Conventional | |||||
| Mountain | Piedmont * | Coastal Plain * | Mountain | Piedmont * | Coastal Plain * | |
| M [SE] | M [SE] | M [SE] | M [SE] | M [SE] | M [SE] | |
| Bare soil | 4.6 a [1.2] | 7.4 a [1.4] | 9.5 a [1.6] | 3.0 a [0.8] | 11.3 b [1.6] | 5.6 a [1.2] |
| Litter | 45.4 ab [6.5] | 62.2 a [1.9] | 51.8 b [3.0] | 36.4 a [4.4] | 49.1 b [3.3] | 48.4 ab [4.2] |
| Light slash | 18.9 a [1.8] | 17.4 a [0.7] | 21.7 a [2.0] | 15.6 a [1.3] | 17.9 a [0.9] | 26.7 b [2.2] |
| Heavy slash | 14.8 a [1.2] | 12.5 a [0.9] | 16.8 a [1.7] | 18.6 a [1.4] | 18.5 a [1.6] | 15.1 a [1.6] |
| Piles | 2.0 a [1.0] | 0.5 a [0.1] | 0.3 a [0.1] | 6.4 a [2.8] | 2.7 a [1.0] | 4.2 a [2.1] |
| Rock | 1.6 a [0.4] | 0.0 b [0.0] | 0.0 b [0.0] | 3.2 a [2.1] | 0.5 b [0.4] | 0.0 b [0.0] |
| Grass/shrubs | 12.8 [3.0] | -- | -- | 16.8 [4.6] | -- | -- |
| Size Class | Amount of Woody Debris | Biomass vs. Conventional p-Values a | ||||||
|---|---|---|---|---|---|---|---|---|
| Biomass | Conventional | |||||||
| MTN | CP | p-Value b | MTN | CP | p-Value b | MTN b | CP b | |
| M [SE] | M [SE] | M [SE] | M [SE] | |||||
| <0.6 cm (tonnes/ha) | 0.76 [0.06] | 0.61 [0.03] | 0.0539 | 0.85 [0.06] | 0.58 [0.06] | 0.0113 | 0.1620 | 0.7913 |
| <0.6 cm (pieces/m) | 7.78 [0.05] | 6.30 [0.03] | 0.0890 | 8.79 [0.06] | 6.17 [0.06] | 0.0172 | 0.2261 | 0.7913 |
| ≥0.6 cm–<2.5 cm (tonnes/ha) | 5.94 [0.65] | 7.06 [0.53] | 0.0890 | 7.46 [0.50] | 9.19 [1.13] | 0.3847 | 0.0376 | 0.1620 |
| ≥0.6 cm–<2.5 cm (pieces/m) | 3.18 [0.03] | 3.87 [0.03] | 0.0452 | 4.04 [0.03] | 5.05 [0.06] | 0.3075 | 0.0587 | 0.1620 |
| ≥2.5–<7.6 cm (tonnes/ha) | 9.50 [1.14] | 9.26 [0.92] | 0.8501 | 17.98 [1.24] | 11.97 [1.11] | 0.0036 | 0.0013 | 0.0962 |
| ≥2.5–<7.6 cm (pieces/m) | 0.66 [0.01] | 0.66 [0.01] | 0.7913 | 1.21 [0.01] | 0.82 [0.01] | 0.0036 | 0.0013 | 0.0962 |
| ≥7.6 cm (tonnes/ha) | 8.41 [1.93] | 6.01 [1.34] | 0.3847 | 36.34 [5.37] | 10.18 [2.64] | 0.0058 | 0.0028 | 0.1620 |
| ≥7.6 cm (pieces/m) | 0.10 [0.00] | 0.07 [0.00] | 0.3443 | 0.33 [0.00] | 0.10 [0.00] | 0.0022 | 0.0013 | 0.1040 |
| Total (tonnes/ha) | 24.61 [3.61] | 22.91 [2.11] | 0.7913 | 62.66 [5.75] | 31.92 [2.99] | 0.0022 | 0.0006 | 0.0173 |
| Total (pieces/m) | 11.71 [0.06] | 10.89 [0.05] | 0.4274 | 14.37 [0.08] | 12.14 [0.10] | 0.1859 | 0.0312 | 0.3847 |
Disclaimer/Publisher’s Note: The statements, opinions and data contained in all publications are solely those of the individual author(s) and contributor(s) and not of MDPI and/or the editor(s). MDPI and/or the editor(s) disclaim responsibility for any injury to people or property resulting from any ideas, methods, instructions or products referred to in the content. |
© 2023 by the authors. Licensee MDPI, Basel, Switzerland. This article is an open access article distributed under the terms and conditions of the Creative Commons Attribution (CC BY) license (https://creativecommons.org/licenses/by/4.0/).
Share and Cite
Garren, A.M.; Bolding, M.C.; Barrett, S.M.; Hawks, E.M.; Aust, W.M.; Coates, T.A. A Comparison of Forest Biomass and Conventional Harvesting Effects on Estimated Erosion, Best Management Practice Implementation, Ground Cover, and Residual Woody Debris in Virginia. Biomass 2023, 3, 403-421. https://doi.org/10.3390/biomass3040024
Garren AM, Bolding MC, Barrett SM, Hawks EM, Aust WM, Coates TA. A Comparison of Forest Biomass and Conventional Harvesting Effects on Estimated Erosion, Best Management Practice Implementation, Ground Cover, and Residual Woody Debris in Virginia. Biomass. 2023; 3(4):403-421. https://doi.org/10.3390/biomass3040024
Chicago/Turabian StyleGarren, Austin M., Michael Chad Bolding, Scott M. Barrett, Eric M. Hawks, Wallace Michael Aust, and Thomas Adam Coates. 2023. "A Comparison of Forest Biomass and Conventional Harvesting Effects on Estimated Erosion, Best Management Practice Implementation, Ground Cover, and Residual Woody Debris in Virginia" Biomass 3, no. 4: 403-421. https://doi.org/10.3390/biomass3040024