
Laccase and Biomass Production via Submerged Cultivation of Pleurotus ostreatus Using Wine Lees
by
 , ,
, ,
Georgios Bakratsas
 ,
,
Kyriakos Antoniadis
,
Panagiotis E. Athanasiou
,
Petros Katapodis
* and
Haralambos Stamatis
Biotechnology Laboratory, Department of Biological Applications and Technologies, University of Ioannina, 45110 Ioannina, Greece
*
Author to whom correspondence should be addressed.
Biomass 2024, 4(1), 1-22; https://doi.org/10.3390/biomass4010001
Submission received: 30 July 2023
/
Revised: 23 August 2023
/
Accepted: 16 October 2023
/
Published: 19 December 2023
(This article belongs to the Special Issue Fate and Migration of Biomass Products)
Abstract
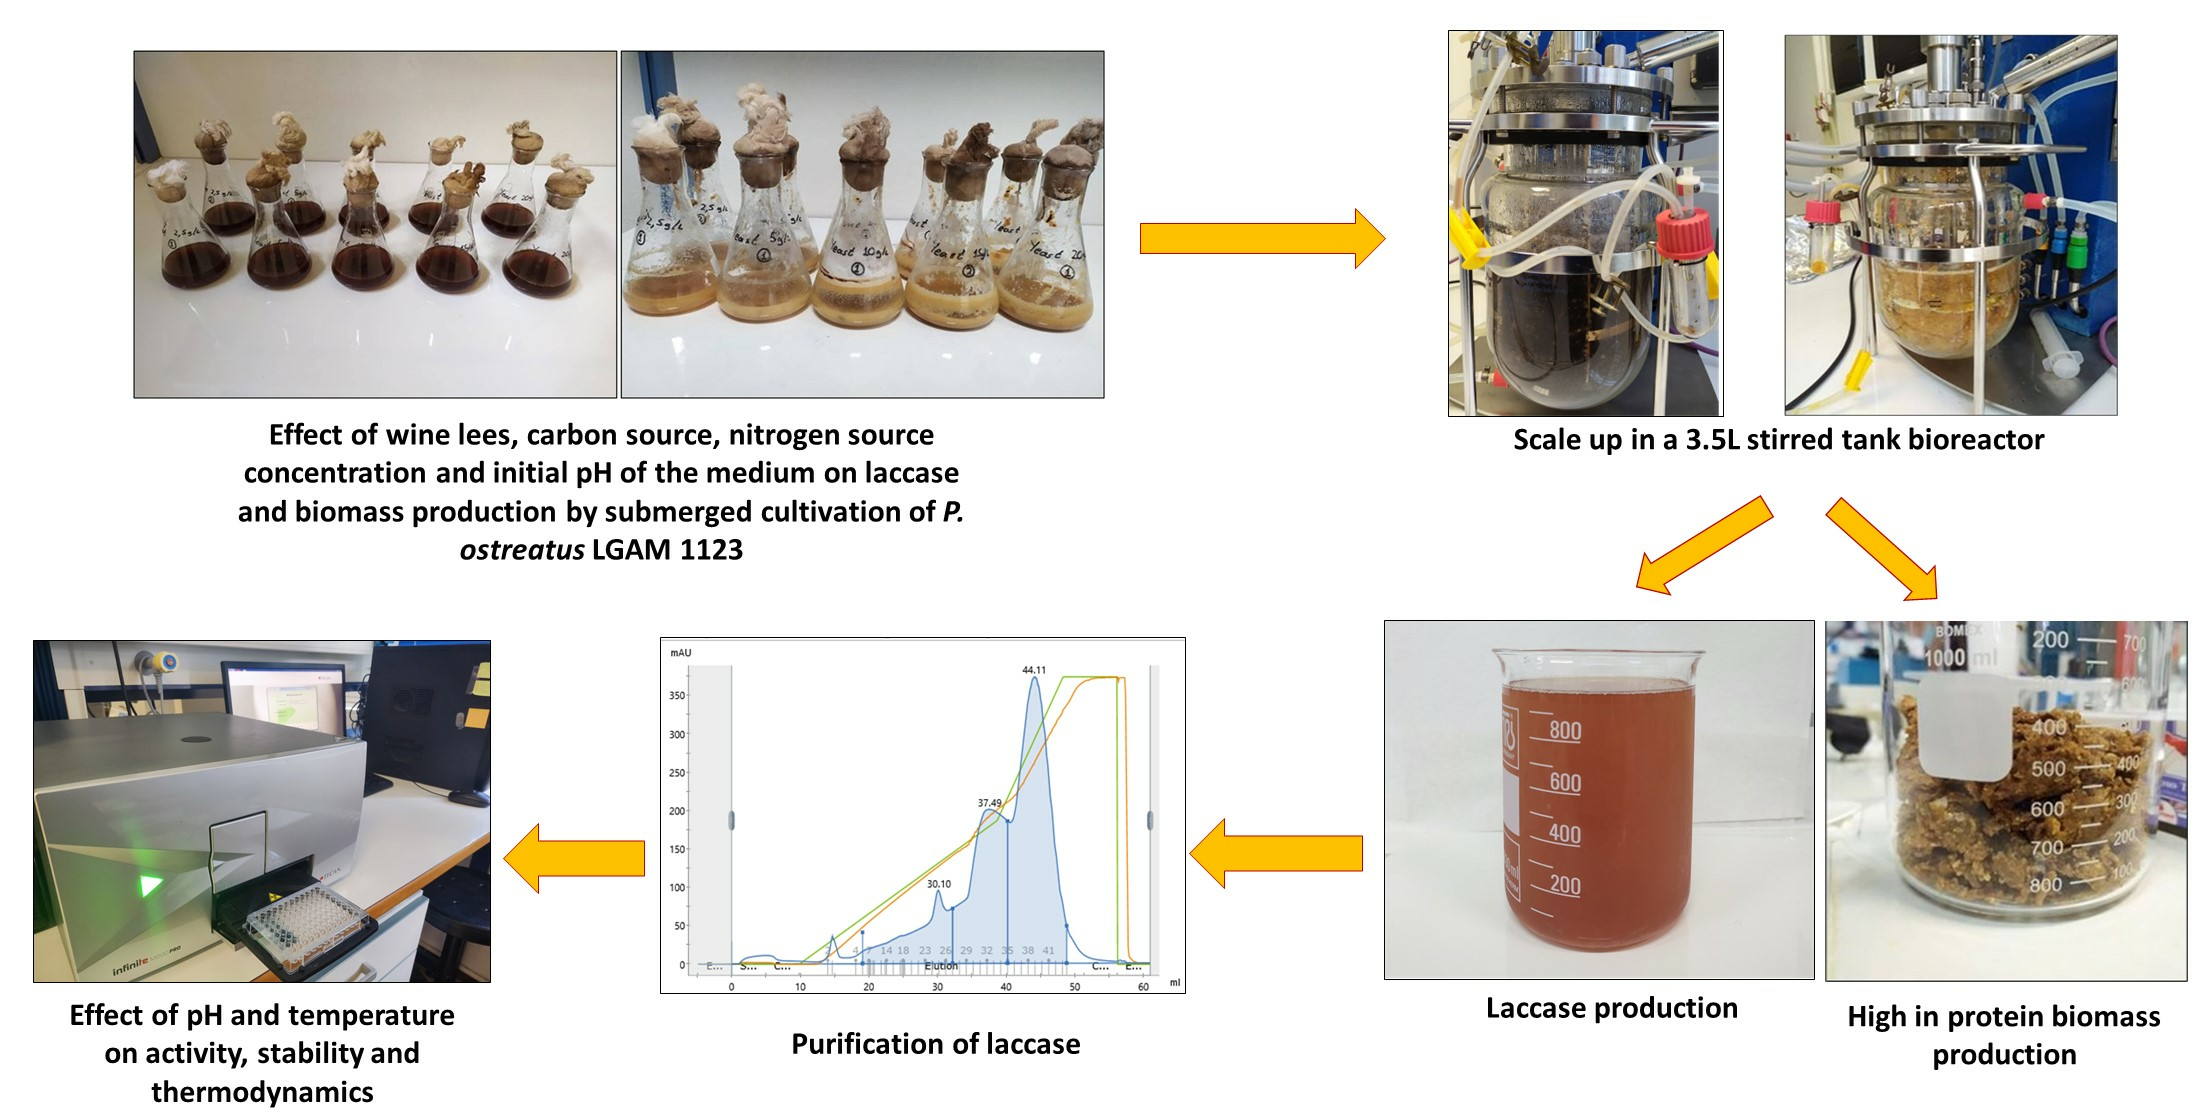
:Large quantities of wine lees are produced annually by the wine industry. The high phenolic content makes them unsuitable for disposal in the environment or animal feed without a suitable treatment. In this study, wine lees were treated by Pleurotus ostreatus in submerged cultivation, producing a high-value biomass and elevated levels of laccase, an important industrial enzyme. Biomass and laccase production reached 21 g/L and 74,000 Units/L, respectively, at the optimal conditions of initial pH 6.0, 20% v/v wine lees, 30 g/L glucose, and 20 g/L yeast extract, while decolorization and dephenolization rates of the waste were over 90%. The mycelial biomass was rich in proteins and essential amino acids reaching up to 43% and 16% per dry weight, respectively. Carbohydrates and lipids were the second richest bioactive compound in biomass, with values of 29.4 ± 2.7% and 29.5 ± 2.7%, respectively. The crude laccase in the culture supernatant was purified via a simple two-step purification procedure by 4.4-fold with a recovery of 44%. The molecular weight of the enzyme was determined to be 62 kDa via SDS electrophoresis. Enzyme activity was optimal at pH 5.0 and 70 °C. The activation energy of the enzyme was calculated at a value of 20.0 ± 0.2 kJ/mol. The pH stability and thermostability of the purified laccase were studied. The enzyme was remarkably stable at pH 8.0 and at temperatures up to 40 °C. The thermal inactivation energy of the enzyme was determined to be 76.0 ± 1.2 kJ/mol. The thermodynamic parameters (ΔH*, ΔG*, and ΔS*) for the thermal deactivation of the purified laccase at a temperature range of 20–60 °C were: 73.8 ≤ ΔH* ≤ 74.3 kJ·mol−1, 98.7 ≤ ΔG* ≤ 101.9 kJ·mol−1, and −90.5 ≤ ΔS* ≤ −84.3 J·mol−1·K−1. Wine lees could be ideal substrates of fungal cultivation for laccase production and biomass with a high protein content in an eco-friendlier way.

1. Introduction
Wine lees are the precipitate that remains in wine containers after fermentation, during storage, or after authorized treatment of wine. It represents 2–6% of the total wine volume produced by the industry and could also contain grape stalks, pomace, skins, seeds, and yeasts [1]. Wine lees contain high organic and inorganic contents, and in combination with the high water-soluble polyphenols and the low pH makes them a solid pollutant with high disposal costs for industries [1,2]. Also, these characteristics make them unsuitable for direct agricultural applications, and further biological treatments are needed [2]. Some of the properties of the wine lees are pH: 3.6–7.2, organic carbon (g/kg): 226–376, polyphenols (g/kg): 1.9–16.3, total phenolic content (mg/L): 29–766, proteins (% of dry matter): 14.5–15.7, lipids (% of dry matter) 5.0–5.9, sugars (% of dry matter): 3.5–4.8, and dietary fibers (% of dry matter): 21.2–21.9 [2]. The organic part of wine lees mainly contains yeast biomass that can be used as a nitrogen source for the production of fermentation media and has already been used to produce lactic acid and xylitol [3,4]. Furthermore, wine lees have already been used as a fermentation medium to produce high-protein yeast, with a protein content of 68.5 ± 1.0% [5].
The submerged cultivation of edible mushrooms has also been proposed for bioactive compounds and enzyme production using agro-industrial residues [6]. Specifically, Pleurotus ostreatus has already been cultivated for single-cell protein production on a fiber sludge enzymatic hydrolysate. The produced biomass presents a high carbohydrate content of 50.9 ± 2.8%, with an intracellular polysaccharide content of 34.7 ± 0.9%, and a high protein content of 38.0 ± 2.1% [7]. In addition, the same strain has been cultivated in an aspen wood chips hydrolysate, containing mostly glucose and xylose in a batch-stirred tank bioreactor. Biomass production levels of 25.0 ± 3.4 g/L and 54.5 ± 0.5% protein yields were achieved [8]. Except for protein production, the P. ostreatus submerged cultivation technique has already been used to produce lignocellulolytic extracellular enzymes that are crucial for lignin and cellulose degradation [1]. It has been proposed that this fungus could present b-glucosidase, xylanase, laccase, manganese-dependent peroxidase activity, and independent peroxidase activity, while the production is higher when agro-industrial wastes are used instead of using glucose as a carbon source [9]. In addition, there are also some examples where filamentous fungi, like P. ostreatus, have been exploited for winery waste’s bioconversion into value-added products, such as cellulase, xylanase, and pectinase from grape pomace, laccase from grape seeds, and laccase, peroxidase, endoglucanase, and endoxylanase from grape stalks [1]. Wine lees have not been used for laccase production via Pleurotus ostreatus, but the Trametes pubescens strain has been cultivated in a wine lees medium with a maximum laccase activity of 3.5 Units/mL.
Laccases are multi-copper oxidases produced via fungi, bacteria, and plants. They catalyze the oxidation of various aromatic substrates with the reduction of molecular oxygen to water [10]. Laccases present a wide range of industrial applications, such as food processing of wastes, decolorization of dyes in the textile industry, bioremediation of soils, biosensor technology, organic synthesis of medications, and delignification and brightening of pulp paper [11]. Especially in the food industry, laccase is used as additives in food and beverages processing, wine and beer stabilization, fruit juice processing, and baking [12]. The P. ostreatus genome includes twelve laccase genes, but only six have been characterized. These are POXA1b (lacc6), POXA1w, POXA2, POXA3a (lacc2), POXA3b, and POXC [13]. A study for the expression of laccase genes in submerged and solid-state cultivation of P. ostreatus revealed that different genes are over-expressed in each cultivation technique. The Lacc2 and Lacc10 genes were highly expressed in the submerged cultures [13]. Laccase production via submerged cultivation of P. ostreatus has already been achieved with and without using agro-industrial by-products. The addition of copper sulfate in the cultivation medium resulted in a 13.5 Units/mL laccase activity, whereas 12 Units/mL was achieved using corn cob as a carbon source. The highest laccase activity of 45 Units/mL was obtained from P. ostreatus cultivation using 20 g/L glucose and 5 g/L orange peels in the growth medium, whereas a lower laccase activity of 30 Units/mL was obtained when orange peels were replaced with tea [14].
In this study, the effect of wine lees on biomass and laccase production were investigated via the submerged cultivation of P. ostreatus LGAM 1123. A biomass with high protein content and essential amino acids were produced, while laccase revealed high activity at the optimized medium. This is the first time that wine lees were used for P. ostreatus submerged cultivation to produce high value biomass and laccase, an enzyme valuable for industrial applications. In addition, biochemical and thermodynamic characterizations of purified laccase were achieved.
2. Materials and Methods
2.1. Chemicals and Reagents
In this study, analytical-grade chemicals were used. Potato dextrose agar (PDA) and yeast extract were purchased from Neogen Europe Ltd. (Ayr, UK). Manganese (II) sulfate heptahydrate (MnSO4·7H2O), zinc sulfate heptahydrate (ZnSO4·7H2O), glucose, thiamine hydrochloride (vitamin B1), ethylenediaminetetraacetic acid disodium salt dihydrate (EDTA-Na2·2H2O) (Sodium EDTA), 2,2′-Azino-bis(3-ethylbenzothiazoline-6-sulfonic acid) diammonium salt (ABTS), bovine serum albumin (BSA), Folin–Ciocalteu phenol reagent, and copper (II) sulfate pentahydrate (CuSO4 5H2O) were all supplied from Sigma-Aldrich (St. Louis, MO, USA). Di-potassium hydrogen phosphate anhydrous (dibasic) (K2HPO4), sodium nitrate (NaNO3), potassium chloride (KCl), potassium nitrate (KNO3), ammonium chloride (NH4Cl), and ammonium sulfate ((NH4)2SO4) were all supplied from AppliChem (Darmstadt, Germany). Ferrous sulfate heptahydrate (FeSO4·7H2O), magnesium sulfate anhydrous (MgSO4), calcium chloride dihydrate (CaCl2·2H2O), ammonium molybdate tetrahydrate ((NH4)6Mo7O2·4H2O), and sucrose were supplied from Fluka (Buchs, Switzerland). Sodium hydroxide (NaOH) was purchased from Panreac (Barcelona, Spain). The Pierce™ BCA protein assay kit, acetonitrile, chloroform, and methanol was supplied from Thermo Fisher Scientific (Waltham, MA, USA). Sodium carbonate (Na2CO3) and sulfuric acid were supplied from Honeywell Riedel-de Haën (Charlotte, NC, USA). Hydrochloric acid (HCl) was supplied from Merck (KGaA Darmstadt, Germany).
2.2. Microorganism and Wine Lees
In this study, P. ostreatus LGAM 1123 was kindly provided from the Laboratory of General and Agricultural Microbiology (Agricultural University of Athens, Athens, Greece). The strain was kept at 4 °C on potato dextrose agar (PDA, Neogen Europe Ltd. (Ayr, UK)) Petri dishes.
Wine lees were provided from a local winery from the red wine grapes variety Merlot: Syrah: Cabernet (60:30:10% v/v). The wine lees were centrifugated at 4000 rpm for 10 min, and the supernatant was used as a substrate for fungal growth. The characteristics of wine lees are shown in Table 1 below.
2.3. Media and Growth Conditions
For preculture preparation, a sterilized cutter was used to transfer 1 cm of the PDA Petri culture dishes into a 250 mL Erlenmeyer flask. The flasks contained 100 mL of the basal medium (g/L), as shown in Table 2 below, except for the addition of CuSO4 5H2O.
The precultures were incubated in a rotary shaker for twelve days at 150 rpm and 28 °C. After that time, five mL of culture was transferred into a new flask containing a modified basal medium for glucose, yeast extract, and wine lees, as described in each experiment below, and with the addition of CuSO4 5H2O (as shown in Table 2). Before heat sterilization (121 °C for 20 min), the initial pH of the medium was adjusted to 6.0 with the addition of 1 M NaOH. At different times, samples were withdrawn from the culture and centrifugated (4000 rpm for 10 min) to separate the biomass from the supernatant. The supernatant and biomass were kept for further analyses.
2.4. Effect of Different Initial pH
To investigate the effect of initial pH on biomass and laccase production, decolorization of wine lees, and dephenolization of wine lees, the initial pH of the culture was adjusted to 5, 6, 7, and 8. The growth medium was the same as outlined in Table 2, with the addition of 10% (v/v) wine lees. At certain time intervals, samples were withdrawn from the cultures for measurements of biomass production, reducing sugar consumption, laccase activity, decolorization of wine lees, and dephenolization of wine lees. This experiment lasted 8 days.
2.5. Effect of Wine Lees Concentration
To find the optimal wine lees concentration, different concentrations of wine lees (5%, 10%, 20%, 40%, 60%, and 100% v/v) were added to the growth medium outlined in Table 2. The initial pH of the cultures was adjusted to 6. At certain time intervals, samples were withdrawn from the cultures for measurements of biomass production, reducing sugar consumption, laccase activity, decolorization of wine lees, and dephenolization of wine lees. This experiment lasted 17 days.
2.6. Effect of Yeast Extract Concentration
Different yeast extract (YE) concentrations (2.5 g/L, 5 g/L, 10 g/L, 15 g/L, and 20 g/L) were added to the growth medium outlined in Table 2. The concentration of wine lees used was 20% v/v and the initial pH was adjusted to 6. At certain time intervals, samples were withdrawn from the cultures for measurements of biomass production, reducing sugar consumption, laccase activity, decolorization of wine lees, and dephenolization of wine lees. This experiment lasted 10 days.
2.7. Effect of Glucose Concentration
Different glucose concentrations (10 g/L, 20 g/L, 30 g/L, 40 g/L, and 50 g/L) were added to the growth medium outlined in Table 2. The wine lees and yeast extract concentrations were 20% v/v and 20 g/L, respectively. The initial pH was adjusted to 6. At certain time intervals, samples were withdrawn from the cultures for measurements of biomass production, reducing sugar consumption, laccase activity, decolorization of wine lees, and dephenolization of wine lees. This experiment lasted 14 days.
2.8. Scale up for Biomass and Laccase Production in a 3.5 L Stirred Tank Bioreactor
A 3.5 L stirred tank bioreactor (Ralph, Bioengineering) was used to scale up the process at the optimum growth conditions. The wine lees concentration, yeast extract concentration, glucose concentration, and pH were 20% (v/v), 20 g/L, 30 g/L, and 6, respectively. The rest of the nutrients were supplemented, as shown in Table 2. The working volume was 2 L; the inoculum size was 5% (v/v) from a well grown pre-culture. The agitation was adjusted to 200 rpm; aeration was employed at 2 vvm, and a temperature of 28 °C was also maintained. This experiment lasted 11 days, and biomass production, reducing sugars, laccase activity, dephenolization, and decolorization were measured in the final samples.
2.9. Purification of the Produced Laccase
The crude laccase was precipitated using ammonium sulfate. For this procedure, 80% ammonium sulfate was added to the supernatant containing the produced laccase and incubated overnight at 4 °C. After incubation, the sample was centrifugated at 9500 rpm for 10 min at 4 °C. The supernatant was discarded, whereas the precipitated laccase was diluted to 10 mM phosphate buffer pH 8.0.
Further purification of the enzyme was achieved after desalting the above-precipitated enzyme using a PD-10 desalting column packed with Sephadex G-25 (GE Healthcare, Chicago, IL, USA), using Tris-HCl pH 8.0 buffer. After that, the enzyme was purified using anion exchange chromatography on a fast protein liquid chromatography (FPLC) system (ÄKTA pure, Cytiva, Marlborough, MA, USA). The protein was separated using a HiTrap Q HP column (Cytiva, USA) and washed with 10 column volumes of a 50 mM Tris-HCL pH 8.0 buffer, and the bound proteins were eluted at a flow rate of 1 mL/min with a two-step linear gradient ranging from 0 to 0.5 M NaCl for 30 column volumes and from 0.5 M to 1 M NaCl for 10 column volumes.
2.10. SDS-Polyacrylamide Gel Electrophoresis
The Weber and Osborn method was used to check the homogeneity of the enzyme preparation via SDS-PAGE. The separating gel was 12% acrylamide in 1.5 mol/L Tris·HCl buffer pH 8.8, and the stacking gel was 5% acrylamide in 0.1 mol/L Tris·HCl buffer pH 6.8. The molecular weight marker used was supplied from Nippon Genetics, with different colors and distinct size ranges from 6.5 kDa to 270 kDa. The gel was run at a constant current of 20 mA in a Tris/glycine running buffer using a BIO-RAD miniPROTEAN tetra system (Bio-Rad Laboratories, Inc., Hercules, CA, USA). The gel was stained with Coomassie blue and destained to observe the protein bands. The molecular weight of the enzyme was determined according to the band of the marker [15].
2.11. Biomass and Reducing Sugars Determination
Two different methods were used for biomass determination. The first was that of filtration under vacuum, through a Millipore cellulose filter (0.45 μm), as previously described [7]. When the viscosity of the sample was very high, the freeze-drying method was employed, as previously described [8]. Reducing sugar concentrations were determined using the DNSA method by Miller, as previously described [8,16].
2.12. Intracellular and Secreted Protein Estimation
For intracellular protein estimation, 2 mg of lyophilized biomass was disrupted via ultrasonication at 40% intensity (8 kHz) and 80% pulse for 6 min, as previously described [7,8]. Proteins were quantified using the BCA method (Pierce™ BCA protein assay kit), according to the manufacturer’s instructions, using bovine serum albumin as a standard [17,18]. Essential amino acids were determined after chemical hydrolysis of the biomass with 6 M HCl at 110 °C using dabsyl derivatives and quantified in an HPLC unit (Shimadzu, Kyoto, Japan) with a photodiode array detector and a reversed-phase C18 column (mBondapack, Waters Ireland), as described previously [7]. Secreted, in the supernatant, protein was estimated using the Bradford method. Specifically, 200 μL of the supernatant was added to 800 μL of Bradford reagent. After 10 min of incubation at room temperature, the absorbance was measured at 595 nm using a UV–visible spectrophotometer JASCO, V-730, (JASCO, Easton, MD, USA. The protein was quantified using a bovine serum albumin standard curve [19,20].
2.13. Determination of Laccase Activity
Laccase activity was determined using the ABTS oxidation method. A stock of 20 mM ABTS was prepared and kept in the dark. A proper volume of supernatant and acetate buffer (100 mM and pH 4.58) were mixed and added to a 96-well microplate. ABTS was added to the wells to reach a final concentration of 2 mM in the reaction. The reaction was measured at 405 nm (εABTS+ = 36,000 M−1 cm−1) for 10 min at 35 °C using a microplate spectrophotometer (Multiskan Spectrum, Thermo Fisher Scientific, Waltham, MA, USA). One unit was defined as the amount of the enzyme that oxidizes 1 µmol of ABTS per min. The enzyme activity was expressed in Units/mL of culture [21,22].
2.14. Thermal and pH Activity of the Produced Enzyme
The optimum temperature and pH that were used for laccase activity determination were chosen from the thermal and pH activity experiments. The optimum temperature of the enzyme was measured using the ABTS oxidation method at 20 °C, 25 °C, 30 °C, 35 °C, 40 °C, 45 °C, 50 °C, 55 °C, 60 °C, 65 °C, 70 °C, 75 °C, 80 °C, and 85 °C using a UV–visible spectrophotometer (JASCO, V-730). The optimum pH was studied using the ABTS oxidation method and buffers with different pH levels (4, 4.5, 5, 6, and 7), and the enzyme activity was determined as described in Section 2.13. The laccase activity was expressed as relative activity (%), in which the maximum enzyme activity was expressed as 100%.
2.15. pH Stability and Thermal Stability of the Purified Laccase
To determine the pH stability of the produced laccase, the enzyme was diluted in buffers with different pH levels (4, 5, 6, 7, and 8) and incubated at 28 °C and 150 rpm. Samples were withdrawn at specific times to determine the remaining activity of the enzyme through the ABTS oxidation method, as described in Section 2.13.
The thermal stability of the produced enzyme was tested using different temperatures, 4 °C, 20 °C, 30 °C, 40 °C, 50 °C, and 60 °C, diluted in buffer with pH 4.5. Samples were withdrawn at specific times to determine the remaining activity of the enzyme through the ABTS oxidation method, as described in Section 2.13.
Storage stability of the produced enzyme was tested with a dilution of the enzyme at a buffer of pH 8.0 and incubation at 4 °C. Samples were withdrawn at specific times to determine the remaining activity of the enzyme through the ABTS oxidation method, as described in Section 2.13.
2.16. Determination of Activation Energy
The activation energy (Ea) was determined using the data from the thermal activity experiment at temperatures ranging from 20 °C to 60 °C and using the Arrhenius plot curve. The slope of a linear plot of 1/T vs. Ln[Vo] is equal to Ea/R, where R is the gas constant (8.314 J/K mol) [23].
2.17. Thermodynamics of Laccase Stability
Data from thermal stability were used to estimate the deactivation rate constant (kd). The deactivation rate was related to the residual activity. kd was calculated from the plots of Ln([E]t/[E]0) vs. t, where t is the incubation time, [E]0 is the initial enzyme activity, and [E]t is the enzyme activity at time ‘t’. The energy (E(a)d) involved in the deactivation process was calculated from the slope of a linear plot of 1/T vs. Ln(kd), as described in a previous section [23].
The half-life and the value for the time needed to maintain 10% of the initial activity (D) were calculated using the below equations:
Laccase inactivation can be described using a first-order kinetics model, and the thermodynamic parameters of inactivation were determined through Eyring’s absolute rate equation derived from the transition state theory [24]. For ΔH*, ΔG*, and ΔS*, where ΔH* is the enthalpy of inactivation (J mol−1), ΔS* is the entropy of inactivation (J mol−1 K−1), and ΔG* is the free energy of inactivation, the following equations apply:
where T is the absolute temperature (K), h is the Planck’s constant (6.626 × 10⁻³⁴ J s), k is the Boltzmann’s constant (1.38 × 10⁻²³ J K−1), and R is the universal gas constant (8.314 J mol−1 K−1).
2.18. Decolorization of Wine Lees
Decolorization was estimated with measurement of the absorbance of the supernatant at 525 nm. Equal volumes (100 μL) of sample and phosphate buffer 50 mM pH 7.0 were added in a 96-well microplate, and a microplate spectrophotometer (Multiskan Spectrum, Thermo Fisher Scientific, Waltham, USA) was used to measure the absorbance [25]. The decolorization rate was estimated according to the equation below:
2.19. Determination of Total Phenolic Content
Total phenolic content was measured using the Folin–Ciocalteu method, as described by Box et al., 1983, with slight modifications [26]. Specifically, 165 μL of ddH2O was mixed with 5 μL of culture supernatant in a 96-well microplate. Ten microliters of Folin–Ciocalteu reagent was added, and the microplate was incubated for 3 min at room temperature. After the incubation, 20 μL of 20% Na2CO3 was added, and the microplate was incubated for 1 h in the dark. The absorbance was measured at 725 nm using a Multiskan Spectrum (Thermo Fisher Scientific, Waltham, MA, USA) microplate spectrophotometer. Blank samples were also prepared using 170 μL of ddH2O, 10 μL of Folin–Ciocalteu reagent, and 20 μL of 20% Na2CO3. Total phenolic concentrations (mg/mL) were estimated using a gallic acid standard curve. The dephenolization rate was estimated according to the equation below:
2.20. Total Lipid Estimation
2.21. Carbohydrate Estimation
Total carbohydrate extraction from fungal biomass was achieved according to a modified protocol by Visca et al. [7,28]. Intracellular polysaccharides were extracted from 5 mg of biomass, similar to the intracellular protein extraction procedure described in Section 2.12. The supernatant with the intracellular components was precipitated with absolute ethanol (1:4 v/v) and incubated overnight at 4 °C. After incubation, the samples were centrifugated at 6000 rpm for 10 min and the supernatant was discarded. Total carbohydrates, as well as intracellular polysaccharides (IPSs), were determined using the phenol–sulfuric acid assay according to Dubois et al., using glucose as a standard [29].
2.22. Statistical Analysis
The data were expressed as mean ± standard deviation from experiments that were conducted in triplicate. All statistical analyses were conducted using IBM SPSS statistics (version 28.0.1.0, IBM Corporation, Armonk, NY, USA), using the one-way analysis of variance (ANOVA) statistical test with Tukey’s multiple range test (with p-values < 0.05 being regarded as significant).
3. Results
3.1. Effect of Growth Medium Initial pH on Biomass and Laccase Production
Laccase production, biomass production, glucose consumption, decolorization, and dephenolization of wine lees after 8 days of cultivation are presented in Table 3. The fungus grew well at all pHs tested, with the best growth observed at pH levels 5 and 6, reaching a maximum biomass production up to 11.4 g/L dry weight. Laccase activity was also reached at 12.4 ± 1.5 Units/mL and 10.2 ± 1.5 Units/mL at initial pH levels of 6 and 5, respectively. Glucose consumption was 62% and 54% at initial pH levels of 5.0 and 6.0, respectively. The decolorization of wine lees was higher at pH 7 (82.3%), while dephenolization was better at the initial pH of 5 (77.4%).
3.2. Effect of Wine Lees Concentration
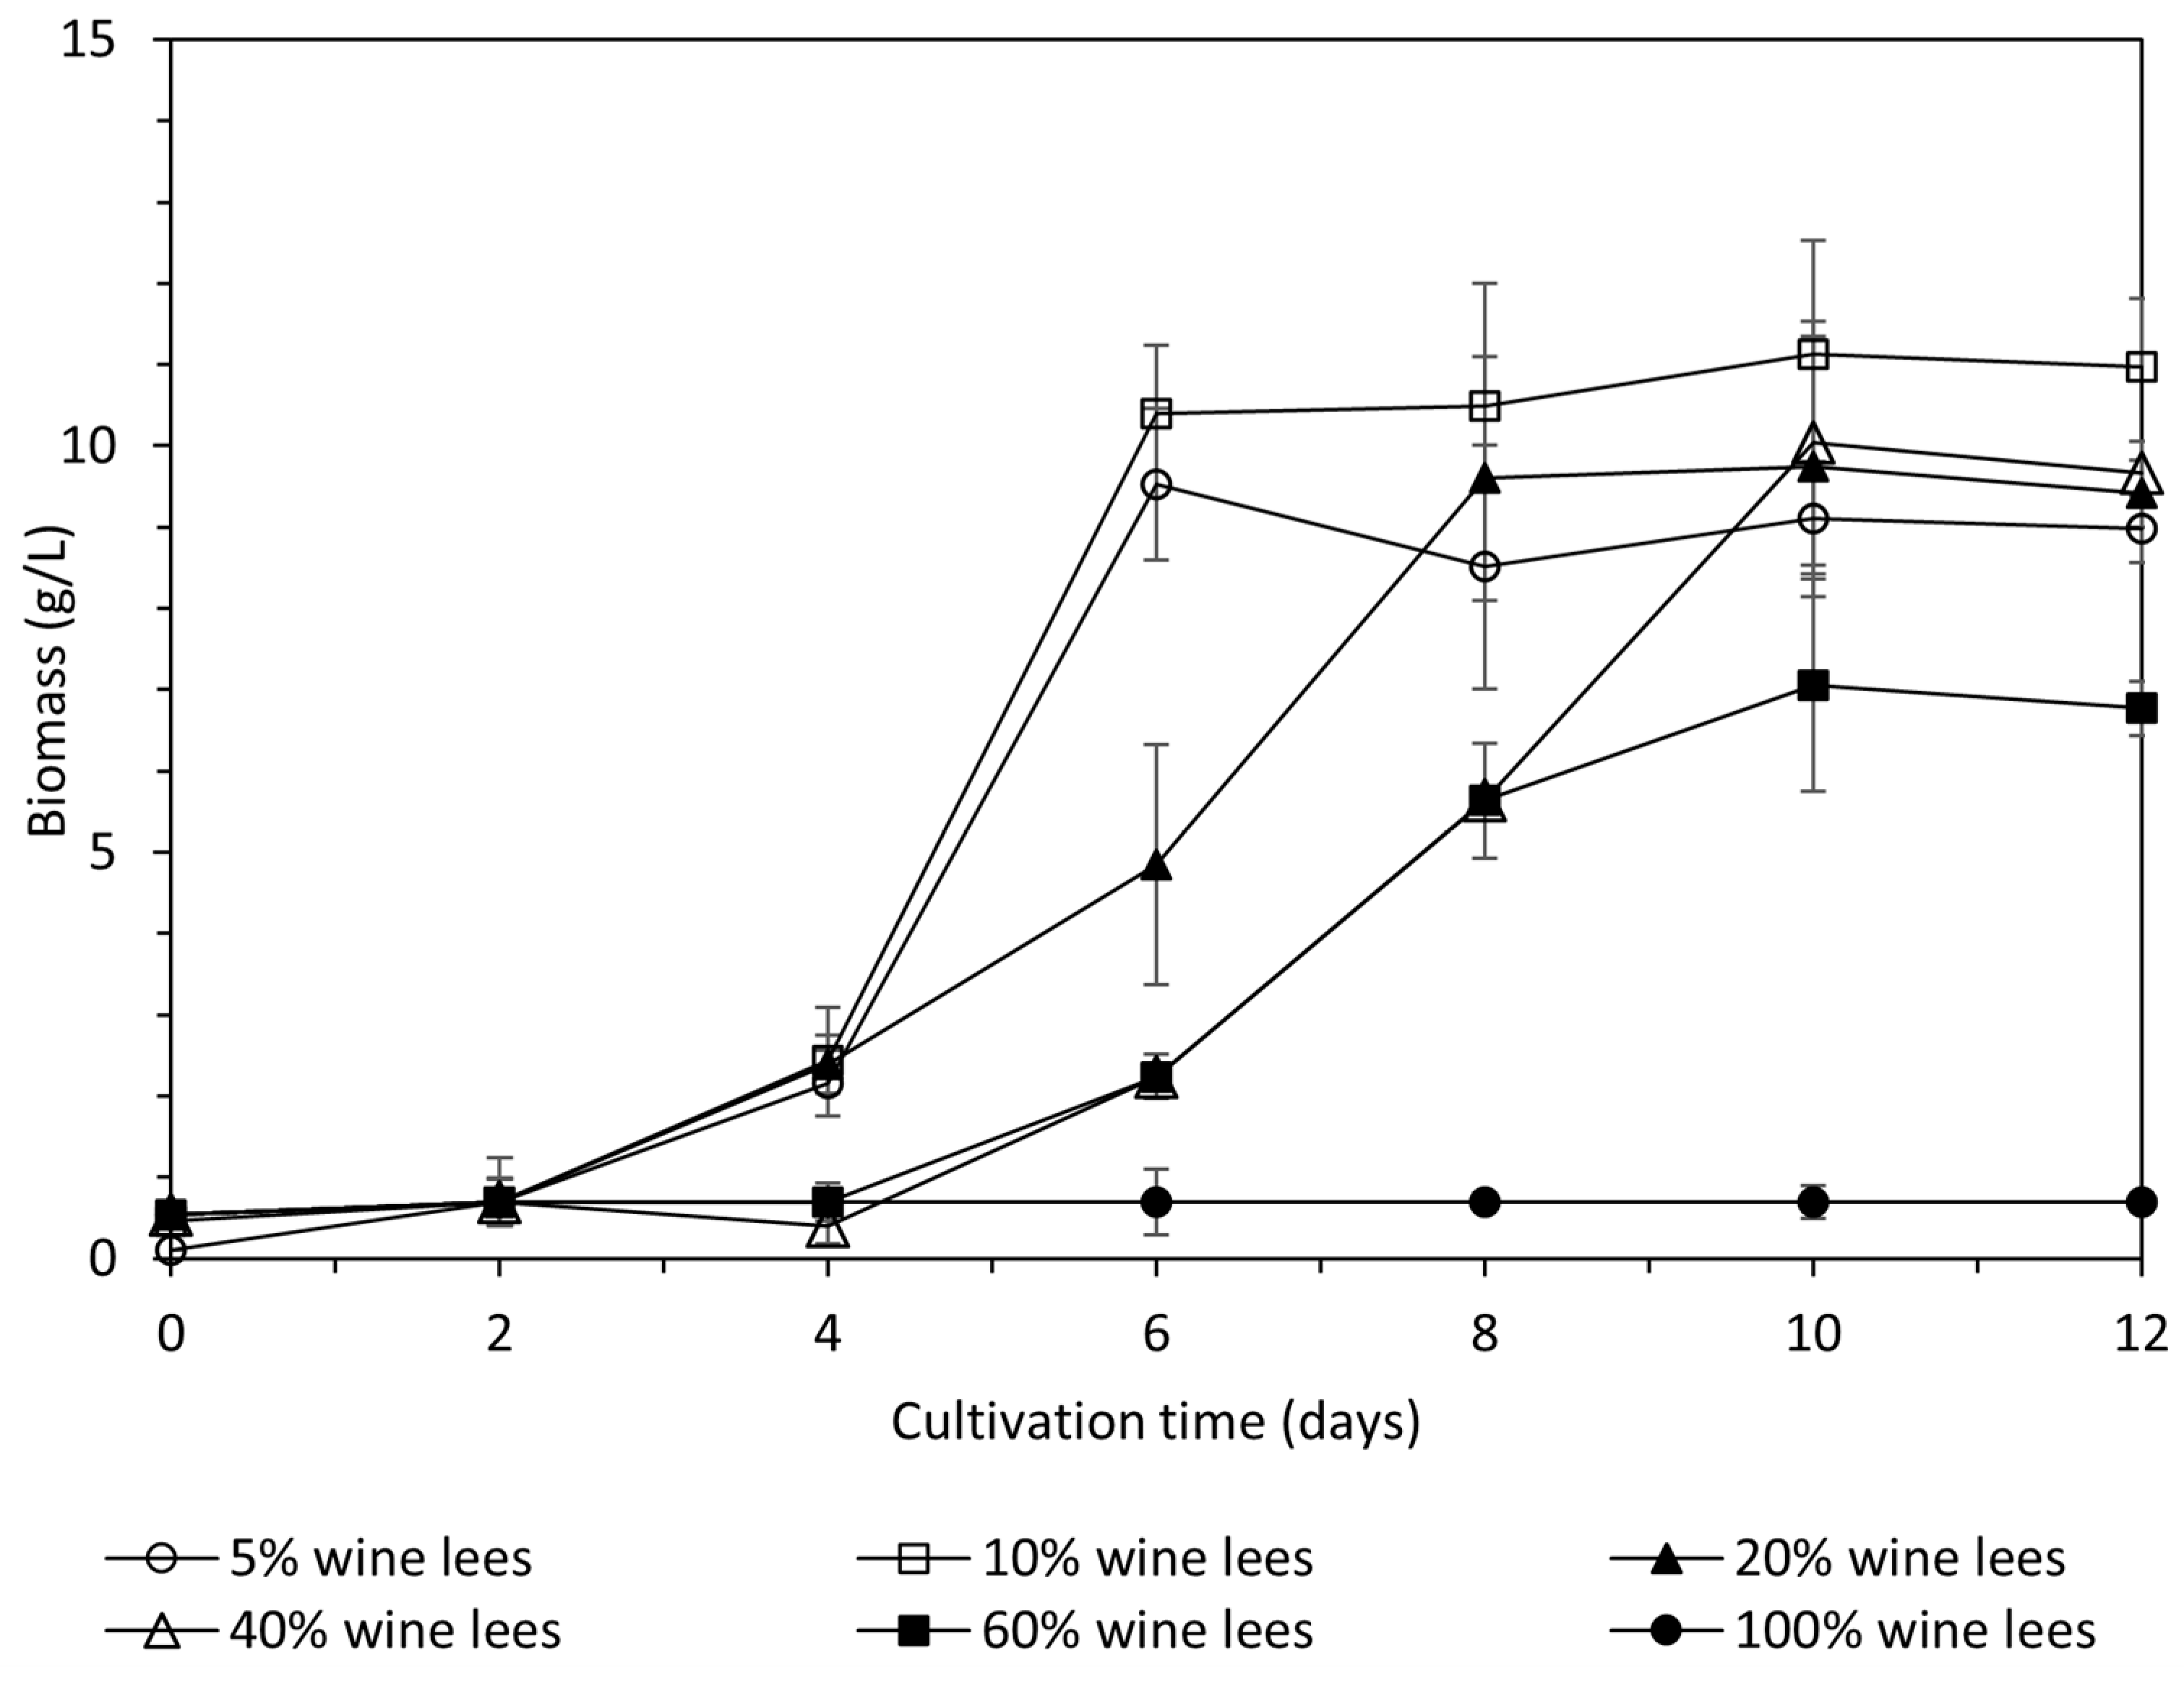
As shown in Figure 1, the fungus was capable to grow up to 60% (v/v) wine lees. After this point, an inhibition of growth was observed, whereas in 100% v/v condition growth was not observed. Biomass reached its highest value for 5% and 10% at day 6 of cultivation, with values of 9.52 ± 0.93 g/L and 10.40 ± 0.83 g/L, respectively. Concerning 20%, 40%, and 60% of wine lees concentration conditions, maximum values were observed on the 10th day of cultivation, with values of 9.75 ± 1.6 g/L, 10.0 ± 1.5 g/L, and 7.05 ± 1.3 g/L, respectively. The lag phase lasted for two days for 5%, 10%, and 20% wine lees concentrations conditions, whereas for 40% and 60%, these conditions lasted for four days.
Concerning laccase production, maximum laccase activity was observed at 20% v/v of wine lees concentration condition, with a value reaching 14.1 ± 0.1 Units/mL (p ≤ 0.05). The 40% v/v and 10% of wine lees concentrations follow, with values of 4.3 ± 2.4 and 6.3 ± 1.3, respectively (p ≥ 0.05) (Table 4). Glucose consumption was almost total when 5%, 10%, and 20% v/v of wine lees were used in the growth medium. In the other tested conditions, the consumption of glucose was less, while the wine lees concentration was increased in the cultivation medium. The decolorization and dephenolization of wine lees reached high values and were maximized under the 40% v/v condition, reaching values of 81.40 ± 0.07% and 83.20 ± 0.01%, respectively. The 20% and 40% v/v wine lee conditions follow, as shown in Table 4.
3.3. Effect of Yeast Extract Concentration
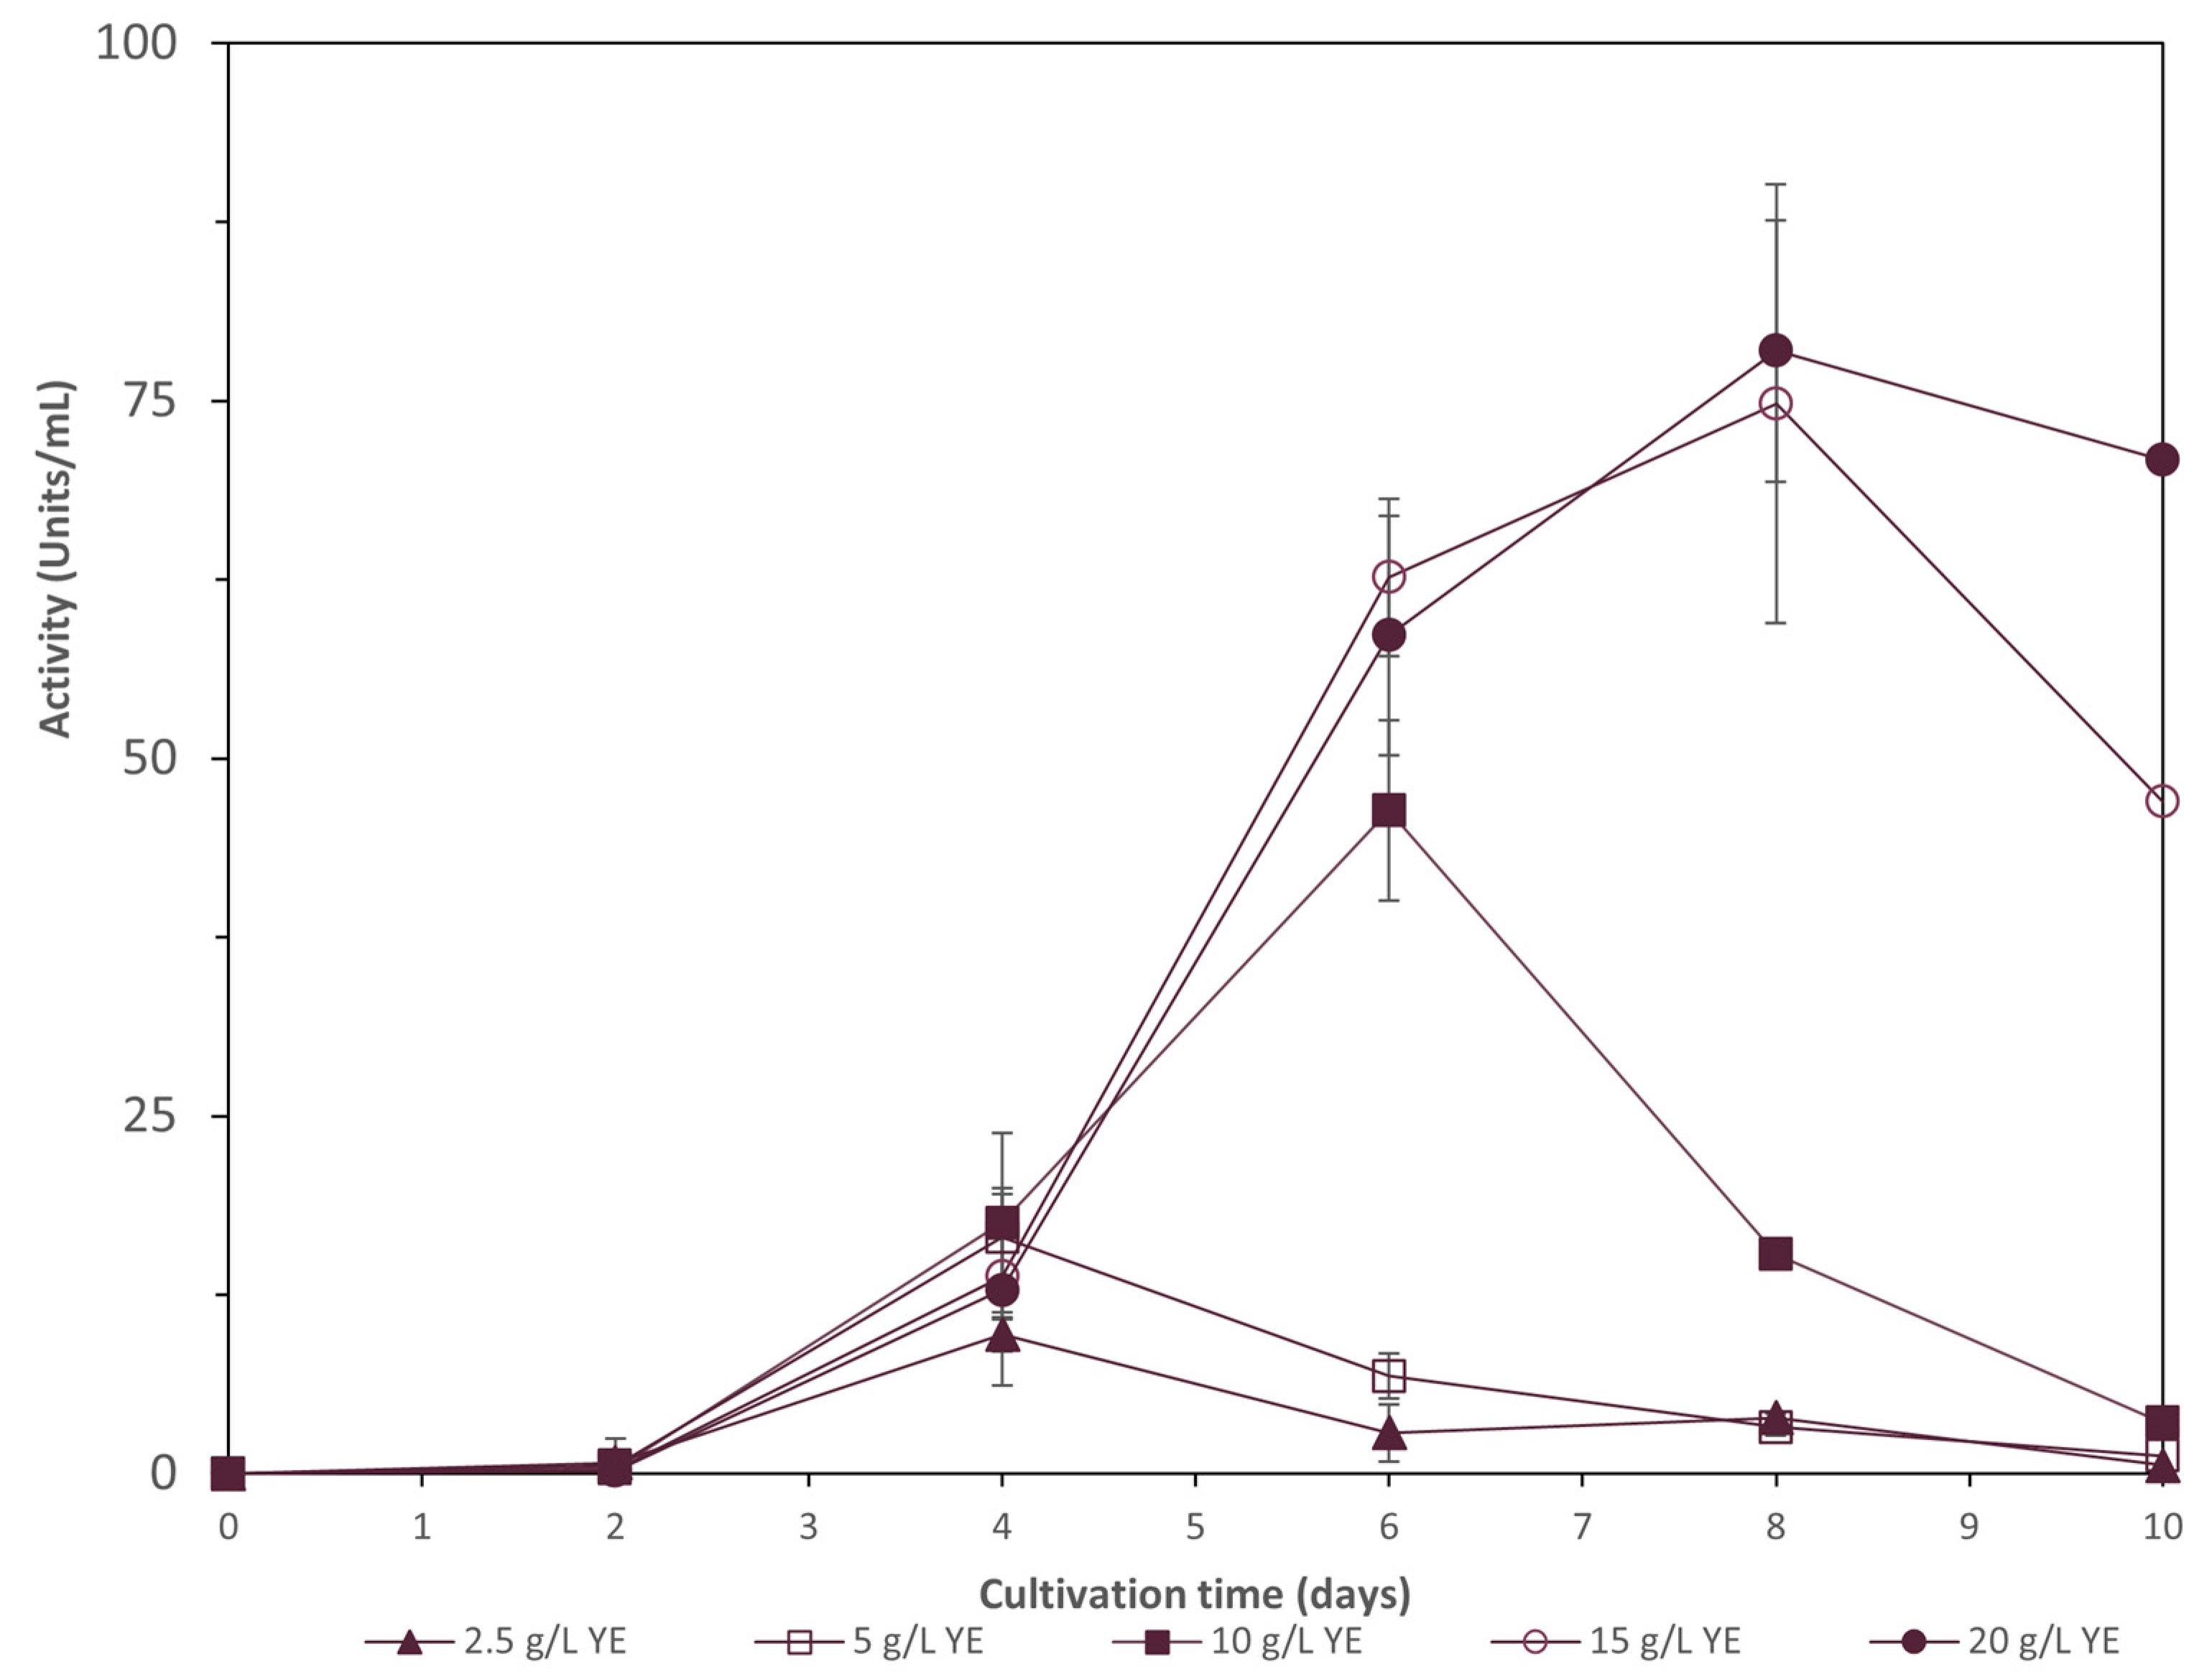
As shown in Figure 2, the fungus produced laccase after the first two days of cultivation. Laccase activity reached its maximum value for 20 g/L and 15 g/L YE on the 8th day of cultivation, with values up to 78.5 ± 8.4 Units/mL and 74.8 ± 5.5 Units/mL, respectively (p ≥ 0.05). After that time, the enzyme activity was slightly decreased. The YE concentration of 10 g/L reached a value of 46.4 ± 6.3 Units/mL after six days of cultivation, and after that time, laccase activity also decreased. YE concentrations of 2.5 and 5 g/L presented the lowest laccase activity.
Concerning biomass production, YE concentrations above 5 g/L favor biomass production, with a 20 g/L YE concentration being able to reach a value of 20.9 ± 0.5 g/L, as shown in Table 5. Glucose was almost totally consumed for all the cultivation conditions except for the 2.5 g/L YE condition. The decolorization of wine lees was at its maximum at 2.5 g/L YE (93.2 ± 0.025%) followed by the 5 g/L and 10 g/L YE concentrations, with values over 90%. Dephenolization of wine lees reached its maximum value when 20 g/L YE was added in the cultivation medium (91.70 ± 0.01%), but in all the studied conditions the dephenolization rate was high (above 85.7%).
3.4. Effect of Glucose Concentration
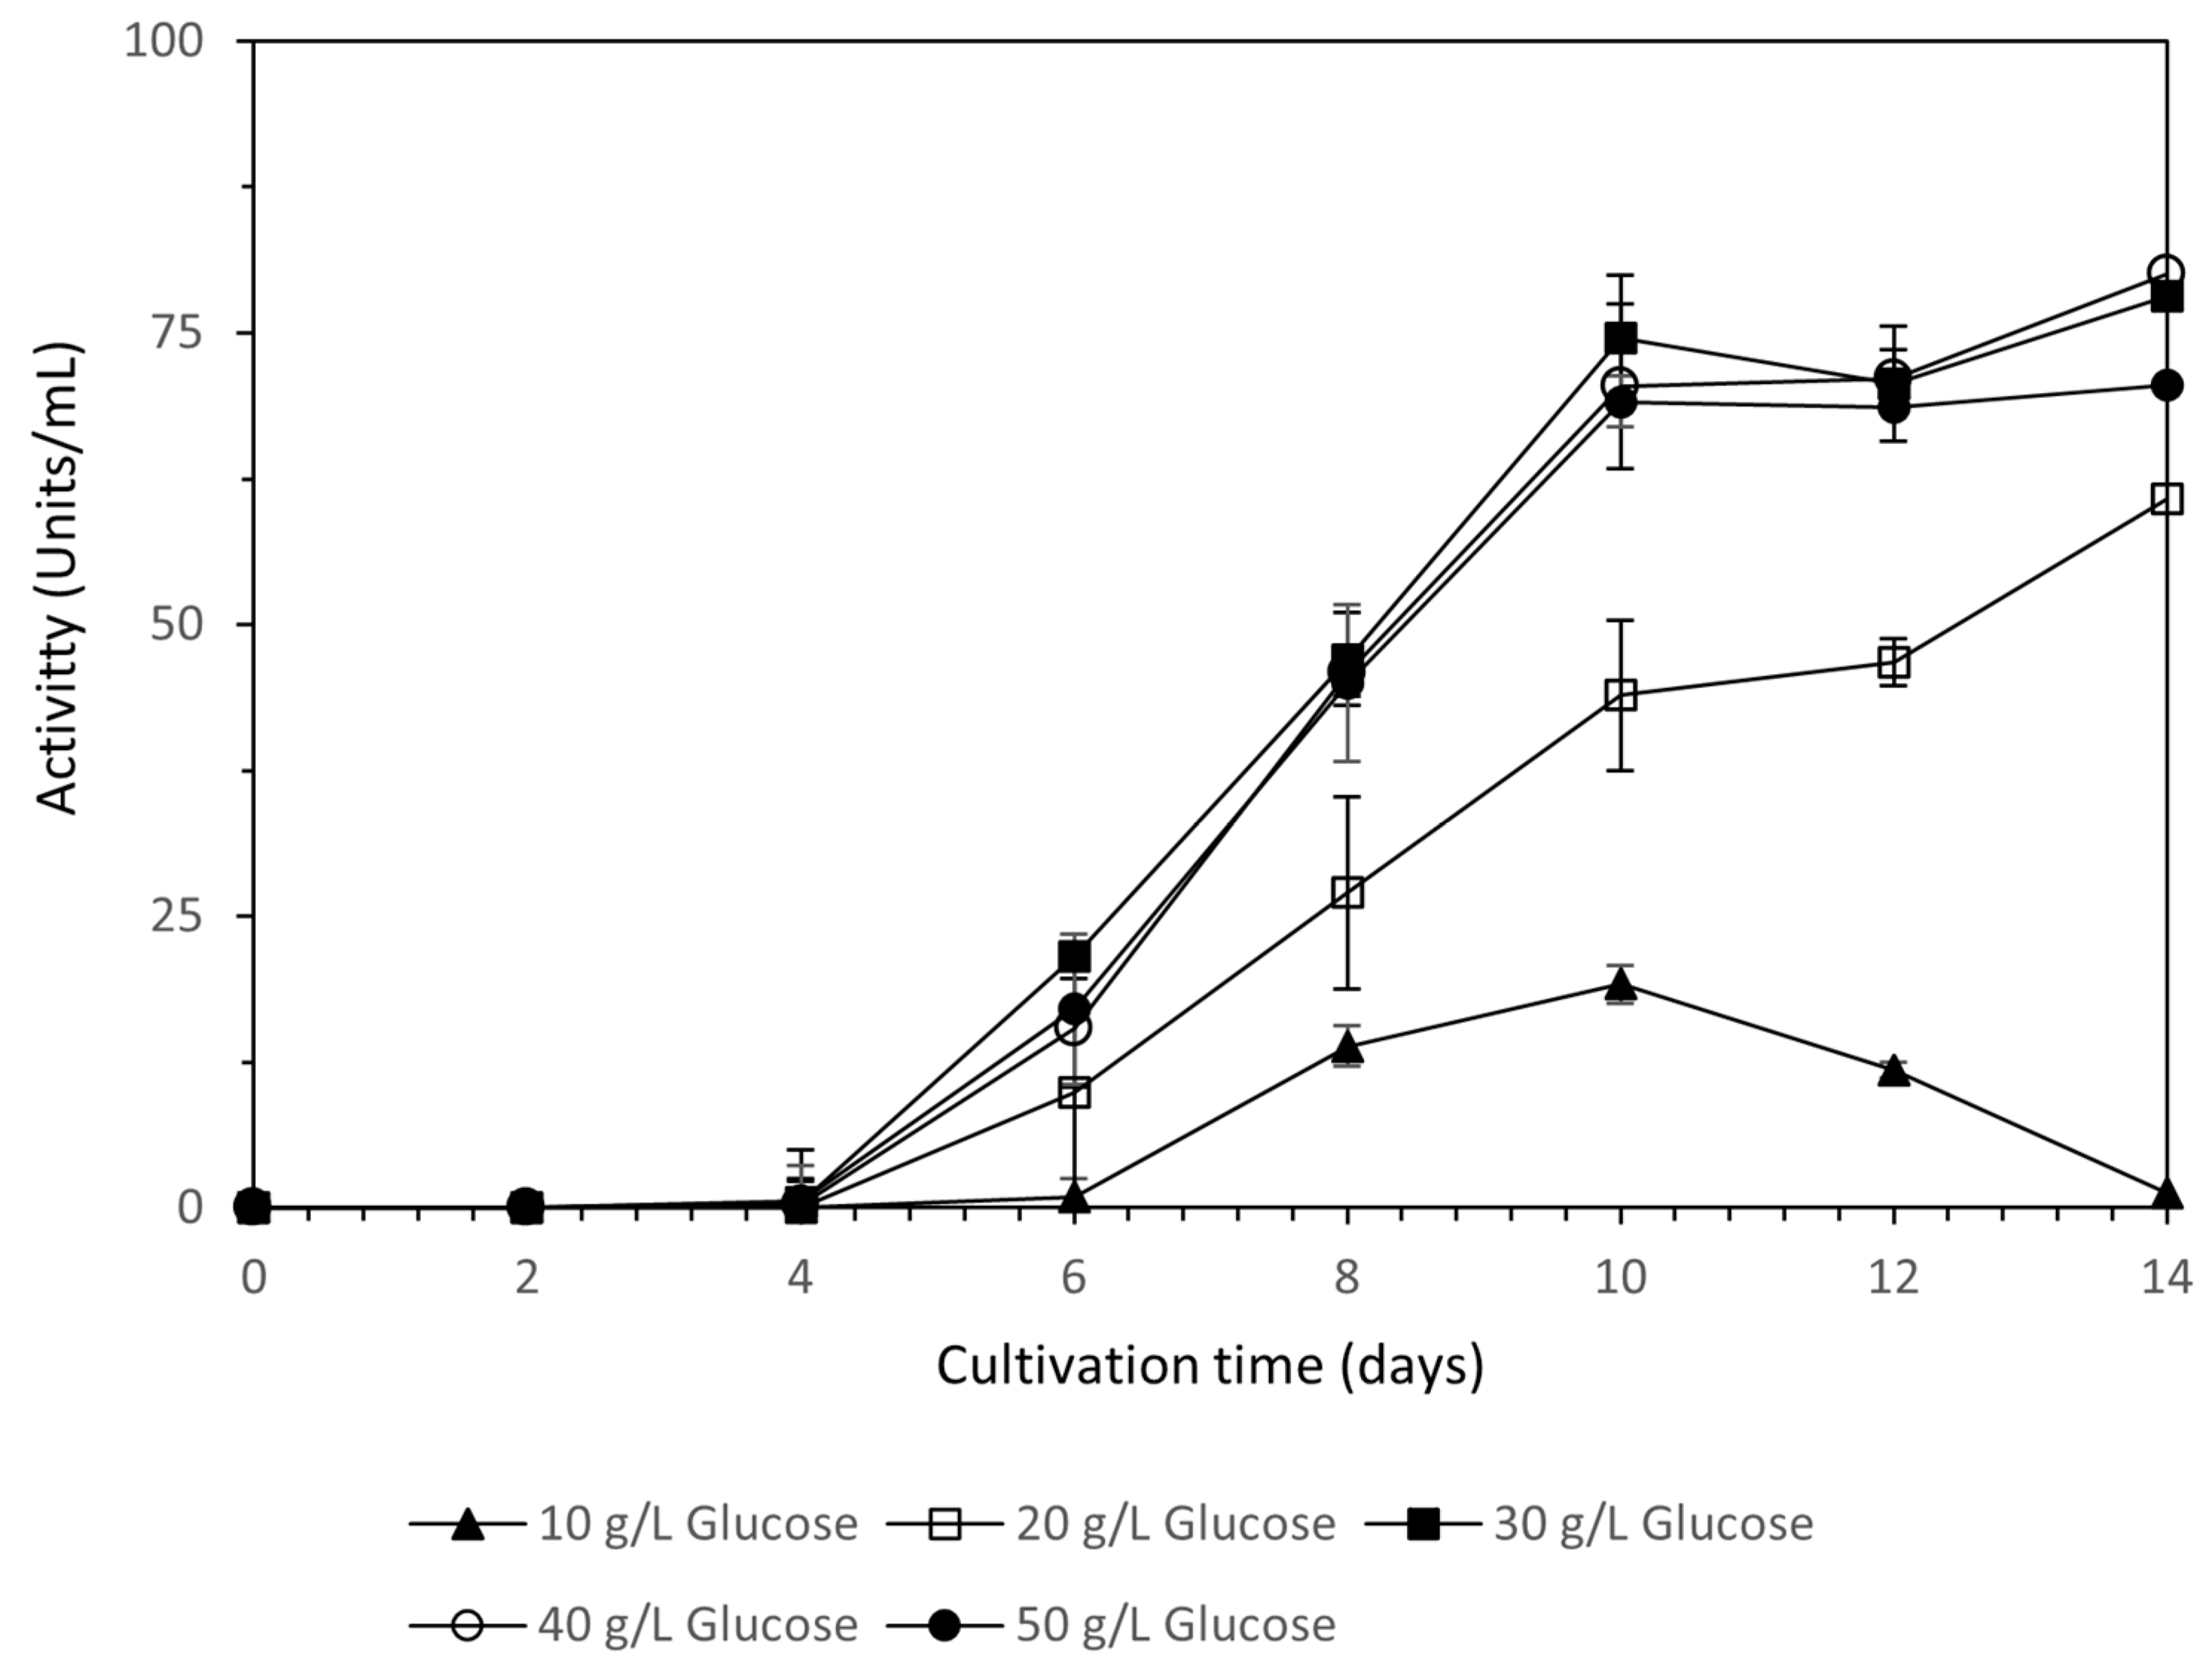
Laccase production was at its maximum for the 30 g/L, 40 g/L, and 50 g/L glucose concentrations, reaching a maximum value up to 74.6 ± 4.0 Units/mL on the 10th day of cultivation (Figure 3). After that time, laccase activity remained stable. A glucose concentration of 20 g/L reached its maximum value after 14 days of cultivation (60.8 ± 2.0 Units/mL), whereas 10 g/L presented the lowest activity, reaching a maximum value of 19.1 ± 1.8 Units/mL, and after that, enzyme activity was decreased.
As shown in Table 6, P. ostreatus LGAM 1123 produces over 20 g per liter of biomass for all glucose concentrations tested except from 10 g/L. Biomass production was at its maximum, with no statistically significant differences for the 40 g/L and 50 g/L concentrations, with values of 23.6 ± 1.0 g/L and 24.6 ± 2.5 g/L, respectively. A glucose concentration of 30 g/L followed, reaching a value of 20.7 ± 1.3 g/L. Glucose was almost totally consumed for all the cultivation conditions except 50 g/L. Decolorization was high for all the cultivation conditions and reached values up to 97.30 ± 0.01% for glucose concentrations above 30 g/L. Dephenolization was also high for all the cultivation conditions, with values over 85.70 ± 0.01% having been measured.
3.5. Scale up in a 3.5 L Stirred Tank Bioreactor
A two liters medium containing 20% (v/v) wine lees, 20 g/L yeast extract, and 30 g/L glucose was used. The maximum laccase activity of 54.8 ± 1.8 Units/mL was obtained on the 11th day of cultivation. Glucose was almost totally consumed (95.8 ± 0.01%), and biomass production reached a maximum value of 22.5 ± 0.5 g/L. Decolorization and dephenolization reached values of 97.2 ± 0.5% and 80.80 ± 0.02%, respectively. The final biomass composition revealed a high content of protein in the mycelium (42.8 ± 2.4%) with 16.4 ± 0.1% of essential amino acids, as shown in Table 7. Carbohydrates and lipids were the second most abundant compounds in the produced biomass.
3.6. Biochemical and Thermodynamic Characterizations of Purified Laccase
3.6.1. Laccase Purification
A part of the produced laccase (0.5 L) was precipitated with 80% ammonium sulfate to partially purify the enzyme. The recovery of the precipitated laccase was 98.6% with a purification yield of 1.4, as shown in Table 8. The anion exchange purification step resulted in a 4.4 purification fold and in a 44.3% recovery. As depicted in Figure S1 in the Supplementary Materials, laccase before anion exchange purification presented a couple of bands, with the main band observed at ~62 kDa. The presence of a single band in the anion lanes 1 and 2 clearly indicated that the enzyme preparation is pure after the anion exchange purification step, and the determined relative molecular weight was ~62 kDa. The FPLC chromatograph for purification of laccase by HiTrap Q HP (Cytiva, USA) is presented in Figure S2.
3.6.2. Effect of pH and Temperature on Laccase Activity
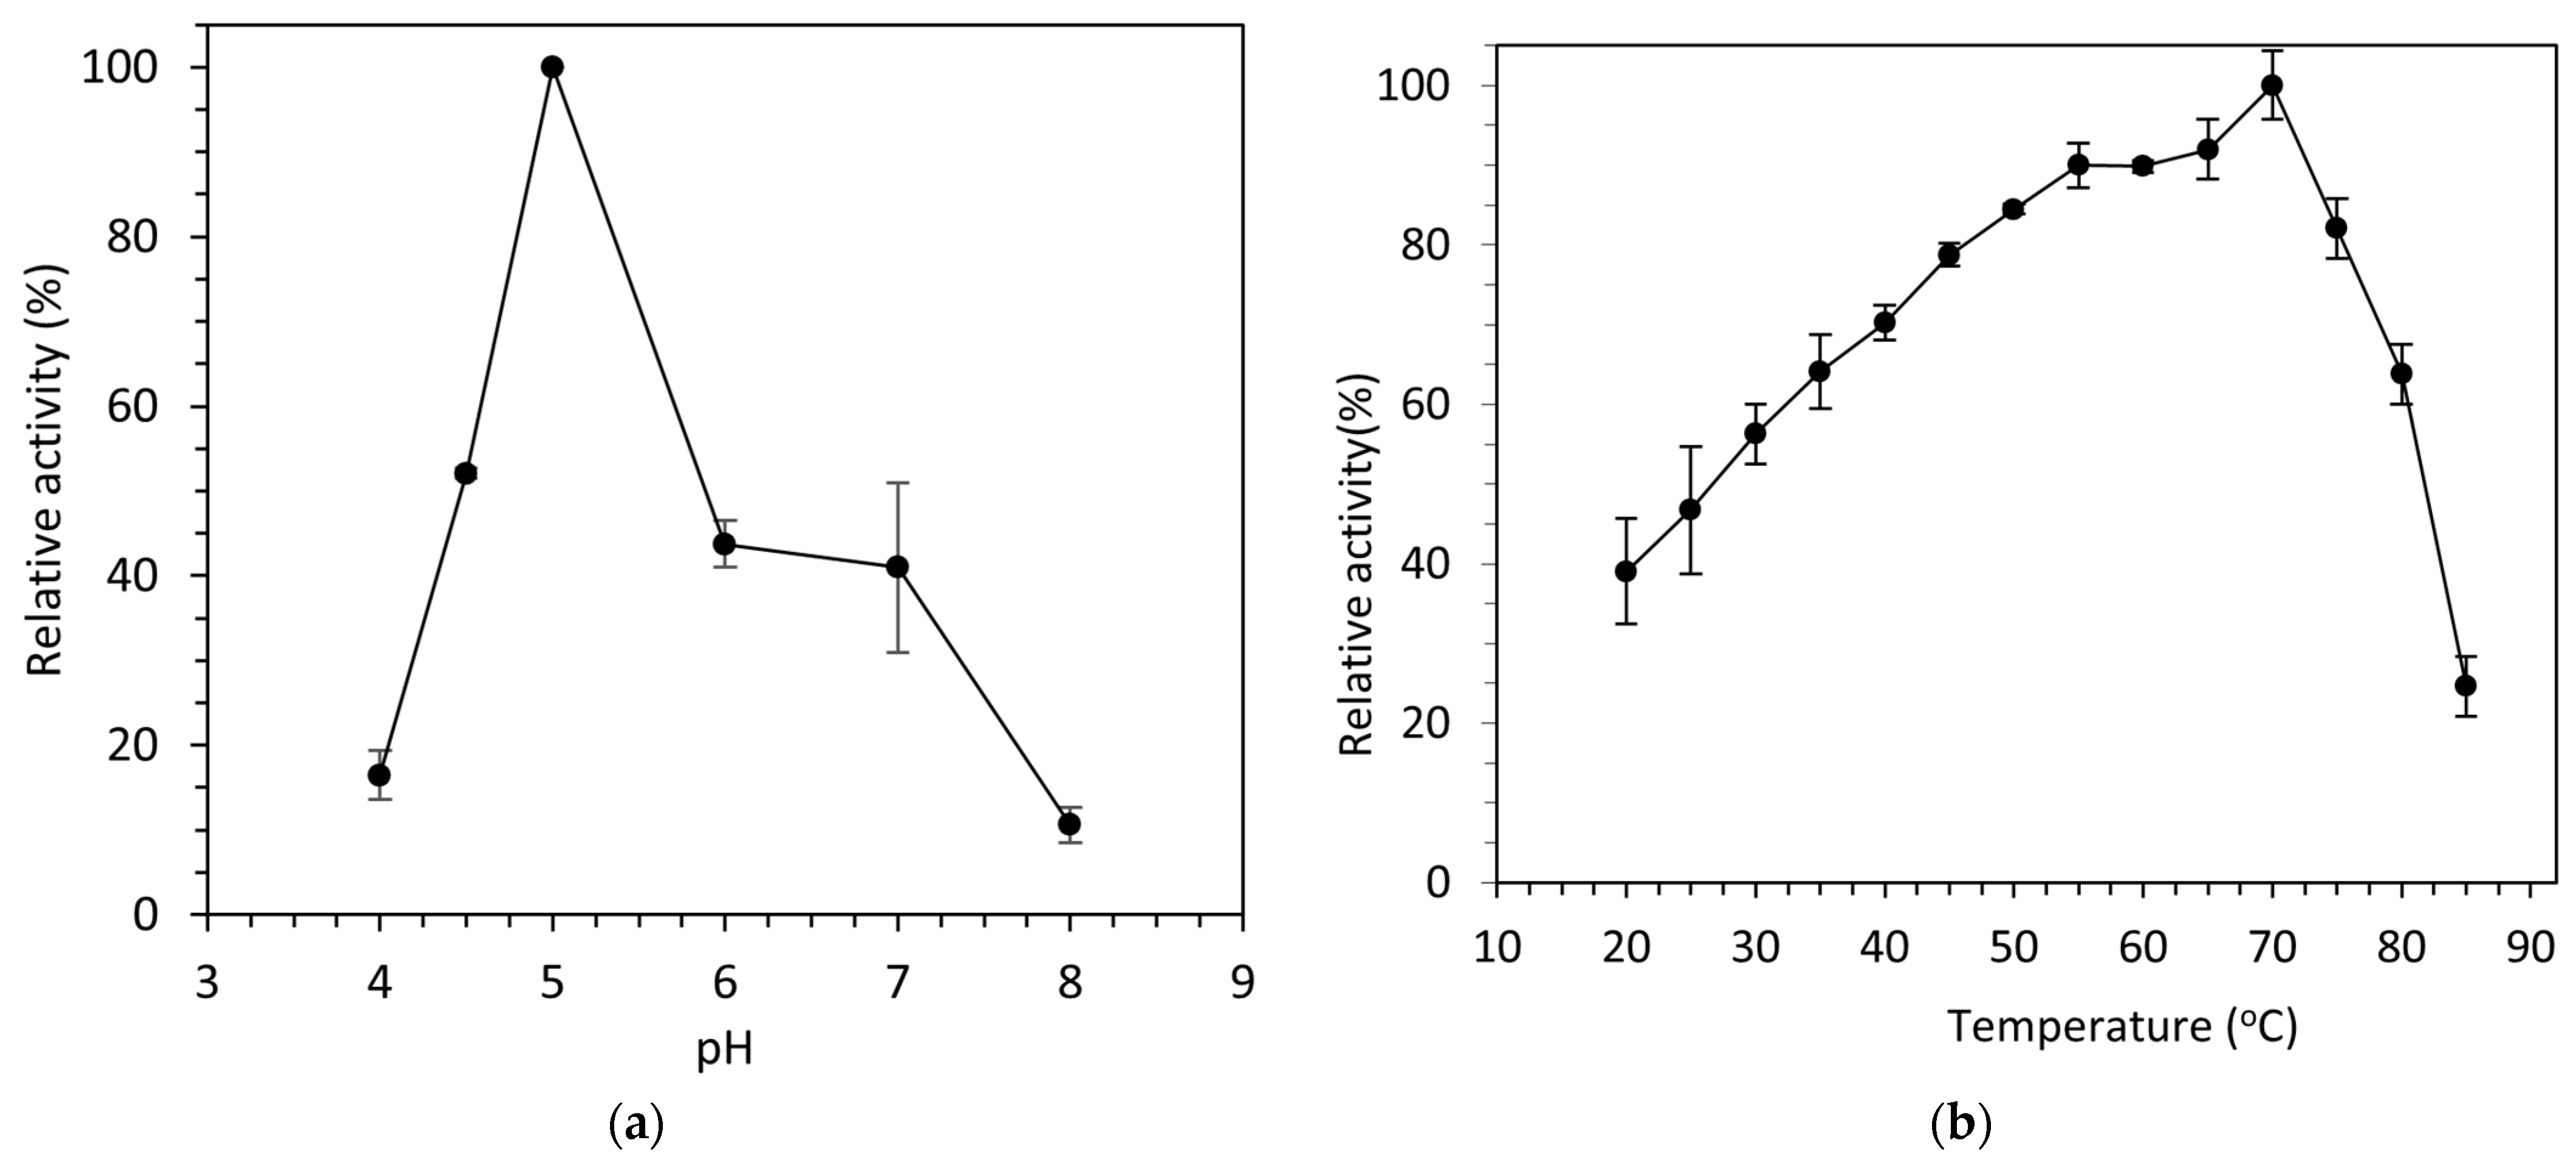
The optimum pH of laccase activity was 5.0. At pH 6.0, the activity decreased to more than 50% of the optimal activity, while at pH levels 8 and 4, the enzyme activity decreased by 83% and 90%, respectively (Figure 4a). The optimum temperature for laccase activity, as shown in Figure 4b, was 70 °C. The temperatures close to this value maintained high rates, with values of 89.8 ± 0.8% and 90.0 ± 2.8% for 60 °C and 55 °C having been measured, respectively.
3.6.3. Thermostability and pH Stability
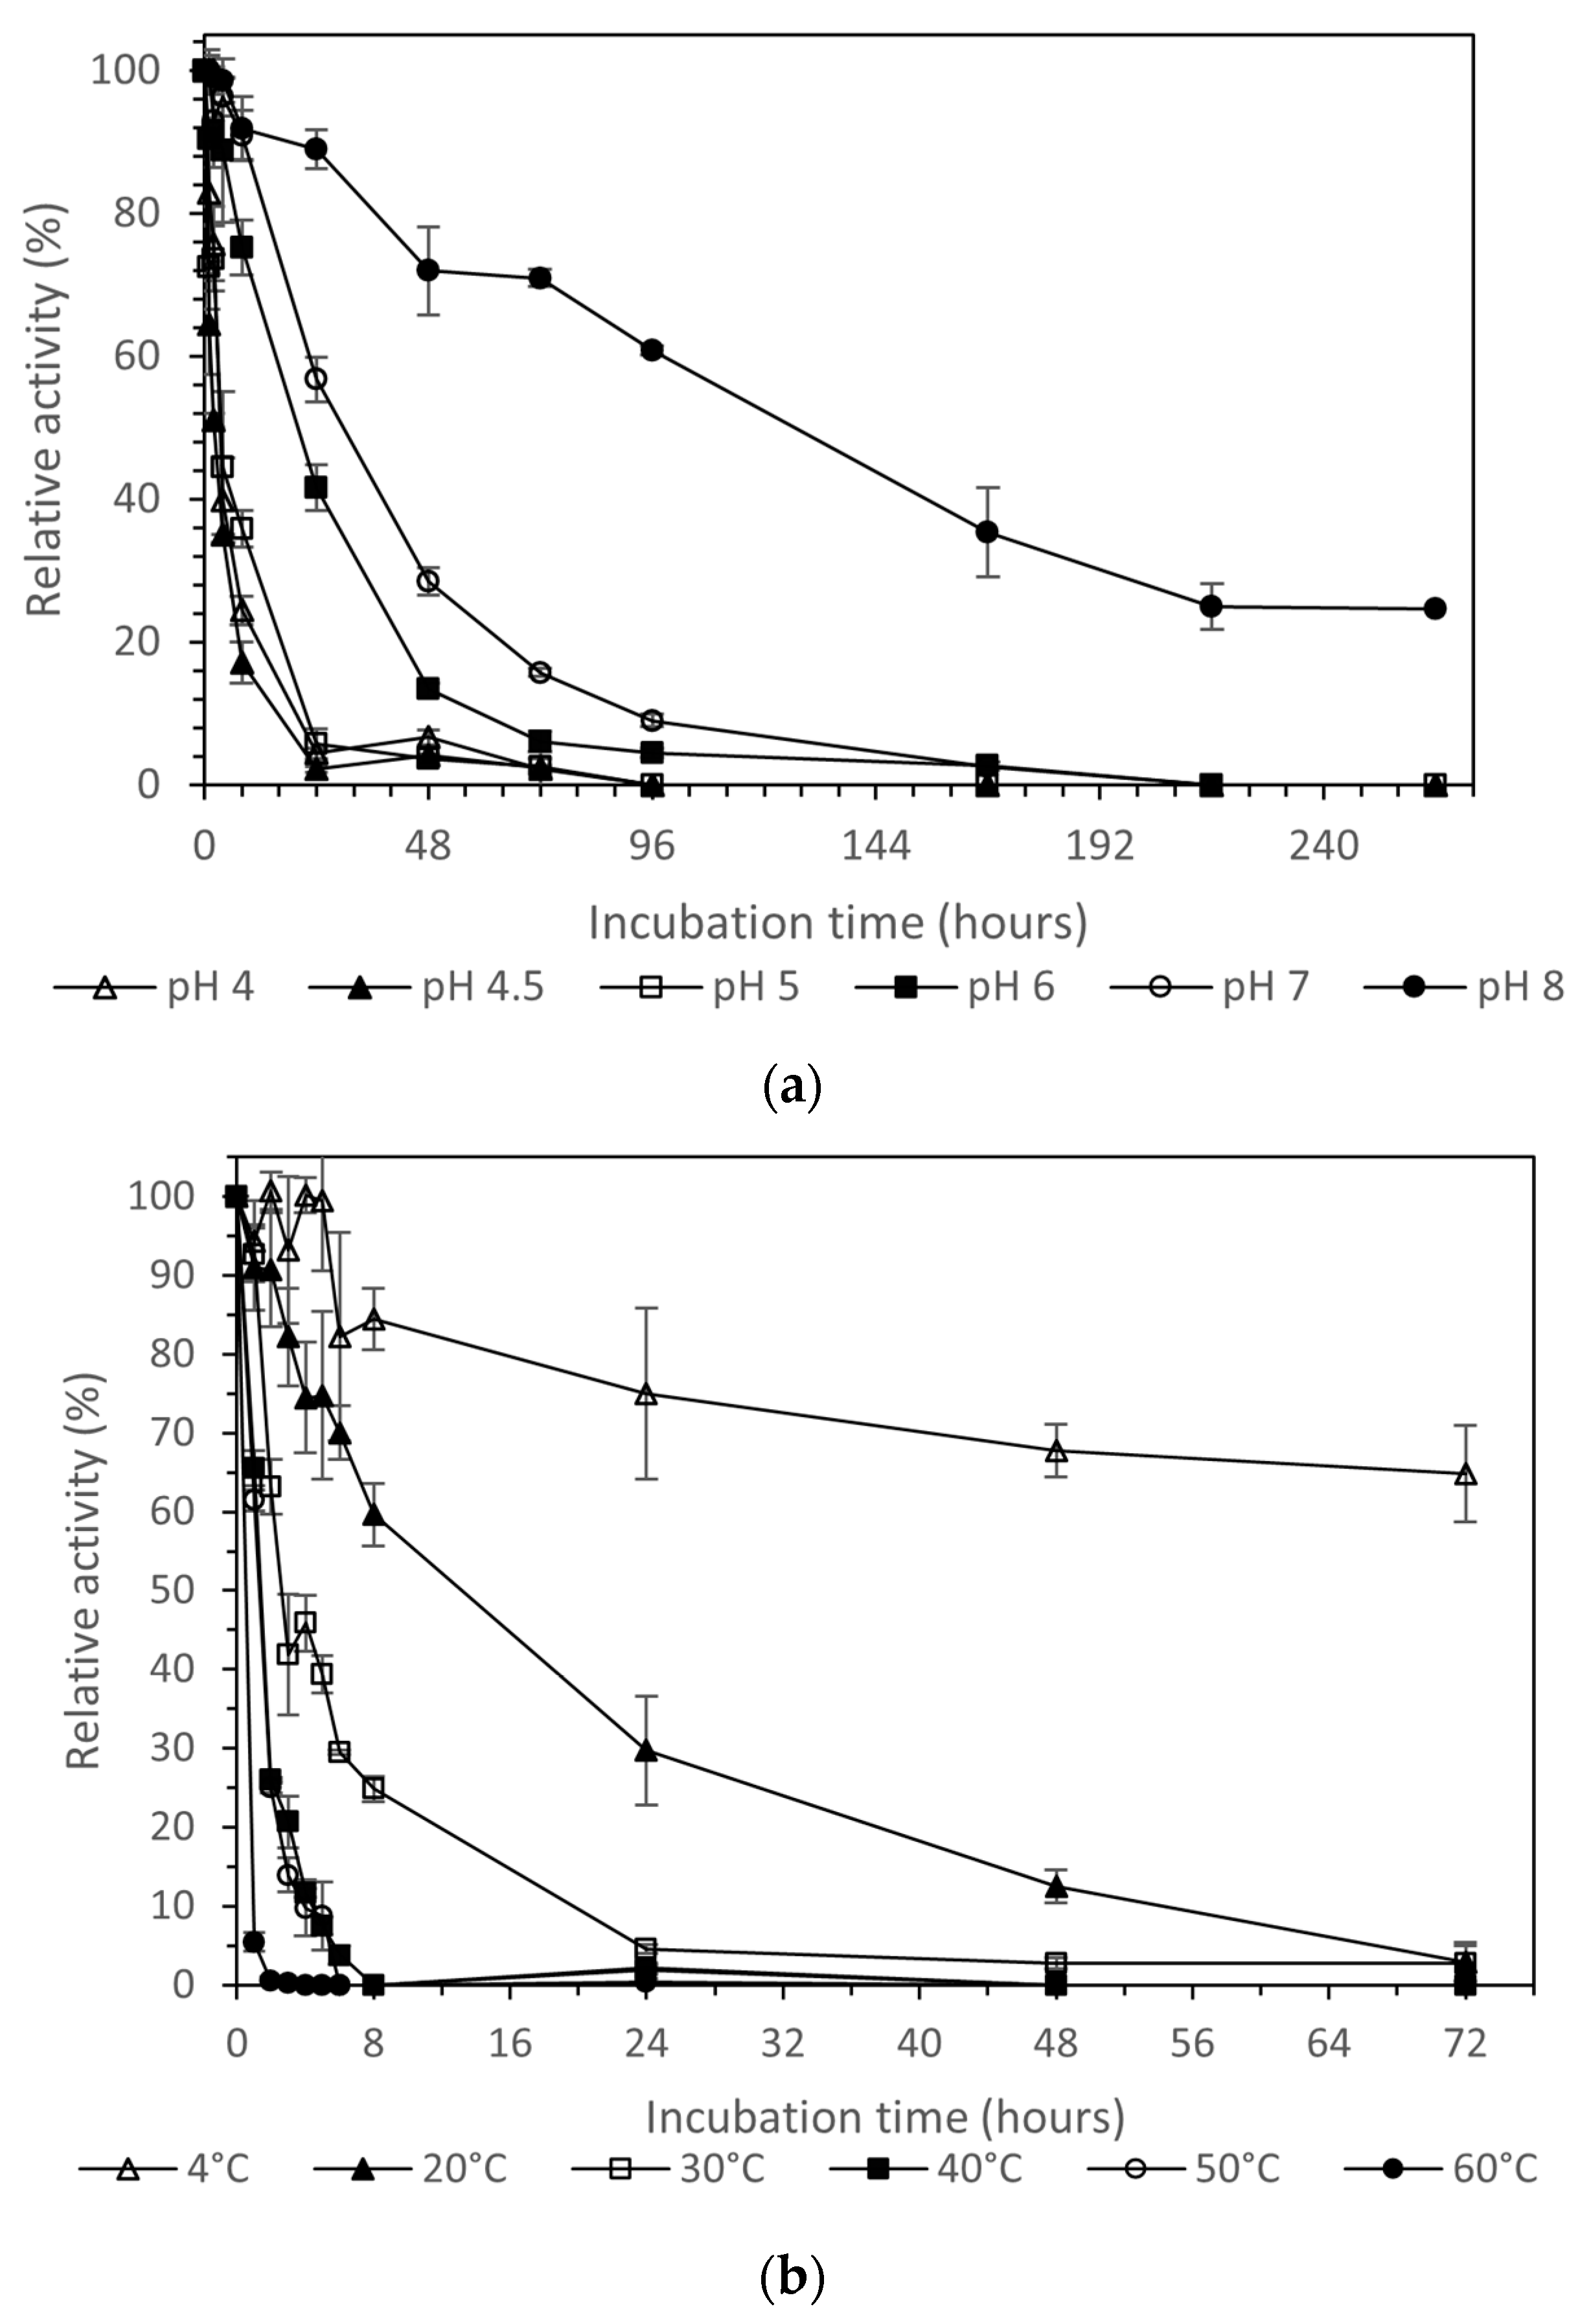
Laccase presented the highest stability at pH 8.0 (Figure 5a). The enzyme at this pH retained 60% of its activity after four days of incubation at 28 °C. Under the same conditions at pH 7, the laccase lost over 85% of its activity, while after two days of incubation the loss of activity was over 40%. At the optimal pH for enzyme action (5.0), pure laccase presented very low stability at 28 °C, as it retained about 50% of its activity for only 6 h, while after 24 h it lost more than 90% of its initial activity.
Thermal stability of the purified enzyme (Figure 5b) revealed that temperatures over 30 °C had a very negative impact on the stability of the enzyme, with the remaining activity retained over 50% for the first two hours at 30 °C, and for only one hour at 40 °C and 50 °C, whereas at 60 °C the relative activity was almost zero. In contrast, at 20 °C, the remaining activity was over 50% for the first 8 h, while at 4 °C the enzyme presented its maximum stability. A remaining activity level of 64.8 ± 6.2% after three days of incubation was obtained.
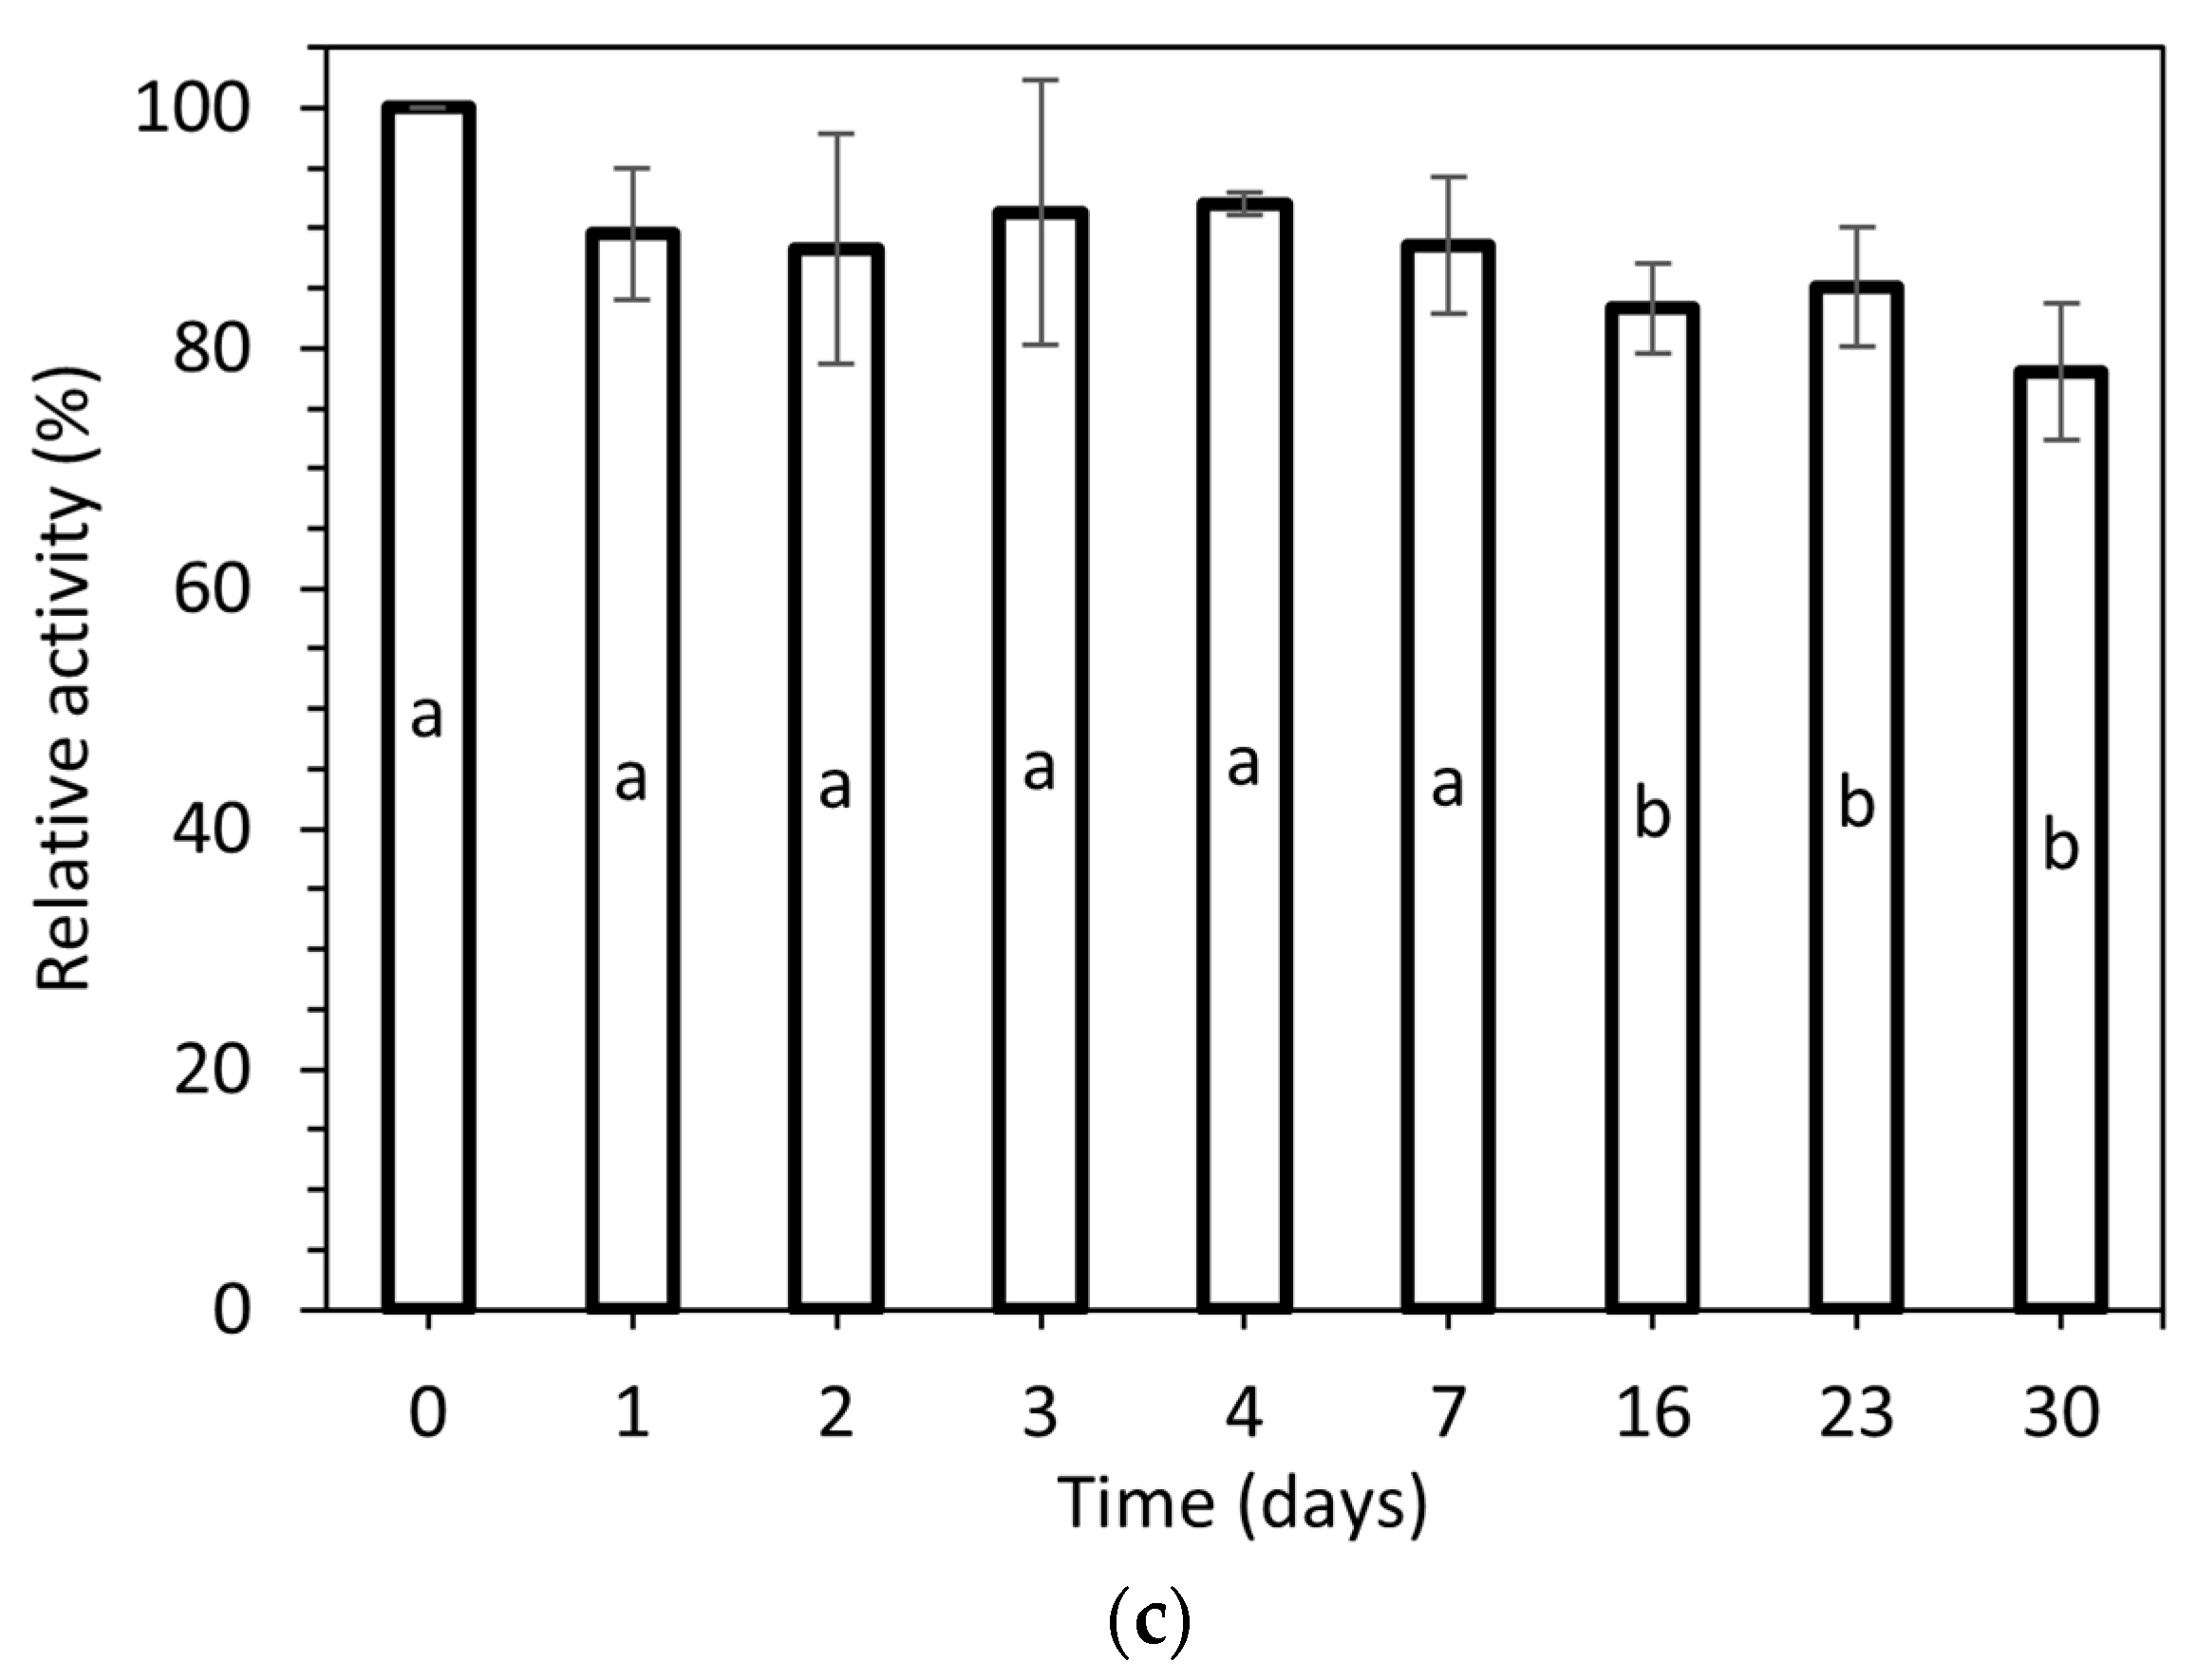
The stability of purified laccase at 4 °C in a buffer of pH 8.0, the most stable one, as described in the pH stability test above, is presented in Figure 5c. As we can observe, the enzyme can be stored, and keeps a high relative activity level of 78.0 ± 5.7% after thirty days of incubation.
3.6.4. Thermodynamics
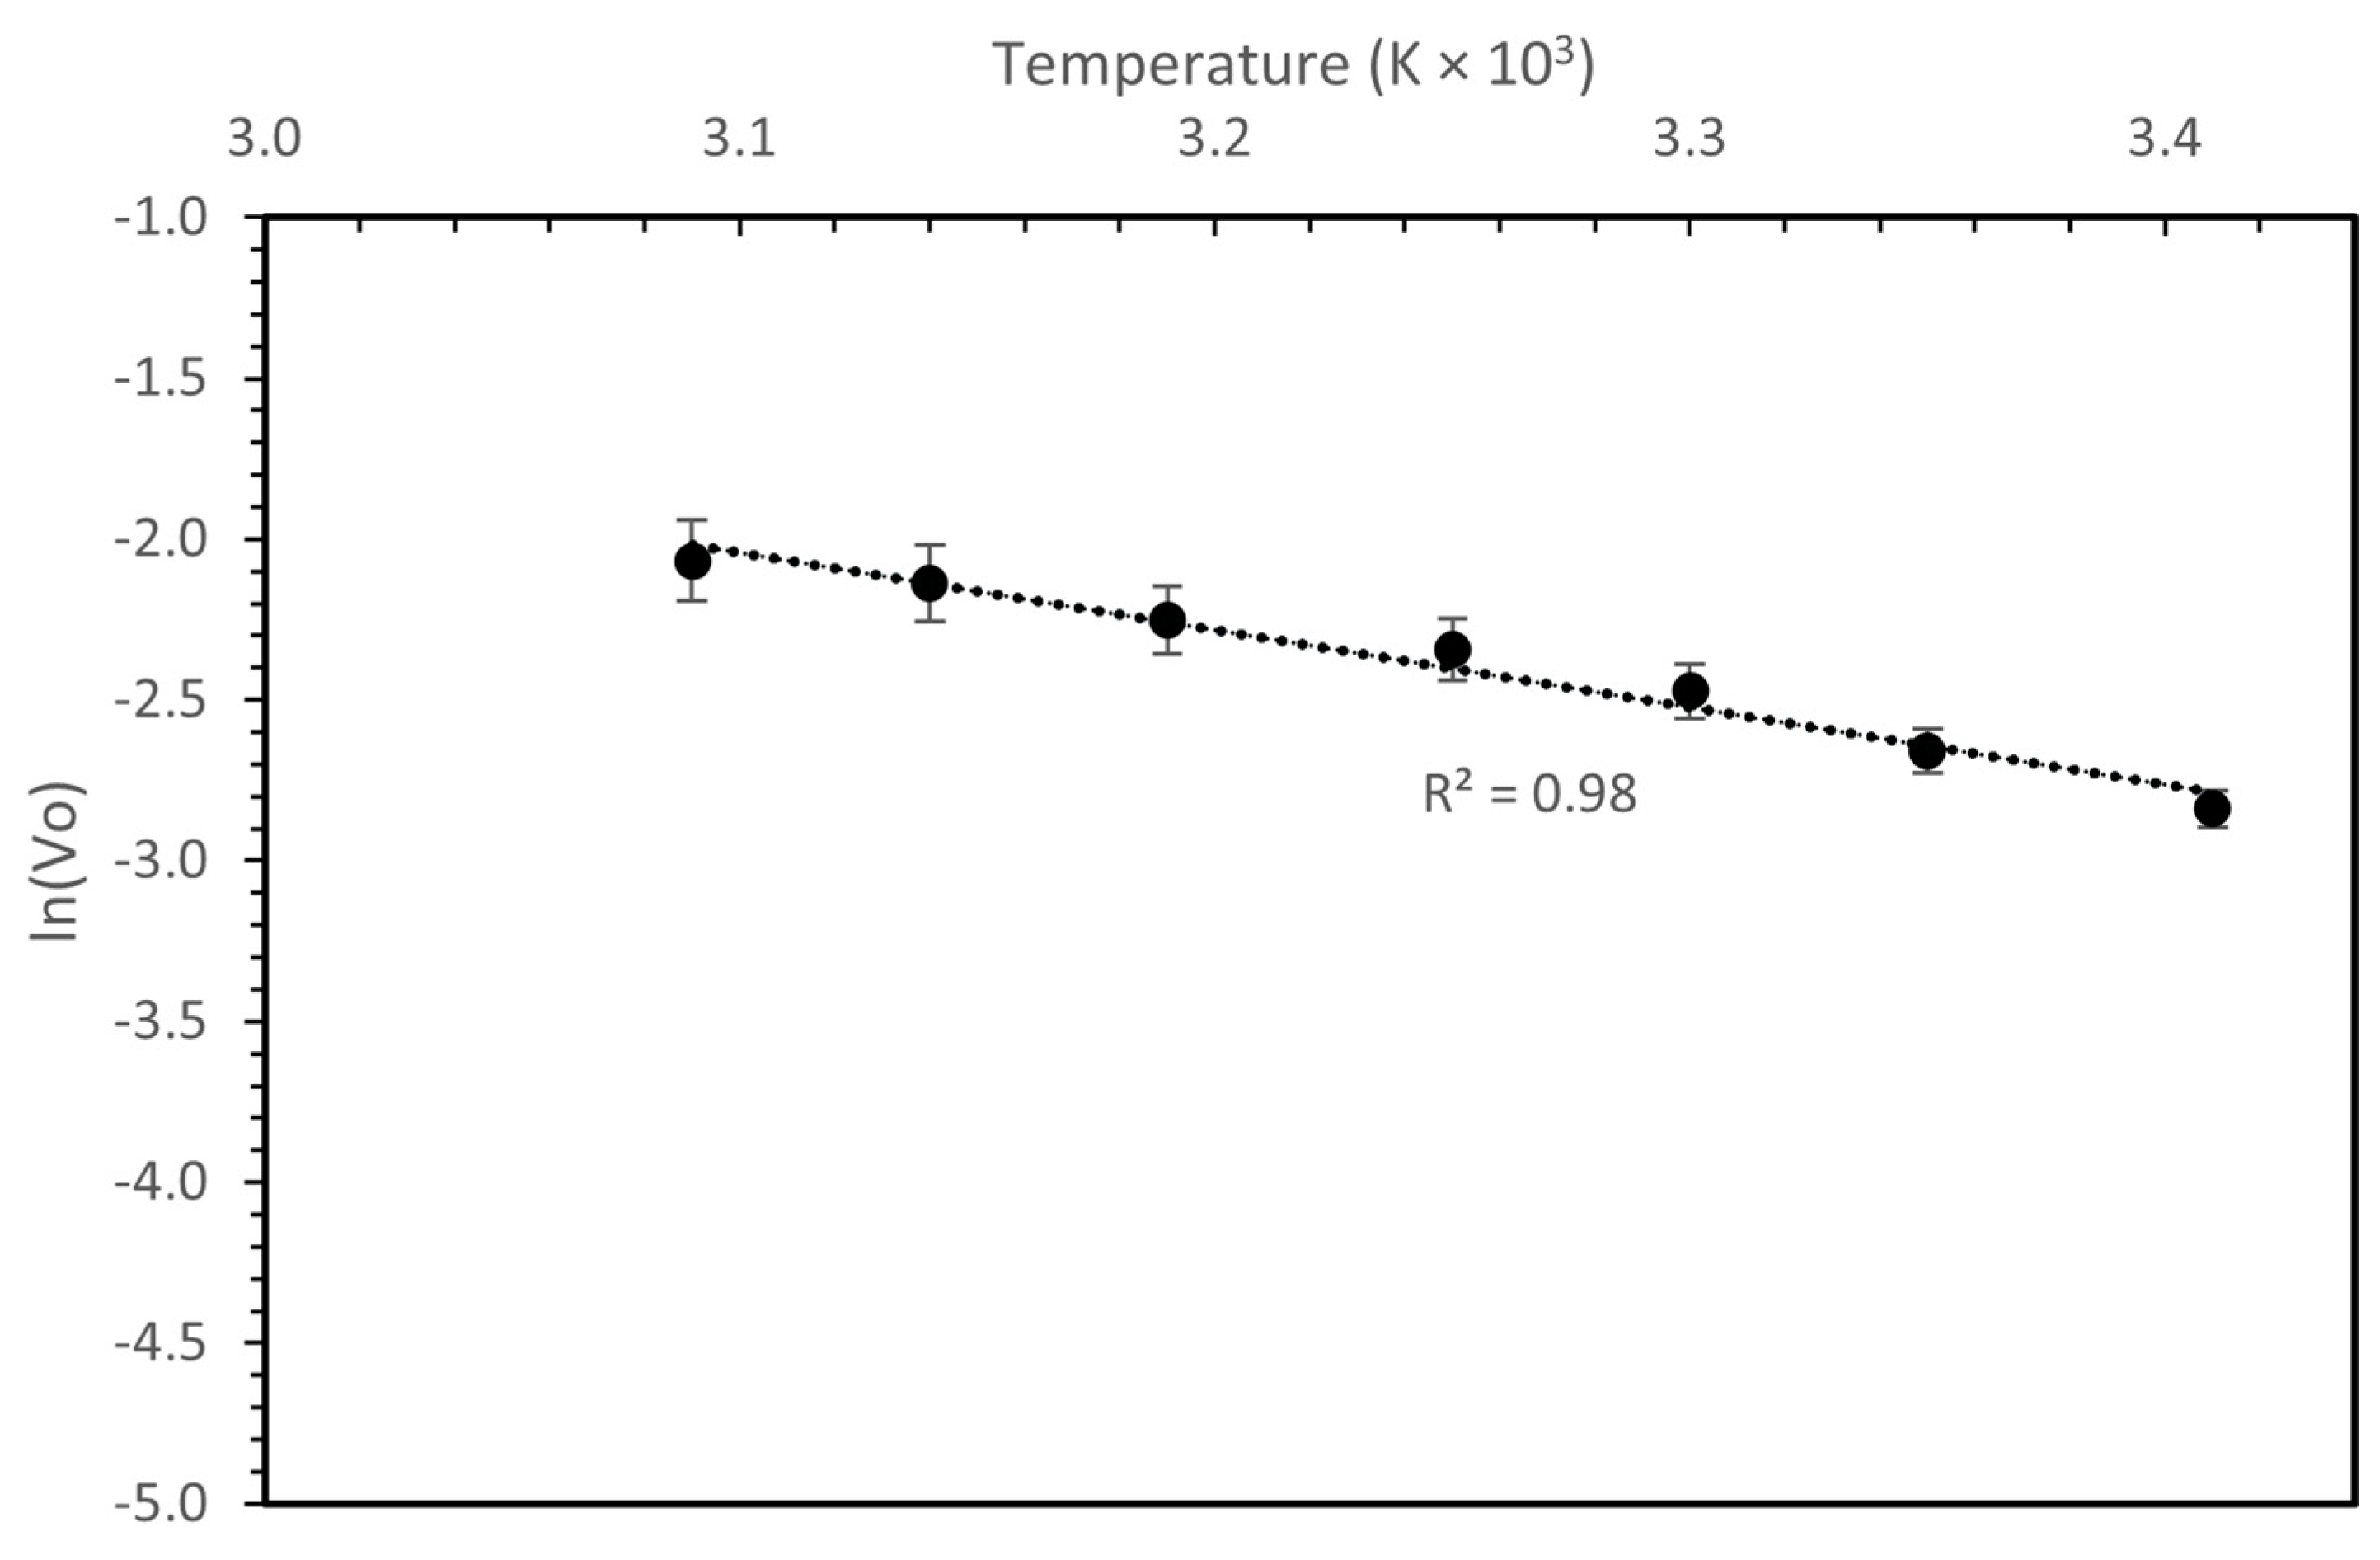
The activation energy of the purified laccase was calculated with the help of Arrhenius plot, as shown in Figure 6. The Ea was calculated as 20.0 ± 0.17 kJ/mol.
In addition, P. ostreatus LGAM 1123 laccase was found to have a significantly high E(a)d value of 76.0 ± 1.2 kJ/mol, as calculated according to the Figure S3. Enzymes with higher E(a)d values are more resistant to thermal inactivation. Also, the half-life value and D-value, along with the thermodynamic parameters, such as ΔG, ΔH, and ΔS, were calculated for the purified laccase (Table 9). As we can see, the half-life and D values decreased with the increase in the temperature; for example, only 0.26 ± 0.01 (h−1) and 0.86 ± 0.05 (h−1) hours were needed at 60 °C, whereas at 20 °C the values were 14.8 ± 0.3 (h−1) and 49 ± 1 (h−1), respectively. The Gibbs free energy (ΔG*) increased with the increase in the temperature, which indicated that enzymatic reactions are more feasible under lower temperatures. The positive values also indicate the non-spontaneity of its thermal denaturation. The small differences in the ΔH* values (74.3–73.8 kJ mol−1, p < 0.05) means that only a few extra non-covalent linkages, including hydrophobic interactions, should be disrupted towards the creation of the transition state for the enzyme inactivation, as the temperature has been increased. Entropy (ΔS*) is a key factor for the destabilization of enzyme bonds; in this work, the entropy values were negative. The thermal stability of the purified laccase was proved by the negative values for ΔS*, the decrease in ΔH*, and increase in the ΔG* values [30].
4. Discussion
In this work, wine lees were used as substrates for biomass and laccase production by P. ostreatus LGAM 1123. Concerning the effect of initial pH on biomass and laccase production, our results have shown that an initial pH of 6 was the optimum for laccase and biomass production, reaching values of 12.4 ± 1.5 Units/mL and 11.4 ± 2.0 g/L, respectively. The initial pH of 8 revealed the lowest laccase activity by the fungus. Results from other studies have indicated that a lower initial pH is ideal for laccase production by P. ostreatus submerged cultivation. A study for gene expression profiles of laccase from P. ostreatus has shown that the highest activity was achieved at pH 4.5, whereas the lowest one was observed at pH 8.5, in a similar way to our results, while the highest biomass production was achieved at pH 6.5 [31]. In another study, the optimum pH for laccase production by P. ostreatus was, in a range between 4.0 and 8.0, found to be 5.5 [32]. A study for laccase production by Trametes pubescens in distillery wastewaters has shown that even a small change of 0.5 units from the optimum pH 5.0 decreased laccase synthesis by more than 40% [33]. From other studies involving different fungi species, the optimum initial pH was found to be 5.2 for Trameter versicolor, 5.5 for Botryosphaeria rhodina, 7.5 for Streptomyces psammoticus, and 8.5 for Monotospora sp. [34,35,36,37].
The next step was to investigate the capability of P. ostreatus LGAM 1123 to be cultivated in a wide range of wine lees concentrations. Our results have shown that our strain could be grown well until a concentration of 60% wine lees, while in the wine lees concentration of 100%, growth was not observed. The optimum wine lees concentration for biomass production was found to be 40%, with a value of 10.0 ± 1.5 g/L. Similar to our results, two studies from Strong et al. have indicated that a concentration of wine lees greater than 40% inhibits the growth of Trametes pubescens [25,33]. Maximum laccase activity was observed at 20% v/v of wine lees concentration condition, with a value reaching 14.1 ± 0.1 Units/mL (p ≤ 0.05). A Trametes pubescens submerged cultivation at a wine lees concentration of 40% has revealed a maximum laccase production of 3 Units/mL, while the combination of 30% wine lees, glucose, copper, and 2.5 xylidine improved the laccase yield, reaching a value of 25 Units/mL [25,33]. In another wine wastewater, grape pomace, supplemented in the medium with 40 g/L, utilized by Elisashvilli et al. (2009), reached an activity of 0.75 Units/mL for a submerged cultivation of Pleurotus ostreatus. Concerning the decolorization and dephenolization of wine lees, our results indicate that their maximum values were reached under a 40% v/v condition (81.4 ± 0.071% and 83.2 ± 0.002%, respectively). Also, in a study involving a submerged cultivation of Trametes pubescens with 40% of wine lees, the decolorization rate that was observed reached a value up to 90%, while dephenolization was also maximized at 40% wine lees supplemented in the medium, with a value of 87.0 ± 1.6%. In 30% of a wine lees medium, the dephenolization rate was 78.0 ± 1.0%.
The influence of yeast extract concentration on biomass and protein production for the same strain has already been studied by our group, revealing that the optimum biomass production achieved was 28.9 g/L when concentrations of glucose and yeast extract were 54.14 g/L and 17 g/L, respectively [7]. In this study, the YE concentration was studied to reveal the effect on biomass and laccase production using wine lees as substrates. Laccase activity reached its maximum value for 20 g/L and 15 g/L YE on the 8th day of cultivation, with values up to 78.5 ± 8.4 and 74.8 ± 5.5 Units/mL, respectively (p ≥ 0.05). Concerning biomass production, 20 g/L YE concentration was the optimum, reaching a value of 20.9 ± 0.5 g/L. Decolorization of wine lees was at its maximum at 2.5 g/L YE (93.2 ± 0.025%), while the dephenolization rate reached its maximum value when 20 g/L YE was added in the cultivation medium (91.7 ± 0.013%). The ability of YE to induce laccase production by fungi has also been confirmed by Niladevi et al., 2008 and Zhu et al., 2006 [36,38]. The presence of 0.5%, 1%, and 2% of YE has shown a 7.5-, 16.5-, and 18.9-fold increase under a submerged cultivation of P. ostreatus, respectively [38]. A study for the effect of nutritional factors and copper on the regulation of laccase enzyme production in P. ostreatus has shown that YE was the best nitrogen source compared to ammonium sulfate for biomass and laccase production. A combination of 10 g/L YE and 20 g/L leads to a biomass production of 7.0 ± 0.8 g/L and a laccase activity of 2.3 ± 0.7 Units/mL. Response surface methodology revealed that 45 g/L glucose and 15 g/L YE was the best combination for biomass production and laccase production, while copper addition only exhibited an effect on laccase production [39]. Finally, Prasad et al., 2005 have shown that 0.5% YE was the optimum concentration for laccase production by P. ostreatus, reaching a value of 322.1 Units [32].
The final factor that was tested for biomass and laccase production by P. ostreatus LGAM 1123 using wine lees as substrates was the effect of glucose concentration. Laccase production increased until a glucose concentration of 30 g/L was used, while glucose concentrations of 40 g/L and 50 g/L also presented high activity levels but with no statistically different increases compared to that of 30 g/L. Biomass was at its maximum for 40 g/L and 50 g/L of glucose concentration, with values of 23.6 ± 1.0 g/L and 24.6 ± 2.5 g/L, respectively, and a glucose concentration of 30 g/L followed, reaching a value of 20.7 ± 1.3 g/L. The increase in laccase activity until a glucose concentration of 30 g/L was used and the constant values under higher concentrations were also confirmed by a study of P. ostreatus cultivation for laccase production in solid-state and submerged fermentations [40]. The importance of the initial glucose concentration in laccase production has also been confirmed by a study for laccase production by Trametes versicolor in a bioreactor using a statistical experimental design, indicating that initial glucose was the second most important factor after the initial pH. An initial glucose concentration of 11 g/L and a pH of 5.2 were found to be the optimum for laccase production, with a laccase activity of 11.4 Units having been observed [34]. In contrast, other studies have shown that an increase in glucose concentration over the value of 30 g/L resulted in a decrease in laccase activity. For example, a study for P. ostreatus has shown an increase of 1.7 times of laccase activity when the glucose concentration was increased from 0.5% to 1.5% [32]. In addition, a Trametes versicolor strain was found to achieve its maximum laccase activity (650 Units/L) under the carbon limitation condition, and the increase in the concentration of glucose in the cultivation medium has led to a decrease in laccase activity [41].
To scale up biomass and laccase production, the optimum conditions found were used. The maximum values that were observed were a laccase activity of 54.8 ± 1.8 Units/mL, a biomass production level of 22.5 ± 0.5 g/L, decolorization of 97.2 ± 0.5%, and dephenolization of 80.80 ± 0.02%. In similar studies using wine lees as substrates for Trametes pubescens cultivation, at growth conditions of 40% wine lees, pH 4.5, 10 g/L glucose, and 2 g/L YE laccase activity only reached 2.93 Units/mL, with a decolorization rate of 82.0 ± 1.6%, and a dephenolization rate of 87.0 ± 1.6% [25]. When the wine lees concentration was the same as that used in our study, laccase activity reached 2.13 Units/mL, decolorization 90.0 ± 0.9%, and dephenolization 81.0 ± 1.0% [25]. Another study for the same strain by Strong et al. (2011), with wine lees at a concentration of 30%, has shown that only with a combination of glucose, 20 g/L copper, and a three-time dosage of xylidine at an initial pH of 5.0 resulted in higher level of laccase activity, with a value up to 25 Units/mL. Our study presents a higher dephenolization rate, and from a study of P. ostreatus using grape pomace as a substrate, its value reached only 68%, while the laccase production maximum value was 4447 U/g of substrate, and the biomass reached a value of 0.42 ± 0.01 g/g substrate [42]. Our values for dephenolization and decolorization were close to that published by Diamantis et al. for Pleurotus pulmonarius in Olive mill wastewater, with the observed values ranging from 87% to 95% for dephenolization and from 70% to 85% for decolorization [43]. Focusing on laccase production, our study revealed higher laccase production levels in comparison with other studies for Pleurotus ostreatus involving cultivation on 20 g/L tomato pomace and 1 g/L ammonium sulfate (0.147 Units/mL), cultivation on 20 g/L glucose and 5 g/L peanut shell (5 Units/mL), cultivation on 20 g/L glucose and 5 g/L bagasse (15 Units/mL), cultivation on 20 g/L glucose and 5 g/L tea leaflets (30 Units/mL), and cultivation on 20 g/L glucose and 5 g/L orange peel (45 Units/mL) [14,44]. Only for other fungi strains has laccase activity reached higher values, such as for Ganoderma lucidum 447 using wheat bran and soy bran as substrates, with values of 973 Units/mL and 93.8 Units/mL, respectively [45].
Final biomass composition produced by P. ostreatus LGAM 1123 using wine lees as substrates revealed a high protein biomass consisting of 42.8 ± 2.4% of total protein and 16.4 ± 0.1% of essential amino acids. Carbohydrates and lipids were the second richest bioactive compound in biomass, with values of 29.4 ± 2.7% and 29.5 ± 2.7%, respectively. Comparisons with a study for a Pleurotus pulmonarius submerged cultivation in olive mill wastewater biomass consisted of 11.7% lipids and 14.7% of intracellular polysaccharides. Results from our group for the same strain for single-cell protein production in a glucose-based medium have shown slightly different biomass compositions with total protein 38.0 ± 2.1%, total carbohydrates 50.9 ± 2.8%, and lipids 2.0 ± 0.1%, indicating that wine lees as substrates enhance the composition of lipids and reduce carbohydrate production. The protein content was lower, and for a study of Pleurotus ostreatus, Lentinula edodes, and Ganoderma lucidum cultivation with grape marc as a substrate, it reached values of 17.6%, 18.9%, and 17.5%, respectively.
The purification step of the produced laccase has shown that after the ammonium sulfate precipitation treatment, a purification fold of 1.4 and a recovery of 98.6% have been observed. After anion exchange chromatography, the purification fold reached 4.4, and a recovery of 44.3% was also observed. The SDS-PAGE electrophoresis revealed a clear band at about 62 kDa. A study for the laccase isoenzyme poxA1b produced by P. ostreatus revealed that the molecular weight of the expressed enzyme was 62 kDa. After anion exchange and gel filtration purification, the recovery of the enzyme was much lower to ours, with a value of 15% having been measured [46]. In another study for laccase production of Pleurotus ferulae, a laccase with a molecular weight of 66 kDa was expressed, and the purification process after ammonium sulfate treatment and anion exchange chromatography has shown a purification fold of 1.94 and a recovery of 40.6% [47]. A higher purification fold and recovery were observed for a 68.2 kDa laccase that was expressed from the P. ostreatus HP1 strain after ammonium sulfate treatment and anion exchange chromatography. The purification fold and recovery reached values of 13.3 and 77.6%, respectively [48]. In addition, the same purification steps led to a 16-purification fold and 66% recovery for laccase with a molecular wight of 55 kDa from P. ostreatus [49]. Other laccases from the Pleurotus sajor-caju strain, with molecular weights of 61 kDa and 90 kDa, revealed an 8.4 purification fold and 72.1% recovery, and a 10.7 purification fold and 3.5% recovery, respectively. According to the scientific literature, 12 laccases genes have been identified in P. ostreatus strains with a wide range of molecular weights. Some of them include 40 kDa, 55 kDa, 57 kDa, 59 kDa, 61 kDa (laccase poxA1), 62 kDa (lacc6), and 67 kDa (lacc pox A2) [31,50]. Our results could suggest that the produced laccase from P. ostreatus LGAM 1123, using wine lees as substrates, was due to an overexpression of the lacc6 gene, but further analysis is needed.
Characterization assays of the purified laccase have shown that the optimal pH of the enzyme for the ABTS assay was five. The increased activity at a more acidic pH has been confirmed by other studies. A pH level of 4.5 was the best for the ABTS assay, in a study conducted by Patel et al. (2014), in laccase produced by P. ostreatus HP-1 using solid-state cultivation [48], whereas laccase produced by P. ostreatus grown on tomato pomace and Pleurotus ferulae exhibits its maximum level of activity at pH 3.0 for the ABTS assay [44,47]. Bettin et al. (2011) have shown three different optimal pH values of 2.4, 3.2, and 4.4, for the ABTS assay, probably due to the three different isoforms of the produced laccase [50]. Murugesan et al. (2006), also for the ABTS assay, observed a value closer to ours, with their best activity observed at pH 4.5–5.0 [51]. Concerning thermal activity, our laccase presented its highest activity at a very high temperature of 70 °C, in a similar way to a study conducted for Pleurotus ferulae laccase, using ABTS as a substrate, in which the optimum temperature ranged from 50 to 70 °C [47]. Other studies have shown optimum temperatures of 37 °C using 2, 6-dimethoxyphenol as the substrate, 40 °C and 45 °C using ABTS as the substrate, and 50 °C using both guaiacol and ABTS as their substrates [44,49,50,51,52]. According to the thermal stability results, laccase was also stable until 30 °C for 8 h and for three days at 4 °C in acetate buffer pH 4.58 using ABTS as a substrate. P. ostreatus HP-1 laccase, using ABTS as its substrate, has shown that it can be stable for months at −4 °C, for 18 h at 30 °C, for 5 h at 40 °C, and for only 10 min at 50 °C [48]. Also, in other studies, laccase was inactivated in temperatures over 50 °C [47,49,50,51]. Ding et al. (2014) revealed a remaining activity of 70% during a 9 h incubation below 40 °C and a 54% remaining activity level for a 7 h incubation at 50 °C for laccase using ABTS as a substrate [47]. From the pH stability test at 28 °C, pH 8.0 was the most stable pH, with a relative activity of up to 60% after four days of incubation. More alkaline pH levels ranging from nine to eleven seemed to be more stable for another P. ostreatus laccase study, which used guaiacol as a substrate [49].
The activation energy of the purified laccase was calculated as 20.00 ± 0.17 kJ/mol using ABTS as a substrate; this value is close to one obtained for laccase produced by P. ostreatus ATCC 56270 (16.3 kJ/mol), whereas another study for P. ostreatus laccase revealed a higher activation energy of 27.06 kJ/mol, which also used ABTS as its substrate [53,54]. A much lower activation energy was calculated for Pleurotus florida laccase using guaiacol as a substrate, 3.9 kJ/mol, whereas 12 kJ/mol was reported for P. sajor-caju laccase using ABTS as its substrate [55,56]. Our enzyme’s activation energy indicates a more effective hydrolytic capacity. In addition, the inactivation energy of the purified enzyme was calculated as 76.0 ± 1.2 kJ/mol. This value is slightly lower than the one derived for a Trametes pubescens laccase (109.36 kJ/mol) and for a laccase from Trametes versicolor (200 kJ/mol) using ABTS as its substrate [57,58]. Laccases from different strains, such as P. cinnabarinus, T. villosa, and M. thermophila, have presented inactivation energies ranging from 106 kJ mol−1 to 123 kJ mol−1 [57]. A high inactivation energy delays conformational changes in enzymes at high temperatures. Concerning Gibbs free energy (ΔG), our study presented higher values in contrast to a study for a T. pubescens laccase (85.8–84.5 kJ/mol) [58]. In contrast, our ΔH* and ΔS* values were lower than the one derived for a T. pubescens laccase (ΔH*: 106.7–106.5 kJ/mol; ΔS*: 64.6–64.2 kJ/mol). This indicates that a lower level of energy is required to break down the enzyme’s stability, and that the destabilization of enzyme bonds is easier to achieve [58]. The negative values of ΔS* has also been reported in other studies for different enzymes, such as laccase from D. flavida, lipase from B. cepacian, and palatase from R. miehei [59,60]. It has also been suggested that negative values correlated more with an unfolded transition state in contrast to a ground-state native structure [59].
5. Conclusions
Summarizing the above results, we could state that wine lees are high-value substrates for biomass and laccase production by P. ostreatus LGAM 1123. Investigating the optimum conditions, such as wine lees concentrations, initial pH, nitrogen source concentration, and carbon source concentrations, could lead to higher enzyme and biomass yields. Using wine lees as substrates led to a very high enzyme activity of about 80 Units/mL, whereas the decolorization and dephenolization rates of wine lees were over 90%. In addition, an increase in protein biomass production, of 24.6 g/L with a 43% protein content, and a high content of essential amino acids were accomplished. The optimum conditions were used for scaling up in a 3.5 L stirred tank bioreactor. The produced laccase was purified 4.4 times, and the enzyme’s molecular weight was determined to be 62 kDa. Enzyme activity was higher at pH 5.0 and 70 °C, whereas the enzyme was stable at pH 8.0 and at a temperature above 40 °C. Finally, the activation energy of the enzyme was calculated as a value of 20.00 ± 0.17 kJ/mol, while the inactivation energy was calculated to be 75.1 ± 1.1 kJ/mol. The ability to produce a value-added enzyme that would be useful for the industry, from a toxic sidestream for the environment, such as wine lees, but also to achieve a high single-cell protein production is an ideal biorefinery project that could reinforce the circular economy. However, further analysis of the produced enzyme to find the gene that is overexpressed by wine lees on P. ostreatus LGAM 1123 submerged cultivation are needed.
Supplementary Materials
The following supporting information can be downloaded at: https://www.mdpi.com/article/10.3390/biomass4010001/s1, Figure S1: SDS-polyacrylamide Gel-electrophoresis. M: protein molecular weight marker. BG25: Ammonium sulphate precipitated laccase before G25, AG25 after G25 laccase, Anion 1: laccase after anion exchange 1, Anion 2: laccase after anion exchange 2; Figure S2: FPLC chromatograph for purification of laccase by HiTrap Q HP (Cytiva, USA). Laccase activity recovered at sample 24, 25.; Figure S3: Temperature versues ln(kd) plot for determination of inactivation energy of the purified laccase.
Author Contributions
Conceptualization, P.K.; data curation, G.B. and K.A.; formal analysis, G.B. and K.A.; funding acquisition, H.S.; investigation, G.B., K.A. and P.E.A.; methodology, G.B. and P.K.; project administration, H.S.; resources, H.S. and P.K.; supervision, P.K. and H.S.; validation, G.B.; visualization, G.B.; writing—original draft, G.B. writing—review and editing, P.K. and H.S. All authors have read and agreed to the published version of the manuscript.
Funding
This work is co-financed by the European Union (European Regional Development Fund) and National Resources, under the operational program “Competitiveness, Entrepreneurship and Innovation (EPAnEK)”, “NSRF 2014–2020”, Call 111: “Support for Regional Excellence” (project: MIS 5047215).
Data Availability Statement
Data is contained within the article or Supplementary Materials.
Acknowledgments
We gratefully acknowledge Georgios I. Zervakis from the Laboratory of General and Agri- cultural Microbiology, Agricultural University of Athens, Iera Odos 75, 11855 Athens, Greece, for providing the fungal strain.
Conflicts of Interest
The authors declare no conflict of interest.
References
- Dias, A.A.; Fernandes, J.M.C.; Sousa, R.M.O.F.; Pinto, P.A.; Amaral, C.; Sampaio, A.; Bezerra, R.M.F. Fungal Conversion and Valorization of Winery Wastes. In Bioremediation and Decolorization of Textile Dyes by White Rot Fungi and Laccase; Prasad, R., Ed.; Fungal Biology; Springer International Publishing: Cham, Switzerland, 2018; Volume 2, pp. 239–252. ISBN 978-3-319-77385-8. [Google Scholar]
- De Iseppi, A.; Lomolino, G.; Marangon, M.; Curioni, A. Current and Future Strategies for Wine Yeast Lees Valorization. Food Res. Int. 2020, 137, 109352. [Google Scholar] [CrossRef] [PubMed]
- Liu, J.; Wang, Q.; Ma, H.; Wang, S. Effect of Pretreatment Methods on L-Lactic Acid Production from Vinasse Fermentation. Adv. Mater. Res. 2010, 113–116, 1302–1305. [Google Scholar] [CrossRef]
- Salgado, J.M.; Rodríguez, N.; Cortés, S.; Domínguez, J.M. Improving Downstream Processes to Recover Tartaric Acid, Tartrate and Nutrients from Vinasses and Formulation of Inexpensive Fermentative Broths for Xylitol Production. J. Sci. Food Agric. 2010, 90, 2168–2177. [Google Scholar] [CrossRef] [PubMed]
- Zhu, W.; He, Q.; Gao, H.; Nitayavardhana, S.; Khanal, S.K.; Xie, L. Bioconversion of Yellow Wine Wastes into Microbial Protein via Mixed Yeast-Fungus Cultures. Bioresour. Technol. 2020, 299, 122565. [Google Scholar] [CrossRef] [PubMed]
- Bakratsas, G.; Polydera, A.; Katapodis, P.; Stamatis, H. Recent Trends in Submerged Cultivation of Mushrooms and Their Application as a Source of Nutraceuticals and Food Additives. Future Foods 2021, 4, 100086. [Google Scholar] [CrossRef]
- Bakratsas, G.; Polydera, A.; Nilson, O.; Κossatz, L.; Xiros, C.; Katapodis, P.; Stamatis, H. Single-Cell Protein Production by Pleurotus Ostreatus in Submerged Fermentation. Sustain. Food Technol. 2023, 1, 377–389. [Google Scholar] [CrossRef]
- Bakratsas, G.; Polydera, A.; Nilson, O.; Chatzikonstantinou, A.V.; Xiros, C.; Katapodis, P.; Stamatis, H. Mycoprotein Production by Submerged Fermentation of the Edible Mushroom Pleurotus Ostreatus in a Batch Stirred Tank Bioreactor Using Agro-Industrial Hydrolysate. Foods 2023, 12, 2295. [Google Scholar] [CrossRef]
- Morais, H.; Forgács, E.; Cserháti, T. Enzyme Production of the Edible Mushroom Pleorotus Ostreatus in Shaken Cultures Completed with Agro-Industrial Wastes. Eng. Life Sci. 2005, 5, 152–157. [Google Scholar] [CrossRef]
- Park, M.; Kim, M.; Kim, S.; Ha, B.; Ro, H. Mycobiology Differential Expression of Laccase Genes in Pleurotus Ostreatus and Biochemical Characterization of Laccase Isozymes Produced in Pichia Pastoris. Mycobiology 2015, 43, 280–287. [Google Scholar] [CrossRef]
- Mayolo-Deloisa, K.; González-González, M.; Rito-Palomares, M. Laccases in Food Industry: Bioprocessing, Potential Industrial and Biotechnological Applications. Front. Bioeng. Biotechnol. 2020, 8, 222. [Google Scholar] [CrossRef]
- Osma, J.F.; Toca-herrera, L.; Rodr, S. Uses of Laccases in the Food Industry. Enzym. Res. 2010, 2010, 918761. [Google Scholar] [CrossRef] [PubMed]
- Castanera, R.; Pérez, G.; Omarini, A.; Alfaro, M.; Pisabarro, A.G.; Faraco, V.; Amore, A. Transcriptional and Enzymatic Profiling of Pleurotus Ostreatus Laccase Genes in Submerged and Solid-State Fermentation Cultures. Appl. Environ. Microbiol. 2012, 78, 4037–4045. [Google Scholar] [CrossRef] [PubMed]
- Zhao, L.H.; Chen, W.; Wang, L.L.; Sun, H.J.; Zhu, Z. Improvement of Laccase Production by Pleurotus Ostreatus by Means of Agroindustrial Waste and Fermentation Kinetics. Mycosphere 2017, 8, 147–161. [Google Scholar] [CrossRef]
- Weber, K.; Osborn, M. The Reliability of Molecular Weight Determinations by Dodecyl Sulfate-Polyacrylamide Gel Electrophoresis. J. Biol. Chem. 1969, 244, 4406–4412. [Google Scholar] [CrossRef] [PubMed]
- Miller, G.L. Use of Dinitrosalicylic Acid Reagent for Determination of Reducing Sugar. Anal. Chem. 1959, 31, 426–428. [Google Scholar] [CrossRef]
- Xiao, Q.; Ma, F.; Li, Y.; Yu, H.; Li, C.; Zhang, X. Differential Proteomic Profiles of Pleurotus Ostreatus in Response to Lignocellulosic Components Provide Insights into Divergent Adaptive Mechanisms. Front. Microbiol. 2017, 8, 480. [Google Scholar] [CrossRef] [PubMed]
- Smith, P.K.; Krohn, R.I.; Hermanson, G.T.; Mallia, A.K.; Gartner, F.H.; Provenzano, M.D.; Fujimoto, E.K.; Goeke, N.M.; Olson, B.J.; Klenk, D.C. Measurement of Protein Using Bicinchoninic Acid. Anal. Biochem. 1985, 150, 76–85. [Google Scholar] [CrossRef]
- Kruger, N.J. The Bradford Method for Protein Quantitation. In The Protein Protocols Handbook; Springer Protocols Handbooks; Humana Press: Totowa, NJ, USA, 1996; Volume 32, pp. 15–20. [Google Scholar] [CrossRef]
- Bradford, M. A Rapid and Sensitive Method for the Quantitation Microgram Quantities of Protein Utilizing the Principle of Protein-Dye Binding. Anal. Biochem. 1976, 72, 248–254. [Google Scholar] [CrossRef]
- Heinzkill, M.; Bech, L.; Halkier, T.; Schneider, P.; Anke, T. Characterization of Laccases and Peroxidases from Wood-Rotting Fungi (Family Coprinaceae). Appl. Environ. Microbiol. 1998, 64, 1601–1606. [Google Scholar] [CrossRef]
- Patila, M.; Athanasiou, P.E.; Kortessis, L.; Potsi, G.; Kouloumpis, A.; Gournis, D.; Stamatis, H. Immobilization of Laccase on Hybrid Super-Structured Nanomaterials for the Decolorization of Phenolic Dyes. Processes 2022, 10, 233. [Google Scholar] [CrossRef]
- Kikani, B.A.; Singh, S.P. Enzyme Stability, Thermodynamics and Secondary Structures of α-Amylase as Probed by the CD Spectroscopy. Int. J. Biol. Macromol. 2015, 81, 450–460. [Google Scholar] [CrossRef] [PubMed]
- Eyring, H.; Stearn, A.E. The Application of the Theory of Absolute Reacton Rates to Proteins. Chem. Rev. 1939, 24, 253–270. [Google Scholar] [CrossRef]
- Strong, P.J.; Burgess, J.E. Fungal and Enzymatic Remediation of a Wine Lees and Five Wine-Related Distillery Wastewaters. Bioresour. Technol. 2008, 99, 6134–6142. [Google Scholar] [CrossRef] [PubMed]
- Box, J.D. Investigation of the Folin-Ciocalteau Phenol Reagent for the Determination of Polyphenolic Substances in Natural Waters. Water Res. 1983, 17, 511–525. [Google Scholar] [CrossRef]
- Folch, J.; Lees, M.; Stanley, G.H.S. A Simple Method for the Isolation and Purification of Total Lipides from Animal Tissues. J. Biol. Chem. 1957, 226, 497–509. [Google Scholar] [CrossRef] [PubMed]
- Visca, A.; Di Caprio, F.; Spinelli, R.; Altimari, P.; Cicci, A.; Iaquaniello, G.; Toro, L.; Pagnanelli, F. Microalgae Cultivation for Lipids and Carbohydrates Production. Chem. Eng. Trans. 2017, 57, 127–132. [Google Scholar] [CrossRef]
- Dubois, M.; Gilles, K.A.; Hamilton, J.K.; Rebers, P.A.; Smith, F. Colorimetric Method for Determination of Sugars and Related Substances. Anal. Chem. 1956, 28, 350–356. [Google Scholar] [CrossRef]
- El Aty, A.A.A.; Zohair, M.M.; Mostafa, F.A. Characterization, and Application Studies on Alternaria Arborescens MK629314 Laccase. Catal. Lett. 2023, 153, 1574–1586. [Google Scholar] [CrossRef]
- Díaz, R.; Carmen, M.T.; Martha, S. Influence of Initial PH of the Growing Medium on the Activity, Production and Genes Expression Profiles of Laccase of Pleurotus Ostreatus in Submerged Fermentations. Electron. J. Biotechnol. 2013, 16, 6. [Google Scholar] [CrossRef]
- Prasad, K.K.; Mohan, S.V.; Bhaskar, Y.V.; Ramanaiah, S.V.; Babu, V.L.; Pati, B.R.; Sarma, P.N. Laccase Production Using Pleurotus Ostreatus 1804 Immobilized on PUF Cubes in Batch and Packed Bed Reactors: Influence of Culture Conditions. J. Microbiol. 2005, 43, 301–307. [Google Scholar]
- Strong, P.J. Improved Laccase Production by Trametes Pubescens MB89 in Distillery Wastewaters. Enzym. Res. 2011, 2011, 379176. [Google Scholar] [CrossRef] [PubMed]
- Tavares, A.P.M.; Coelho, M.A.Z.; Agapito, M.S.M.; Coutinho, J.A.P.; Xavier, A.M.R.B. Optimization and Modeling of Laccase Production by Trametes Versicolor in a Bioreactor Using Statistical Experimental Design. Appl. Biochem. Biotechnol. 2006, 134, 233–248. [Google Scholar] [CrossRef] [PubMed]
- Dekker, R.F.H.; Barbosa, A.M.; Giese, E.C.; Godoy, S.D.S.; Covizzi, L.G. Influence of Nutrients on Enhancing Laccase Production by Botryosphaeria Rhodina MAMB-05. Int. Microbiol. 2007, 10, 177–185. [Google Scholar] [CrossRef] [PubMed]
- Niladevi, K.N.; Prema, P. Effect of Inducers and Process Parameters on Laccase Production by Streptomyces Psammoticus and Its Application in Dye Decolourization. Bioresour. Technol. 2008, 99, 4583–4589. [Google Scholar] [CrossRef] [PubMed]
- Wang, J.W.; Wu, J.H.; Huang, W.Y.; Tan, R.X. Laccase Production by Monotospora sp., an Endophytic Fungus in Cynodon Dactylon. Bioresour. Technol. 2006, 97, 786–789. [Google Scholar] [CrossRef] [PubMed]
- Zhu, C.; Bao, G.; Huang, S. Optimization of Laccase Production in the White-Rot Fungus Pleurotus Ostreatus (ACCC 52857) Induced through Yeast Extract and Copper. Biotechnol. Biotechnol. Equip. 2016, 30, 270–276. [Google Scholar] [CrossRef]
- Durán-Sequeda, D.; Suspes, D.; Maestre, E.; Alfaro, M.; Perez, G.; Pisabarro, A.G. Effect of Nutritional Factors and Copper on the Regulation of Laccase Enzyme Production in Pleurotus Ostreatus. J. Fungi 2022, 8, 7. [Google Scholar] [CrossRef] [PubMed]
- Mazumder, S.; Basu, S.K.; Mukherjee, M. Laccase Production in Solid-State and Submerged Fermentation by Pleurotus Ostreatus. Eng. Life Sci. 2009, 9, 45–52. [Google Scholar] [CrossRef]
- Tavares, A.P.M.; Coelho, M.A.Z.; Coutinho, J.A.P.; Xavier, A.M.R.B. Laccase Improvement in Submerged Cultivation: Induced Production and Kinetic Modelling. J. Chem. Technol. Biotechnol. 2005, 80, 669–676. [Google Scholar] [CrossRef]
- Papadaki, A.; Kachrimanidou, V.; Papanikolaou, S.; Philippoussis, A.; Diamantopoulou, P. Upgrading Grape Pomace through Pleurotus spp. Cultivation for the Production of Enzymes and Fruiting Bodies. Microorganisms 2019, 7, 207. [Google Scholar] [CrossRef]
- Diamantis, I.; Melanouri, E.; Dedousi, M.; Panagopoulou, I.; Papanikolaou, S.; Stoforos, N.G.; Diamantopoulou, P. Sustainable and Eco-Friendly Conversions of Olive Mill Wastewater-Based Media by Pleurotus Pulmonarius Cultures. Fermentation 2022, 8, 129. [Google Scholar] [CrossRef]
- Rosa, M.; Arteiro, M. Production, Purification and Characterization of Laccase from Pleurotus Ostreatus Grown on Tomato Pomace. World J. Microbiol. Biotechnol. 2012, 28, 245–254. [Google Scholar] [CrossRef]
- Songulashvili, G.G.; Elisashvili, V.; Wasser, S.P.; Hadar, Y.; Nevo, E. Effect of the Carbon Source and Inoculum Preparation Method on Laccase and Manganese Peroxidase Production in Submerged Cultivation by the Medicinal Mushroom Ganoderma lucidum (W. Curt.: Fr.) P. Karst. (Aphyllophoromycetideae). Int. J. Med. Mushrooms 2008, 10, 79–86. [Google Scholar] [CrossRef]
- Giardina, P.; Palmieri, G.; Scaloni, A.; Fontanella, B.; Faraco, V.; Cennamo, G.; Sannia, G. Protein and Gene Structure of a Blue Laccase from Pleurotus Ostreatus. Biochem. J. 1999, 341, 655–663. [Google Scholar] [CrossRef] [PubMed]
- Ding, Z.; Chen, Y.; Xu, Z.; Peng, L.; Xu, G.; Gu, Z.; Zhang, L.; Shi, G.; Zhang, K. Production and Characterization of Laccase from Pleurotus Ferulae in Submerged Fermentation. Ann. Microbiol. 2014, 64, 121–129. [Google Scholar] [CrossRef]
- Patel, H.; Gupte, S.; Gahlout, M.; Gupte, A. Purification and Characterization of an Extracellular Laccase from Solid-State Culture of Pleurotus Ostreatus HP-1. 3 Biotech 2014, 4, 77–84. [Google Scholar] [CrossRef] [PubMed]
- Okamoto, K.; Yanagi, S.O.; Sakai, T. Purification and Characterization of Extracellular Laccase from Pleurotus Ostreatus. Mycoscience 2000, 41, 7–13. [Google Scholar] [CrossRef]
- Bettin, F.; Da Rosa, L.O.; Montanari, Q.; Calloni, R.; Gaio, T.A.; Malvessi, E.; Da Silveira, M.M.; Dillon, A.J.P. Growth Kinetics, Production, and Characterization of Extracellular Laccases from Pleurotus Sajor-Caju PS-2001. Process Biochem. 2011, 46, 758–764. [Google Scholar] [CrossRef]
- Murugesan, K.; Arulmani, M.; Nam, I.H.; Kim, Y.M.; Chang, Y.S.; Kalaichelvan, P.T. Purification and Characterization of Laccase Produced by a White Rot Fungus Pleurotus Sajor-Caju under Submerged Culture Condition and Its Potential in Decolorization of Azo Dyes. Appl. Microbiol. Biotechnol. 2006, 72, 939–946. [Google Scholar] [CrossRef]
- Sahay, R.; Yadav, R.S.S.; Yadav, K.D.S. Purification and Characterization of Extracellular Laccase Secreted by Pleurotus Sajor-Caju MTCC 141. Shengwu Gongcheng Xuebao/Chin. J. Biotechnol. 2008, 24, 2068–2073. [Google Scholar] [CrossRef]
- Al-Hagar, O.E.A.; Attia, K.S.; El-Aziz, A.F.A.; Marzook, E.A.; Mansour, H.A. Purification and Studying Some Characters of Laccase Enzyme from Irradiated Pleurotus Ostreatus ATCC 56270. Arab. J. Nucl. Sci. Appl. 2019, 52, 94–102. [Google Scholar] [CrossRef]
- Kim, T.J.; Choi, D.Y.; Yoon, K.H.; Kim, K.; Lee, S.J. Application of Mixture Rule to Determine Arrhenius Activation Energy of Time Temperature Integrator Using Mixture of Laccase from Pleurotus Ostreatus and PEGylated Laccase from Trametes Versicolor. J. Korean Soc. Appl. Biol. Chem. 2013, 56, 419–425. [Google Scholar] [CrossRef]
- Das, N.; Chakraborty, T.K.; Mukherjee, M. Purification and Characterization of a Growth-Regulating Laccase from Pleurotus Florida. J. Basic. Microbiol. 2001, 41, 261–267. [Google Scholar] [CrossRef] [PubMed]
- Lo, S.C.; Ho, Y.S.; Buswell, J.A. Effect of Phenolic Monomers on the Production of Laccases by the Edible Mushroom Pleurotus Sajor-Caju, and Partial Characterization of a Major Laccase Component. Mycologia 2002, 93, 413–421. [Google Scholar] [CrossRef]
- Saraiva, J.A.; Tavares, A.P.M.; Xavier, A.M.R.B. Effect of the Inducers Veratryl Alcohol, Xylidine, and Ligninosulphonates on Activity and Thermal Stability and Inactivation Kinetics of Laccase from Trametes Versicolor. Appl. Biochem. Biotechnol. 2012, 167, 685–693. [Google Scholar] [CrossRef]
- Ngubane, S.; Permaul, K.; Kudanga, T. Characterisation of Inhibition and Thermodynamic Properties of Trametes Pubescens Laccase and Application in the Synthesis of Hybrid Antioxidants. Process Biochem. 2022, 122, 181–193. [Google Scholar] [CrossRef]
- Ortega, N.; Sáez, L.; Palacios, D.; Busto, M.D. Kinetic Modeling, Thermodynamic Approach and Molecular Dynamics Simulation of Thermal Inactivation of Lipases from Burkholderia Cepacia and Rhizomucor Miehei. Int. J. Mol. Sci. 2022, 23, 6828. [Google Scholar] [CrossRef]
- Singha, S.; Panda, T. Optimization of Laccase Fermentation and Evaluation of Kinetic and Thermodynamic Parameters of a Partially Purified Laccase Produced by Daedalea Flavida. Prep. Biochem. Biotechnol. 2015, 45, 307–335. [Google Scholar] [CrossRef]
Figure 1.
Biomass production under different wine lees concentrations for P. ostreatus LGAM 1123. The circle symbol line denotes 100% wine lees; the square symbol line represents 60% wine lees. The open triangle symbol line denotes 40% wine lees; the triangle symbol line represents 20% wine lees. The open square symbol line denotes 10% wine lees; the open circle symbol line represents 5% wine lees.

Figure 2.
Time course for laccase production using different yeast extract concentrations for P. ostreatus LGAM 1123. Notes: 20 g/L YE (circle line), 15 g/L YE (open circle symbol line), 10 g/L YE (square symbol line), 5 g/L YE (open square symbol line), and 2.5 g/L YE (triangle symbol line).
Figure 2.
Time course for laccase production using different yeast extract concentrations for P. ostreatus LGAM 1123. Notes: 20 g/L YE (circle line), 15 g/L YE (open circle symbol line), 10 g/L YE (square symbol line), 5 g/L YE (open square symbol line), and 2.5 g/L YE (triangle symbol line).

Figure 3.
Time course for laccase production using different glucose concentrations for P. ostreatus LGAM 1123 submerged cultivation. Notes: 50 g/L glucose (circle line), 40 g/L glucose (open circle line), 30 g/L glucose (square line), 20 g/L glucose (open square line), and 10 g/L glucose (triangle symbol line).

Figure 4.
Effect of (a) pH and (b) temperature on activity of the purified laccase.

Figure 5.
(a) pH stability at 28 °C, (b) thermostability at pH 4.5, and (c) stability at 4 °C and pH 8 of the laccase produced via submerged cultivation of P. ostreatus LGAM 1123. Different letters indicate a significant difference (p ≤ 0.05) in Tukey’s multiple range test.
Figure 5.
(a) pH stability at 28 °C, (b) thermostability at pH 4.5, and (c) stability at 4 °C and pH 8 of the laccase produced via submerged cultivation of P. ostreatus LGAM 1123. Different letters indicate a significant difference (p ≤ 0.05) in Tukey’s multiple range test.


Figure 6.
Arrhenius plot for the determination of thermal activation energy from the purified laccase.
Figure 6.
Arrhenius plot for the determination of thermal activation energy from the purified laccase.


Table 1.
Characteristics of wine lees.
| Wine Lees Characterization | |
|---|---|
| pH | 3.79 ± 0.02 |
| Reducing sugars (g/L) | 1.73 ± 0.08 |
| Total phenols (g/L) | 0.180 ± 0.005 |
| Soluble protein (g/L) | 6.39 ± 0.06 |
| Color | Purple |
Table 2.
Basal growth medium for the submerged cultivation of P. ostreatus LGAM 1123.
| Substance | Concentration (g/L) |
|---|---|
| Glucose | 20 |
| Yeast extract | 10 |
| NaNO3 | 0.4 |
| MgSO4 | 1.15 |
| K2HPO4 | 0.7 |
| KCL | 0.75 |
| ZnSO4·7H2O | 0.0114 |
| CaCL2·2H2O | 0.52 |
| MnSO4·H2O | 0.03 |
| FeSO4·7H2O | 0.03 |
| (NH4)6Mo7O2·4H2O | 0.01 |
| Vitamin B1 | 0.015 |
| Sodium EDTA | 0.75 |
| CuSO4 5H2O | 0.01 |
Table 3.
Laccase and biomass production, glucose consumption, and decolorization and dephenolization of wine lees after 8 days of P. ostreatus LGAM 1123 cultivation on different initial pH levels.
Table 3.
Laccase and biomass production, glucose consumption, and decolorization and dephenolization of wine lees after 8 days of P. ostreatus LGAM 1123 cultivation on different initial pH levels.
| pH | Laccase (Units/mL) | Biomass (g/L) | Glucose Consumption (%) | Decolorization (%) | Dephenolization (%) |
|---|---|---|---|---|---|
| 5 | 10.2 ± 2.7 a | 11.4 ± 2.6 a | 62.2 ± 1.6 a | 74.40 ± 0.01 b | 77.40 ± 0.01 a |
| 6 | 12.4 ± 1.5 a | 11.4 ± 2.0 a | 54.3 ± 0.9 b | 73.40 ± 0.01 c | 74.00 ± 0.01 b |
| 7 | 5.5 ± 0.3 b | 9.4 ± 0.1 a | 47.1 ± 1.0 c | 82.30 ± 0.01 a | 70.10 ± 0.02 c |
| 8 | 2.5 ± 0.5 b | 9.4 ± 0.3 a | 44.3 ± 0.5 d | 69.60 ± 0.01 d | 66.10 ± 0.01 d |
a–d: Values with no common letters in each column indicate a significant difference (p ≤ 0.05) in Tukey’s multiple range test.
Table 4.
Maximum laccase production, glucose consumption, and decolorization and dephenolization of wine lees of P. ostreatus LGAM 1123 cultivation on different wine lees concentrations.
Table 4.
Maximum laccase production, glucose consumption, and decolorization and dephenolization of wine lees of P. ostreatus LGAM 1123 cultivation on different wine lees concentrations.
| Wine Lees Concentration | Laccase (Units/mL) | Glucose Consumption (%) | Decolorization (%) | Dephenolization (%) |
|---|---|---|---|---|
| 5% | 3.0 ± 1.3 c | 96.8 ± 0.1 ab | 64.00 ± 0.01 e | 80.40 ± 0.03 c |
| 10% | 6.3 ± 1.3 b | 97.0 ± 0.1 a | 74.20 ± 0.11 c | 79.20 ± 0.05 d |
| 20% | 14.1 ± 0.1 a | 93.6 ± 0.1 ab | 79.80 ±0.03 b | 72.80 ± 0.08 e |
| 40% | 4.3 ± 2.4 b | 83.9 ± 0.5 c | 81.40 ± 0.07 a | 83.20 ± 0.01 a |
| 60% | 2.8 ± 0.1 c | 57.8 ±4.4 d | 73.80 ± 0.10 d | 81.70 ± 0.11 b |
| 100% | 4.0 ± 0.1 b | 25.2 ± 8.6 e | 44.6 ± 0.034 f | 28.1 ± 0.06 f |
a–f: Values with no common letters in each column indicate a significant difference (p ≤ 0.05) in Tukey’s multiple range test.
Table 5.
Maximum biomass production, glucose consumption, decolorization, and dephenolization of wine lees of P. ostreatus LGAM 1123 cultivation on different YE concentrations.
Table 5.
Maximum biomass production, glucose consumption, decolorization, and dephenolization of wine lees of P. ostreatus LGAM 1123 cultivation on different YE concentrations.
| YE (g/L) | Biomass (g/L) | Glucose Consumption (%) | Decolorization (%) | Dephenolization (%) |
|---|---|---|---|---|
| 2.5 | 12.4 ± 1.3 d | 62.3 ± 1.4 d | 93.20 ± 0.02 a | 90.40 ± 0.01 c |
| 5 | 23.6 ± 0.1 a | 95.6 ± 0.7 b | 92.30 ± 0.01 b | 89.60 ± 0.01 d |
| 10 | 22.0 ± 1.4 ab | 98.4 ± 0.0 a | 91.20 ±0.01 c | 90.00 ± 0.01 b |
| 15 | 19.8 ± 3.3 bc | 90.8 ± 1.9 c | 80.00 ± 0.01 d | 85.70 ± 0.01 e |
| 20 | 20.9 ± 0.5 abc | 96.2 ± 0.1 ab | 76.70± 0.02 e | 91.70 ± 0.01 a |
a–e: Values with no common letters in each column indicate a significant difference (p ≤ 0.05) in Tukey’s multiple range test.
Table 6.
Maximum biomass production, glucose consumption, decolorization, and dephenolization of wine lees of P. ostreatus LGAM 1123 cultivation on different glucose concentrations. No common letters (from a to e) in each column indicate a significant difference (p ≤ 0.05) in Tukey’s multiple range test.
| Glucose Concentration (g/L) | Biomass (g/L) | Glucose Consumption (%) | Decolorization (%) | Dephenolization (%) |
|---|---|---|---|---|
| 10 | 12.5 ± 0.2 d | 92.8 ± 1.4 b | 85.50 ± 0.01 d | 90.40 ± 0.03 b |
| 20 | 20.5 ± 0.0 c | 94.6 ± 0.7 ab | 83.30 ± 0.01 c | 89.60 ± 0.01 d |
| 30 | 20.7 ± 1.3 bc | 96.9 ± 0.0 a | 97.30 ± 0.01 b | 90.00 ± 0.08 c |
| 40 | 23.6 ± 1.0 ab | 85.2 ± 1.9 c | 98.30 ± 0.01 a | 85.70 ± 0.01 e |
| 50 | 24.6 ± 2.5 a | 56.7 ± 0.1 d | 98.30 ± 0.01 a | 91.70 ± 0.01 a |
a–e: Values with no common letters in each column indicate a significant difference (p ≤ 0.05) in Tukey’s multiple range test.
Table 7.
Biomass composition in the cultivation of P. ostreatus LGAM 1123 in a 3.5 L stirred tank bioreactor with an optimum growth medium using wine lees.
Table 7.
Biomass composition in the cultivation of P. ostreatus LGAM 1123 in a 3.5 L stirred tank bioreactor with an optimum growth medium using wine lees.
| Bioactive Compound | Method | g/100 g Biomass |
|---|---|---|
| Proteins | Total proteins (Dumas) | 42.8 ± 2.4 |
| Soluble intracellular protein (BCA) | 21.4 ± 1.2 | |
| Essential amino acids (dabsyl derivatives (HPLC)) | 16.4 ± 0.1 | |
| Lipids | Chloroform/methanol (2:1 v/v) | 29.5 ± 2.7 |
| Carbohydrates | Total carbohydrates (Visca et al. [28]) | 29.4 ± 2.7 |
Table 8.
Purification and characterization of laccase produced by P. ostreatus LGAM 1123 in 2 L of an optimum growth medium using wine lees.
Table 8.
Purification and characterization of laccase produced by P. ostreatus LGAM 1123 in 2 L of an optimum growth medium using wine lees.
| Purification Step | Total Protein (mg) | Total Activity (Units) | Specific Activity (U/mg) | Purification Fold | Recovery |
|---|---|---|---|---|---|
| Crude laccase | 215.2 | 27,940 | 129.8 | 1 | 100 |
| Ammonium sulfate treatment | 151.6 | 27,540 | 181.7 | 1.4 | 98.6 |
| Anion exchange | 21.9 | 12,380 | 565.3 | 4.4 | 44.3 |
Table 9.
Thermodynamic parameters for the thermal inactivation of laccase produced by P. ostreatus LGAM 1123.
Table 9.
Thermodynamic parameters for the thermal inactivation of laccase produced by P. ostreatus LGAM 1123.
| T (°C) | T (Kelvin) | t1/2 (h−1) | D (h−1) | ΔH* (kJ/mol) | ΔG* (kJ/mol) | ΔS* (J/mol*K) |
|---|---|---|---|---|---|---|
| 4 | 277.2 | 136 ± 8 a | 451 ± 28 a | 74.3 ± 1.2 a | 98.7± 0.1 a | −90.5 ± 1.3 a |
| 20 | 293.2 | 14.8 ± 0.3 b | 49 ± 1 b | 74.1 ± 1.1 a | 99.2 ± 0.1 b | −87.5 ± 1.2 bc |
| 30 | 303.2 | 3.81 ± 0.47 c | 12.7 ± 1.6 c | 74.1 ± 1.2 a | 99.2 ± 0.3 b | −85.0± 1.3 cde |
| 40 | 313.2 | 1.30 ± 0.08 cd | 4.31 ± 0.26 cd | 74.0 ± 1.1 a | 99.8 ± 0.1 c | −84.3 ± 1.3 c |
| 50 | 323.2 | 1.14 ± 0.10 cde | 3.39 ± 0.27 cde | 73.9 ± 1.1 a | 102.4 ± 0.2 d | −90.1 ± 1.3 ab |
| 60 | 333.2 | 0.26 ± 0.01 cde | 0.86 ± 0.05 cde | 73.8 ± 1.1 a | 101.9 ± 0.1 e | −86.0 ± 1.3 cd |
a–e: Values with no common letters in each column indicate a significant difference (p ≤ 0.05) in Tukey’s multiple range test.
Disclaimer/Publisher’s Note: The statements, opinions and data contained in all publications are solely those of the individual author(s) and contributor(s) and not of MDPI and/or the editor(s). MDPI and/or the editor(s) disclaim responsibility for any injury to people or property resulting from any ideas, methods, instructions or products referred to in the content. |
© 2023 by the authors. Licensee MDPI, Basel, Switzerland. This article is an open access article distributed under the terms and conditions of the Creative Commons Attribution (CC BY) license (https://creativecommons.org/licenses/by/4.0/).
Share and Cite
MDPI and ACS Style
Bakratsas, G.; Antoniadis, K.; Athanasiou, P.E.; Katapodis, P.; Stamatis, H. Laccase and Biomass Production via Submerged Cultivation of Pleurotus ostreatus Using Wine Lees. Biomass 2024, 4, 1-22. https://doi.org/10.3390/biomass4010001
AMA Style
Bakratsas G, Antoniadis K, Athanasiou PE, Katapodis P, Stamatis H. Laccase and Biomass Production via Submerged Cultivation of Pleurotus ostreatus Using Wine Lees. Biomass. 2024; 4(1):1-22. https://doi.org/10.3390/biomass4010001
Chicago/Turabian StyleBakratsas, Georgios, Kyriakos Antoniadis, Panagiotis E. Athanasiou, Petros Katapodis, and Haralambos Stamatis. 2024. "Laccase and Biomass Production via Submerged Cultivation of Pleurotus ostreatus Using Wine Lees" Biomass 4, no. 1: 1-22. https://doi.org/10.3390/biomass4010001