

Factors Influencing the Rheology of Methane Foam for Gas Mobility Control in High-Temperature, Proppant-Fractured Reservoirs

1
Hildebrand Department of Petroleum and Geosystems Engineering, The University of Texas at Austin, 200 E. Dean Keeton Stop C0300, Austin, TX 78712, USA
2
The Dow Chemical Company, 230 Abner Jackson Pkwy/ECB/2A218, Lake Jackson, TX 77566, USA
*
Author to whom correspondence should be addressed.
Colloids Interfaces 2024, 8(1), 13; https://doi.org/10.3390/colloids8010013
Submission received: 6 October 2023
/
Revised: 23 November 2023
/
Accepted: 29 January 2024
/
Published: 4 February 2024
(This article belongs to the Special Issue Crude Oil Recovery)
Abstract
:Gas-enhanced oil recovery (EOR) through huff-n-puff (HnP) is an important method of recovering oil from fracture-stimulated reservoirs. HnP productivity is hampered by fracture channeling, leading to early gas breakthroughs and gas losses. To mitigate these issues, foam-generating surfactants have been developed as a method of reducing injected gas phase mobility and increasing oil recovery. This work investigates foam generation and propagation by a proprietary surfactant blend in high-temperature, high-pressure, high-permeability, and high-shear conditions that simulate the environment of a proppant-packed fracture. Bulk foam tests confirmed the aqueous stability and foaming viability of the surfactant at the proposed conditions. Through several series of floods co-injecting methane gas and the surfactant solution through a proppant pack at residual oil saturation, the effects of several injection parameters on apparent foam viscosity were investigated. The foam exhibited an exceptionally high transition foam quality (>95%) and strong shear-thinning behavior. The foam viscosity also linearly decreased with increasing pressure. Another flood series conducted in an oil-free proppant pack showed that swelling of residual oil had no effect on the apparent foam viscosity and was not the reason for the inversely linear pressure dependency. An additional flood series with nitrogen as the injection gas was completed to see if the hydrophobic attraction between the methane and surfactant tail was responsible for the observed pressure trend, but the trend persisted even with nitrogen. In a previous study, the dependence of foam viscosity on pressure was found to be much weaker with a different foaming surfactant under similar conditions. Thus, a better understanding of this important phenomenon requires additional tests with a focus on the effect of pressure on interfacial surfactant adsorption.
1. Introduction
With energy demand increasing and available conventional oil sources depleting, many have turned their attention to developing unconventional oil reservoirs [1,2,3]. Of all unconventional sources, shale/tight oils have become the primary plays for unconventional oil recovery due to their great potential, with over 2 trillion barrels of oil deposits in U.S. shale plays and over 30 billion barrels of total tight oil reserves estimated in 24 North American reservoirs [1,2,4,5,6]. Through primary production techniques, less than 10% of the original oil in place is recovered from tight oil reservoirs, with some having recovery factors as low as 2%. Several additional factors can also hamper oil production, such as organic deposition, poor mobility control, inadequate fluid containment, and more [7,8,9]. With so much oil being left unrecovered, enhanced oil recovery (EOR) techniques must be researched and developed to increase recovery and economic efficiency without the need for re-fracking, which comes with heightened environmental concern [1,10,11,12,13,14].
The most widely used EOR method for shale/tight oils is gas injection [15,16]. Common gases used include CO2 and hydrocarbon gases [16]. The most promising mode of gas injection in these unconventional formations is huff-n-puff (HnP) [10,15,17]. In this EOR process, gas is injected into a well to build reservoir pressure (the huff); then, the well can be shut-in for a period of time (the soak); and finally, the well is turned back into a production well (the puff) until production declines to a set point, and the process is repeated [13,18,19,20]. Use of HnP has shown success with unconventional reservoirs in increasing oil recovery and in economic efficiency through simulation, laboratory, and field pilot tests [10,17,18,20,21,22,23].
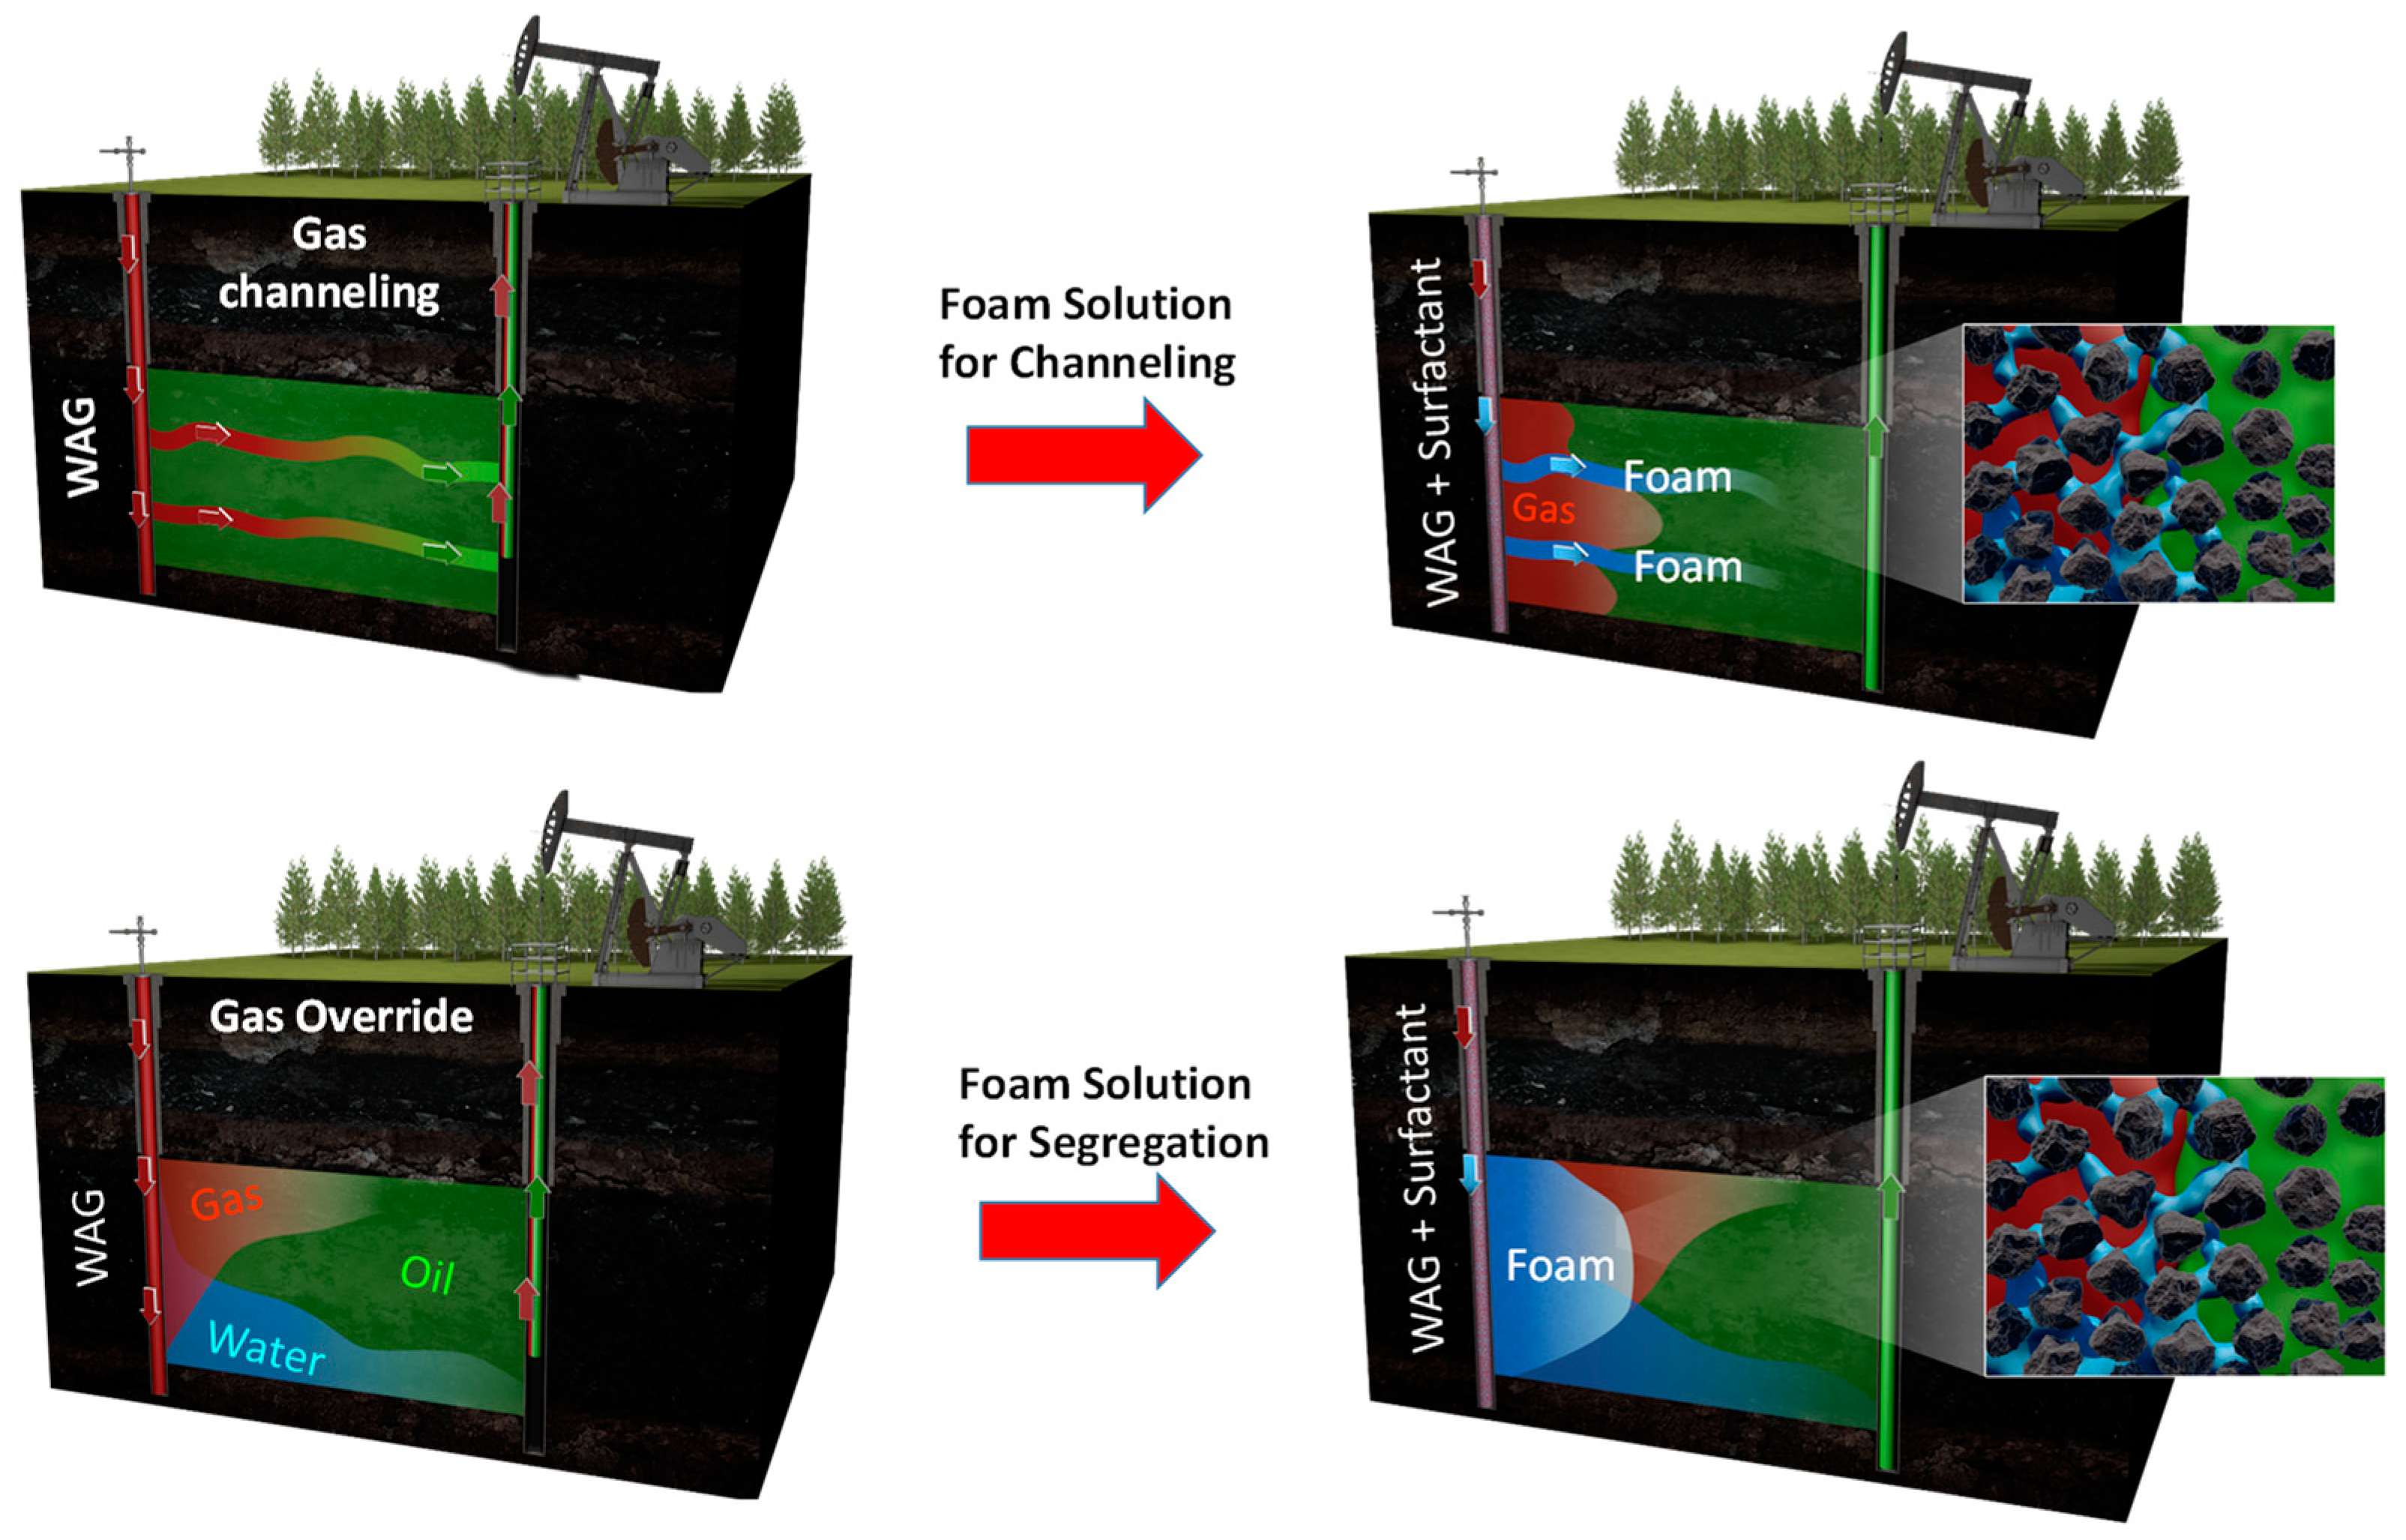
The use of gas injection to enhance oil recovery in both conventional and unconventional reservoirs, however, does come with some impediments, including early gas breakthrough and poor sweep efficiency due to gravity override, channeling through high-permeability zones, and viscous fingering, which cause decreased well productivity [9,14,20,24,25]. There are two main contributors to conformance issues in HnP of tight oil reservoirs: well interference and fracture channeling [9,13,22,24,25,26,27,28,29,30,31]. To limit these conformance issues, researchers have developed several methods for improving the mobility control of the injection gas. Foam, as an alternative to polymers, is one such mobility control agent for diverting the injection gas from the high-permeability areas to the low-permeability areas in gas flooding, as shown in Figure 1 [3,32,33,34,35]. Polymers, such as gelling agents, are not suitable for fracture-stimulated reservoirs due to their potentially damaging nature against productive fracture channels and their tendency to degrade in high-shear, high-temperature conditions, so foaming surfactants offer a viable alternative [3,15,36,37,38]. By increasing the apparent viscosity of the injection gas, foam can also reduce out-of-zone injection (i.e., gas leak-off due to well interference) [24,39]. Foam has proven to be an effective mobility control agent in several EOR techniques, including HnP, hot water flooding, low-tension gas flooding, and much more [24,40,41,42]. While the use of foam to mitigate conformance issues for gas HnP in fractured reservoirs is a relatively new area of study, recent laboratory investigations and field pilots have shown encouraging results [24,39,43].
With the successful use of foaming surfactants in field pilots to alleviate concerns about conformance control and increase recovery with HnP in fractured reservoirs, attention now turns to understanding how foam is generated and propagates through proppant-packed fracture networks. Gas HnP in tight oil reservoirs and foam flow in fractures are still limited and in their early stages of development, so a better understanding of how foam rheology evolves in fractures is vital to continued optimization and improvement of this EOR method [1,44,45]. A lot of work has been conducted to observe foam behavior in non-propped hydraulic fractures and naturally fractured reservoirs using parallel plate setups [44,46,47], fractured shale and carbonate cores [12,39,48,49,50,51], acrylic fracture network models [52,53], and fracture networks in marble slabs to represent the fracture environment in tight oil reservoirs [45]. Because of the complexity of fracture networks and the difficulty of foam generation in extreme conditions, many studies have used simulation models to look at foam rheology in propped and non-propped fractures [14,29,50,54,55]. Previous studies have also employed microvisual models to observe foam generation and structure at the pore scale [56,57,58]. Several experiments have also gone the route of analyzing how foam flow is affected by various characteristics of the fractures, including aperture, surface roughness, proppant sorting, shape, and network complexity [14,46,52,54,55,58]. With the success of surfactant-stabilized foam in improving unconventional oil recovery, some researchers have also investigated how different foam additives, such as nanoparticles [54], and alternatives, including microemulsions [59] and polymers [60], can further improve conformance control and oil recovery.
This literature review showed that there is still a substantial gap in understanding the rheology of foam flow in proppant-filled fractures under realistic conditions. Most work performed on foam propagation in fractures is focused on the success of using foam to improve conformance control and boost ultimate oil recovery rather than understanding the physics of foam propagation in such a system [24,39,43,48,49,53]. While some have briefly looked at the effect of foam quality and flow rate on foam rheology in fractures, the lack of a systematic experimental design to truly characterize these effects is evident [46,52,55,58]. A concrete characterization of the effect of flow rate is specifically important because of the heterogeneous conductivity of the fractures, meaning some will experience greater shear than others [25]. Furthermore, there is a deficiency in the literature addressing the effect of pressure on foam flow in propped fractures. Understanding the effect of pressure is vital for HnP application since the fundamental basis of HnP is using an immense change in pressure to boost gas penetration in the matrix, enhance gas-oil contact, and improve oil recovery [22]. For HnP field pilots, pressure fluctuation is usually between 2000 psi and 6000 psi, so it is important to understand how foam rheology will be affected under such a pressure change [27].
In this work, the focus is on the behavior of surfactant-stabilized foam generated with methane gas in high-pressure, high-temperature, high-permeability, high-shear, proppant-filled fractures, of which there is very little literature available [24,61]. In developing the methodology for these experiments, it was important to keep the system as representative of a propped fracture in a real reservoir as possible since failing to maintain realistic conditions can lead to misleading results [1,61]. Thus, several aspects of these experiments were taken directly from an actual field pilot, such as the high system temperature, the use of methane gas as an EOR gas, the surfactant formulation, the proppants used in the proppant pack, and the co-injection mode. The implementation of a sand pack to simulate the high-permeability, proppant-filled fractures in tight oil reservoirs has been a successful technique used in previous studies since the propped fracture acts as a porous medium for foam propagation [54,57,59,60,62]. Next, several characterization tests were performed with the foaming surfactant formulation to exemplify its ability as a foamer and its viability for use in high-temperature and high-pressure conditions. After that, a systematic, factorial core flooding program varying foam quality, flow rate, and pressure was undertaken using the proppant pack. The change in foam viscosity under these different conditions was analyzed and trended to see how foam behaves with variance in these important influencing factors. Thus, the data could be used to create a rheological model for foam flow in propped fractures and to predict foam behavior in the field.
2. Results and Discussion
2.1. Surfactant Characterization
2.1.1. Effect of Oil on Foam Stability
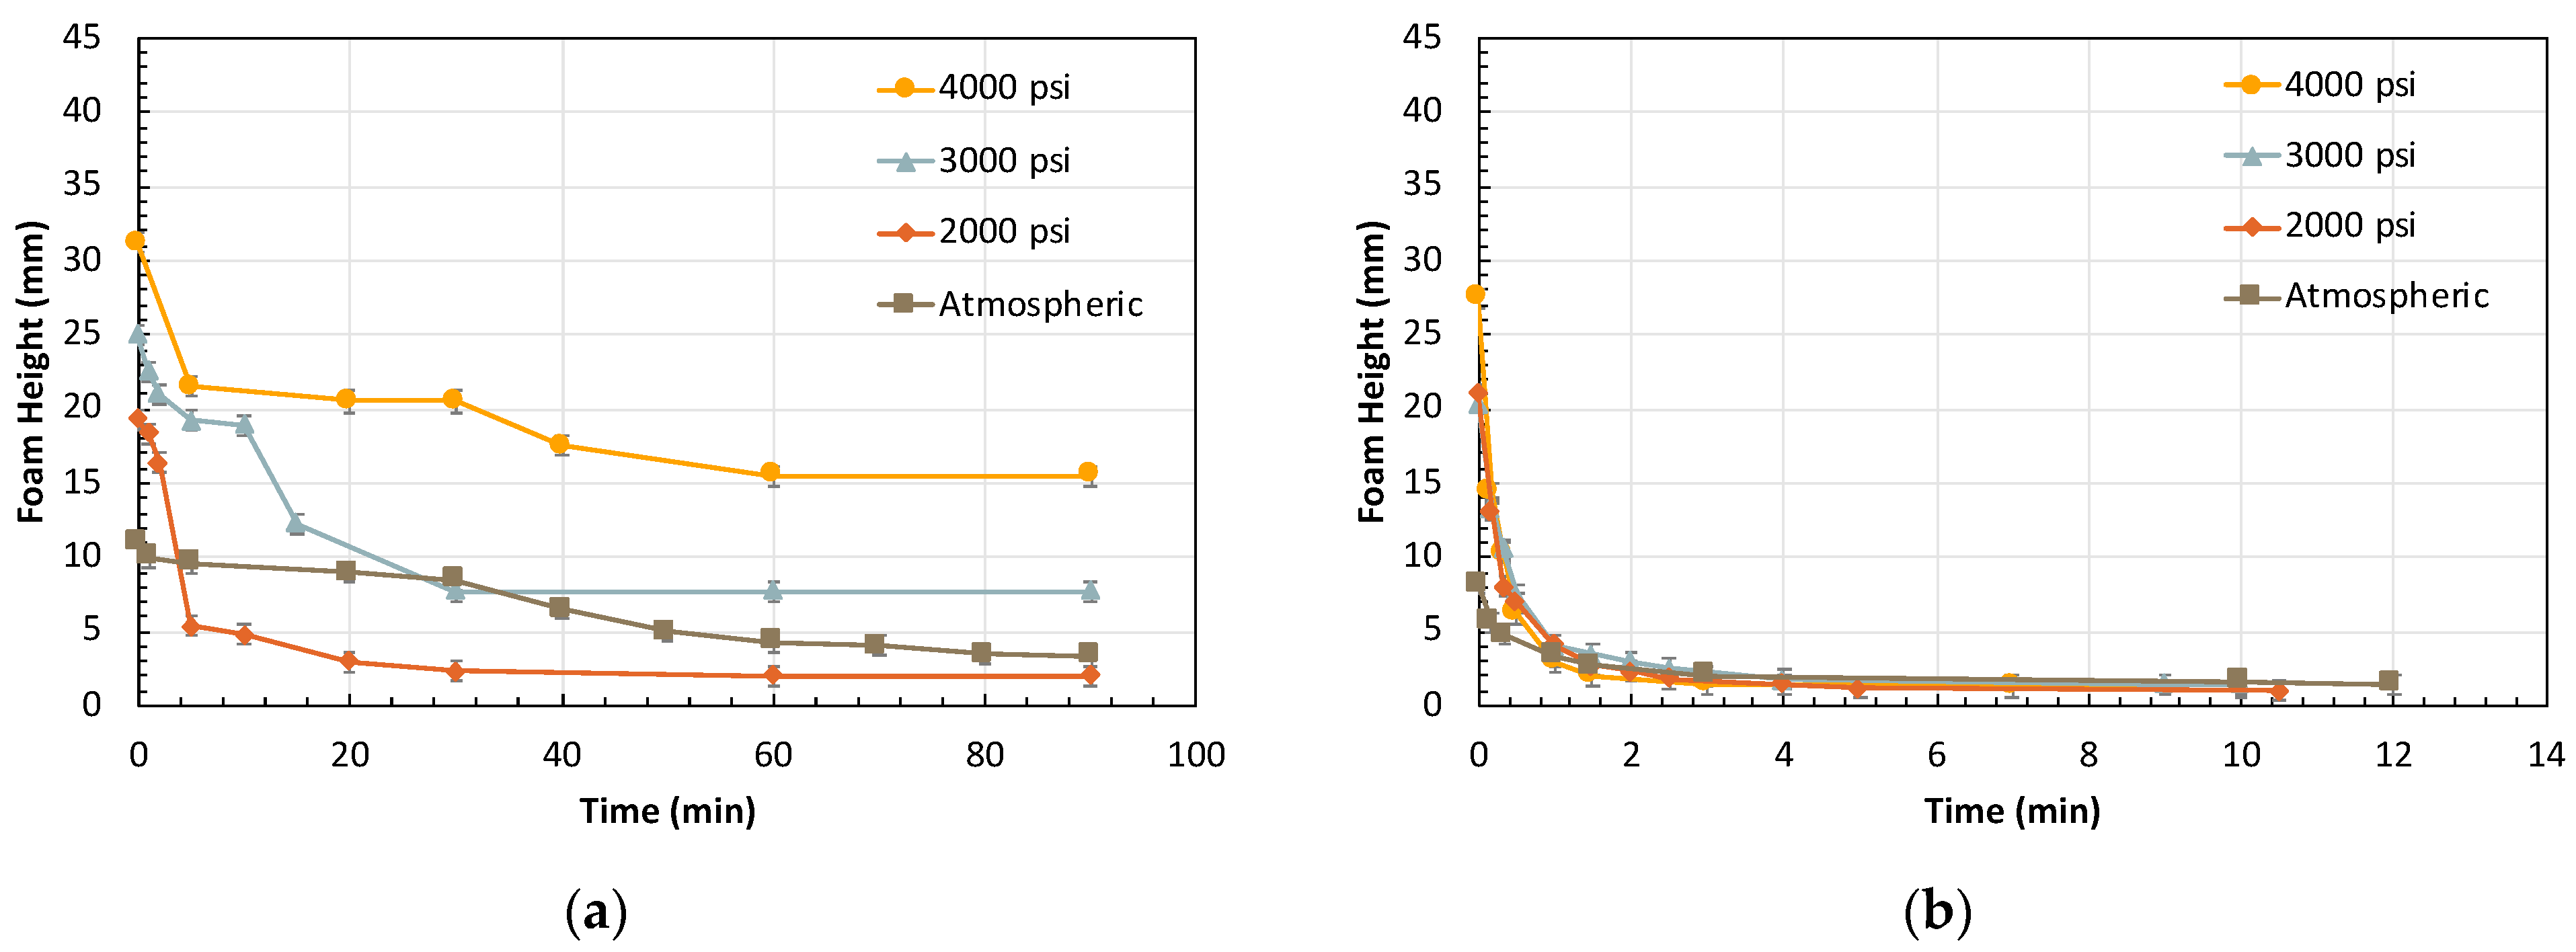
Initial foam stability tests showed that the surfactant was indeed stable and capable of foaming at the temperature and salinity of the fracture environment. With the confirmation of the foam stability criterion, a more in-depth look was taken at the decay of the foam under high pressure and temperature with and without oil present, as the introduction of high pressure and oil is more representative of the fracture environment. Figure 2 shows the effect of pressure on the bulk foam decay at 298 K, both with and without oil added.
Without oil present, the initial foam height increases with pressure. The transience in foam height decay is very similar at all pressures, but generally it can be seen that, in these bulk foam tests, foamability and foam stability increase with pressure. This behavior agrees with previous literature on bulk foam stability, which suggests that improved hydrophilic-lipophilic balance (HLB) and smaller bubble size at higher pressure could be responsible for greater bulk foam stability [63,64]. However, these previous studies were conducted in the absence of oil. In the presence of oil, though the same initial foam height trend can be seen, the transient decay of the foam height is essentially identical across all pressures and much faster than that in the presence of oil. This detrimental effect of oil on bulk foam stability is commonly observed throughout bulk foam experiments [65,66,67,68]. This indistinguishable decay rate across several pressures in Figure 2b shows the dominant impact of oil-induced foam destruction compared to the positive effect of pressure on foam generation.
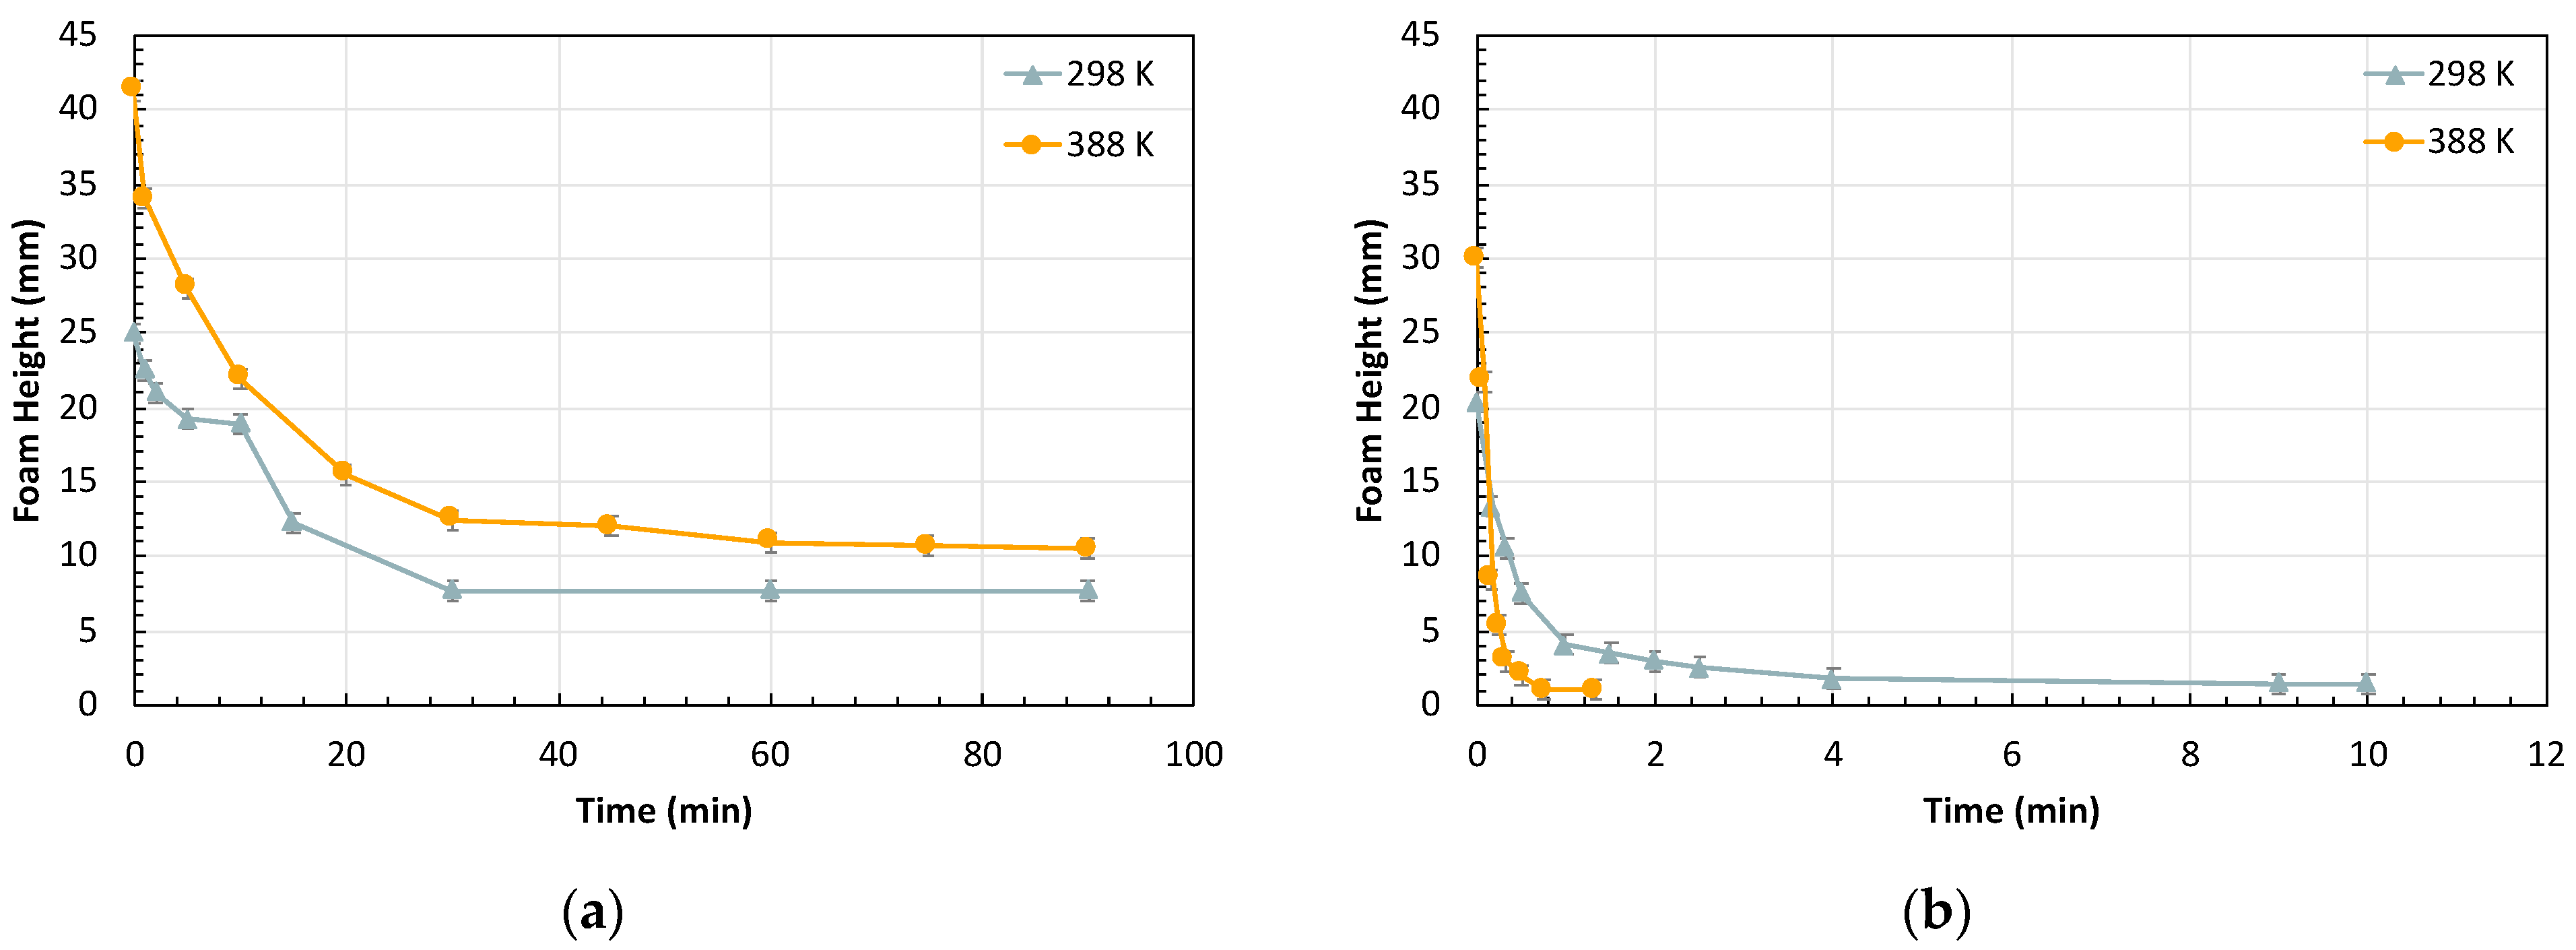
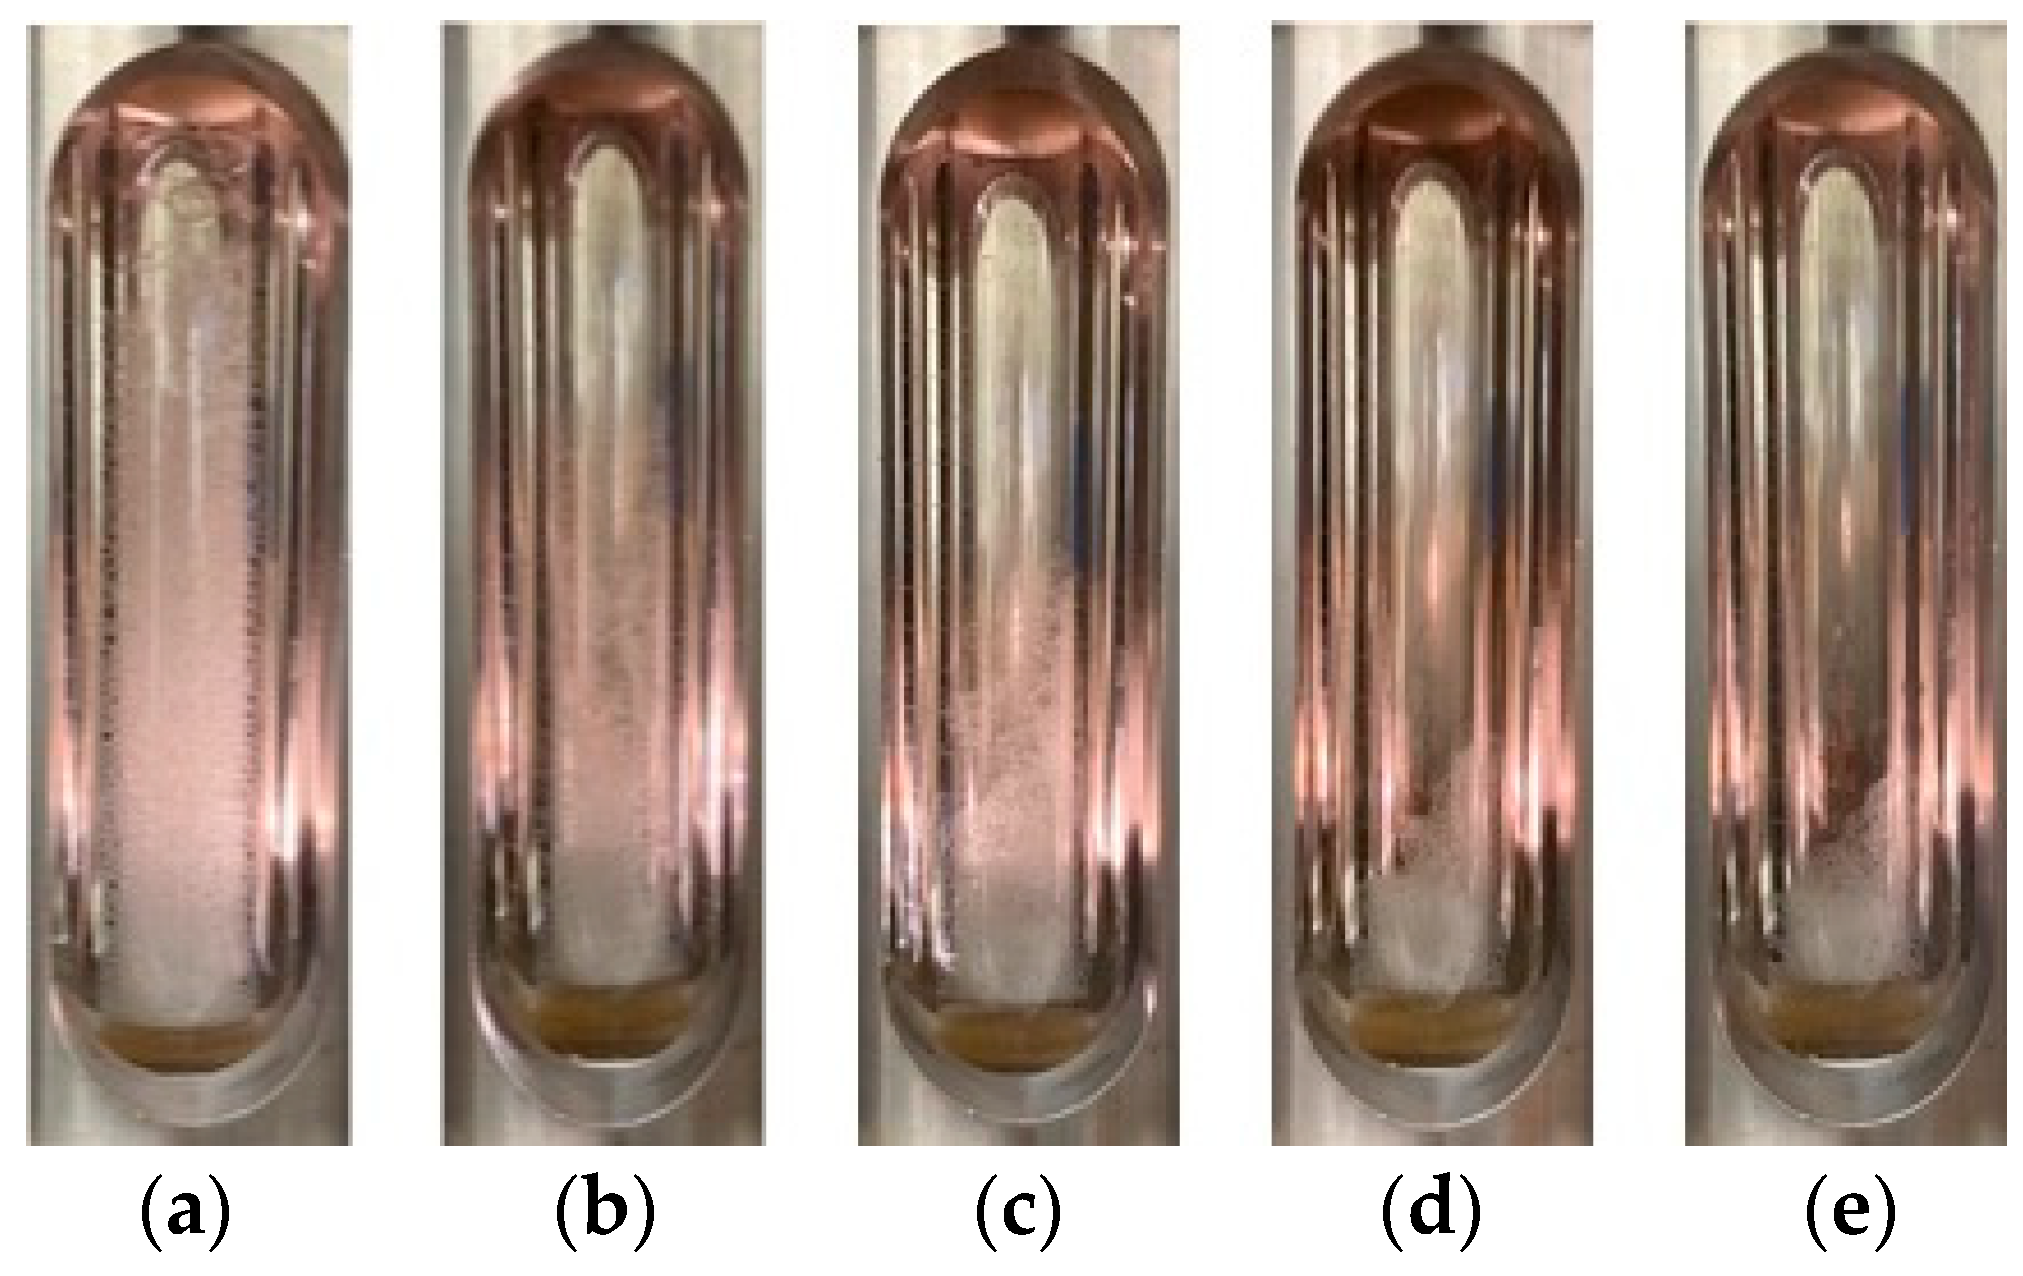
The effect of temperature on the surfactant solution’s foamability at 3000 psi, both with and without oil, is shown in Figure 3. Without oil, the foaming formulation seems to perform better at 388 K, but when oil is added, the formulation shows slower decay at 298 K. In the no-oil case, the foam stability of the surfactant solution seems to be unaffected, if not slightly improved, at the elevated temperature. Previous studies have shown that foams commonly experience increased film drainage at elevated temperatures, leading to film thinning and coalescence. However, some surfactant formulations have the ability to better withstand elevated temperatures due to higher hydrophilicity, which results in a tighter, thicker surfactant monolayer that improves film stability and prevents film drainage, which could explain the behavior seen in Figure 3a [63,64,69]. When oil is present, the observation of bulk foam stability at higher temperatures better fits what is found in the literature because foam stability decreases with lower oil viscosity due to greater spreading of the oil over the lamella film, and oil viscosity decreases at higher temperatures [67]. The purpose of the work presented here was to verify that the formulation continues to perform as a viable foamer in high-pressure and high-temperature conditions, which it does. The progression of foam height and texture in the bulk foam test without oil at 388 K and 3000 psi can be seen in Figure 4.
2.1.2. Emulsion Tendency Test
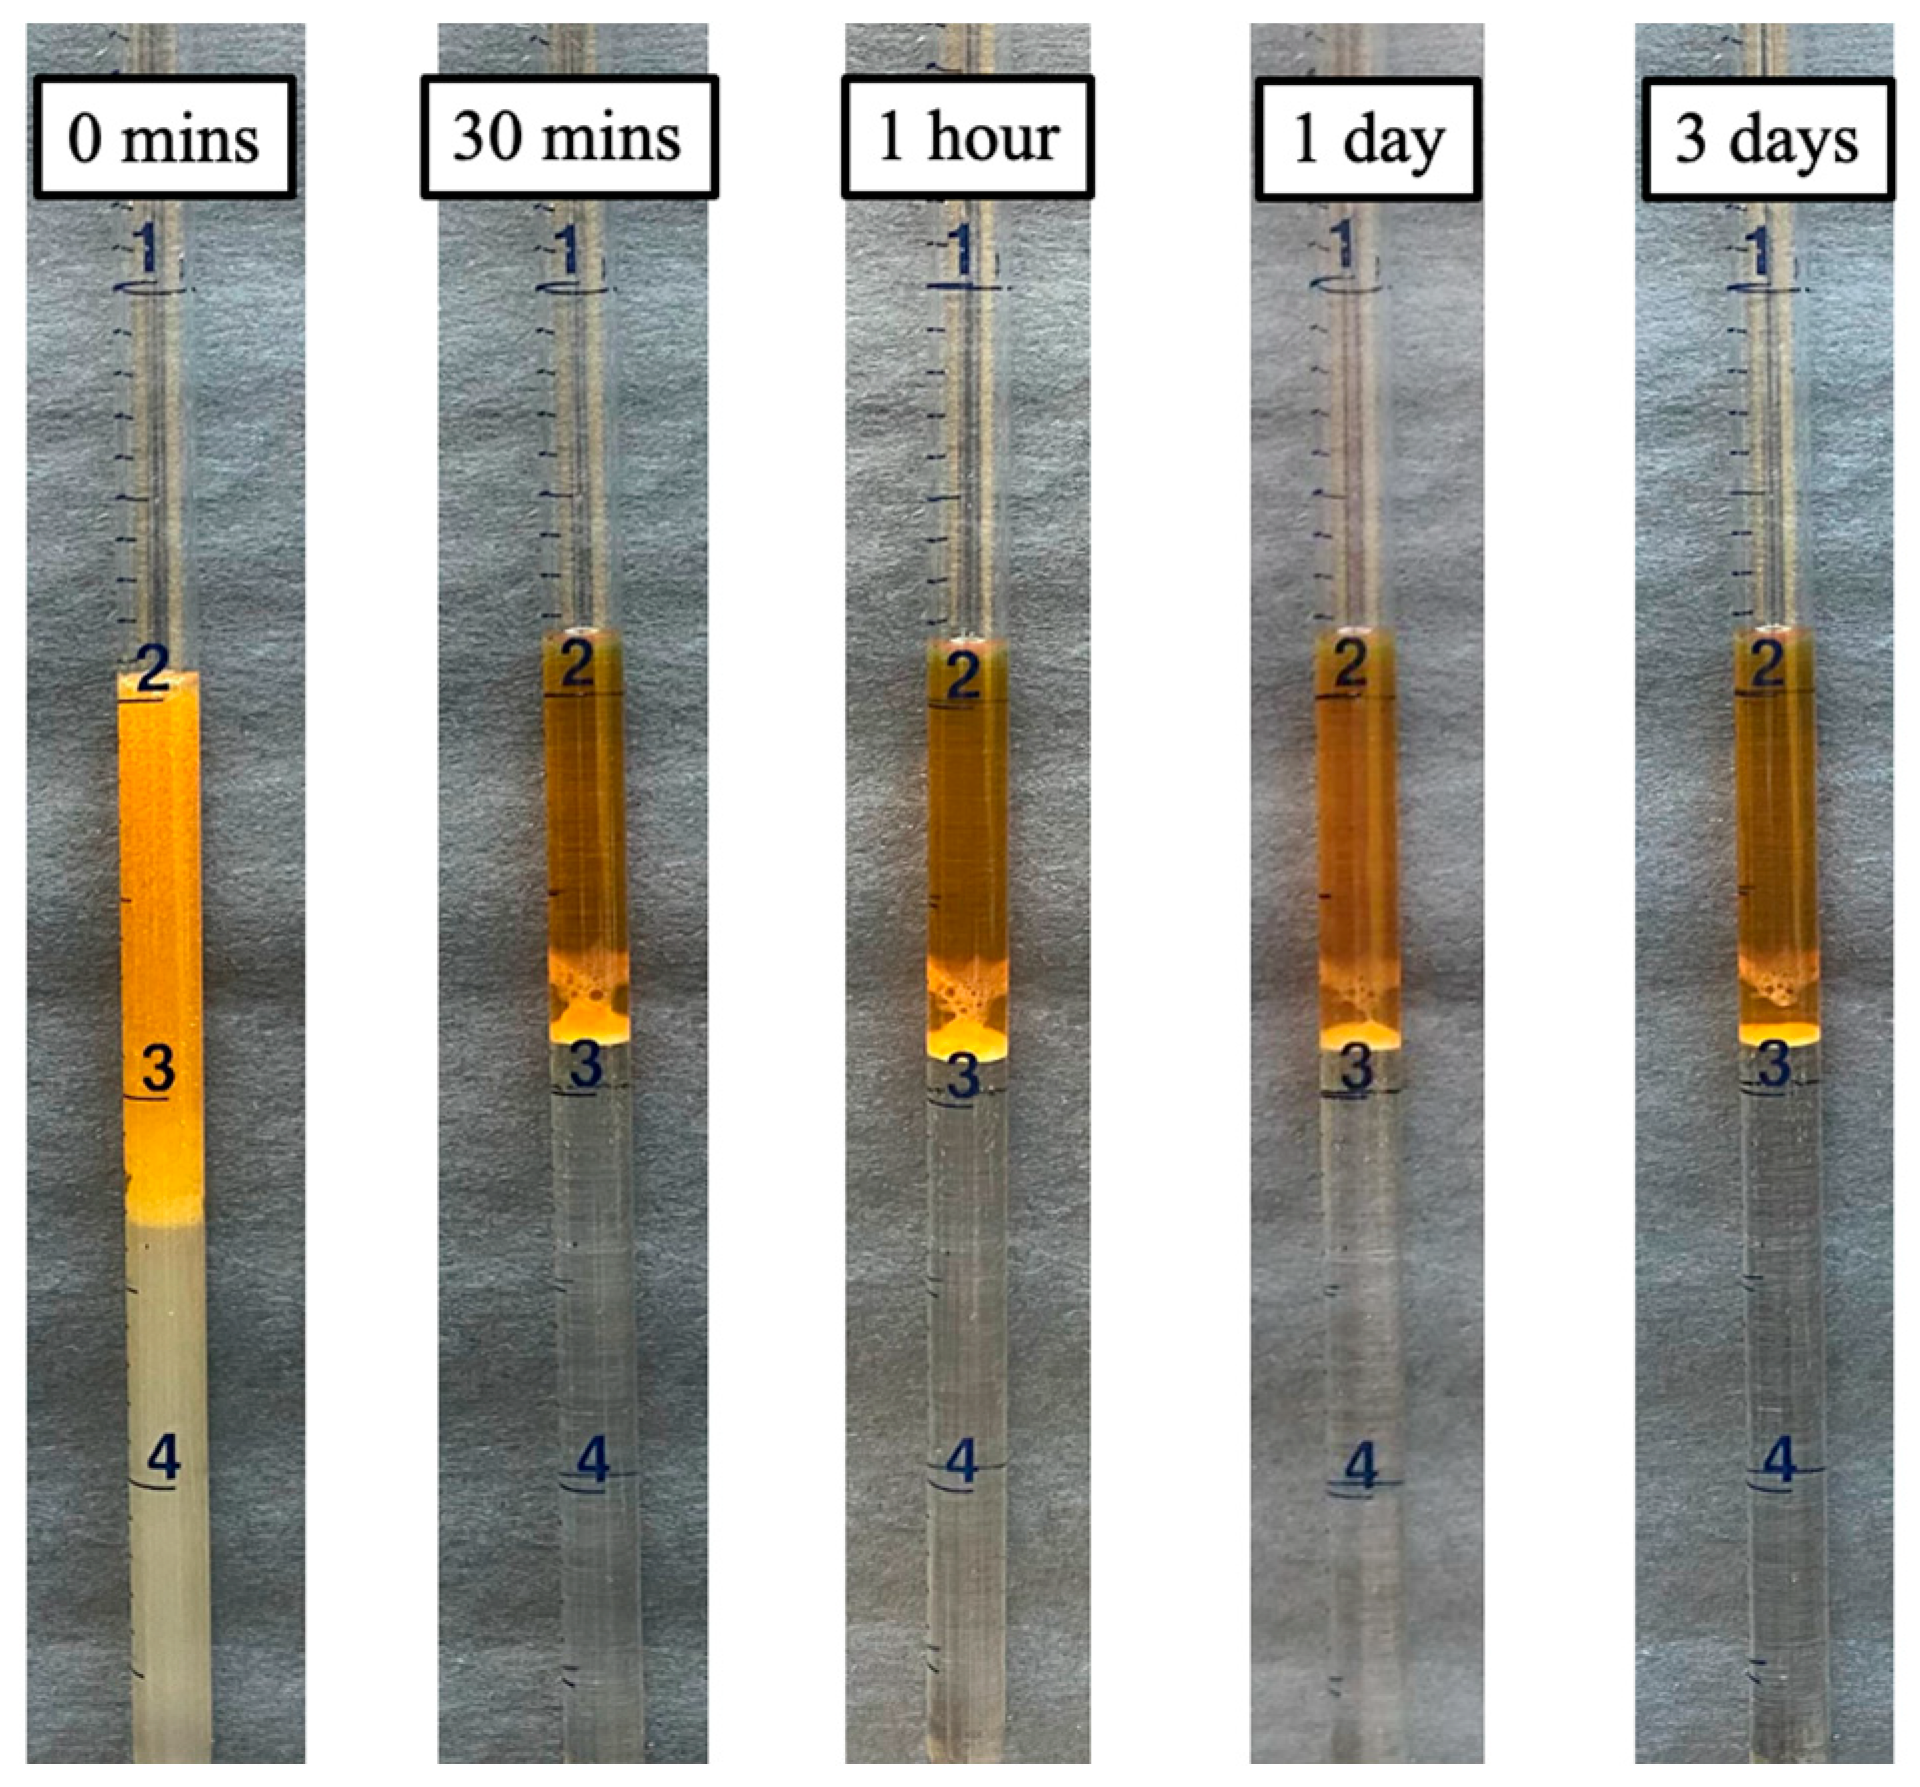
A key criterion for surfactant selection was the minimal tendency for long-lasting, viscous emulsion formation when mixed with crude oil, as these emulsions can adversely impact in situ oil transport and prove difficult and costly to separate during post-production processes [70]. To match the separation processes in the field, a criterion of 45 min for emulsion separation was instituted. In addition, the in situ formation of viscous emulsions during core floods can cause a higher pressure drop and be mistaken for stronger foam generation, when in reality the destabilization of the foam is being compensated for by these viscous emulsions [62]. The results of the emulsion tendency test are reported in Figure 5. Within 30 min, most of the emulsions separated, and only a small amount of Winsor Type III-like emulsions remained. Winsor Type III emulsions refer to a middle-phase layer of microemulsions at the interface of the aqueous and oil phases [71,72]. These lingering emulsions, however, persisted for multiple days, forming a small phase. Upon further evaluation, it was observed that these emulsions were not viscous. Therefore, the surfactant formulation is still viable for use in the experimental flooding program.
2.2. Foam Transport through Proppant Pack Results
2.2.1. Foam Rheology at Residual Oil
The baseline pressure drop values were within the measurement effort and were not leveraged further. Subsequently, proppant pack foaming experiments were performed to investigate the effect of three key injection parameters: foam quality, total flow rate, and system pressure.
2.2.2. Effect of Foam Quality
Previous literature has established the existence of two distinct flow regimes: a low-quality, wet regime and a high-quality, dry regime. In the low-quality regime, foam behavior is gas-rate dependent and dominated by bubble trapping and mobilization, and the foam viscosity is expected to increase with increasing FQ. In the high-quality regime, foam behavior is liquid-rate dependent and dominated by limiting capillary pressure and bubble coalescence, and foam viscosity is expected to increase with decreasing FQ [73,74,75]. The transition between the two regimes is marked by a peak in foam viscosity, and referred to as the transition foam quality [76].
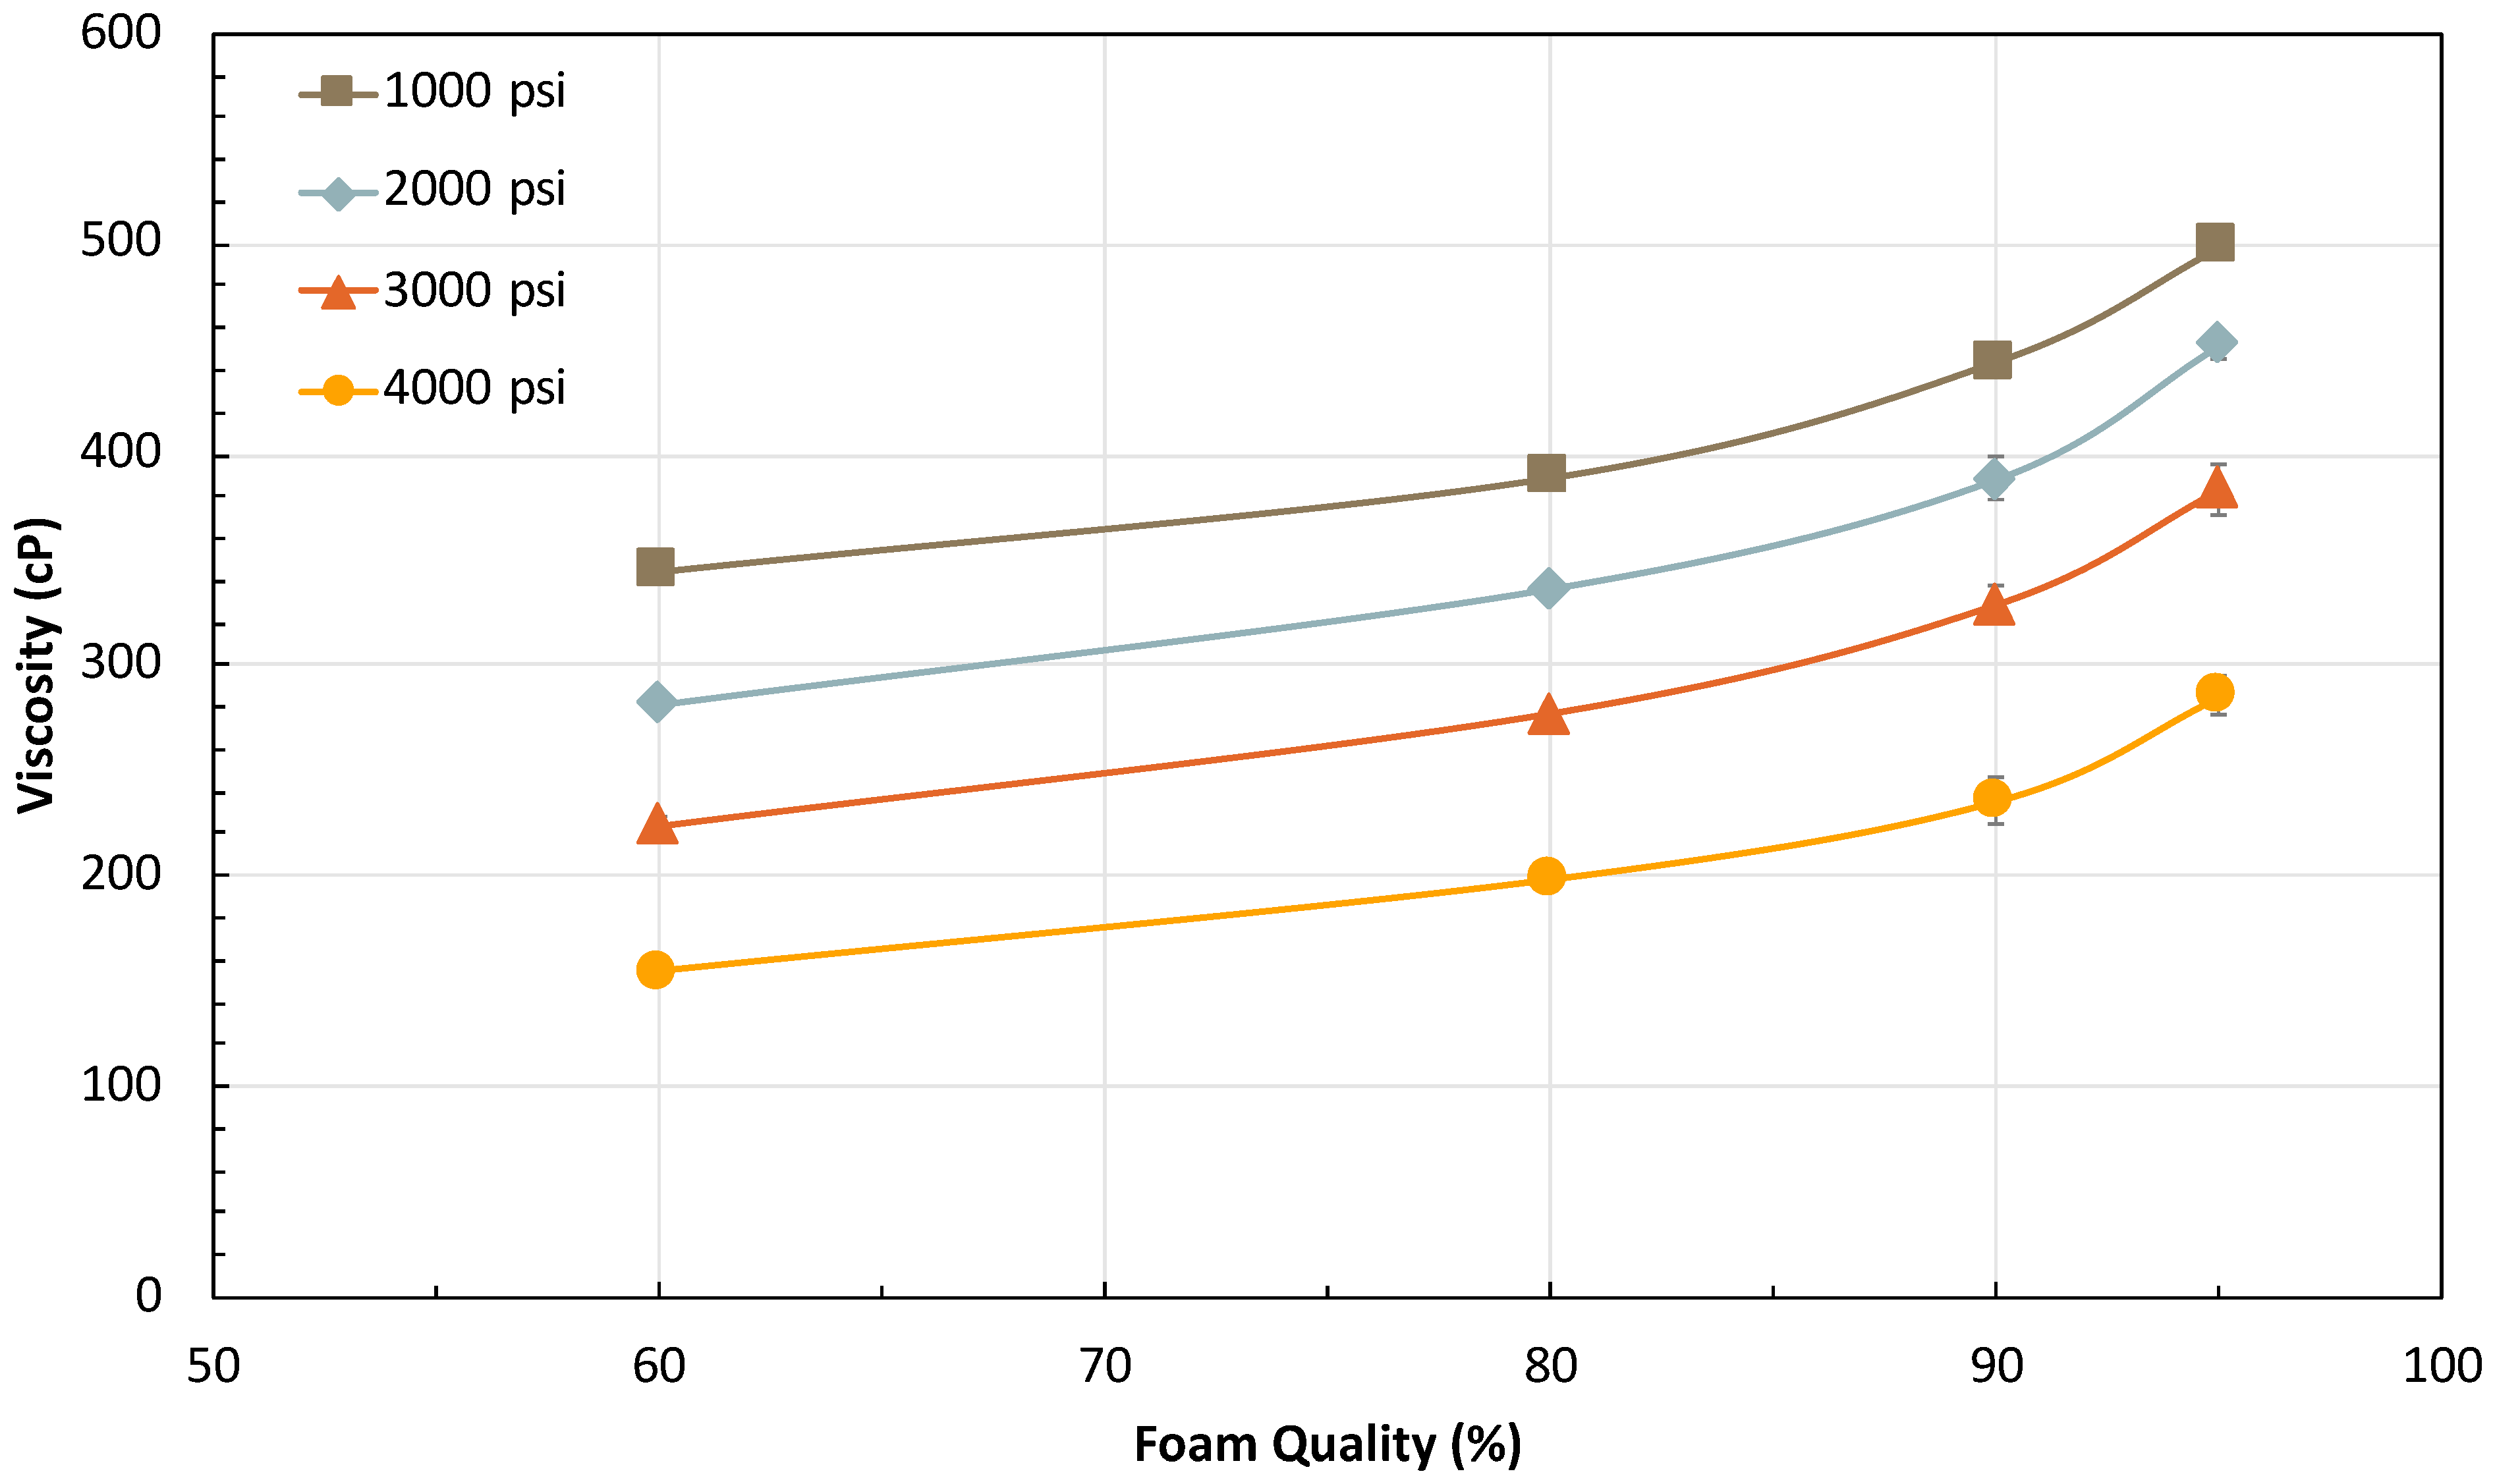
Usually, the transition foam quality is observed at ≤90% FQ [74,77]. However, the sample of data presented in Figure 6 shows that, in this case, the foam viscosity increases through the complete FQ scan; all data presented in Figure 6 and all subsequent graphs have an error of less than 3%. This indicates that the foam remains in the low-quality regime up to 95% FQ and exhibits an exceptionally high transition FQ, which has been rarely seen before in similar high-pressure, high-temperature conditions [69]. This observation held true across all flow rate and pressure scans and exemplified the foam’s ability to withstand dryer conditions and generate foam with minimal water and surfactant injection during a field implementation. Dry-out occurs as the FQ increases and the capillary pressure approaches the limiting capillary pressure, resulting in the thinning of aqueous films as well as foam coalescence [65,74,78]. Evidence of such a high transition FQ indicates that the foam observed in this work must have a high limiting capillary pressure. While this is primarily discussed as a result of the surfactant type, limiting capillary pressure can also be affected by gas velocity and the permeability of the porous medium [78]. Additionally, injecting less aqueous solution is better for maintaining reservoir integrity and productivity, and injecting more gas is more favorable for production during the puff stage due to gas-induced oil swelling and expansion from pressure reduction [38,79].
2.2.3. Effect of Total Flow Rate
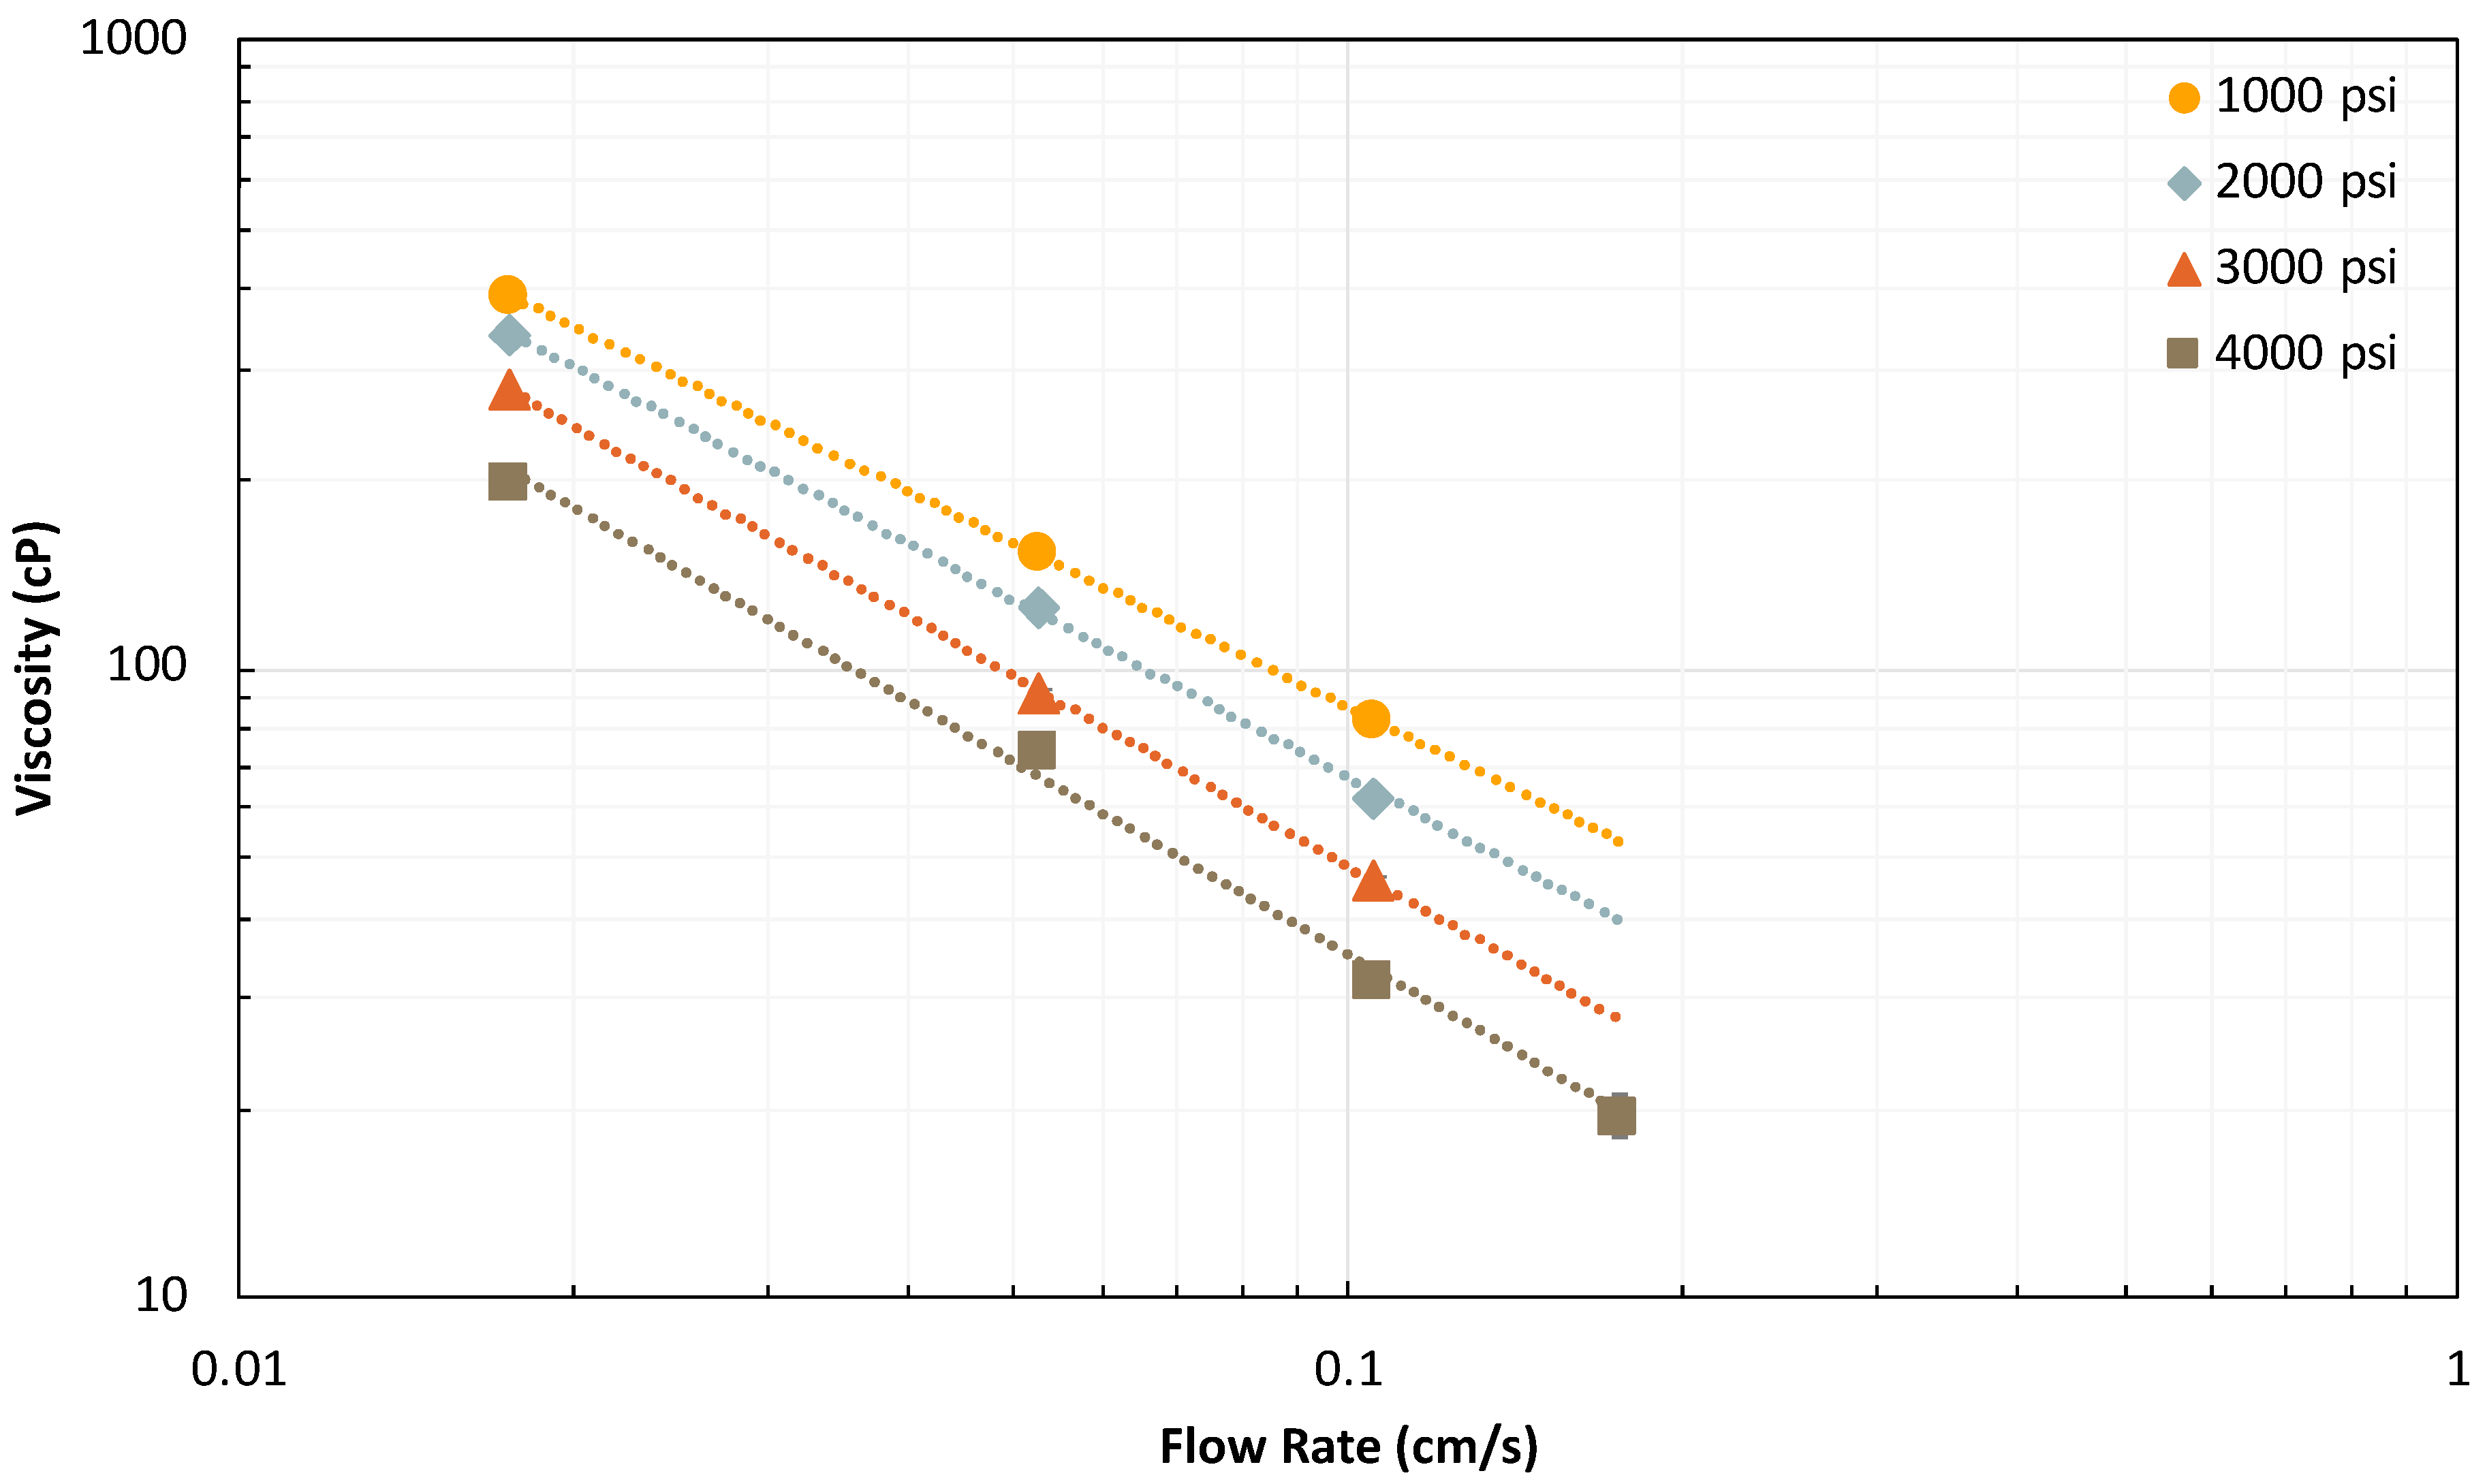
In the data presented in Figure 7, a clear shear-thinning profile can be seen, meaning that as the flow rate increases, the foam viscosity decreases due to the reduced flow resistance of moving foam films [80]. This observation held true across the pressure range in Table 3. This shear-thinning behavior of surfactant-stabilized foam is widely seen in the literature [81,82]. Hirasaki and Lawson developed a model for shear thinning of foam in a straight capillary tube, showing that viscosity scaled with flow rate raised to the power of [80]. Nguyen developed a shear-thinning model for foam that, unlike Hirasaki and Lawson’s model, accounted for the effect of pore throat constriction due to the divergent-convergent nature of porous media channels. Nguyen’s model showed that viscosity scales with flow rate raised to the power of [65]. However, in this study, viscosity evidently scales with flow rate raised to the power of approximately for this proppant pack system, exhibiting much stronger shear-thinning behavior than described by either Hirasaki and Lawson’s model or Nguyen’s model. This is likely due to natural deviations from the ideal behavior assumed in the development of the previous models.
The shear-thinning rheology in the range of viable field flow rates is a favorable outcome given that in the near-wellbore conditions, gas injectivity, as desired, would be relatively higher and would, therefore, reduce the amount of time and energy required to inject the target gas slug. On the other hand, as the foam penetrates deeper into the fracture network, the shear rate decreases, resulting in higher foam viscosity and improved conformance control deeper in the formation [24,83].
2.3. Effect of Pressure
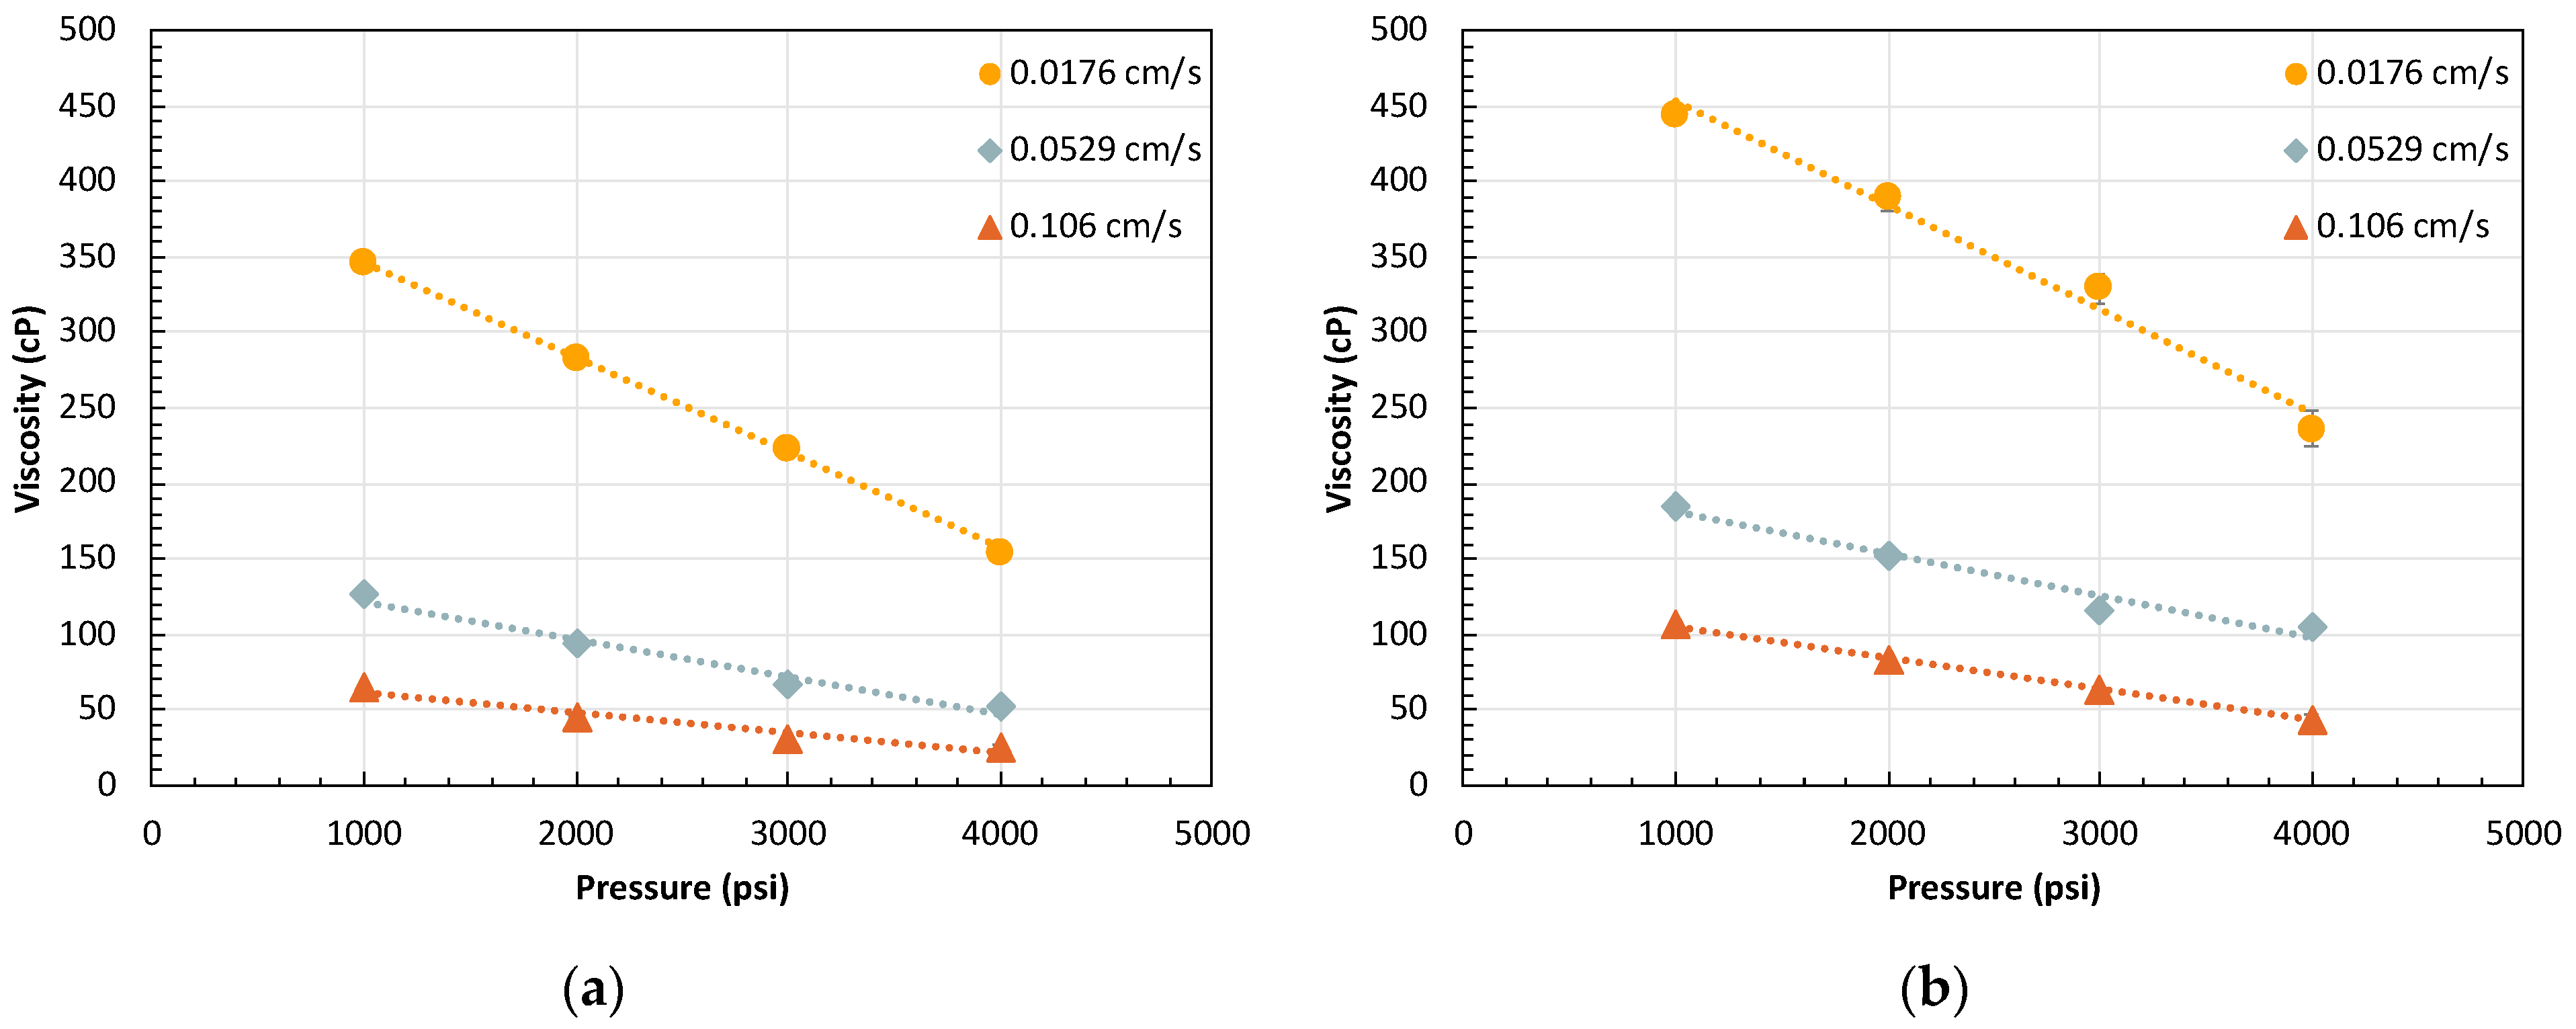
The most interesting finding was the inversely linear dependency of foam viscosity on system pressure, irrespective of flow rate, as shown in Figure 8. Before delving into the novelty of this dependency, its application in the field must be discussed. The increase in strength as pressure decreases can be beneficial to foam-assisted HnP for two reasons. First, as mentioned previously, one of the main benefits of using foam in HnP processes is that it aids in decreasing the loss of injection gas due to well interference by reducing gas mobility [24,39]. If there are any issues with continued loss of injection gas, as the pressure decreases due to this gas loss, the foam will thicken and reduce gas mobility to mitigate further loss of gas, essentially acting as a negative feedback regulator. Second, during the puff stage, when pressure rapidly decreases, the strong foam will promote uniform withdrawal of the fluids over the entire fracture network rather than through high-permeability fractures.
This inverse linear dependency of foam viscosity on system pressure is contrary to what has been reported before [84,85,86]. Even the few previous experiments that showed that foam viscosity monotonically decreases with system pressure did not exhibit trends with such linearity or provide mechanistic reasoning as to what the cause of the trend could be [69]. The observation of the inversely linear trend here and the explanation of what may be causing it, therefore, became of significant interest. A few hypotheses were investigated to examine the cause of this inverse linear dependency of foam viscosity on system pressure and are discussed in the following sections.
2.3.1. Effect of Residual Oil on Pressure-Dependent Foam Rheology
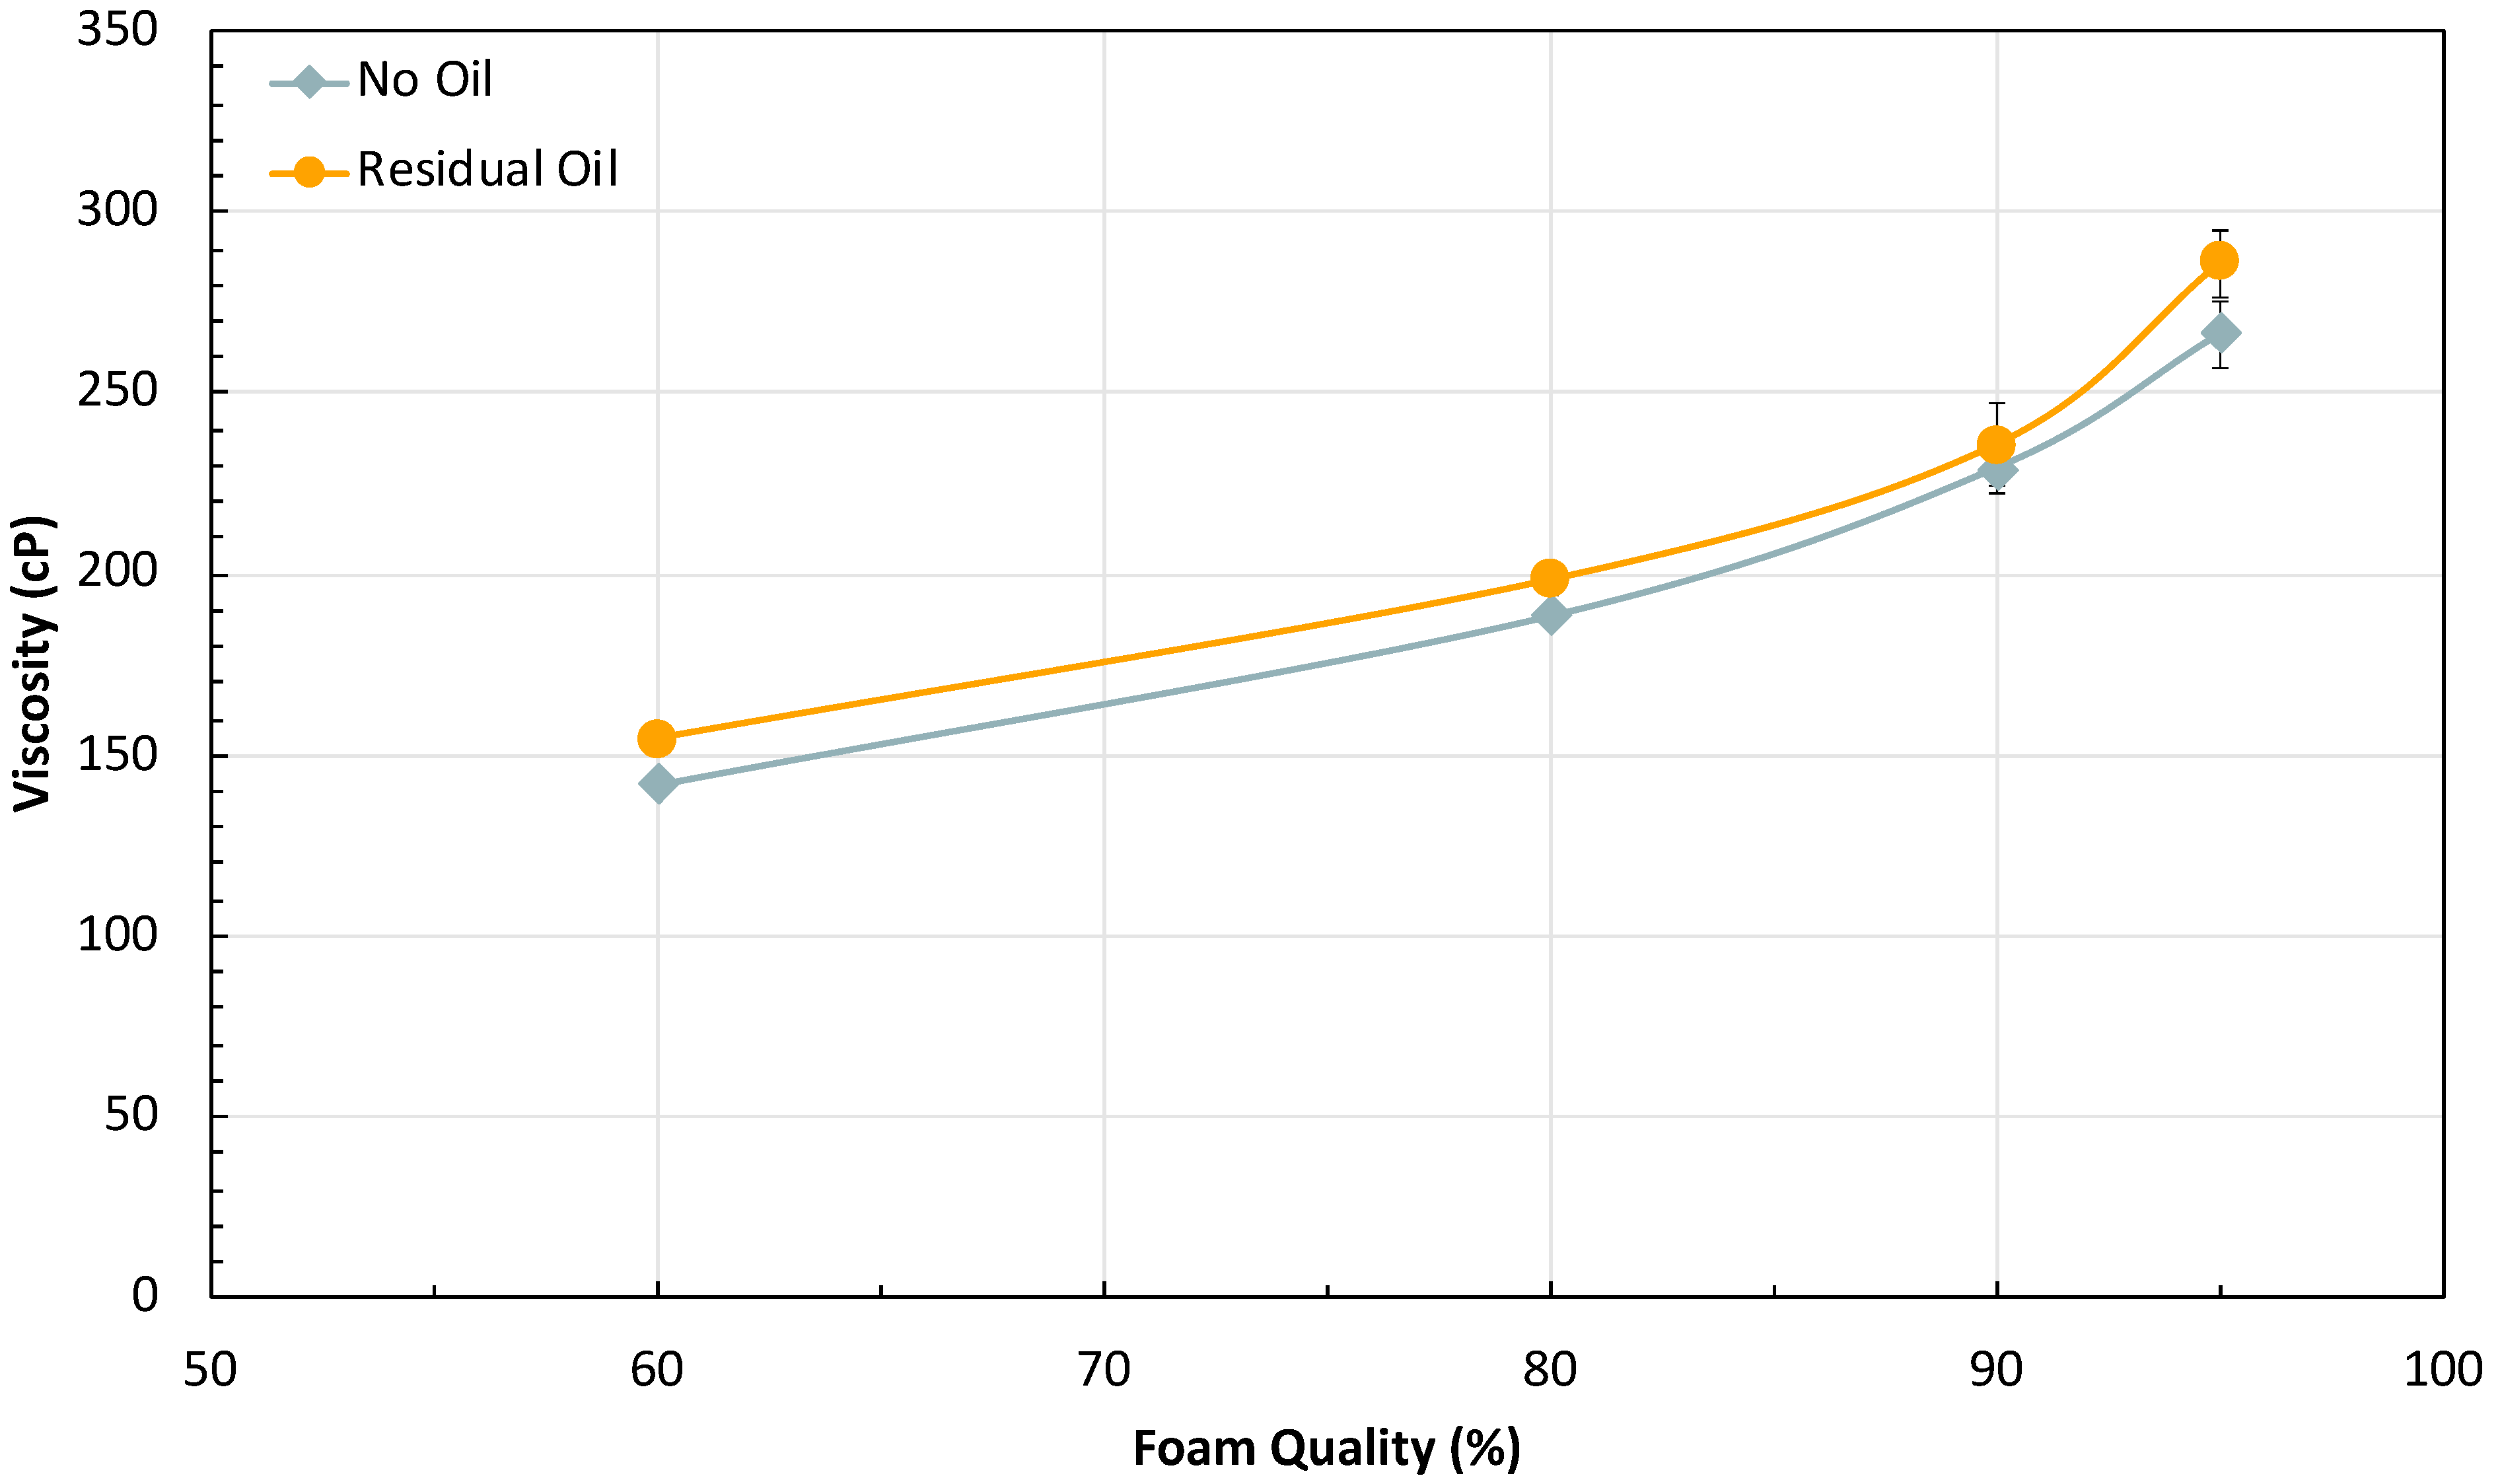
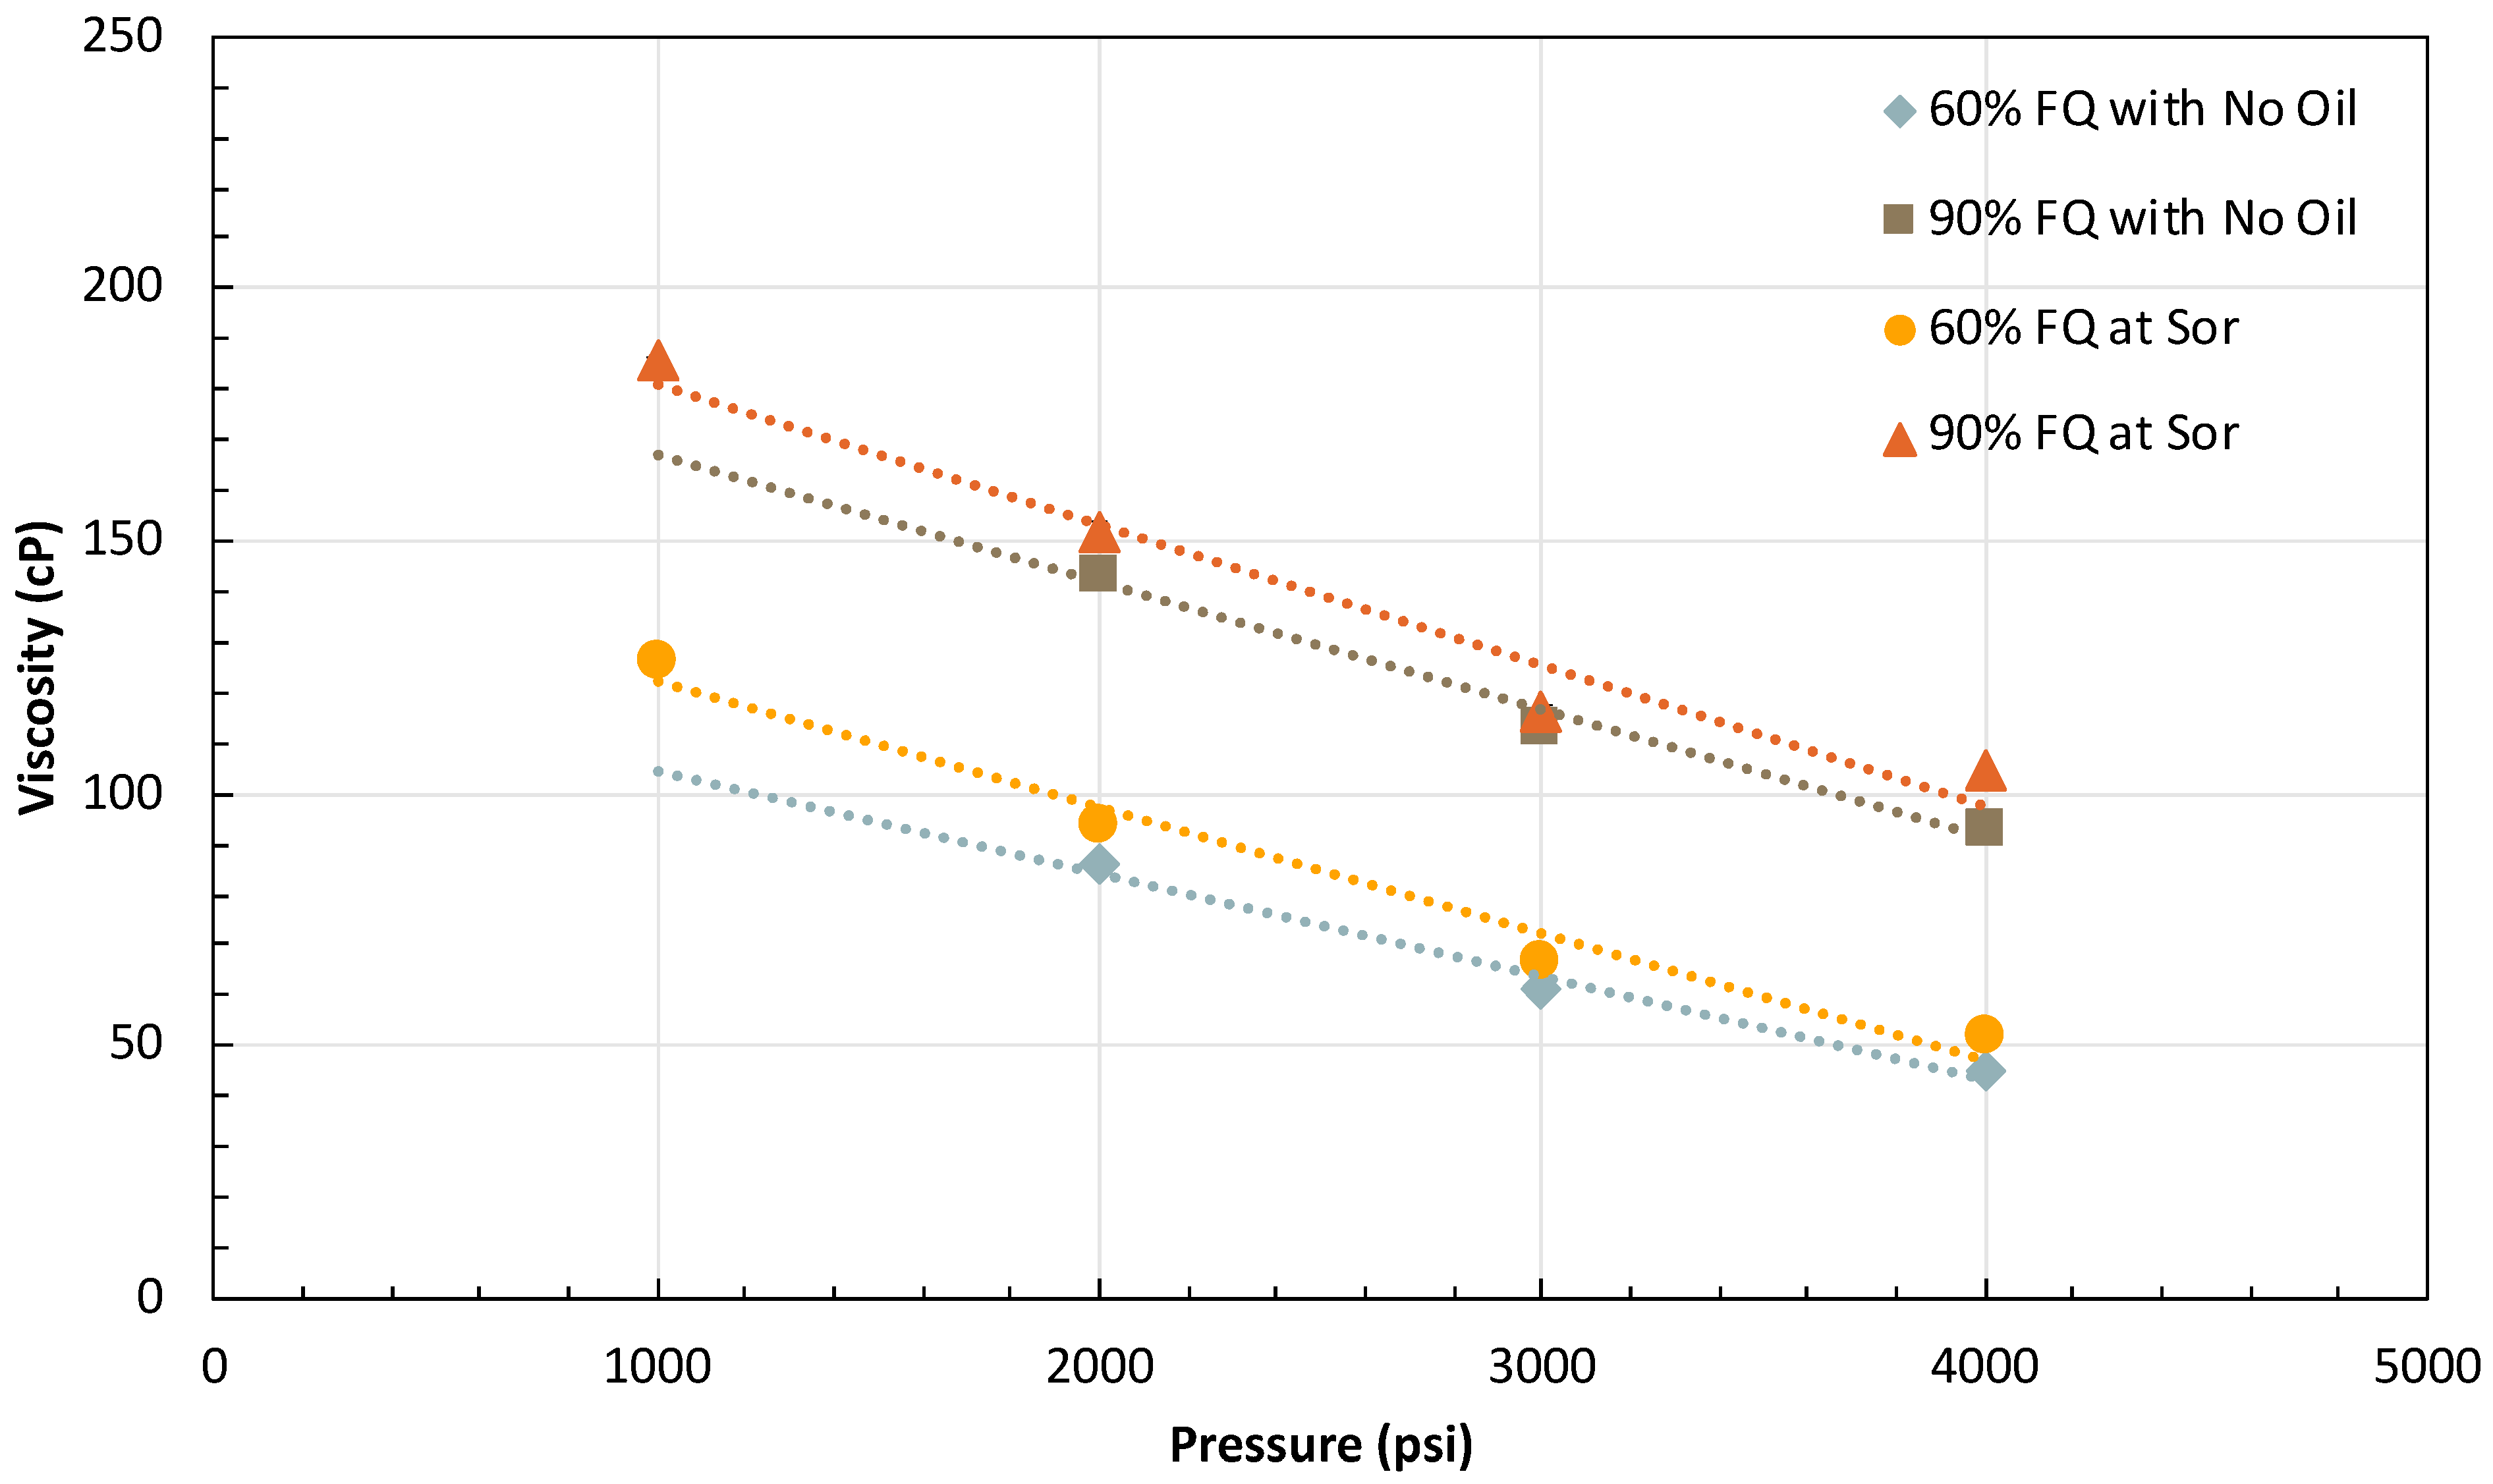
The first potential cause of this pressure dependency was hypothesized to be the swelling of the residual oil in the pack. Oil swelling is caused by the dissolution of solvent into the oil phase, resulting in an increase in the oil phase volume [87,88]. It is known that as pressure increases, there will be greater oil swelling, causing the live oil saturation to increase and, therefore, additional foam destruction [87]. To address this hypothesized effect, a flood series was completed using a pack free of residual oil. The results of this flood series are shown in Figure 9, which confirms the marginal, if any, impact of residual oil on foam generation. The linear dependency of foam viscosity on system pressure was also reproduced in the absence of oil, as shown in Figure 10. Thus, oil swelling with increased system pressure was ruled out as a hypothesis for this observed pressure dependency. This conclusion is supported by previous studies in which the introduction of methane resulted in negligible oil swelling of several light, sweet crude oils under high temperature and pressure [89].
2.3.2. Effect of Injection Gas on Pressure-Dependent Foam Rheology
The next hypothesis investigated was the enhanced hydrophobic interaction between the surfactant and methane at higher system pressure. As system pressure increases, the density of the methane increases, creating a stronger hydrophobic attraction between the methane and the hydrophobic tail of the hydrocarbon surfactant molecules. Film stability relies on repulsive forces between the interfaces of the lamellae, so the introduction of this attractive, hydrophobic force could weaken the lamellae and, thus, lower foam viscosity [90,91]. Decreased film stability leads to lower foam strength due to a higher drainage rate, bubble coalescence, and Oswald ripening [86,90,92].
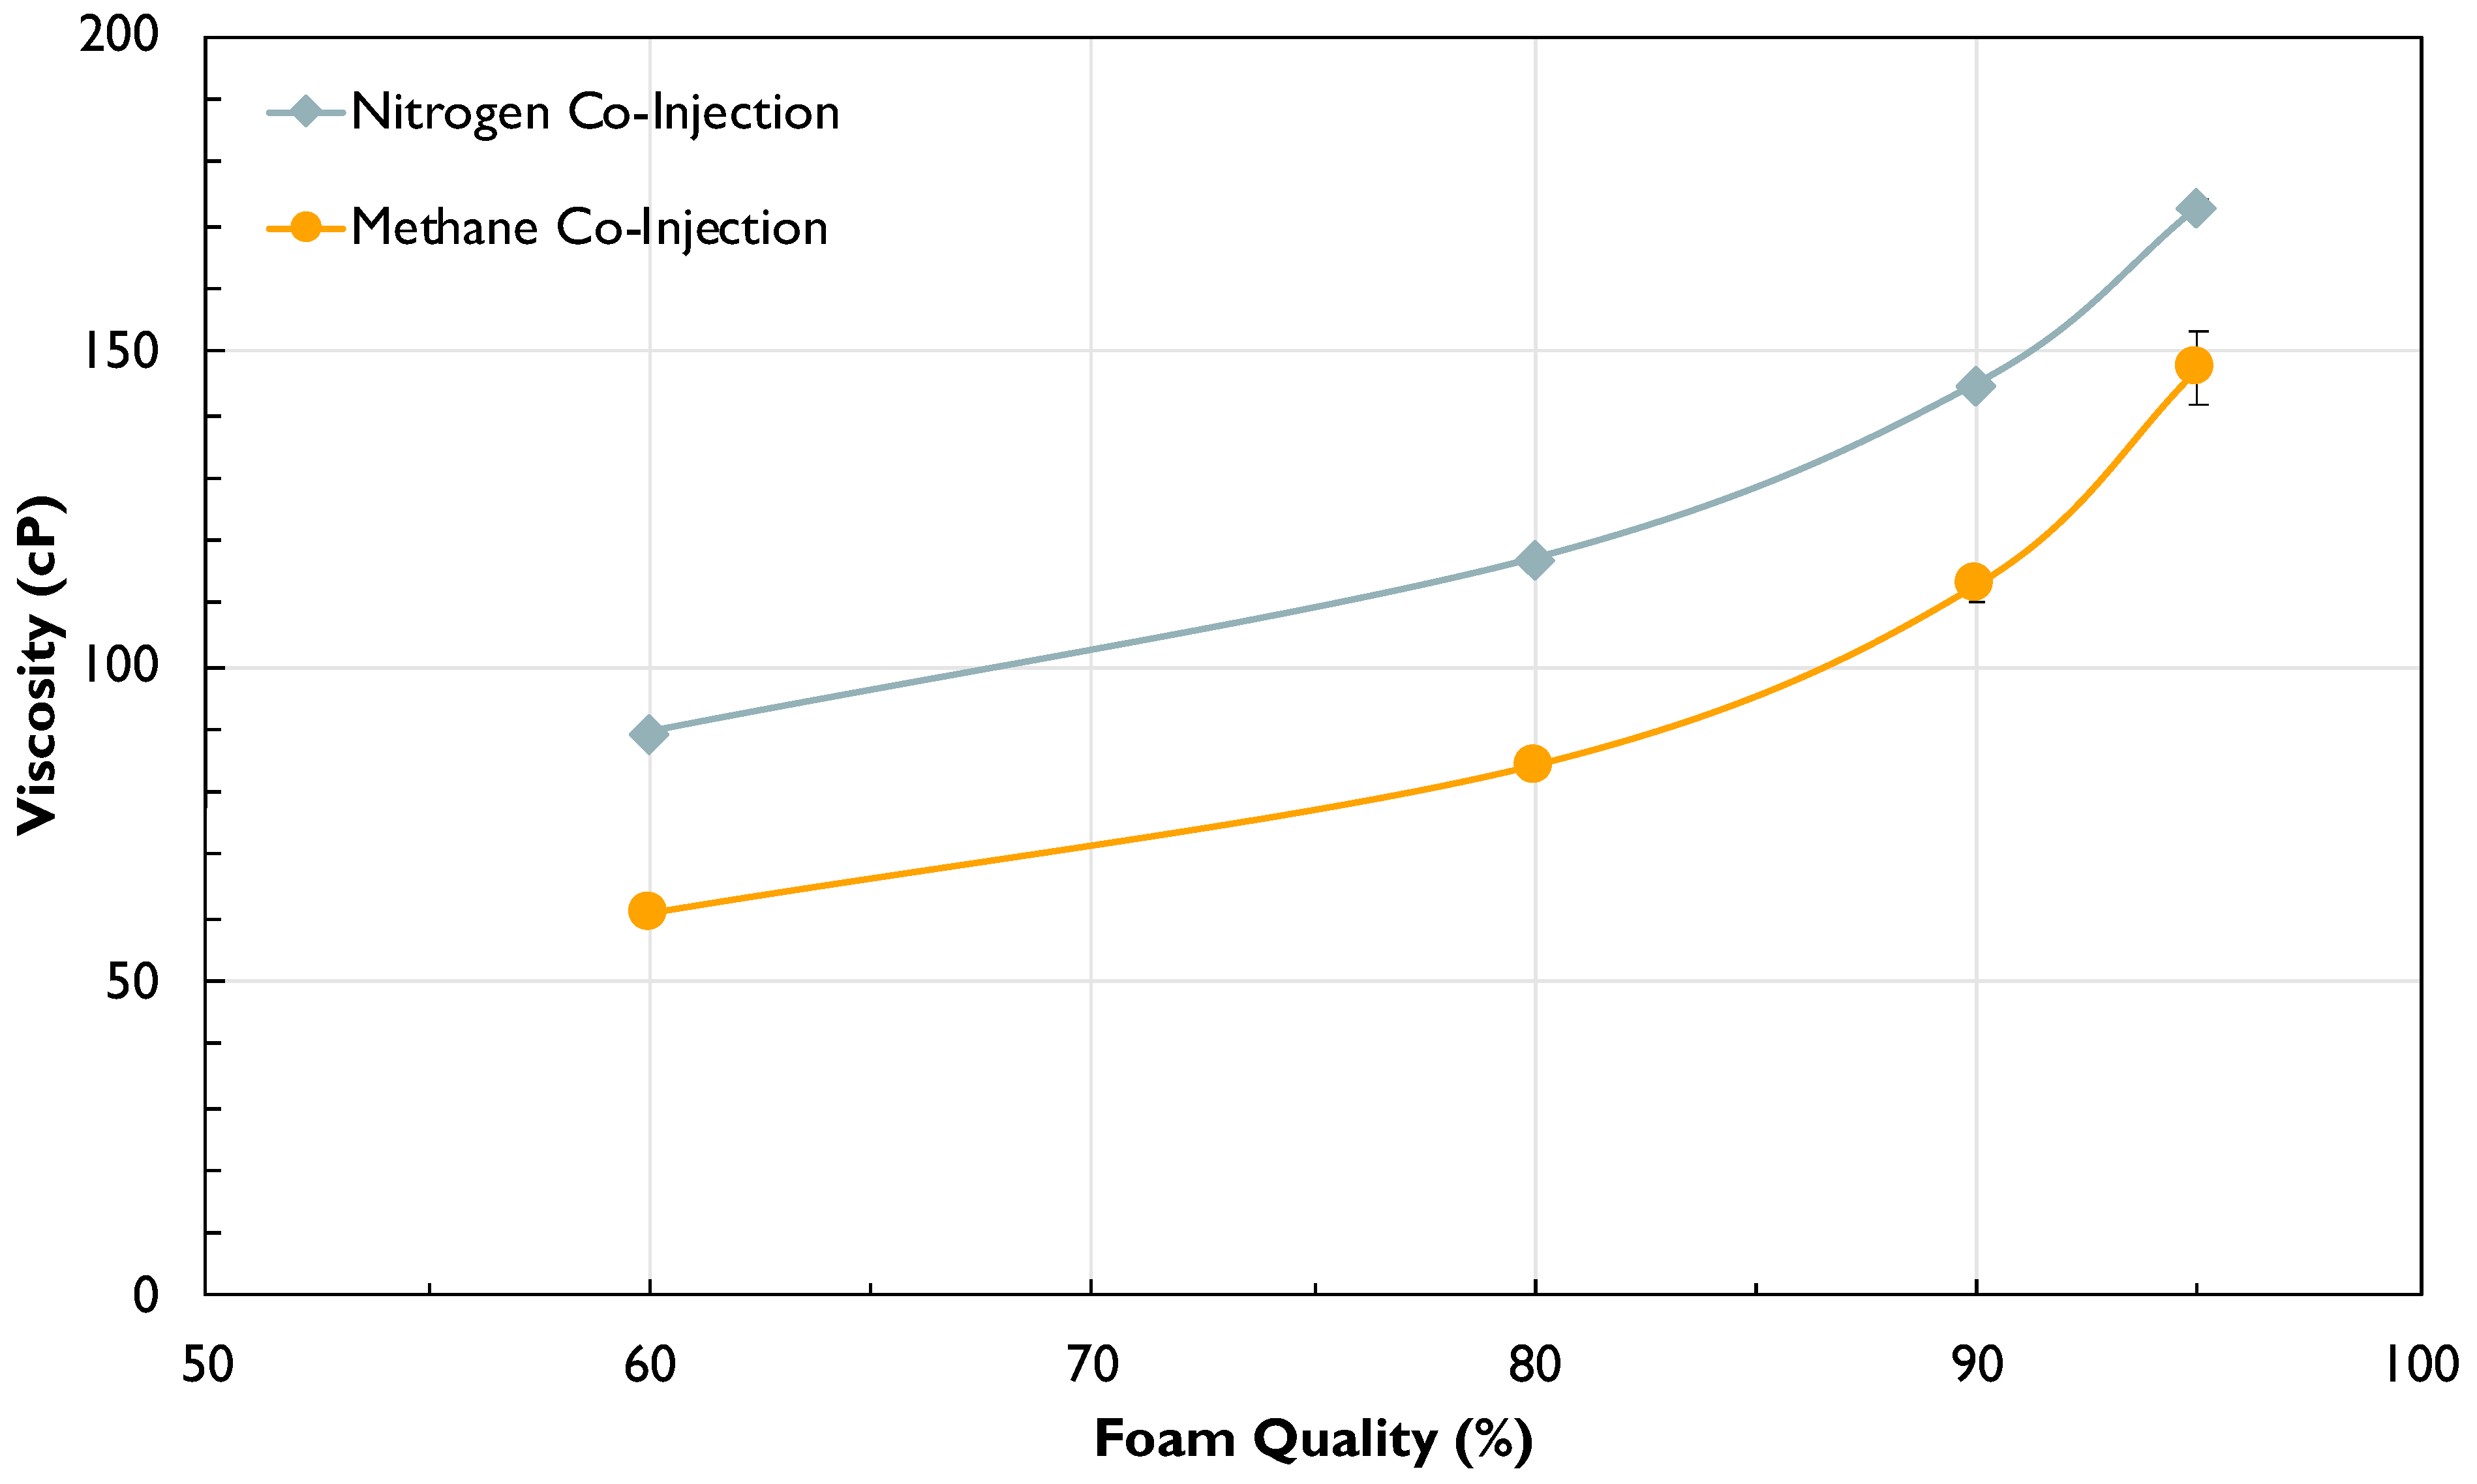
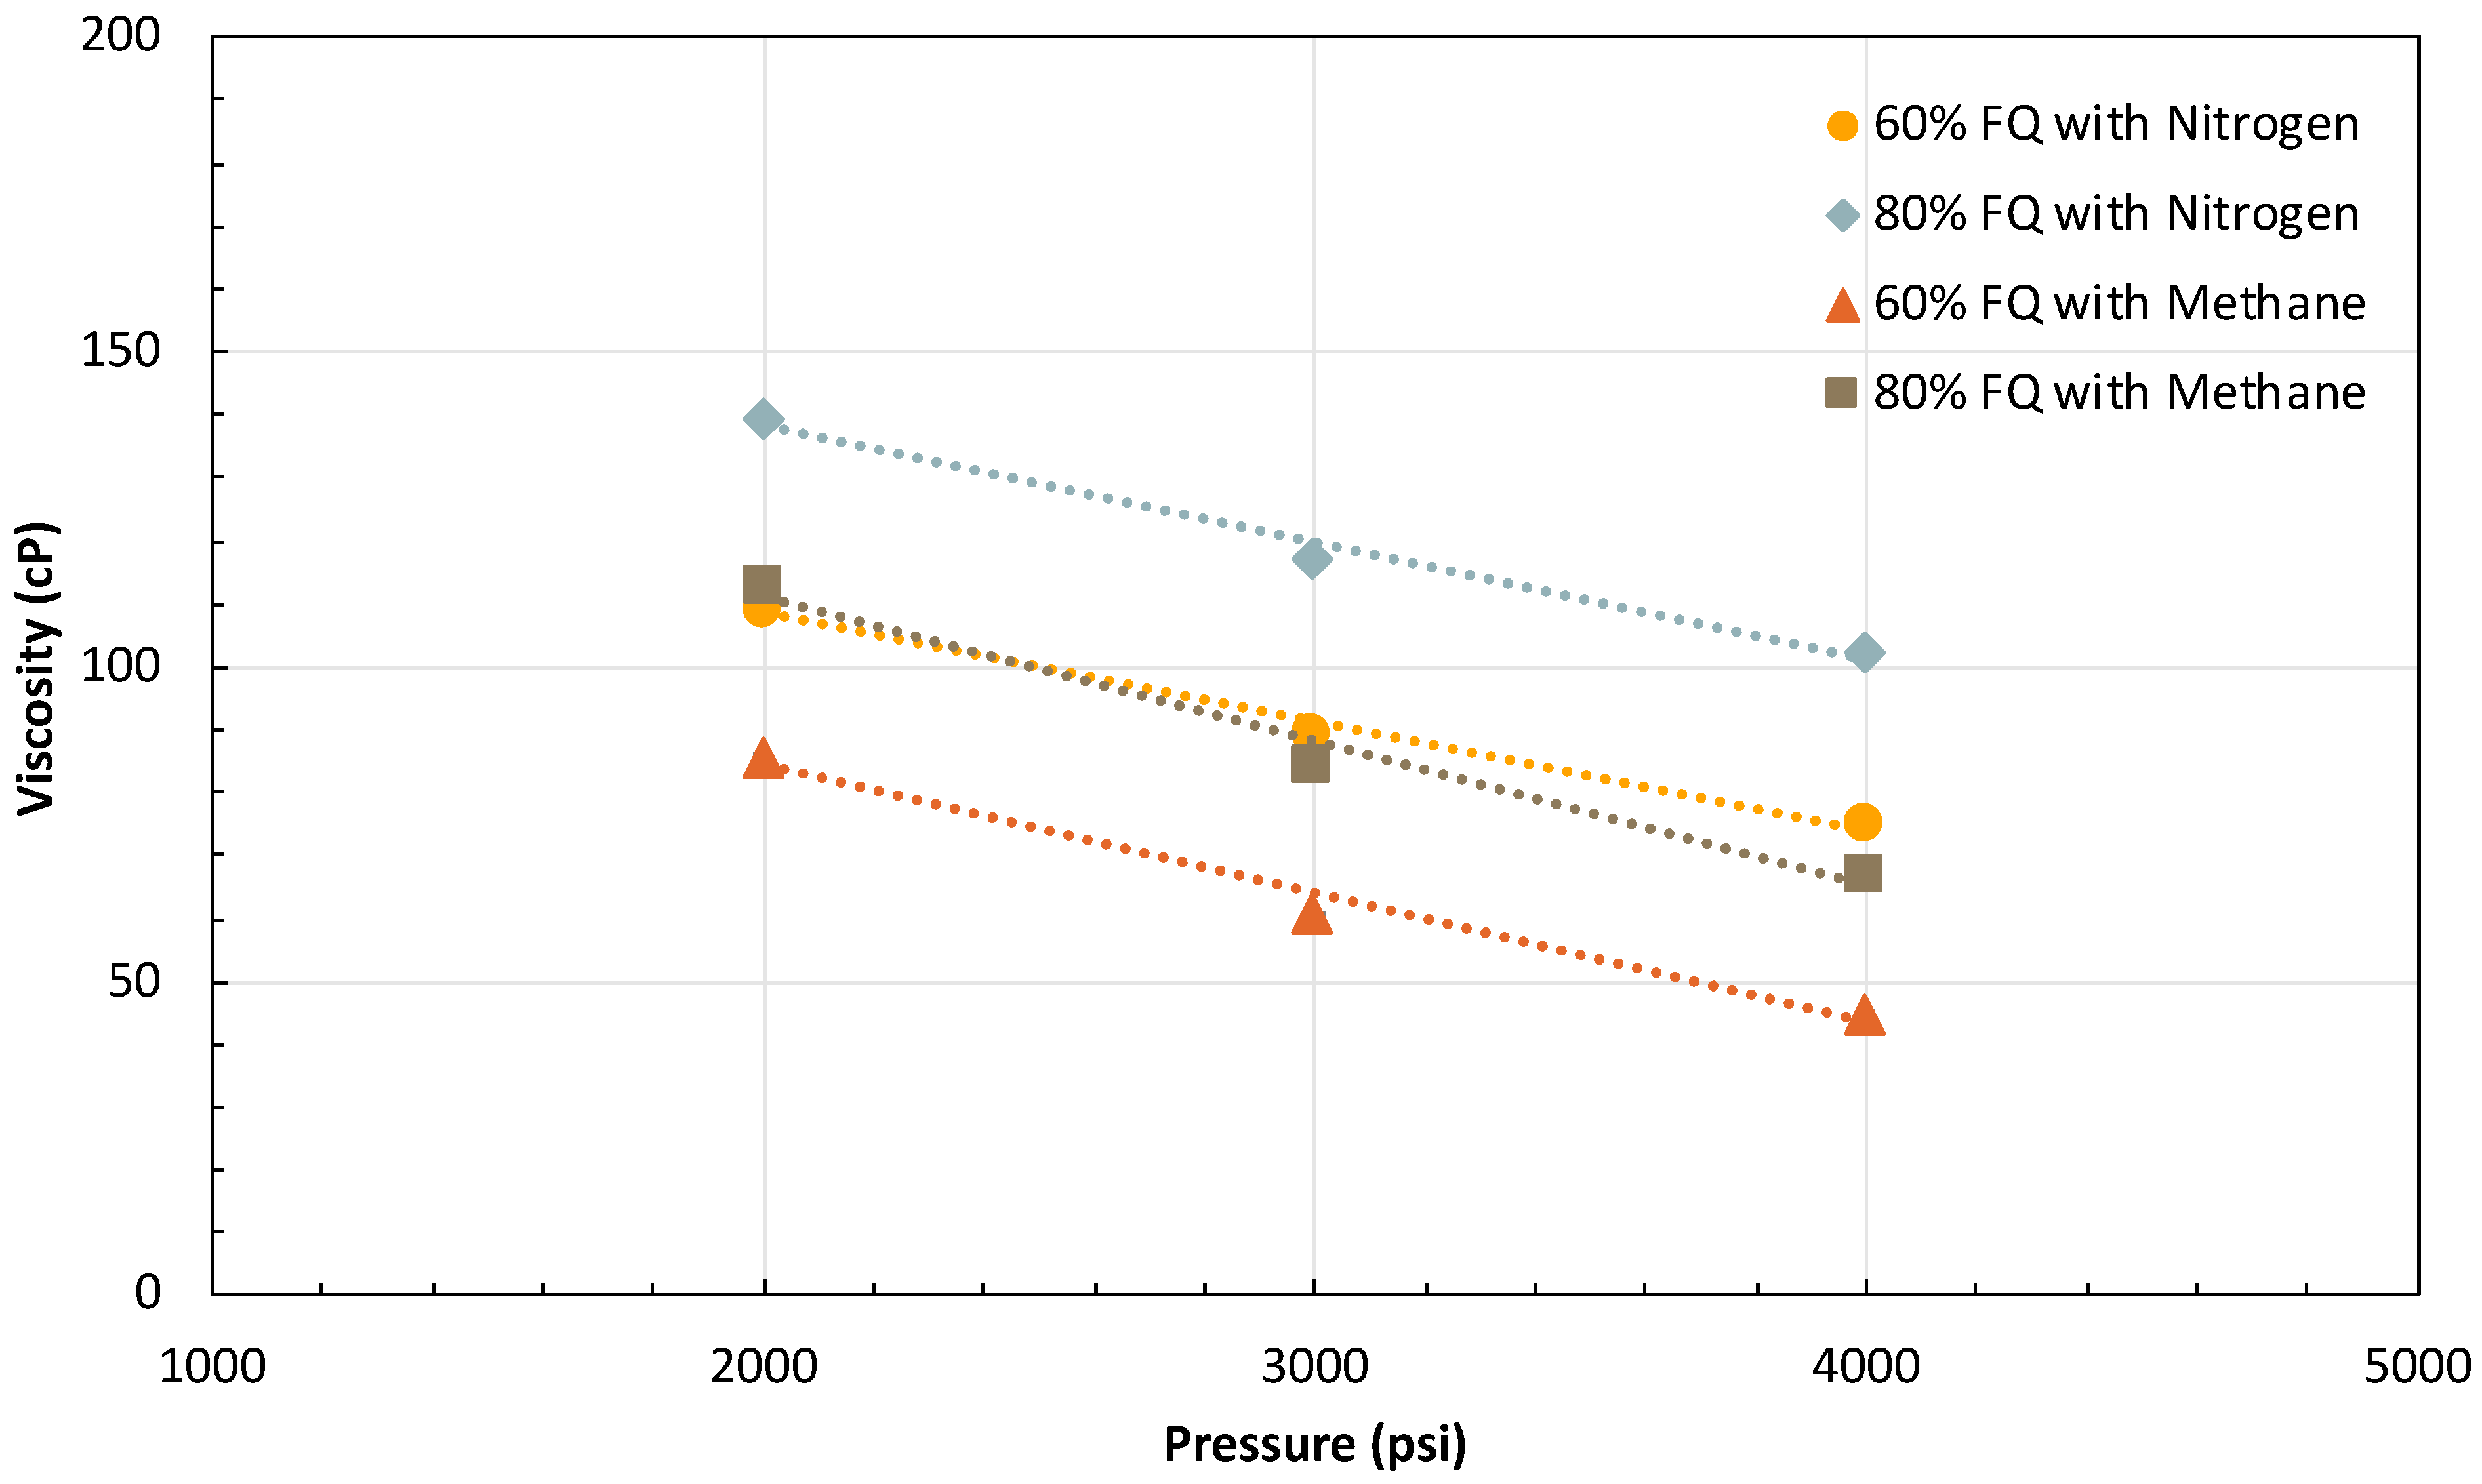
To test this hypothesis, a pressure scan of the surfactant formulation was completed using nitrogen due to its inert nature. Figure 11 and Figure 12 reproduce the same dependency of the foam viscosity on foam quality and system pressure, respectively, as observed with methane eliminating surfactant and gas interaction as a hypothesis to explain the observed dependency.
2.3.3. Effect of Surfactant Type on Pressure-Dependent Foam Rheology
Another hypothesis investigated was the potential relationship between the observed pressure dependency and the surfactant’s properties since the pressure trend has already shown no causal link to the residual oil or gas type. Floods were previously performed using this system to evaluate the foaming ability of two distinct commercially available surfactants. These two surfactants exhibited disparate pressure trends, such that one showed an increase in foam viscosity with increasing system pressure, while the other showed that system pressure had no effect on foam viscosity. The results of these floods can be seen in Figure S1 of the supporting information. The observation of these different pressure trends led to two important conclusions: the inverse pressure trend is not an artifact of the system, and evidence strongly suggests that the pressure trend is a result of surfactant type. Based on this, it is hypothesized that surfactant adsorption on the liquid-gas interface and its impact on interfacial rheology could be the cause of the pressure dependency.
One possible mechanism linking surfactant adsorption to the interfacial rheology is related to the viscoelasticity of the liquid-gas interface. The understanding of the effect of viscoelasticity on foam is limited, but it is suspected that as viscoelasticity increases, foam strength in porous media improves due to a reduction in film drainage rate [90,93]. As surfactant adsorption at the liquid-gas interface increases, interfacial tension decreases, and viscoelasticity increases [90]. Therefore, the hypothesis regarding this mechanism states that as pressure increases, surfactant adsorption at the interface decreases, resulting in lower interfacial viscoelasticity and a weaker foam.
Another important property in determining foam stability is the disjoining pressure, which is used to characterize the forces per unit area between the interfaces of two bubbles [90,91]. As the disjoining pressure decreases, the liquid film thins until it ruptures and the foam coarsens, i.e., a greater disjoining pressure indicates greater foam stability [86,94]. There are three forces that contribute to the disjoining pressure: the repulsive electrostatic and steric forces, and the attractive van der Waals forces. To enhance foam stability, a strong repulsive interaction between the interfaces of the liquid film is required, such that the disjoining pressure will counterbalance the attractive forces that tend to rupture the film [90,94]. The thickness of the surfactant adsorption layer has a significant effect on the disjoining pressure, in that a thicker adsorption layer results in a higher disjoining pressure due to an increase in electrostatic potential [95]. Considering this, the hypothesis states that as pressure increases, adsorption arrangement changes such that the surfactant adsorption layer decreases in thickness, resulting in a lower disjoining pressure and a weaker foam. Research into the effect of surfactant adsorption layer thickness on disjoining pressure and how this thickness is affected by pressure is very limited, so the opportunity exists here to advance the current state of research in this area [95].
Having hypothesized two mechanisms related to interfacial surfactant adsorption that could explain the decrease in foam viscosity with increasing pressure, the discussion advances to possible reasons as to why interfacial surfactant adsorption would be affected by pressure. To answer this, literature on the effect of pressure on micellar formation and structure was investigated. Micelles are colloidal clusters of surfactants that directly and indirectly have a significant effect on interfacial phenomena [96]. While previous work shows that micelle stability should not be affected by pressure in this range, micellar size is expected to increase with increasing pressure at this elevated temperature [97,98]. An increase in micellar size means that more surfactant is involved in the micellar structure, and, with more surfactant entangled in micellar formation, less is available to adsorb at the interface [99]. A detailed experiment analyzing the effect of pressure on micellar size and shape would be helpful in supporting this hypothesis of the pressure trend observed with the surfactant formulation.
3. Experimental Section
Synthetic Brine: A synthetic brine of about 30,000 ppm total dissolved solids (TDS) representative of a US Shale reservoir was prepared, as outlined in Table 1. The required salts were dissolved in deionized water.
Oil: The oil used in these experiments was a light, sweet crude oil with a viscosity of about 1.13 cP and a density of about 0.773 g/mL. To simulate foam rheology in the absence of mobile oil, the oil saturation was kept at residual for gas injection. Oil was co-injected with brine and gas to study the effect of mobile oil on foam stability.
Surfactant: A proprietary foaming-surfactant formulation that is stable at 388 K (a target reservoir temperature) in the model brine and forms no viscous emulsions. This formulation is a blend of an anionic sulfonate surfactant and an amphoteric surfactant. The formulation development work is out of the scope of this work. All experiments were performed at 0.5 wt% active surfactant concentration.
Injection Gas: The injection gas used in this work was 99% pure methane (CH4) gas. The last flood series used 99.9% purity nitrogen (N2) gas to remove any potential effect of hydrophobic interactions between the gas and surfactant solution.
Proppant Pack: 30/50-mesh, white Ottawa sand was used to create the proppant pack. The proppant was packed into a stainless-steel column that had a length of 30.48 cm and an inner diameter of 2.54 cm. All the core flood experiments in this study were conducted without aging proppants with oil. There is a possibility for proppants to become weakly oil-wet during the primary production process, and previous studies have indicated the importance of considering this [69,100,101,102]. However, an aging test was conducted to evaluate the ability of the crude oil to alter the wettability of the water-wet white Ottawa sand. In this test, the sand, wetted with the synthetic brine, was aged in the crude oil for eight weeks at 388 K (reservoir temperature) in a high-pressure cell. After aging, the sand was rinsed with the synthetic brine by simply stirring the sand-oil mixture slowly in the synthetic brine at the same temperature. It was visually observed that the oil was completely removed from the sand. Additionally, aging “dry” proppants in oil and creating an entirely oil-wet proppant pack would not be an accurate representation of in situ field conditions, and packing oil-coated proppants tightly and reproducibly is more challenging than packing unaged proppants. Thus, for the objectives of this investigation and the importance of reproducibility, unaged, water-wet proppants were used for creating the proppant pack, which would then be flooded to residual oil saturation.
4. Methodology
4.1. Experimental Core Flooding Setup
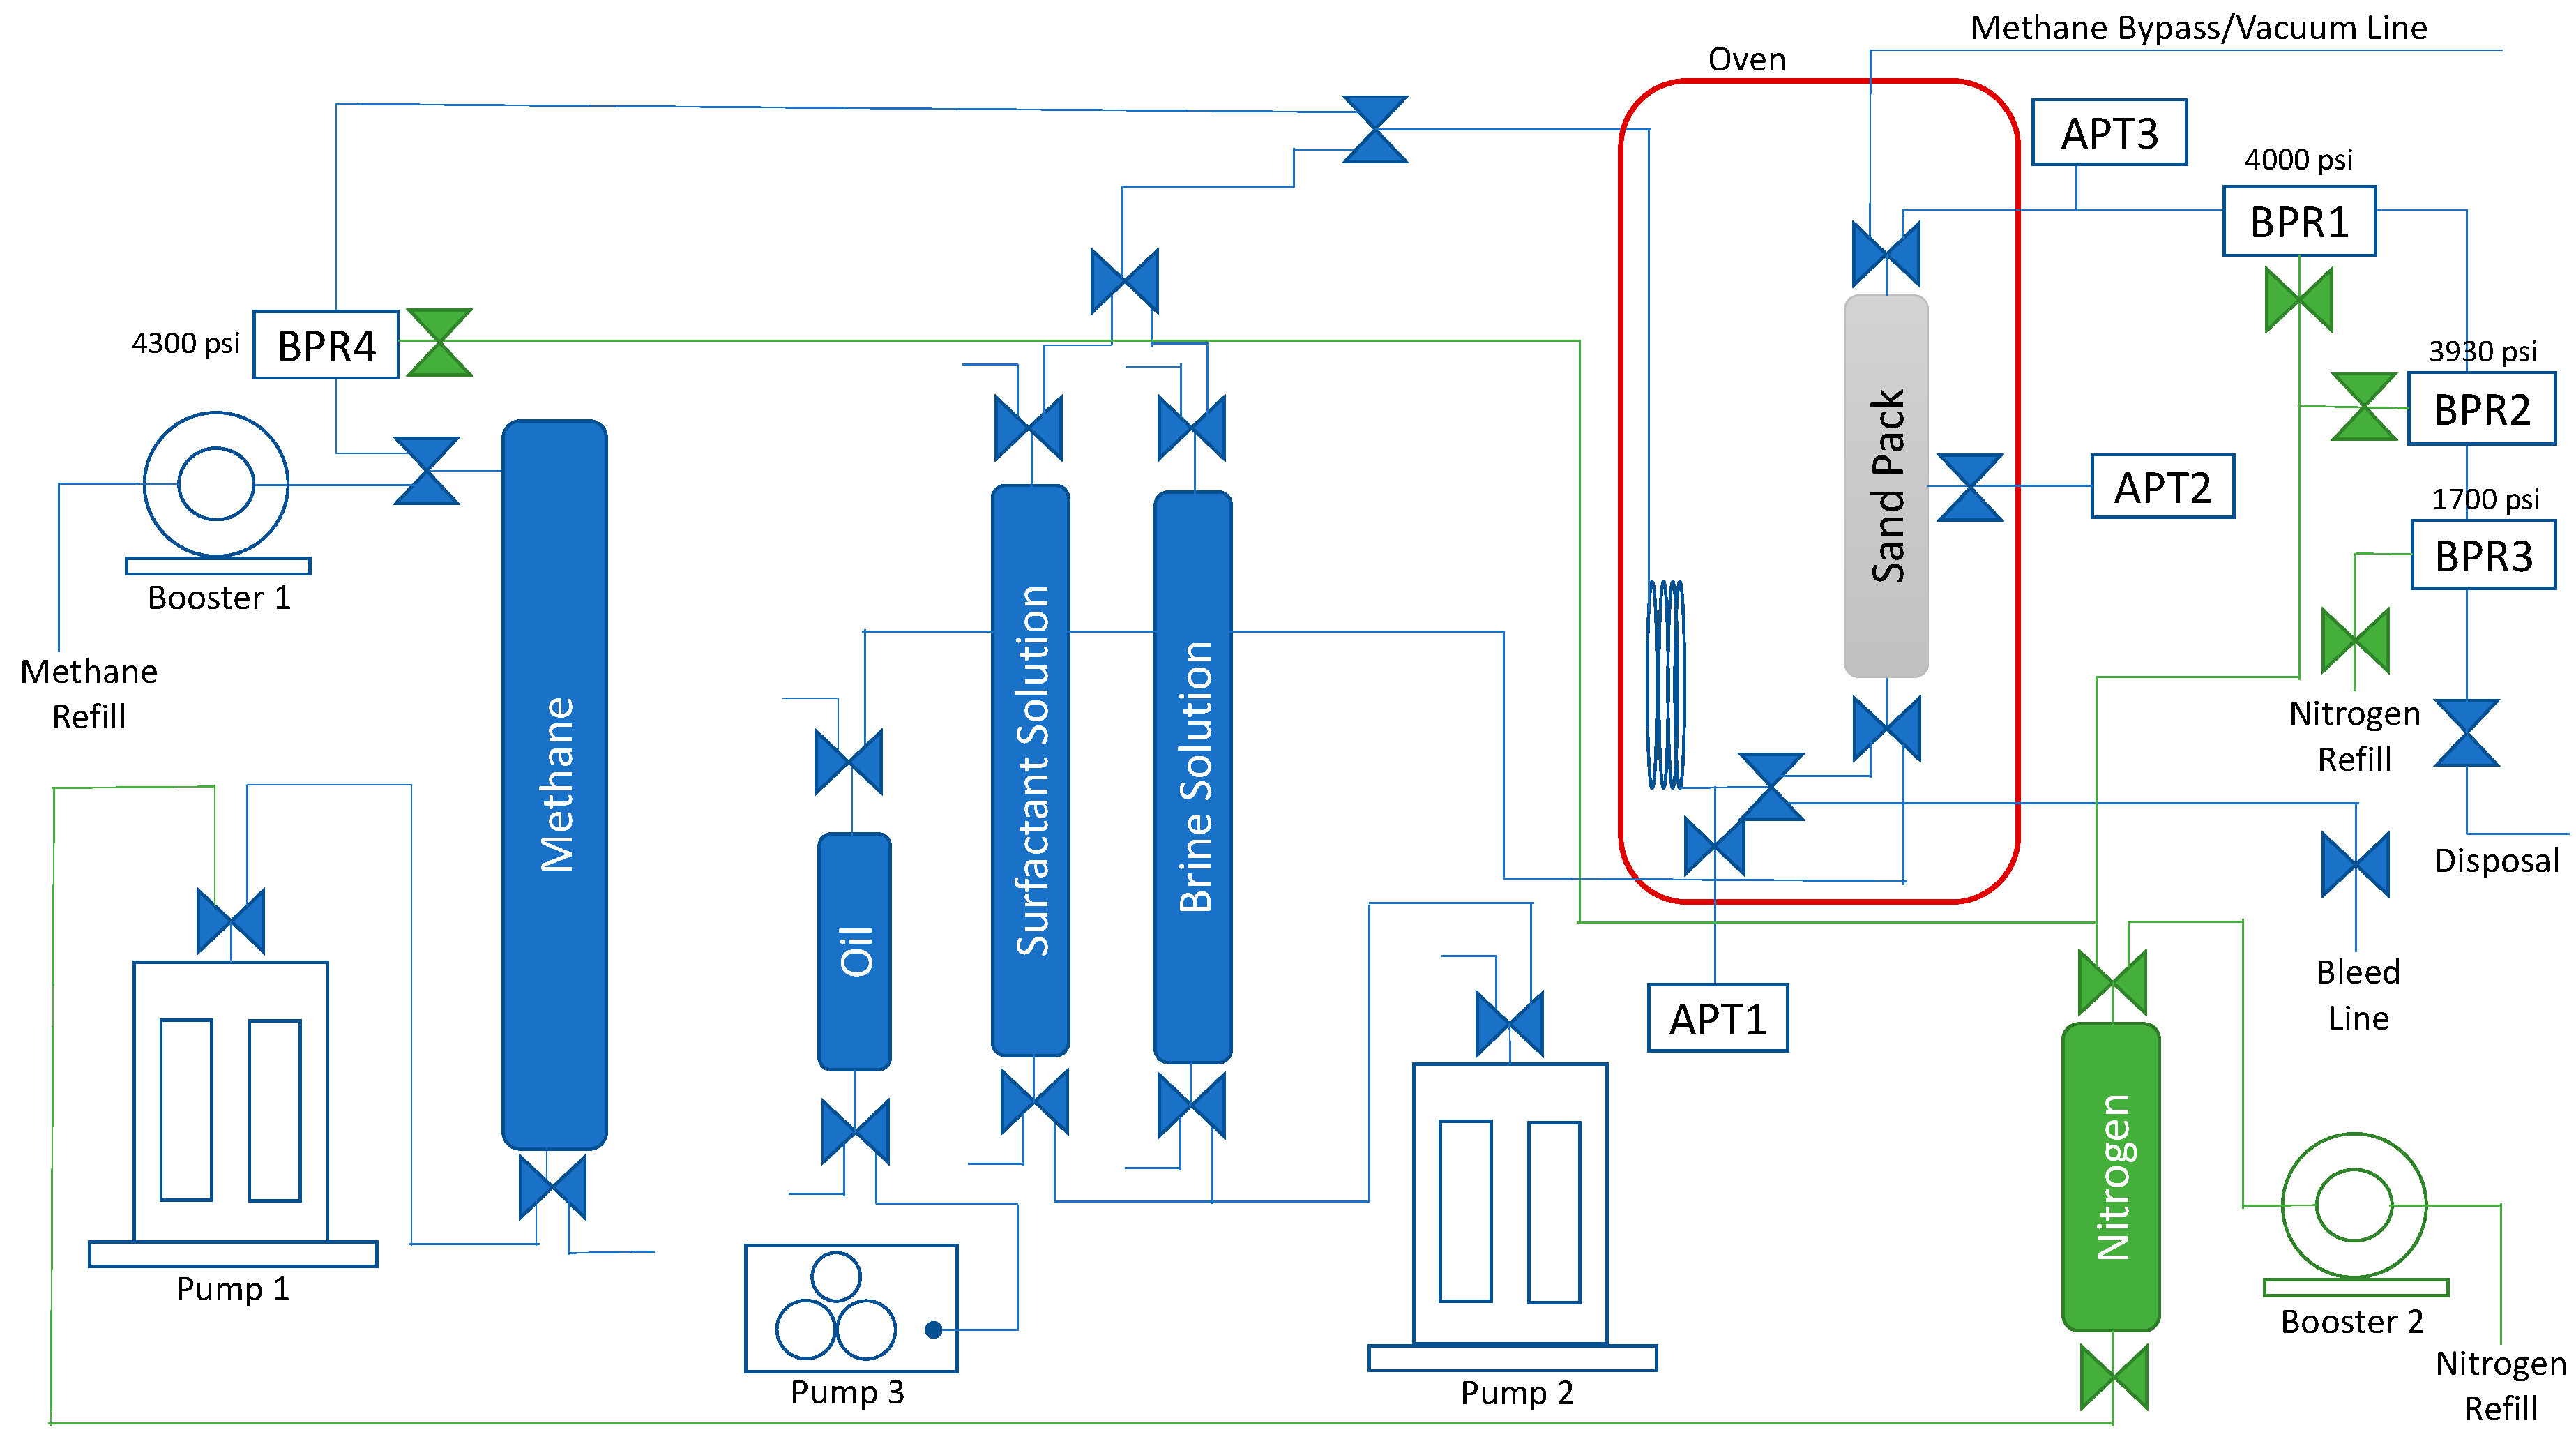
Figure 13 shows the setup used to conduct the foam transport through porous medium experiments. Boosters 1 and 2 are air-driven gas booster pumps. Booster 1 is used to fill and boost the methane accumulator to the desired pressure, and Booster 2 is used to fill and boost the nitrogen accumulator. Pump 1 controls the injection of gas into the proppant pack and the backpressure regulators (BPRs). BPRs are dome-loaded ultra-low flow BPRs, which are used to ensure safe, stable decompression of the system effluent and regulate the inlet pressure of gas into the proppant pack. Pump 2 controls the injection of the aqueous solutions into the pack. Pump 3 is used for the injection of crude oil into the pack. APTs are absolute pressure transducers used to measure the pressure differential in the proppant pack. Throughout the system, there are also several pressure gauges to ensure proper pressure regulation.
4.2. Surfactant Characterization
The surfactant characterization included the effect of oil on foam stability and oil–brine emulsion tendency.
4.3. Effect of Oil on Foam Stability
An 8 mL sample of the surfactant solution was added to a 40 mL glass vial with no oil added. The sample was sealed and heated up to 388 K. Before proceeding to the foam stability test, the aqueous stability of the surfactant solution was confirmed. Next, the vial was shaken vigorously for about 3 s, and the time to complete foam decay was measured. This measurement was repeated 2 more times to find the average foam lifetime. This test was performed to qualitatively confirm the aqueous stability and evaluate foam stability at the target temperature and salinity.
The bulk foam test was completed for the samples with and without oil added at various pressures and temperatures, as outlined in Table 2. A 4 mL sample of the formulation was added to a 15 mL sapphire glass cell. For tests that required oil, 0.4 mL of the sweet crude oil was added to the cell as well. After the appropriate liquid phases were added, the cells were sealed and pressurized to the desired level using methane. For the high-temperature tests, the cells were filled to approximately 2000 psi at room temperature and then heated to 388 K, at which point the pressure would reach about 3000 psi. The cells can only be pressurized from the bottom, so the cells were flipped during pressurization so the methane could enter the cell without going through the liquid phase(s). After the cells reached the desired pressure and temperature, they were vigorously shaken for about 5 s. The foam height was measured intermittently until complete foam decay or a maximum of 90 min. These tests evaluated the foamability of the surfactant solution at elevated pressure and temperature in the presence of oil.
4.4. Emulsion Tendency Test
In the emulsion tendency test, 2 mL of the surfactant solution and 1 mL of the crude oil were added to a 5 mL glass pipette, which was then sealed. The pipette was then placed in the oven and heated to 363 K (not at 388 K because of the low pressure tolerance of the glass pipette) over several days while periodically gently mixing the phases. To start the emulsion tendency test observation, the phases were again gently mixed by repeatedly inverting the pipettes. Once mixed, the pipettes were returned to the oven and observed for several days, with pictures taken at timestamps of 0 min, 30 min, 1 h, 1 day, and 3 days. This test was conducted to ensure the formulation did not create long-lasting, viscous emulsions with oil that could adversely impact in situ oil mobility and cause issues during the post-production separation process.
4.5. Proppant Pack Preparation
A thorough packing procedure was developed to ensure proper consolidation of the proppant and the repeatability of the procedure. Through a funnel, proppant is slowly poured into the column from the inlet side while the column is attached to a vibrating table set to a medium vibration level of about 1600 rpm. Proper precautions are taken to ensure no proppant transfers into the column’s seals, which could degrade the threads and the column’s integrity. Periodically, the column is moderately tapped for better consolidation before continuing to pour proppant into the pack. After the column is filled with proppants, it is sealed and leak-tested with nitrogen at about 4500 psi.
The pack is installed into the core flood setup, and the system was leak tested to 4500 psi before being vacuumed at room temperature. Next, brine is injected into the system section by section to measure the respective dead volumes (1) and the pore volume of the pack (), which is used to calculate its porosity () using Equation (1), in which is the bulk volume of the pack.
After the porosity has been measured and the system is saturated and pressurized to 3000 psi with brine, the permeability () of the pack is calculated at room temperature by measuring the pressure drop () at flow rates of 12.5, 15, 17.5, and 20 cc/min. The slope of this vs. line was found, and the permeability was then determined using Equation (2). Equation (2) is a derivative of Darcy’s Law for non-SI units, in which is the cross-sectional area of the proppant pack, is the apparent viscosity of the injected fluid, and is the length of the proppant pack. To ensure the permeability for the pack was repeatable, permeability tests were completed in triplicate using several packs filled with the 30/50-mesh white Ottowa sand. These tests validated the reproducibility of both the packing procedure and the permeability measurement.
Next, the system is heated up to 388 K, followed by the injection of oil into the system until complete saturation, which was confirmed when the effluent was just oil. Then, brine was injected into the system until the effluent contained no oil. At this point, the volume of oil injected (), the volume of oil collected in the effluent (), and the appropriate dead volumes () were used to calculate the residual oil saturation of the pack (), using Equation (3).
Following the packing and preparation procedures resulted in a proppant pack with a porosity of about 37.3% and a permeability of 25.18 ± 2.04 Darcy (d). The of the pack was approximately 18.9 ± 1.4%. This same pack was used throughout all foaming experiments. The residual oil saturation is slightly higher than the approximate 10–13% reported in the literature for high-permeability sand packs [100,103]. In recognition of this, the residual oil saturation procedure was repeated after the pack was cleaned of oil. The results quantitatively confirmed the reproducibility of the residual oil saturation reported. In addition, the effluent from the floods was observed at the end of every foaming experiment to confirm if any additional oil had been produced from the pack. The proceeding floods did not show any evidence of oil in the effluent, which qualitatively confirmed that residual oil saturation was indeed achieved.
4.6. Flood Procedure
The aqueous and gas phases are co-injected into the proppant pack at a temperature of 388 K at various foam qualities, flow rates, and pressures, as outlined in Table 3. The use of a co-injection as opposed to a surfactant alternating gas (SAG) was found to be an effective mode of injection for strong foam generation in fractures by previous studies [24]. Foam quality (FQ) is defined by Equation (4), where is the interstitial flow rate of the gas phase and is the interstitial flow rate of the aqueous phase [76].
The initial flood series is a baseline series where brine and methane are co-injected to determine a baseline pressure drop. After that, the brine is replaced with the surfactant solution, and the foaming ability of the solution is factorially analyzed under various foam qualities, flow rates, and pressures. The range of these conditions was decided based on realistic values of HnP processes in the field. Previous literature reported that 70% to 85% is the optimum foam quality for strong foam generation and minimal surfactant consumption, so the range of foam qualities to be tested was set at 60% to 95% [24,74,104,105,106]. The flow rate range tested was mainly between 0.0176 cm/s and 0.106 cm/s. This flow rate range was chosen to simulate quick gas breakthroughs during field implementation of the gas HnP process [9,24]. Lastly, as mentioned previously, HnP pressure fluctuation is usually between 2000 and 6000 psi [27]. To account for personnel safety and material pressure rating, the pressure scan was limited to 1000 psi to 4000 psi.
Once foam quality scans were completed for all pressures and flow rates, the pack was cleaned of all oil using dichloromethane so that the foaming ability of the solution can be observed in an oil-free environment. With the pack clean of oil, foam quality scans were completed for select pressures and flow rates, still using the same formulation and methane. A full pressure scan at one flow rate was then performed for the co-injection of the surfactant solution with nitrogen to see if there was any effect of hydrophobic interactions between the methane and the surfactant.
A full foam quality scan, in ascending order, was conducted for each pressure and flow rate. Before each foam quality scan, the system was shut in, and an offset pressure drop was averaged over one minute under no flow conditions. While flooding, the pressure drop in the pack was measured, and each foaming experiment was continued until the pressure drop reached a steady state. This steady-state pressure drop was then used to calculate foam viscosity () using Equation (2). Additionally, the effluent after each foam quality scan was inspected to make sure there was no sand or oil production.
5. Conclusions
With the work presented, several conclusions can be drawn about the formulation’s ability to generate foam and how such foam will propagate in a proppant-fractured reservoir.
- (1)
- The developed foaming formulation can generate high-viscosity (on the order of 100 cP) foam for use in the high-pressure, high-temperature, and high-permeability conditions of proppant-fractured reservoirs.
- (2)
- The foaming formulation can continue to generate foam in very dry conditions (up to 95% FQ) without sacrificing strength, which enables less water and surfactant consumption for foam generation.
- (3)
- The fluid-shear dependency confirmed strong shear-thinning rheology in the practical flow rate range for HnP processes. This shear-thinning behavior is indicative of the formulation’s ability to produce strong foam, maintain conformance control, and minimize loss of injection gas as it propagates deeper into the fracture, as well as its favorable injectivity in the near-wellbore region.
- (4)
- The inversely linear dependency of foam viscosity on system pressure is a novel finding of significant interest. Foam viscosity was observed to linearly decrease with increasing system pressure, regardless of foam quality and total flow rate. This inverse trend could be beneficial for HnP applications because it can act as a negative feedback regulator for injection gas loss and would prevent diversion of mobilized oil during the puff stage. The mechanism causing this trend was proved not to be related to oil swelling and interfacial hydrophobic attraction between surfactant and hydrocarbon gas phase at higher pressure. The observation of different pressure trends with other tested surfactants warrants the need for future work on the behaviors of surfactants and foam at high pressure, with a focus on interfacial adsorption and the properties of surfactants.
Supplementary Materials
The following supporting information can be downloaded at: https://www.mdpi.com/article/10.3390/colloids8010013/s1, Figure S1: Pressure sensitivity analysis for Surfactant A and Surfactant B.
Author Contributions
Conceptualization, A.T.P., A.K. and Q.P.N.; methodology, A.T.P., A.K. and Q.P.N.; validation, A.T.P. and Q.P.N.; formal analysis, A.T.P., A.K. and Q.P.N.; investigation, A.T.P., A.K. and Q.P.N.; resources, Q.P.N.; data curation, A.T.P. and Q.P.N.; writing—original draft preparation, A.T.P.; writing—review and editing, A.T.P., A.K. and Q.P.N.; supervision, Q.P.N.; funding acquisition, Q.P.N. All authors have read and agreed to the published version of the manuscript.
Funding
This research was funded by Dow Chemical, grant number UTA-FA00002205. And The APC was funded by The University of Texas at Austin.
Data Availability Statement
The original contributions presented in the study are included in the article/Supplementary Material, further inquiries can be directed to the corresponding author/s.
Acknowledgments
The authors would like to thank Dow Inc. for their support in this research.
Conflicts of Interest
Author Amit Katiyar was employed by The Dow Chemical Company. The remaining authors declare that the research was conducted in the absence of any commercial or financial relationships that could be construed as a potential conflict of interest.
References
- Milad, M.; Junin, R.; Sidek, A.; Imqam, A.; Tarhuni, M. Huff-n-Puff Technology for Enhanced Oil Recovery in Shale/Tight Oil Reservoirs: Progress, Gaps, and Perspectives. Energy Fuels 2021, 35, 17279–17333. [Google Scholar] [CrossRef]
- Kathel, P.; Mohanty, K.K. EOR in Tight Oil Reservoirs through Wettability Alteration. In Proceedings of the SPE Annual Technical Conference and Exhibition, New Orleans, LA, USA, 30 September–2 October 2013; p. D021S020R008. [Google Scholar]
- Fink, J. Petroleum Engineer’s Guide to Oil Field Chemicals and Fluids, 1st ed.; Elsevier Science and Technology: Oxford, UK, 2011; ISBN 9780123838452. [Google Scholar]
- Dyni, J.R. Geology and Resources of Some World Oil-Shale Deposits; U.S. Geological Survey Scientific Investigations Report 2005–5294; U.S. Department of the Interior: Denver, CO, USA, 2006; p. 42. [Google Scholar]
- Zhang, X.-S.; Wang, H.-J.; Ma, F.; Sun, X.-C.; Zhang, Y.; Song, Z.-H. Classification and Characteristics of Tight Oil Plays. Pet. Sci. 2016, 13, 18–33. [Google Scholar] [CrossRef]
- Li, L.; Su, Y.; Sheng, J.J. Investigation of Gas Penetration Depth During Gas Huff-N-Puff EOR Process in Unconventional Oil Reservoirs. In Proceedings of the UR—Unconventional EOR/IOR & EGR, Calgary, AB, Canada, 13 March 2018; p. D012S002R001. [Google Scholar]
- Khormali, A. Effect of Water Cut on the Performance of an Asphaltene Inhibitor Package: Experimental and Modeling Analysis. Pet. Sci. Technol. 2022, 40, 2890–2906. [Google Scholar] [CrossRef]
- Bao, X.; Fragoso, A.; Aguilera, R. Geological Containment vs. Well Containment for Huff and Puff (H&P) Gas Injection in Shale Oil Reservoirs. In Proceedings of the 10th Unconventional Resources Technology Conference, Houston, TX, USA, 20 June 2022. [Google Scholar]
- Jin, L.; Wan, X.; Azzolina, N.A.; Bosshart, N.W.; Zhao, J.; Yu, Y.; Yu, X.; Smith, S.A.; Sorensen, J.A.; Gorecki, C.D. Optimizing Conformance Control for Gas Injection EOR in Unconventional Reservoirs. Fuel 2022, 324, 124523. [Google Scholar] [CrossRef]
- Elturki, M.; Imqam, A. Application of Enhanced Oil Recovery Methods in Unconventional Reservoirs: A Review and Data Analysis; American Rock Mechanics Association: Golden, CO, USA, 2020; p. ARMA-2020-1081. [Google Scholar]
- Balasubramanian, S.; Chen, P.; Bose, S.; Alzahabi, A.; Thakur, G.C. Recent Advances in Enhanced Oil Recovery Technologies for Unconventional Oil Reservoirs. In Proceedings of the HPHT Technology Verification, Validation, and Regulatory Requirements: Part One; OTC: Houston, TX, USA, 2018; p. D021S024R004. [Google Scholar]
- Mahzari, P.; Mitchell, T.M.; Jones, A.P.; Oelkers, E.H.; Striolo, A.; Iacoviello, F.; Shearing, P.R.; Ernesto Juri, J. Novel Laboratory Investigation of Huff-n-Puff Gas Injection for Shale Oils under Realistic Reservoir Conditions. Fuel 2021, 284, 118950. [Google Scholar] [CrossRef]
- Ganjdanesh, R.; Eltahan, E.; Sepehrnoori, K.; Drozd, H.; Ambrose, R. A Field Pilot of Huff-n-Puff Gas Injection for Enhanced Oil Recovery in Permian Basin. In Proceedings of the PFC Operations, Virtual, 19 October 2020; p. D021S019R002. [Google Scholar]
- Zuloaga-Molero, P.; Yu, W.; Xu, Y.; Sepehrnoori, K.; Li, B. Simulation Study of CO2-EOR in Tight Oil Reservoirs with Complex Fracture Geometries. Sci. Rep. 2016, 6, 33445. [Google Scholar] [CrossRef] [PubMed]
- Sie, C.-Y.; Nguyen, Q.P. Field Gas Huff-n-Puff for Enhancing Oil Recovery in Eagle Ford Shales—Effect of Reservoir Rock and Crude Properties. Fuel 2022, 328, 125127. [Google Scholar] [CrossRef]
- Skauge, A.; Solbakken, J.; Ormehaug, P.A.; Aarra, M.G. Foam Generation, Propagation and Stability in Porous Medium. Transp. Porous Med. 2020, 131, 5–21. [Google Scholar] [CrossRef]
- Sie, C.; Nguyen, Q.P. Field Gas Huff-n-Puff for Improving Oil Recovery from Eagle Ford Shale Reservoirs. In Proceedings of the Field Case 4 Polymer, Virtual, 30 August 2020; p. D021S023R003. [Google Scholar]
- Hoffman, B.T. Huff-N-Puff Gas Injection Pilot Projects in the Eagle Ford. In Proceedings of the UR—Unconventional EOR/IOR & EGR, Calgary, AB, Canada, 13 March 2018; p. D012S001R001. [Google Scholar]
- Hoffman, B.T.; Reichhardt, D. Quantitative Evaluation of Recovery Mechanisms for Huff-n-Puff Gas Injection in Unconventional Reservoirs. In Proceedings of the 7th Unconventional Resources Technology Conference, Denver, CO, USA, 22–24 July 2019. [Google Scholar]
- Li, L.; Su, Y.; Hao, Y.; Zhan, S.; Lv, Y.; Zhao, Q.; Wang, H. A Comparative Study of CO2 and N2 Huff-n-Puff EOR Performance in Shale Oil Production. J. Pet. Sci. Eng. 2019, 181, 106174. [Google Scholar] [CrossRef]
- Bozeman, T.; Nelle, W.; Nguyen, Q. Small Scale EOR Pilot in the Eastern Eagle Ford Boosts Production. In Proceedings of the Field Case Studies 1: Chemical, Virtual, 18 April 2022; p. D011S005R001. [Google Scholar]
- Sie, C.; Nguyen, Q.P. Laboratory Investigations on Field Gas Huff-n-Puff for Improving Oil Recovery in Eagle Ford Shale—Effect of Operating Conditions. Energy Fuels 2022, 36, 195–209. [Google Scholar] [CrossRef]
- Alfarge, D.; Alsaba, M.; Wei, M.; Bai, B. Miscible Gases Based EOR in Unconventional Liquids Rich Reservoirs: What We Can Learn. In Proceedings of the Modelling Heavy Oil Performance to Optimize the Future, Kuwait City, Kuwait, 10 December 2018; p. D022S034R002. [Google Scholar]
- Katiyar, A.; Patil, P.D.; Rohilla, N.; Crosley, M.; Miller, T.; Rozowski, P.; Evans, J.; Bozeman, T.; Nguyen, Q.P. Unconventional Reservoir Hydrocarbon-Gas Foam Enhanced-Oil-Recovery Pilot: Design, Implementation, and Performance Analysis. SPE Reserv. Eval. Eng. 2021, 24, 194–204. [Google Scholar] [CrossRef]
- Li, L.; Zhou, X.; Su, Y.; Xiao, P.; Chen, Z.; Zheng, J. Influence of Heterogeneity and Fracture Conductivity on Supercritical CO2 Miscible Flooding Enhancing Oil Recovery and Gas Channeling in Tight Oil Reservoirs. Energy Fuels 2022, 36, 8199–8209. [Google Scholar] [CrossRef]
- Fiallos Torres, M.X.; Yu, W.; Ganjdanesh, R.; Kerr, E.; Sepehrnoori, K.; Miao, J.; Ambrose, R. Modeling Interwell Fracture Interference and Huff-N-Puff Pressure Containment in Eagle Ford Using EDFM. In Proceedings of the Completions I: Fracturing Materials, Oklahoma City, OK, USA, 8 April 2019; p. D021S009R003. [Google Scholar]
- Wang, L.; Yu, W. Lean Gas Huff and Puff Process for Eagle Ford Shale with Connecting Natural Fractures: Well Interference, Methane Adsorption and Gas Trapping Effects. In Proceedings of the Learnings from Integrated Modeling Efforts, Odessa, TX, USA, 30 October 2019; p. D021S007R003. [Google Scholar]
- Wan, T.; Wang, W.; Jiang, J.; Zhang, Y. Pore-Scale Analysis of Gas Huff-n-Puff Enhanced Oil Recovery and Waterflooding Process. Fuel 2018, 215, 561–571. [Google Scholar] [CrossRef]
- Jia, H.; Sheng, J.J. Simulation Study of Huff-n-Puff Air Injection for Enhanced Oil Recovery in Shale Oil Reservoirs. Petroleum 2018, 4, 7–14. [Google Scholar] [CrossRef]
- Luo, H.; Delshad, M.; Pope, G.A.; Mohanty, K.K. Interactions Between Viscous Fingering and Channeling for Unstable Water/Polymer Floods in Heavy Oil Reservoirs. In Proceedings of the Scalable Linear and Nonlinear Solvers, Montgomery, TX, USA, 20 February 2017; p. D011S002R007. [Google Scholar]
- Sagbana, P.I.; Abushaikha, A.S. A Comprehensive Review of the Chemical-Based Conformance Control Methods in Oil Reservoirs. J. Pet. Explor. Prod. Technol. 2021, 11, 2233–2257. [Google Scholar] [CrossRef]
- Bernard, G.G.; Holm, L.W.; Harvey, C.P. Use of Surfactant to Reduce CO2 Mobility in Oil Displacement. Soc. Pet. Eng. J. 1980, 20, 281–292. [Google Scholar] [CrossRef]
- Lawson, J.B.; Reisberg, J. Alternate Slugs Of Gas And Dilute Surfactant For Mobility Control During Chemical Flooding. In Proceedings of the SPE/DOE Enhanced Oil Recovery Symposium, Tulsa, OK, USA, 20 April 1980; p. SPE-8839-MS. [Google Scholar]
- Li, R.F.; Yan, W.; Liu, S.; Hirasaki, G.J.; Miller, C.A. Foam Mobility Control for Surfactant Enhanced Oil Recovery. SPE J. 2010, 15, 928–942. [Google Scholar] [CrossRef]
- Hassanzadeh, A.; Katiyar, A.; Kalaei, H.; Pecore, D.; Schofield, E.; Nguyen, Q.P. A Novel Foam Process with CO2 Dissolved Surfactant for Improved Sweep Efficiency in EVGSAU Field. Geoenergy Sci. Eng. 2023, 231, 212310. [Google Scholar] [CrossRef]
- Seright, R.S. A Review of Gel Placement Concepts; Reservoir Sweep Improvement; New Mexico Institute of Mining and Technology: Socorro, NM, USA, 1996. [Google Scholar]
- Pope, D.S.; Leung, L.K.; Gulbis, J.; Constien, V.G. Effects of Viscous Fingering on Fracture Conductivity. SPE Prod. Facil. 1996, 11, 230–237. [Google Scholar] [CrossRef]
- Qajar, A.; Xue, Z.; Worthen, A.J.; Johnston, K.P.; Huh, C.; Bryant, S.L.; Prodanović, M. Modeling Fracture Propagation and Cleanup for Dry Nanoparticle-Stabilized-Foam Fracturing Fluids. J. Pet. Sci. Eng. 2016, 146, 210–221. [Google Scholar] [CrossRef]
- Xiong, X.; Sheng, J.J.; Wu, X.; Qin, J. Experimental Investigation of Foam-Assisted N2 Huff-n-Puff Enhanced Oil Recovery in Fractured Shale Cores. Fuel 2022, 311, 122597. [Google Scholar] [CrossRef]
- Wu, Z.; Chen, H.; Cai, X.; Gou, Q.; Jiang, L.; Chen, K.; Chen, Z.; Jiang, S. Current Status and Future Trends of In Situ Catalytic Upgrading of Extra Heavy Oil. Energies 2023, 16, 4610. [Google Scholar] [CrossRef]
- Wu, Z.; Liu, H.; Pang, Z.; Wu, Y.; Wang, X.; Liu, D.; Gao, M. A Visual Investigation of Enhanced Heavy Oil Recovery by Foam Flooding after Hot Water Injection. J. Pet. Sci. Eng. 2016, 147, 361–370. [Google Scholar] [CrossRef]
- Das, A.; Nguyen, N.; Nguyen, Q.P. Low Tension Gas Flooding for Secondary Oil Recovery in Low-Permeability, High-Salinity Reservoirs. Fuel 2020, 264, 116601. [Google Scholar] [CrossRef]
- Hao, H.; Hou, J.; Zhao, F.; Huang, H.; Liu, H. N2 -Foam-Assisted CO2 Huff-n-Puff Process for Enhanced Oil Recovery in a Heterogeneous Edge-Water Reservoir: Experiments and Pilot Tests. Rsc Adv. 2021, 11, 1134–1146. [Google Scholar] [CrossRef] [PubMed]
- AlQuaimi, B.I.; Rossen, W.R. Characterizing Foam Flow in Fractures for Enhanced Oil Recovery. In Proceedings of the 19th European Symposium on Improved Oil Recovery, Stavanger, Norway, 24 April 2017. [Google Scholar]
- Fernø, M.A.; Gauteplass, J.; Pancharoen, M.; Haugen, A.; Graue, A.; Kovscek, A.R.; Hirasaki, G. Experimental Study of Foam Generation, Sweep Efficiency, and Flow in a Fracture Network. SPE J. 2016, 21, 1140–1150. [Google Scholar] [CrossRef]
- Chen, L.; Huang, M.; Li, Z.; Liu, D.; Li, B. Experimental Study on the Characteristics of Foam Flow in Fractures. J. Pet. Sci. Eng. 2020, 185, 106663. [Google Scholar] [CrossRef]
- Osei-Bonsu, K.; Shokri, N.; Grassia, P. Fundamental Investigation of Foam Flow in a Liquid-Filled Hele-Shaw Cell. J. Colloid Interface Sci. 2016, 462, 288–296. [Google Scholar] [CrossRef]
- Steinsbø, M.; Brattekås, B.; Ersland, G.; Bø, K.; Opdal, I.E.; Tunli, R.; Graue, A.; Fernø, M.A. Foam as Mobility Control for Integrated CO2-EOR in Fractured Carbonates. In Proceedings of the 18th European Symposium on Improved Oil Recovery, Dresden, Germany, 14 April 2015. [Google Scholar]
- Haugen, A.; Fernø, M.A.; Graue, A.; Bertin, H.J. Experimental Study of Foam Flow in Fractured Oil-Wet Limestone for Enhanced Oil Recovery. SPE Reserv. Eval. Eng. 2012, 15, 218–228. [Google Scholar] [CrossRef]
- Fernø, M.A.; Eide, Ø.; Steinsbø, M.; Langlo, S.A.W.; Christophersen, A.; Skibenes, A.; Ydstebø, T.; Graue, A. Mobility Control during CO2 EOR in Fractured Carbonates Using Foam: Laboratory Evaluation and Numerical Simulations. J. Pet. Sci. Eng. 2015, 135, 442–451. [Google Scholar] [CrossRef]
- Haugen, Å.; Mani, N.; Svenningsen, S.; Brattekås, B.; Graue, A.; Ersland, G.; Fernø, M.A. Miscible and Immiscible Foam Injection for Mobility Control and EOR in Fractured Oil-Wet Carbonate Rocks. Transp. Porous Med. 2014, 104, 109–131. [Google Scholar] [CrossRef]
- Xu, Z.; Cao, A.; Chen, L.; Cui, S.; Yu, G.; Li, Z. Flow Characteristics of Foam in Fracture Networks. Ind. Eng. Chem. Res. 2020, 59, 19817–19828. [Google Scholar] [CrossRef]
- Qu, M.; Liang, T.; Hou, J. Study on Fluid Behaviors of Foam-Assisted Nitrogen Flooding on a Three-Dimensional Visualized Fracture–Vuggy Model. Appl. Sci. 2021, 11, 11082. [Google Scholar] [CrossRef]
- Fei, Y.; Johnson, R.L.; Gonzalez, M.; Haghighi, M.; Pokalai, K. Experimental and Numerical Investigation into Nano-Stabilized Foams in Low Permeability Reservoir Hydraulic Fracturing Applications. Fuel 2018, 213, 133–143. [Google Scholar] [CrossRef]
- Pancharoen, M.; Fernø, M.A.; Kovscek, A.R. Modeling Foam Displacement in Fractures. J. Pet. Sci. Eng. 2012, 100, 50–58. [Google Scholar] [CrossRef]
- Gauteplass, J.; Chaudhary, K.; Kovscek, A.R.; Fernø, M.A. Pore-Level Foam Generation and Flow for Mobility Control in Fractured Systems. Colloids Surf. A Physicochem. Eng. Asp. 2015, 468, 184–192. [Google Scholar] [CrossRef]
- Wang, F.; Du, D.; Bi, H.; Wang, H.; Chen, H.; Li, H. Quantitative Characterization of Foam Transient Structure in Porous Media and Analysis of Its Flow Behavior Based on Fractal Theory. Ind. Eng. Chem. Res. 2020, 59, 5158–5166. [Google Scholar] [CrossRef]
- Buchgraber, M.; Castanier, L.M.; Kovscek, A.R. Microvisual Investigation of Foam Flow in Ideal Fractures: Role of Fracture Aperture and Surface Roughness. In Proceedings of the SPE Annual Technical Conference and Exhibition, San Antonio, TX, USA, 8 October 2012; p. SPE-159430-MS. [Google Scholar]
- Champagne, L.M.; Zelenev, A.S.; Penny, G.S.; Travis, K. Critical Assessment of Microemulsion Technology for Enhancing Fluid Recovery from Tight Gas Formations and Propped Fractures. In Proceedings of the SPE European Formation Damage Conference, Noordwijk, The Netherlands, 7 June 2011; p. SPE-144095-MS. [Google Scholar]
- Sydansk, R.D. Polymer-Enhanced Foams Part 2: Propagation Through High-Permeability Sandpacks. SPE Adv. Technol. Ser. 1994, 2, 160–166. [Google Scholar] [CrossRef]
- Kamarul Bahrim, R.Z.; Zeng, Y.; Vincent Bonnieu, S.; Groenenboom, J.; Mohd Shafian, S.R.; Abdul Manap, A.A.; Tewari, R.D.; Biswal, S.L. A Study of Methane Foam in Reservoir Rocks for Mobility Control at High Temperature with Varied Permeabilities: Experiment and Simulation. In Proceedings of the Special Session 2: Rate Transient Analysis: A Rainbow of Real-Life Cases, Jakarta, Indonesia, 17 October 2017; p. D021S009R001. [Google Scholar]
- Sri Hanamertani, A.; Saraji, S.; Piri, M. The Effects of In-Situ Emulsion Formation and Superficial Velocity on Foam Performance in High-Permeability Porous Media. Fuel 2021, 306, 121575. [Google Scholar] [CrossRef]
- Thakore, V.; Ren, F.; Wang, H.; Wang, J.-A.J.; Polsky, Y. High Temperature, High Pressure Stability of Aqueous Foams for Potential Application in Enhanced Geothermal System (EGS). In Proceedings of the 47th Workshop on Geothermal Reservoir Engineering, Stanford, CA, USA, 1 February 2022; Volume SGP-TR-223, pp. 604–614. [Google Scholar]
- Wang, Y.; Zhang, Y.; Liu, Y.; Zhang, L.; Ren, S.; Lu, J.; Wang, X.; Fan, N. The Stability Study of CO2 Foams at High Pressure and High Temperature. J. Pet. Sci. Eng. 2017, 154, 234–243. [Google Scholar] [CrossRef]
- Nguyen, Q.P. Dynamics of Foam in Porous Media; Wageningen University: Saigon, Vietnam, 2004. [Google Scholar]
- Rashed Rohani, M.; Ghotbi, C.; Badakhshan, A. Foam Stability and Foam-Oil Interactions. Pet. Sci. Technol. 2014, 32, 1843–1850. [Google Scholar] [CrossRef]
- Osei-Bonsu, K.; Shokri, N.; Grassia, P. Foam Stability in the Presence and Absence of Hydrocarbons: From Bubble- to Bulk-Scale. Colloids Surf. A Physicochem. Eng. Asp. 2015, 481, 514–526. [Google Scholar] [CrossRef]
- Mannhardt, K.; Novosad, J.J.; Schramm, L.L. Comparative Evaluation of Foam Stability to Oil. SPE Reserv. Eval. Eng. 2000, 3, 23–34. [Google Scholar] [CrossRef]
- Le Van, S.; Youssif, M.I.; Hanamertani, A.S.; Sharma, K.V.; Elkhatib, O.; Rane, K.; Xie, Y.; Das, A.; Piri, M.; Katiyar, A.; et al. Methane Foam Performance Evaluation in Water-Wet Unconsolidated Porous Media: A Systematic Experimental Investigation at Elevated Pressure and Temperature Conditions. J. Nat. Gas. Sci. Eng. 2022, 104835. [Google Scholar] [CrossRef]
- Hirasaki, G.J.; Miller, C.A.; Raney, O.G.; Poindexter, M.K.; Nguyen, D.T.; Hera, J. Separation of Produced Emulsions from Surfactant Enhanced Oil Recovery Processes. Energy Fuels 2011, 25, 555–561. [Google Scholar] [CrossRef]
- Suniga, P.T.; Fortenberry, R.; Delshad, M. Observations of Microemulsion Viscosity for Surfactant EOR Processes. In Proceedings of the SPE Improved Oil Recovery Conference, Tulsa, OK, USA, 11 April 2016; p. SPE-179669-MS. [Google Scholar]
- Salleh, I.K.; Misra, S.; Ibrahim, J.M.B.M.; Panuganti, S.R. Micro-Emulsion-Based Dissolver for Removal of Mixed Scale Deposition. J. Pet. Explor. Prod. Technol. 2019, 9, 2635–2641. [Google Scholar] [CrossRef]
- Osterloh, W.T.; Jante, M.J. Effects of Gas and Liquid Velocity on Steady-State Foam Flow at High Temperature. In Proceedings of the SPE/DOE Enhanced Oil Recovery Symposium, Tulsa, OK, USA, 22–24 April 1992. [Google Scholar]
- Ma, K.; Lopez-Salinas, J.L.; Puerto, M.C.; Miller, C.A.; Biswal, S.L.; Hirasaki, G.J. Estimation of Parameters for the Simulation of Foam Flow through Porous Media. Part 1: The Dry-Out Effect. Energy Fuels 2013, 27, 2363–2375. [Google Scholar] [CrossRef]
- Alvarez, J.M.; Rivas, H.J.; Rossen, W.R. Unified Model for Steady-State Foam Behavior at High and Low Foam Qualities. SPE J. 2001, 6, 325–333. [Google Scholar] [CrossRef]
- Kahrobaei, S.; Vincent-Bonnieu, S.; Farajzadeh, R. Experimental Study of Hysteresis Behavior of Foam Generation in Porous Media. Sci. Rep. 2017, 7, 8986. [Google Scholar] [CrossRef]
- M’barki, O.; Ma, K.; Ren, G.; Mateen, K.; Bourdarot, G.; Morel, D.C.; Nguyen, Q.P. Repeatable Steady-State Foam Experimental Data and Investigations of Foam Hysteresis in a Sand Pack. In Proceedings of the Petroleum Education and Methods, San Antonio, TX, USA, 9 October 2017; p. D021S028R007. [Google Scholar]
- Khatib, Z.I.; Hirasaki, G.J.; Falls, A.H. Effects of Capillary Pressure on Coalescence and Phase Mobilities in Foams Flowing Through Porous Media. SPE Reserv. Eng. 1988, 3, 919–926. [Google Scholar] [CrossRef]
- Cong, Z.; Li, Y.; Pan, Y.; Liu, B.; Shi, Y.; Wei, J.; Li, W. Study on CO2 Foam Fracturing Model and Fracture Propagation Simulation. Energy 2022, 238, 121778. [Google Scholar] [CrossRef]
- Hirasaki, G.J.; Lawson, J.B. Mechanisms of Foam Flow in Porous Media: Apparent Viscosity in Smooth Capillaries. Soc. Pet. Eng. J. 1985, 25, 176–190. [Google Scholar] [CrossRef]
- Chang, S.-H.; Grigg, R.B. Effects of Foam Quality and Flow Rate on CO2-Foam Behavior at Reservoir Temperature and Pressure. SPE Reserv. Eval. Eng. 1999, 2, 248–254. [Google Scholar] [CrossRef]
- Lee, H.O.; Heller, J.P.; Hoefer, A.M.W. Change in Apparent Viscosity off CO2 Foam With Rock Permeability. SPE Reserv. Eng. 1991, 6, 421–428. [Google Scholar] [CrossRef]
- Salazar Castillo, R.O.; Ter Haar, S.F.; Ponners, C.G.; Bos, M.; Rossen, W. Fractional-Flow Theory for Non-Newtonian Surfactant-Alternating-Gas Foam Processes. Transp. Porous Med. 2020, 131, 399–426. [Google Scholar] [CrossRef]
- Holt, T.; Vassenden, F.; Svorstol, I. Effects of Pressure on Foam Stability; Implications for Foam Screening. In Proceedings of the SPE/DOE Improved Oil Recovery Symposium, Tulsa, OK, USA, 21–24 April 1996. [Google Scholar]
- Friedmann, F.; Jensen, J.A. Some Parameters Influencing the Formation and Propagation of Foams in Porous Media. In Proceedings of the SPE California Regional Meeting, Oakland, CA, USA, 2–4 April 1986. [Google Scholar]
- Farajzadeh, R.; Andrianov, A.; Bruining, H.; Zitha, P.L.J. Comparative Study of CO2 and N2 Foams in Porous Media at Low and High Pressure−Temperatures. Ind. Eng. Chem. Res. 2009, 48, 4542–4552. [Google Scholar] [CrossRef]
- Yang, C.; Gu, Y. Diffusion Coefficients and Oil Swelling Factors of Carbon Dioxide, Methane, Ethane, Propane, and Their Mixtures in Heavy Oil. Fluid Phase Equilibria 2006, 243, 64–73. [Google Scholar] [CrossRef]
- Rezk, M.G.; Foroozesh, J. Determination of Mass Transfer Parameters and Swelling Factor of CO2-Oil Systems at High Pressures. Int. J. Heat Mass Transf. 2018, 126, 380–390. [Google Scholar] [CrossRef]
- Heagle, D.J.; Ryan, D. Experimental Determination of the Interfacial Tension and Swelling Factors of Bakken and Duvernay Oils with CO2, Impure CO2, Methane, Ethane, and Propane. Energy Fuels 2022, 36, 806–817. [Google Scholar] [CrossRef]
- Wang, J.; Nguyen, A.V.; Farrokhpay, S. Effects of Surface Rheology and Surface Potential on Foam Stability. Colloids Surf. A Physicochem. Eng. Asp. 2016, 488, 70–81. [Google Scholar] [CrossRef]
- Wang, L.; Yoon, R.-H. Effects of Surface Forces and Film Elasticity on Foam Stability. Int. J. Miner. Process. 2008, 85, 101–110. [Google Scholar] [CrossRef]
- Cantat, I. Foams: Structure and Dynamics, 1st ed.; Oxford University Press: Oxford, UK; New York, NY, USA, 2013; ISBN 978-0-19-966289-0. [Google Scholar]
- Yu, Y.; García, B.F.; Saraji, S. Surfactant Viscoelasticity as a Key Parameter to Improve Supercritical CO2 Foam Stability/Foamability and Performance in Porous Media. J. Non-Newton. Fluid Mech. 2020, 282, 104311. [Google Scholar] [CrossRef]
- Stubenrauch, C.; Klitzing, R. von Disjoining Pressure in Thin Liquid Foam and Emulsion Films—New Concepts and Perspectives. J. Phys. Condens. Matter. 2003, 15, R1197–R1232. [Google Scholar] [CrossRef]
- Peng, M.; Duignan, T.T.; Nguyen, A.V. Significant Effect of Surfactant Adsorption Layer Thickness in Equilibrium Foam Films. J. Phys. Chem. B 2020, 124, 5301–5310. [Google Scholar] [CrossRef]
- Rosen, M.J.; Kunjappu, J.T. Surfactants and Interfacial Phenomena, 4th ed.; Wiley: Hoboken, NJ, USA, 2012; ISBN 978-1-118-22893-7. [Google Scholar]
- Dawson, D.R.; Offen, H.W.; Nicoli, D.F. Pressure Effects on Micellar Size. J. Colloid Interface Sci. 1981, 81, 396–401. [Google Scholar] [CrossRef]
- Espinosa Silva, Y.R.; Grigera, J.R. Micelle Stability in Water under a Range of Pressures and Temperatures; Do Both Have a Common Mechanism? RSC Adv. 2015, 5, 70005–70009. [Google Scholar] [CrossRef]
- Chu, K.-C.; Hu, S.-W.; Tsao, H.-K.; Sheng, Y.-J. Strong Competition between Adsorption and Aggregation of Surfactant in Nanoscale Systems. J. Colloid Interface Sci. 2019, 553, 674–681. [Google Scholar] [CrossRef] [PubMed]
- Gittins, P.; Iglauer, S.; Pentland, C.H.; Al-Mansoori, S.; Al-Sayari, S.; Bijeljic, B.; Blunt, M.J. Nonwetting Phase Residual Saturation in Sand Packs. J. Porous Media 2010, 13, 591–599. [Google Scholar] [CrossRef]
- Morrow, N.R.; Lim, H.T.; Ward, J.S. Effect of Crude-Oil-Induced Wettability Changes on Oil Recovery. SPE Form. Eval. 1986, 1, 89–103. [Google Scholar] [CrossRef]
- Brown, R.J.S.; Fatt, I. Measurements Of Fractional Wettability Of Oil Fields’ Rocks By The Nuclear Magnetic Relaxation Method. In Proceedings of the Fall Meeting of the Petroleum Branch of AIME, Los Angeles, CA, USA, 14 October 1956; p. SPE-743-G. [Google Scholar]
- Pentland, C.H.; Itsekiri, E.; Al Mansoori, S.K.; Iglauer, S.; Bijeljic, B.; Blunt, M.J. Measurement of Nonwetting-Phase Trapping in Sandpacks. SPE J. 2010, 15, 274–281. [Google Scholar] [CrossRef]
- Harpole, K.J.; Siemers, W.T.; Gerard, M.G. CO2 Foam Field Verification Pilot Test at EVGSAU: Phase IIIC--Reservoir Characterization and Response to Foam Injection. In Proceedings of the SPE/DOE Improved Oil Recovery Symposium, Tulsa, OK, USA, 17–20 April 1994. [Google Scholar]
- Ma, K.; Farajzadeh, R.; Lopez-Salinas, J.L.; Miller, C.A.; Biswal, S.L.; Hirasaki, G.J. Estimation of Parameters for the Simulation of Foam Flow through Porous Media: Part 3; Non-Uniqueness, Numerical Artifact and Sensitivity. In Proceedings of the SPE Enhanced Oil Recovery Conference, Kuala Lumpur, Malaysia, 2 July 2013; p. SPE-165263-MS. [Google Scholar]
- Abbaszadeh, M.; Nia Korrani, A.K.; Lopez-Salinas, J.L.; Rodriguez-de la Garza, F.; Villavicencio Pino, A.; Hirasaki, G. Experimentally-Based Empirical Foam Modeling. In Proceedings of the SPE Improved Oil Recovery Symposium, Tulsa, OK, USA, 12 April 2014; p. SPE-169888-MS. [Google Scholar]
Figure 1.
Visual diagram of how foam acts as an effective mobility control agent [35].
Figure 1.
Visual diagram of how foam acts as an effective mobility control agent [35].

Figure 2.
Bulk foam decay at 298 K, (a) without oil and (b) with oil at various pressures.
Figure 3.
Bulk foam decay at 3000 psi (a) without oil and (b) with oil at various temperatures.
Figure 4.
Bulk foam observations at 3000 psi and 388 K without oil at (a) 0, (b) 5, (c) 10, (d) 30, and (e) 90 min after shaking.
Figure 4.
Bulk foam observations at 3000 psi and 388 K without oil at (a) 0, (b) 5, (c) 10, (d) 30, and (e) 90 min after shaking.
Figure 5.
Emulsion tendency results at 388 K.
Figure 6.
Foam quality analysis at residual oil for full pressure scan at 0.0176 cm/s.
Figure 7.
Shear thinning profile at residual oil for full flow rate scan at 80% FQ.
Figure 8.
Pressure sensitivity analysis at residual oil for full flow rate scan at (a) 60% FQ and (b) 90% FQ.
Figure 8.
Pressure sensitivity analysis at residual oil for full flow rate scan at (a) 60% FQ and (b) 90% FQ.
Figure 9.
Foam quality analysis at 0.0176 cm/s and 4000 psi for both the residual oil environment and the oil-free environment.
Figure 9.
Foam quality analysis at 0.0176 cm/s and 4000 psi for both the residual oil environment and the oil-free environment.
Figure 10.
Pressure sensitivity analysis at 0.0529 cm/s for 60% and 90% FQ in the residual oil environment and the oil-free environment.
Figure 10.
Pressure sensitivity analysis at 0.0529 cm/s for 60% and 90% FQ in the residual oil environment and the oil-free environment.
Figure 11.
Foam quality analysis at 0.0529 cm/s and 3000 psi when co-injected with methane and with nitrogen.
Figure 11.
Foam quality analysis at 0.0529 cm/s and 3000 psi when co-injected with methane and with nitrogen.
Figure 12.
Pressure sensitivity analysis at 0.0529 cm/s for 60% and 80% FQ when co-injected with methane and with nitrogen.
Figure 12.
Pressure sensitivity analysis at 0.0529 cm/s for 60% and 80% FQ when co-injected with methane and with nitrogen.
Figure 13.
Diagram of core flood setup.

Table 1.
Synthetic brine composition.
| Salt | Concentration (ppm) |
|---|---|
| NaCl | 10,500 |
| CaCl2∙2H2O | 1000 |
| KCl | 100 |
Table 2.
Bulk foam test conditions.
| Temperature (K) | Pressure (psi) | Oil Volume (mL) | Surfactant Concentration (wt%) | Salinity (ppm) |
|---|---|---|---|---|
| 298 | 0, 2000, 3000, 4000 | 0, 0.4 | 0.5 | 30,000 |
| 388 | 3000 | 0, 0.4 | 0.5 | 30,000 |
Table 3.
Flooding schemes.
| Flood Series | 1 (Baseline) | 2 (Residual Oil) | 3 (No Oil) | 4 (Nitrogen) | ||
|---|---|---|---|---|---|---|
| Temperature (K) | 388 | 388 | 388 | 388 | ||
| Pressure (psi) | 4000 | 4000 | 1000, 2000, 3000 | 4000 | 2000, 3000 | 2000, 3000, 4000 |
| Flow Rate (cm/s) | 0.0176, 0.176 | 0.0176, 0.0529, 0.106, 0.176 | 0.0176, 0.0529, 0.106 | 0.0176, 0.0529, 0.106 | 0.0529 | 0.0529 |
| Foam Quality (%) | 60, 80, 90, 95 | 60, 80, 90, 95 | 60, 80, 90, 95 | 60, 80, 90, 95 | ||
| Brine Salinity (ppm) | 30,000 | 30,000 | 30,000 | 30,000 | ||
| Surfactant Concentration (wt%) | 0 | 0.5 | 0.5 | 0.5 | ||
| Oil Saturation | Residual | Residual | None | None | ||
| Injection Gas | Methane | Methane | Methane | Nitrogen | ||
Disclaimer/Publisher’s Note: The statements, opinions and data contained in all publications are solely those of the individual author(s) and contributor(s) and not of MDPI and/or the editor(s). MDPI and/or the editor(s) disclaim responsibility for any injury to people or property resulting from any ideas, methods, instructions or products referred to in the content. |
© 2024 by the authors. Licensee MDPI, Basel, Switzerland. This article is an open access article distributed under the terms and conditions of the Creative Commons Attribution (CC BY) license (https://creativecommons.org/licenses/by/4.0/).
Share and Cite
MDPI and ACS Style
Parekh, A.T.; Katiyar, A.; Nguyen, Q.P. Factors Influencing the Rheology of Methane Foam for Gas Mobility Control in High-Temperature, Proppant-Fractured Reservoirs. Colloids Interfaces 2024, 8, 13. https://doi.org/10.3390/colloids8010013
AMA Style
Parekh AT, Katiyar A, Nguyen QP. Factors Influencing the Rheology of Methane Foam for Gas Mobility Control in High-Temperature, Proppant-Fractured Reservoirs. Colloids and Interfaces. 2024; 8(1):13. https://doi.org/10.3390/colloids8010013
Chicago/Turabian StyleParekh, Aashish T., Amit Katiyar, and Quoc P. Nguyen. 2024. "Factors Influencing the Rheology of Methane Foam for Gas Mobility Control in High-Temperature, Proppant-Fractured Reservoirs" Colloids and Interfaces 8, no. 1: 13. https://doi.org/10.3390/colloids8010013