
The Dynamic Nature of Wrack: An Investigation into Wrack Movement and Impacts on Coastal Marshes Using sUAS
by
 , , and
Grayson R. Morgan
1,* ,
,
Daniel R. Morgan
2,
Cuizhen Wang
3,
Michael E. Hodgson
3 and
Steven R. Schill
4
1
Department of Geography, Brigham Young University, Provo, UT 84606, USA
2
Beaufort County Mapping and Applications Department, Beaufort, SC 29906, USA
3
Department of Geography, University of South Carolina, Columbia, SC 29208, USA
4
Caribbean Division, The Nature Conservancy, Coral Gables, FL 33134, USA
*
Author to whom correspondence should be addressed.
Drones 2023, 7(8), 535; https://doi.org/10.3390/drones7080535
Submission received: 30 June 2023
/
Revised: 10 August 2023
/
Accepted: 17 August 2023
/
Published: 19 August 2023
Abstract
:This study investigates the use of small unoccupied aerial systems (sUAS) as a new remote sensing tool to identify and track the spatial distribution of wrack on coastal tidal marsh systems. We used sUAS to map the wrack movement in a Spartina alterniflora-dominated salt marsh monthly for one year including before and after Hurricane Isaias that brought strong winds, rain, and storm surge to the area of interest in August 2020. Flight parameters for each data collection mission were held constant including collection only during low tide. Wrack was visually identified and digitized in a GIS using every mission orthomosaic created from the mission images. The digitized polygons were visualized using a raster data model and a combination of all of the digitized wrack polygons. Results indicate that wrack mats deposited before and as a result of a hurricane event remained for approximately three months. Furthermore, 55% of all wrack detritus was closer than 10 m to river or stream water bodies, 64% were within 15 m, and 71% were within 20 m, indicating the spatial dependence of wrack location in a marsh system on water and water movement. However, following the passing of Isaias, the percentage of wrack closer than 10 m to a river or creek decreased to a low of 44%, which was not seen again during the year-long study. This study highlights the on-demand image collection of a sUAS for providing new insights into how quickly wrack distribution and vegetation can change over a short time.
1. Introduction
Quickly developing small unoccupied aircraft system (sUAS) technology has the potential to add clarity and provide useful data from high spatial resolution imagery and smaller temporal windows between data collections for studying the natural world. While small unoccupied aircraft have a rather robust military pedigree, their use by civilians for research applications began more recently [1,2]. After the first studies using sUAS for photogrammetric research in Germany in 1979 [3], UAVs and sUAS were soon considered for vegetation monitoring, animal monitoring, conservation, and other ecological applications, amongst others [4,5,6,7,8,9,10,11,12].
As sUAS technology continues to grow in popularity and become more accessible, coastal wetland scientists and managers are using this technology to exploit a local scale monitoring gap that was previously difficult to fill. Traditional in situ methods for monitoring wrack in tidal marshes, though effective, require significant time, human, and technological resources that can strain government agencies and coastal managers when undertaken on a regular basis. High spatial resolution satellite and aerial images have been used to monitor marshes in the past, but the highest resolution images still make identifying vegetation and other objects in the marsh difficult. Marsh vegetation tends to consist of thin, tall stalks that can be difficult to distinguish from other features. The advancement of sUAS technologies provides new high spatial (mm to cm size pixels) and adaptable temporal resolution imagery that greatly advances local scale coastal wetland monitoring [7,13,14]. Highly accurate global navigation satellite system (GNSS) positioning technology and onboard computers provide the means whereby sUASs can fly preprogrammed missions at low altitudes over tidal marshes that were previously difficult to access due to the complexity of the environment [7]. Low altitude flights and sensitive RGB cameras provide high spatial resolution that can assist in the identification of marsh vegetation—even individual stalks. The adaptable temporal resolution potential of an sUAS refers to the idea that an sUAS is a personal remote sensing device—one that fits the “Faster, Better, Cheaper” paradigm of aerospace products as they have evolved over the last 30 years. Image spatial and temporal resolutions can be adjusted on the fly by changing the time of a flight, altitude of a flight, or selecting a sensor that matches the needs of the research question. Both the high spatial resolution and the adaptable temporal resolution play key roles in obtaining imagery at optimal times for a coastal tidal salt marsh and understanding the disturbances and influences that dynamically impact them over time.
Coastal tidal marshes are highly productive and dynamic ecosystems that provide a multitude of ecological and economic benefits such as carbon sequestration, pollution and sedimentation filtration, and nurseries for several crustacean and fish species such as the blue crab and sheepshead minnow [15,16,17,18]. These ecosystems absorb wave energy during storms, providing flood protection to people and infrastructure [19] as well as opportunities for ecotourism and fishing [20,21]. Their dynamic nature necessitates regular monitoring and mapping projects to identify how anthropogenic and natural factors influence the marsh system as a whole. Tidal wrack, or dead plant material that form mats, is one of the primary sources of natural disturbances in coastal marsh ecosystems [22,23].
It is widely held that tidal wrack can settle on living vegetation and have negative effects including killing the underlying vegetation. Studies have shown that when such disturbances occur for at least a three-to-four-month period, the risk of death to underlying vegetation increases, and devegetated areas can last for up to two years [23,24,25]. When wrack mats form into larger clusters of wrack mats, disturbances are more likely to lead to longer term damage to the marsh system [25]. In addition, wrack can often contain plastics, debris, and other anthropogenic pollution that can further impact the vitality of the marsh ecosystem and species that depend on it [26]. Redistribution and dominance of different marsh vegetation species can also arise as a result of prolonged wrack deposition [27]. High marsh species such as Black needlerush (Juncus roemerieanus) can gain a foothold in the low marsh that is typically dominated by Smooth cordgrass (Spartina alterniflora). Furthermore, wrack deposition can facilitate the spread of invasives species such as the Common reed (Phragmites australis) [28]. This concern has been voiced by many natural resource departments and coastal managers, particularly in South Carolina, USA [29].
Unfortunately, many aspects of wrack impact on coastal tidal marshes have yet to be studied because of resource limitations. For example, wrack deposition, persistence, and subsequent effect on vegetation following the influence of a hurricane has yet to be comprehensively examined [30]. Little is known about the spatio-temporal distribution of wrack in coastal marshes because it is often hidden in areas within the marsh. Wrack is brought in and deposited by hurricane storm surge, but its long-term influence after the storm has not been studied, creating a gap in the literature [31]. This study suggests that the high spatial and adjustable temporal resolution advantages that sUASs provide are optimal for mapping and monitoring wrack location and visual impact over an extended period of time, especially before and after a hurricane event. The research contained herein focuses mostly on qualitative and simple quantitative visual observations that are made possible by the application of unique high spatial and adjustable temporal resolution characteristics inherent in sUAS imaging. Specifically, our research addresses the following exploratory questions:
- How is wrack distributed spatially throughout a marsh and how does the distribution change over small temporal intervals (i.e., months)?
- What are the pre- and post-hurricane impacts on wrack distribution and how long do these impacts last throughout the marsh system?
- Does the high spatial and temporal resolution of sUAS technology offer insights into the positive and negative impacts of wrack distribution change within a marsh system?
2. Materials and Methods
2.1. Study Area
The study area is part of a small coastal tidal marsh in Harbor Island, SC, USA (32.3880° N, 80.4529° W), within the Ashepoo, Combahee, and Edisto (ACE) Basin, which has been designated as an Important Bird Area by the National Audubon Society as it is home to at least 290 different species of bird. Many migratory songbirds such as the Painted bunting (Passerina ciris) and Prothonotary warbler (Protonotaria citrea) call the basin home in the spring and summer. Threatened species like the Wood stork (Mycteria americana) also reside along the Combahee and Edisto Rivers. Wood stork, Bald eagles (Haliaeetus leucocephalus), and Least terns (Sternula antillarum) are three threatened or endangered species that use the ACE Basin as a breeding habitat. Common white tail deer, Gray foxes, River otters, and other animals can be found in the area throughout the year. Our specific area of interest is a 40 ha subset of a coastal tidal marsh situated between the Harbor River to the west and the island rental homes on the narrow strip of island to the east and north (Figure 1). The area is dominated by Spartina alterniflora, though there are occasionally small patches of Perennial glasswort (Salicornia virginica). The overall marsh system is homogenous and contains almost no mudflat. Wrack is commonly found on the beaches and in the estuaries of the region.
Hurricane Isaias (formed 30 July, dissipated 5 August) brought tropical storm force winds, rain, and slight flooding to South Carolina in 2020. Isaias had strengthened to a category 1 storm by the time it passed within approximately 100 km of the area of interest. Approximately 36.6 mm of rain fell in this area within a few hours on Harbor Island and the maximum gusts recorded were around 41 knots or about 76 kph. Low-lying land on Harbor Island was slightly inundated by a 0.61 m storm surge.
2.2. sUAS Data Collection
The collection of sUAS image data began on 1 August 2020 and continued monthly until 21 June 2021. The flight dates including flight times, weather, and the time of low tide for each flight are included in Table 1. Each flight was flown by an off-the-shelf DJI Mavic 2 Pro rotary wing quadcopter equipped with a built-in RGB camera. The small 322 × 242 × 84 mm, 907 g drone had a maximum flight time of 31 min, though in an area with coastal winds, the flight time was modestly reduced. The 20-megapixel true-color camera had a 1” CMOS sensor with a 77° field of view. Each flight was conducted from the exact same autonomous flight plan, resulting in 501 images per flight with near-coincident image centers. Autonomous flight plans were generated using a polygon area-of-interest (AOI) in the DJI Go software built into the Mavic 2 Pro’s smart controller. The same take-off and landing locations were also used for each flight, along with the general northwest to southwest direction of the flight lines across the study area.
The flight altitude of 100 m above ground level (agl) and front and side overlap of 80% resulted in a ground sampling distance of approximately 2.5 cm. The total flight time for each mission varied due to environmental conditions such as wind and relative humidity. However, all flights took between 46 and 51 min, or two full batteries, with the sUAS moving at 4 m/s to complete. Collecting remotely sensed data during low tide is optimal for wrack identification in a wetland environment. At low tide, the wrack is resting on or between the standing vegetation of this marsh area of interest, and therefore is in an ideal position to capture its location. Consequently, all data collection flights were conducted within two hours of low tide.
Ground control points (GCPs) are an important part of ensuring accurate georegistration of sUAS derived point clouds and orthomosaics. A total of nine GCPs were collected around the perimeter of the study area in accessible locations. Locating the ground control points in the marsh was logistically impossible because of our aim to completely restrict our own anthropogenic influences on the marsh as well as the difficulty in accessing the center of the marsh area. According to Santos Santana et al. (2021) [32], using GCPs around the perimeter of a study area can perform well in georeferencing if more than six are placed in visible locations. Nine permanent locations were chosen surrounding the marsh area such as tennis court corners and utility hole coverings in roads close to the area. The GCPs were collected using an Emlid Reach RS2 GNSS RTK base station placed over a NOAA survey marker and a rover pole with a cell phone (Figure 2). The cell phone served as the recording device for the ground control point locations determined by the base–rover combination. The RMSE for the collected points were very small; the X coordinate RMSE was 1.98 cm, the Y coordinate was 2.32, and the Z coordinate was 1.94. GCP data points were exported from the Emlid Reach RS2 application in both a shapefile and csv format for use as input into the drone image processing software.
2.3. Processing and Analysis
2.3.1. sUAS Data Processing
Following each flight, all 501 photos were imported into Pix4DMapper 4.6.4, where they were processed using a structure from motion (SfM) algorithm into a single orthomosaic over the whole study area. The collected GCPs were imported into the software prior to processing. Each GCP was identified and marked in at least six different images to aid the georegistration and data processing required for accurate orthomosaics. Other parameters within Pix4D remained as the default for each set of images during processing. The ground sampling distance of sUAS images for each flight was approximately 2.5 cm, though during Pix4DMapper processing, the pixel size was resampled to 2.5 cm for all orthoimages (5 × 5 averaging) to ensure accurate comparisons.
The DJI Mavic 2 Pro camera was built with a rolling shutter that rapidly scans across a scene while taking the image, as opposed to a global shutter that records a single image at one moment in time. The rolling shutter can introduce distortions into the images collected with this type of sensor. The processing software Pix4DMapper uses a model to compensate for the rolling shutter distortion by taking into account the movement of the camera positions. According to Pix4D, the different camera positions are approximated by applying a linear interpolation between the two camera shots at the start and finish of the image readout [33]. The model has shown good results with rolling shutter cameras on drone gimbal mounts to ensure that the sensor is pointed constantly in the nadir (90°) position [34]. This model was applied during image processing to compensate for the rolling shutter during this study’s flights.
2.3.2. Wrack Identification and Digitizing
Given the high-resolution orthoimagery created from Pix4DMapper (2.5 cm), the wrack could be recognized and digitally recreated in a GIS by using elements of image interpretation [35]. Expert visual interpreters identified wrack using various visual interpretation elements such as tone, color, and contrast (Figure 3). The golden brown or white colored wrack was easily distinguishable from healthy green vegetation but was more difficult to distinguish from the brown dying or senesced vegetation beneath it. Different tones, however, provided enough distinction between the two for confident analysis. Furthermore, wrack mats are horizontal in nature and contrast well against the vertically erect live Spartina alterniflora. The more complex visual interpretation elements of texture and pattern were equally important. Plant detritus clump together in distinct tightly clustered wrack mats when deposited by the tide or waves. The bumpy texture of wrack mats, evident in Figure 3, make it easily discernible from the surrounding vegetation. Wrack patterns are typically quite similar over time, and wrack mats are often found along tidal creeks [24]. This information was used when identifying wrack locations. All wrack locations were digitized into a new feature class using ArcGIS Pro version 2.8.1.
Visual analysis and interpretation were the primary methods for identifying wrack in this study because of the compromised spectral sun glint that could not be corrected with the given equipment. Although missions were flown at low tide, sun glint was present throughout much of the imagery. Sun glint in the imagery was caused by higher sun angles at our data collection time, the direction of the sensor on the sUAS, and the small amount of water still present on the ground surface of the marsh. The magnitude of the sun glint lines found in Figure 1 was the same for all orthomosaics. Despite much effort to avoid standing water during image collection, the lowest tides available during ideal lighting conditions still often left a small amount of water on the surface of the marsh. Sun glint was present in each image captured during the sUAS flight, and when the images were mosaicked together, the sun glint became a pattern throughout the mosaic (Figure 1). This pattern resulted in automatic feature extraction algorithm errors because of the similarities in the spectral signature between the wrack and sun glint. The similarity between the wrack pixels and sun glint pixels resulted in class confusion in the machine learning algorithms and supervised classifications. Therefore, visual identification was adopted as the primary method of analysis.
2.3.3. Data Visualization and Spatial Pattern Identification
The digitized wrack polygons were processed using ArcGIS Pro 2.8.1 by first converting the vector representation of the wrack polygons into a raster data format. The raster was generated with a 2.5 cm cell size to mimic the sUAS orthomosaicked image. Wrack locations were coded using a ‘1’ for wrack present and ‘0’ for wrack absence. We then used the ArcGIS Pro 2.8.1 raster calculator to add each raster together, showing changes over time. The final raster was used to make a heat map (i.e., greater frequencies of consistent wrack mats) of where wrack had occurred the most throughout the marsh system of interest. Spatial patterns in wrack presence (i.e., where wrack was consistently found and in relation to what physical characteristics of the marsh) were visually identified using the maps produced in the steps above. Various statistics and other metrics were calculated for the digitized wrack feature classes to provide a better understanding of the wrack characteristics. The metrics used to describe the wrack characteristics in the area of interest include the number of wrack polygons, area of wrack digitized in hectares, average size of wrack mats in meters squared, and the number and percent of wrack mats within 10, 15, and 20 m of a water body. The buffers were chosen based on wrack identification experience and were not specific to this region.
Visual identification of possible impacts of wrack deposition and persistence were completed using the very high-resolution aerial imagery captured by the sUAS. The areas experiencing vegetation disturbance caused by wrack deposition were investigated systematically based on the previously created map of wrack occurrence. First, the areas where wrack was most commonly found during the year-long study were identified and scrutinized. During our examination, we looked at the high-traffic areas for wrack across each of the 12 mission orthomosaics. From the orthomosaics, we identified areas where mudflat was present after the wrack was eventually removed as well as vegetation that showed signs of change.
Visual identification of possible impacts of wrack deposition and persistence were completed using the very high-resolution aerial imagery captured by the sUAS. The areas experiencing vegetation disturbance caused by wrack deposition were investigated systematically based on the heat map of wrack occurrence. First, the areas most prone to wrack throughout the year-long study were extracted and visually examined. These areas were shown to have wrack during each mission throughout the year. We identified areas where mudflat was present after the wrack was eventually removed as well as areas that visually experienced a change in vegetation. Next, we investigated the next tier of wrack persistence, or areas that were typically affected by wrack for four to nine months, using the same visible examination technique described above.
Finally, we identified king tide events and strong storm events that may impact wrack presence and persistence to compare with the wrack distribution metrics. “King tide” is a colloquialism for an exceptionally high tide that usually occurs in the spring in South Carolina, when the gravitational pulls of the Sun and Moon are aligned [36]. These tides can also occur year-long. Strong storms occurred along the coast from October 2020 through March 2021, so this was also included in our temporal analysis [37].
The visual cues for unhealthy vegetation on the orthoimage included a change in color over time (that is different from natural plant senescence in the winter) and general plant structure. For the purposes of this study, unhealthy vegetation was vegetation that is progressing toward death and will eventually leave a mudflat behind. For example, if the vegetation was significantly impacted by wrack deposition, it would fail to rebound and stand erect again. Certainly, a lack of vegetation or exposed mudflat is a visual cue that wrack has affected a particular vegetated area in the marsh. For this study, areas where vegetation was missing were compared with previous aerial images of the area flown for the Beaufort County Mapping and Applications Department. These images are captured during leaf-off conditions, in February or early March each year, for tax and storm water utility purposes. The spatial resolution of these images has improved in recent years to about 15–20 cm, which is enough to identify larger groupings of wrack, if the image was captured during low tide. If similar vegetation gaps or mudflats existed in years prior, we assumed the wrack mats had no impact.
In order to make assessments on vegetation health from a visual perspective, we also assumed a homogenous distribution of nutrients across the marsh system and no disturbances to the marsh system during the duration of the study. There were no known major anthropogenic disturbances during the course of this study. Based on our knowledge of the marsh system and these assumptions, we believe that any visual changes to vegetation health were a result of wrack deposition.
3. Results
Wrack Location and Changes
Descriptive statistics were used to provide a summary of wrack characteristics for guiding the visual analysis we undertook. The average size of all wrack mats digitized during the year-long study was 13.77 m2. The largest wrack mat grouping found during any mission was 520.57 m2, and the smallest wrack mat was 0.07 m2 (Table 2). The skewness of the wrack size data was found to be 7.10, indicating that the distribution was right skewed; there were significantly more smaller wrack mats than larger clusters.
The temporal variability of both the number of wrack mats and the area covered by the wrack mats were assessed as part of our statistical analysis (Figure 4). The first few missions in August 2020 revealed the largest numbers of the study with 324, 367, and 290 wrack polygons identified. The fall and winter months, particularly December (93 wrack mats found), showed a steady decrease in the amount of wrack throughout the marsh. From there, however, a small but steady increase in wrack presence was determined from the aerial imagery going into the spring and summer months of 2021. The June 2021 mission reported an interesting find of an increasing number of digitized polygons, but a sudden decrease in total wrack area. Figure 4 also shows a clear increase in wrack mats following the visit of Hurricane Isaias to the region on 3 August, though king tides and other storms may not have had much of an impact on the amount or size of the wrack found.
Most wrack was found on the western side of the study area near the waterbodies that transport the wrack into the marsh system, and few mats found their way deeper into the marsh. Wrack was most often found near the multiple tidal creeks flowing in the marsh system. About 55% of all digitized wrack mats were closer than 10 m to a marsh creek (Figure 5). As we took more area around the tidal creek into consideration, the percentage of wrack within the area also increased: 64% of wrack was found within 15 m of the water bodies, and 71% of wrack was found within 20 m. The wrack mats that were found closer to the marsh creeks were, on average, more compact than those found further away from the creeks by one square meter.
From Figure 5, we identified where wrack could be consistently found throughout the year-long study. Once wrack was deposited, it typically did not last longer than 3–6 months in one spot. The wrack was most likely moved by smaller rainstorms or king tides before six months. Wrack persisted beyond six months in only a few locations that were insulated from other factors influencing the movement of the storm.
Hurricane Isaias had a significant influence on wrack location and migration throughout the area of interest. Forty-three new wrack mats were identified and digitized following the impact of the hurricane. Furthermore, the storm caused wrack to be deposited and blown further into the center of our study area than we saw at any other time (Figure 6). The percentage of wrack mats within 10 m of water bodies decreased following the hurricane impact by 10%, even with the increase in total wrack mats present. Even with fewer tidal creeks to aid the journey, we found wrack deposited or blown all the way to the urban-adjacent marsh of the study area (red circle). Newly deposited wrack mats in the northwestern region of our area of interest were deposited in long continuous lines, showing the extent to which water rested during the storm or shortly after the storm to deposit the detritus.
4. Discussion
In this study, we proposed the use of a sUAS for mapping and monitoring wrack to effectively enhance our understanding of wrack spatial distributions, patterns, and movement in a marsh system in Harbor Island, South Carolina for a year following a hurricane event. This study was designed to also benefit coastal managers and scientists in their efforts to monitor wrack impact on any tidal salt marshes in their stewardship.
The first research question we sought to answer pertained to how wrack was distributed spatially throughout the marsh and how that distribution changed over time. Through high resolution sUAS mapping, it was discovered that the distribution of wrack mats was clustered and spatially linked to flowing water rather than randomly distributed throughout the marsh. Wrack distribution was also fairly consistent month to month outside of the hurricane’s impact. The most consistent region for wrack deposition and persistence was to the northwest of the area of interest along the Harbor River. Wrack mats did not make it to the center of the study area very often. Tidal channels only occasionally deposited wrack along their shorelines deep into the marsh. The high percentage of wrack mats found within 10 m, 15 m, and 20 m of water reflects the wrack’s spatial dependence on water and water movement, just as Fischer et al. (2000) [38] and Alexander (2008) [39] suggested. By capturing a regular, near monthly dataset, we were able to discern how close the wrack is to water changes from month to month based on different circumstances.
Several weather-related events during the span of the research period provided movement to the wrack system. These included strong storms in October 2020 and March 2021 as well as normal tide cycles and king tide events. Capturing monthly imagery datasets provided context for how much king tides can influence wrack distribution in a marsh. For the months where king tides were present, the percentage of wrack mats within 10 m of water dropped 10–15 percent from where it had been the several months before. Strong storms starting in October 2020 and continuing through February 2021 also may have caused wrack to be redistributed or even flushed out of the marsh system [37]. These events may have contributed to the decline in wrack presence during the winter months (Figure 4).
The second research objective was to identify the impact Hurricane Isaias had on wrack distribution and how long the impact could be felt in the marsh system. Hurricane Isaias had a moderate impact on the amount and distribution of wrack in the marsh system. Three days following the passing of Hurricane Isaias, the number of wrack mats and total wrack area increased throughout the tidal salt marsh area of interest (Figure 7). The high-water levels, storm surge, and strong winds from Hurricane Isaias caused wrack mats to enter into regions of the study area where wrack was not found before the storm passed, nor after for the rest of the study. As Peng et al. (2022) [40] observed from Hurricane Harvey, a strong storm can move wrack deeper into a wetland than otherwise found during other normal conditions. The largest clusters of wrack were found on the western edge of the study area, close to largest nearby water body—the Harbor River. We were able to ascertain how long particular clusters of wrack were in certain regions of the study area from the orthomosaics generated in Pix4DMapper. The storm-affected wrack was found to have moved from its spot or dissipated fairly quickly. It took only three months for the wrack landscape in the marsh to look drastically different. While three months is a short time, there could still have been a negative impact on the vegetation [25]. In the experiment by Stalter et al. (2006) [25], they found that vegetation struggles to recover after only two months of wrack burial. However, more severe negative impacts would necessitate a longer stay.
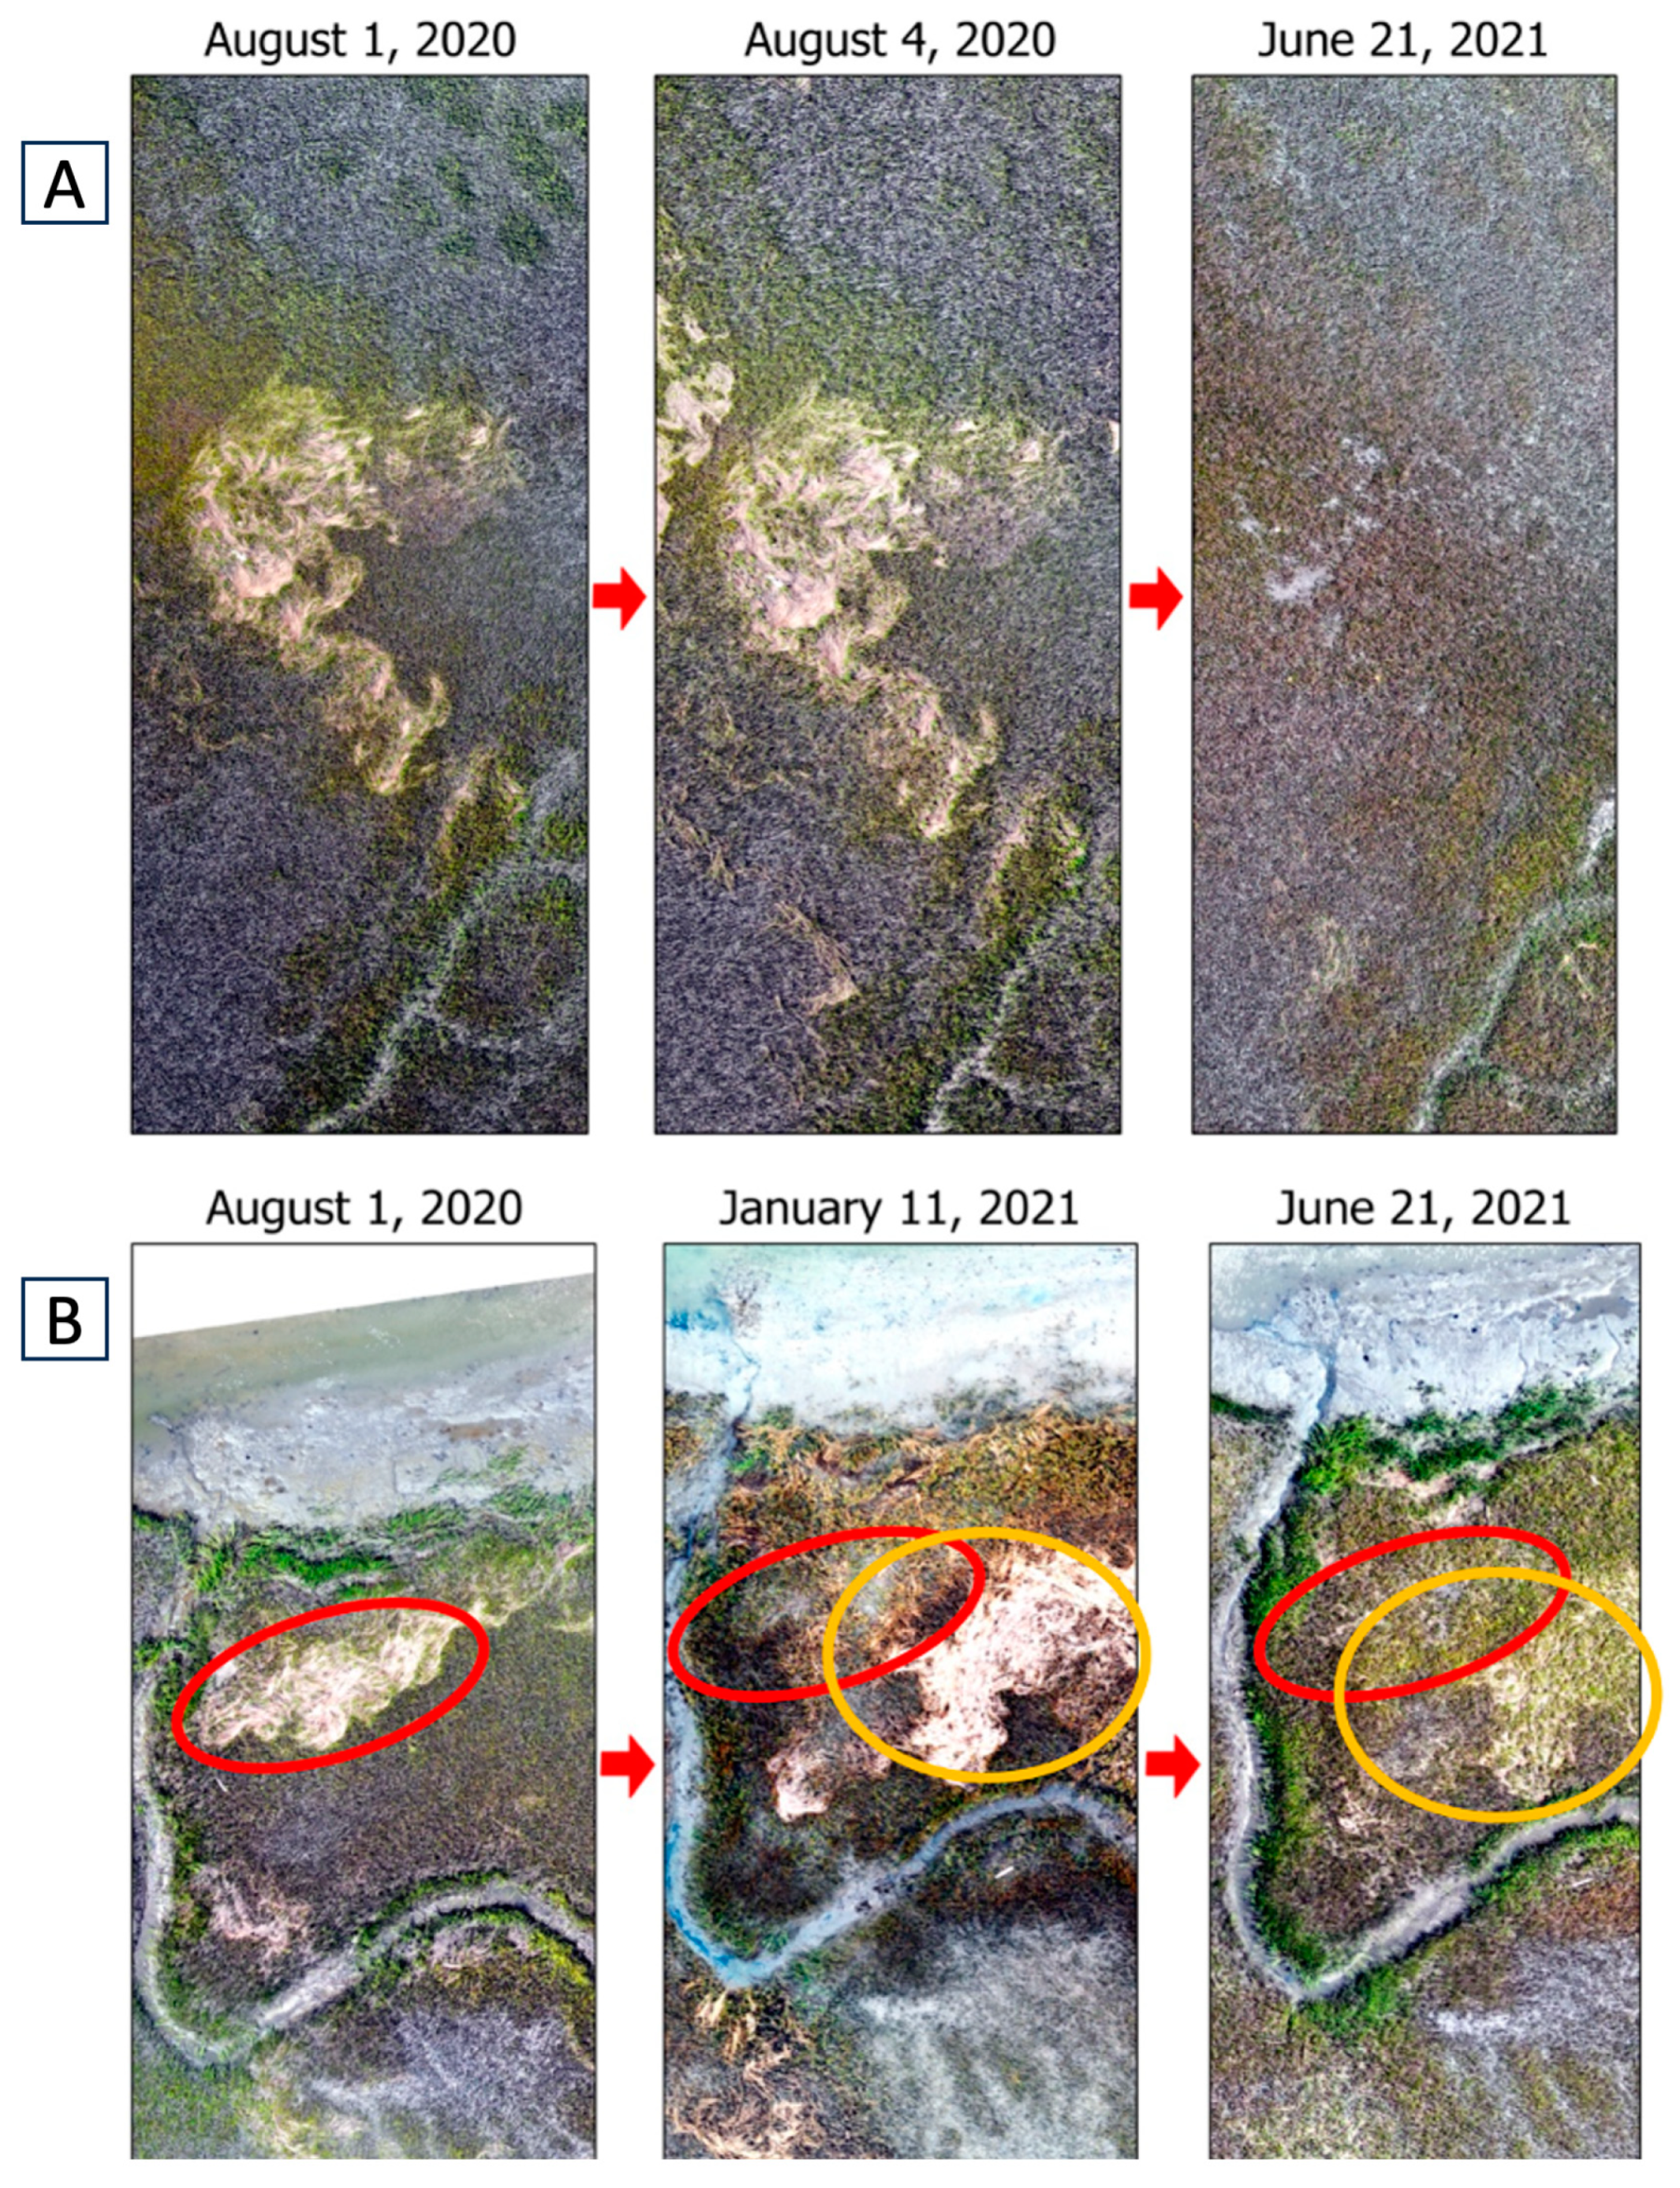
The third and final research objective was to determine what insights the high spatial and adjustable temporal resolution of sUAS technology could provide with regard to positive and negative wrack impacts on marsh vegetation. It is well-established that coastal marshes are impacted in positive and negative ways by wrack deposition and persistence [23,27,28]. It is apparent from this experiment that the high spatial and adaptable temporal resolutions of sUAS are ideal for wrack mapping and identification. Several visually discerned examples of wrack distribution and movement suggest that if wrack is present long enough, it can impact the health of the marsh vegetation. Figure 7A,B represents identifiable wrack patterns and wrack pattern changes that are made possible by the high resolution sUAS imagery. Figure 7A shows a small region in the far west of the 40 ha study area that received a deposit of wrack from the storm surge and winds present due to Hurricane Isaias. Wrack was found in the same locations following the storm (August through October). By the end of the study, the area showed no signs of wrack in its immediate vicinity, but the areas where dense wrack mats persisted resulted in the loss of small amounts of vegetation underneath the mats, and created small mudflats in the June 2021 imagery.
Figure 7B reveals a small region on the northwestern edge of the study area where two wrack clusters moved over time. Wrack persisted at first, but then fell beneath the vegetation canopy. The wrack in the red circles persisted so long; despite the wrack falling beneath the vegetation and disappearing, there was still some vegetation thinning that persisted by the following June. Where the orange circle and red circles met, there was a sparseness of vegetation that could be attributed to wrack deposition over a long period of time. The area within the orange circle was not covered in August, but found itself underneath a substantial amount of wrack in January. As of June, however, there had not been a king tide event or storm event large enough to move the wrack away. Instead of moving laterally, it moved vertically to beneath the canopy where it now has the opportunity to reinforce the marsh system as a whole through the food cycle [41].
The evidence visually discerned in Figure 7A,B supports the assertions made by Bertness and Ellison (1987) [42] and Valiela and Reitsma (1995) [23], where they found that even short-term disturbance by wrack mats can cause plant mortality. Wrack disturbances have also been shown to negatively impact marsh systems by providing footholds for invasive species [27,28,43]. While this has been a concern of coastal managers for many years, there were no indications of invasive species growing in the rather homogenous salt marsh on Harbor Island during the study period. This may be due to the documented resilience of Spartina alterniflora to wrack burial relative to most other salt marsh grasses [42].
Figure 7B shows a large, clustered wrack mat that once covered vegetation, but over time fell in between the vegetation stalks to the mud below. Once the wrack is beneath the canopy, it can no longer be considered dangerous. It can now provide a positive impact by decomposing and providing necessary nutrients for other organisms in the complex salt marsh food web. While our study was unable to quantify or visualize the positive impacts relating to the food web and overall decomposition of the dead plant material, the initial findings relate well to the field studies conducted by Montemayor et al. (2019) [44] and Negrin et al. (2012) [41]. In each of those respective studies, they established the opportunity for wrack to benefit the overall system, despite the time required for these to be had. Even simple identification of wrack falling beneath the canopy in our study suggests a positive impact because the matted down wrack can now serve as a home to several species of aquatic creatures [40,45]. It has even been suggested by one researcher that the warm climate found on the South Carolina coast can enhance the decomposition of wrack detritus to benefit the entire salt marsh [25].
Several challenges were encountered while addressing the three research objectives. Sun glint was discovered as bright lines throughout some of the orthomosaics after processing in Pix4D, even though the glint was hardly noticeable in the individual images. While still able to recognize the wrack locations visually, we were not able to compute vegetation indices to quantitatively assess the health of the vegetation. In order to overcome the sun glint problem, radiometric calibration targets can be included, or flights could be conducted at lower Sun angles that not only limit shadows, but also remove the glint [14,46,47]. Vegetation indices are highly correlated to vegetation biomass, which is considered as a good indicator of vegetation health. Near infrared imagery-based vegetation indices and red, green, and blue (RGB)-based vegetation indices have been used to model marsh vegetation biomass from an sUAS [14,48,49]. Specifically, the Triangular Greenness Index (TGI) and Excess Green Index (ExG) are based on RGB values from digital cameras on sUASs and are strongly related to chlorophyll and nitrogen content as well as fractional vegetation cover [50,51,52]. Each of these metrics have useful applications for connecting sUAS imagery to the health of vegetation and will be explored in future studies.
Longer battery life and less strict line-of-sight FAA regulations are necessary if larger and more robust studies are to be conducted. When two or more batteries are needed to cover a study area in flight, drastic changes in lighting or weather conditions can occur while the batteries are changed. Developments in sUAS batteries have already improved the flight time by 10–15 min since this study was conducted, which may limit the need for stops during flights. However, acquiring data across larger areas can be problematic while being required to maintain a visual line of sight through the USA’s FAA part 107 regulations. This requirement dictates that the remote pilot in command and visual observers maintain a constant line of sight with the sUAS during the entirety of the flight. This can be a logistical challenge when flying areas larger than 40 ha.
Future long-term research is needed to determine the optimal multispectral sUAS flight parameters for improving the mapping of wrack movement patterns and vegetation. It is imperative that data are captured at ideal Sun angles with radiometric correction with targets for the creation of both RGB-based vegetation indices [47,48,50] and multispectral vegetation indices [14,53,54] to monitor health. These, along with digital elevation models (DEMs), can be used to perform spectral and object-based analyses for identifying wrack and other related phenomenon (e.g., mudflats). The 3D SfM technology available for drone image processing could possibly be used to quantify wrack volume from point clouds. DEMs from SfM-derived point clouds can also be employed to discover why wrack stays in certain regions of a marsh (i.e., topography) and how it can be remedied.
5. Conclusions
This study demonstrated the utility of using sUAS remote sensing as a coastal manager for monitoring wrack accumulation and movement in coastal wetlands. From research conducted in this study, a gap in the literature was addressed by identifying how long wrack can remain in a tidal marsh following a hurricane. We found that the wrack presence increased after a hurricane event and was present for the next three months in largely the same locations. The three-month time period was not long enough for the wrack to have any significant lasting impacts on the vegetation beneath it. The accumulation and expansion of some wrack mats over a short time caused these mats to grow larger and spread out over the interior of the marsh study area. While the discussion of the potential impacts of wrack on marsh systems has not been put to rest yet by our qualitative observations, we found that sUASs can provide quality imagery to visually identify various impacts. We demonstrated that when coupled with targeted mission planning and the acknowledgement of several limitations, sUAS remote sensing provides a powerful on-demand tool for monitoring coastal environment health. Research that incorporates more capable sensors on sUAS and other vegetation health metrics will be able to add significantly to this field of research in the future. Finally, this study serves as a bridge from coarser resolution satellite and high-altitude aerial remote sensing surveys of coastal marshes and wrack to the new age that includes personal remote sensing for coastal tidal marsh management using sUASs.
Author Contributions
Conceptualization, G.R.M. and C.W.; Methodology, G.R.M.; Software, G.R.M.; Formal analysis, G.R.M.; Investigation, G.R.M. and D.R.M.; Resources, G.R.M.; Data curation, G.R.M. and D.R.M.; Writing—original draft preparation, G.R.M.; Writing—review and editing, G.R.M., D.R.M., S.R.S., M.E.H. and C.W.; Visualization, G.R.M.; Supervision, G.R.M.; Project administration, G.R.M. All authors have read and agreed to the published version of the manuscript.
Funding
This research received no external funding.
Data Availability Statement
The data presented in this study are available on request from the corresponding author. The data are not publicly available due to ongoing research projects using said data.
Acknowledgments
Special thanks to the Beaufort County Mapping and Applications Department for their assistance with the project.
Conflicts of Interest
The authors declare no conflict of interest.
References
- Hardin, P.J.; Ryan, R.J. Small-scale unmanned aerial vehicles in environmental remote sensing: Challenges and opportunities. GISci. Remote Sens. 2011, 48, 99–111. [Google Scholar] [CrossRef]
- Hugenholtz, C.H.; Moorman, B.J.; Riddell, K.; Whitehead, K. Small unmanned aircraft systems for Remote Sensing and earth science research. Eos Trans. Am. Geophys. Union 2012, 93, 236. [Google Scholar] [CrossRef]
- Colomina, I.; Pere, M. Unmanned aerial systems for photogrammetry and Remote Sensing: A Review. ISPRS J. Photogramm. Remote Sens. 2014, 92, 79–97. [Google Scholar] [CrossRef]
- Terwilliger, B.; Vincenzi, D.; Ison, D. Unmanned aerial systems: Collaborative Innovation to support emergency response. J. Unmanned Veh. Syst. 2015, 3, 31–34. [Google Scholar] [CrossRef]
- Bhardwaj, A.; Sam, L.; Martín-Torres, F.J.; Kumar, R. UAVs as remote sensing platform in glaciology: Present applications and future prospects. Remote Sens. Environ. 2016, 175, 196–204. [Google Scholar] [CrossRef]
- Hugenholtz, C.H.; Whitehead, K.; Brown, O.W.; Barchyn, T.E.; Moorman, B.J.; LeClair, A.; Riddel, L.; Hamilton, T. Geomorphological mapping with a small unmanned aircraft system (SUAS): Feature Detection and Accuracy Assessment of a photogrammetrically-derived digital terrain model. Geomorphology 2013, 194, 16–24. [Google Scholar] [CrossRef]
- Klemas, V.V. Coastal and environmental remote sensing from Unmanned Aerial Vehicles: An overview. J. Coast. Res. 2015, 315, 1260–1267. [Google Scholar] [CrossRef]
- Koh, L.P.; Wich, S.A. Dawn of Drone Ecology: Low-cost autonomous aerial vehicles for conservation. Trop. Conserv. Sci. 2012, 5, 121–132. [Google Scholar] [CrossRef]
- Michez, A.; Broset, S.; Lejeune, P. Ears in the sky: Potential of drones for the bioacoustic monitoring of birds and bats. Drones 2021, 5, 9. [Google Scholar] [CrossRef]
- Brunton, E.A.; Leon, J.X.; Burnett, S.E. Evaluating the efficacy and optimal deployment of thermal infrared and true-colour imaging when using drones for Monitoring Kangaroos. Drones 2020, 4, 20. [Google Scholar] [CrossRef]
- Frixione, M.G.; García MD, J.G.; Gauger, M.F. Drone imaging of Elasmobranchs: Whale Sharks and golden cownose rays co-occurrence in a zooplankton hot-spot in southwestern sea of cortez. Food Webs 2020, 24, e00155. [Google Scholar] [CrossRef]
- Landeo-Yauri, S.S.; Ramos, E.A.; Castelblanco-Martínez, D.N.; Niño-Torres, C.A.; Searle, L. Using small drones to photo-identify Antillean manatees: A novel method for monitoring an endangered marine mammal in the Caribbean Sea. Endanger. Species Res. 2020, 41, 79–90. [Google Scholar] [CrossRef]
- Farris, A.S.; Defne, Z.; Ganju, N.K. Identifying salt marsh shorelines from remotely sensed elevation data and imagery. Remote Sens. 2019, 11, 1795. [Google Scholar] [CrossRef]
- Doughty, C.L.; Cavanaugh, K.C. Mapping coastal wetland biomass from high resolution unmanned aerial vehicle (UAV) imagery. Remote Sens. 2019, 11, 540. [Google Scholar] [CrossRef]
- Mehvar, S.; Filatova, T.; Dastgheib, A.; De Ruyter van Steveninck, E.; Ranasinghe, R. Quantifying economic value of Coastal Ecosystem Services: A Review. J. Mar. Sci. Eng. 2018, 6, 5. [Google Scholar] [CrossRef]
- Peterson, G.W.; Turner, R.E. The value of Salt Marsh Edge vs interior as a habitat for fish and decapod crustaceans in a louisiana tidal marsh. Estuaries 1994, 17, 235. [Google Scholar] [CrossRef]
- Loomis, M.J.; Craft, C.B. Carbon sequestration and nutrient (nitrogen, phosphorus) accumulation in river-dominated tidal marshes, Georgia, USA. Soil Sci. Soc. Am. J. 2010, 74, 1028–1036. [Google Scholar] [CrossRef]
- Ballard, J.; Pezda, J.; Spencer, D.; Plantinga, A. An Economic Valuation of Southern California Coastal Wetlands. Master’s Thesis, University of California, Santa Barbara, CA, USA, 2016. [Google Scholar]
- Narayan, S.; Beck, M.W.; Wilson, P.; Thomas, C.J.; Guerrero, A.; Shepard, C.C.; Reguero, B.G.; Franco, G.; Carter Ingram, J.; Trespalacios, D. The value of coastal wetlands for flood damage reduction in the Northeastern USA. Sci. Rep. 2017, 7, 9463. [Google Scholar] [CrossRef] [PubMed]
- Morganello, K.; Rose, L.L. Life Along the Salt Marsh: Protecting Tidal Creeks with Vegetative Buffers. 2013. Available online: https://hgic.clemson.edu/factsheet/life-along-the-salt-marsh-protecting-tidal-creeks-with-vegetative-buffers/ (accessed on 2 February 2021).
- Willis, D.B.; Straka, T.J. The economic contribution of natural resources to South Carolina’s economy. Bull. FW 13 2016, 13, 1–24. [Google Scholar]
- Pennings, S.C.; Richards, C.L. Effects of wrack burial in salt-stressed habitats: Batis maritima in a southwest Atlantic Salt Marsh. Ecography 1998, 21, 630–638. [Google Scholar] [CrossRef]
- Valiela, I.; Rietsma, C.S. Disturbance of salt marsh vegetation by wrack mats in Great Sippewissett Marsh. Oecologia 1995, 102, 106–112. [Google Scholar] [CrossRef] [PubMed]
- Reidenbaugh, T.G.; Banta, W.C. Origins and effects of Spartina Wrack in a virginia salt marsh. Gulf Res. Rep. 1980, 6, 393–401. [Google Scholar] [CrossRef]
- Stalter, R.; Jung, A.; Starosta, A.; Baden, J.; Byer, M.D. Effect of wrack accumulation on salt marsh vegetation, Baruch Institute, Georgetown County, South Carolina. WIT Trans. Ecol. Environ. 2006, 88, 305–313. [Google Scholar] [CrossRef]
- Viehman, S.; Vander Pluym, J.L.; Schellinger, J. Characterization of marine debris in North Carolina Salt Marshes. Mar. Pollut. Bull. 2011, 62, 2771–2779. [Google Scholar] [CrossRef] [PubMed]
- Tolley, P.M.; Christian, R.R. Effects of increased inundation and wrack deposition on a high salt marsh plant community. Estuaries 1999, 22, 944. [Google Scholar] [CrossRef]
- Minchinton, T.E. Disturbance by wrack facilitates spread of Phragmites australis in a Coastal Marsh. J. Exp. Mar. Biol. Ecol. 2002, 281, 89–107. [Google Scholar] [CrossRef]
- SCDNR—Aquatic Nuisance Species Program Phragmites. Phragmites in South Carolina. 2010. Available online: https://www.dnr.sc.gov/water/envaff/aquatic/phragmites.html (accessed on 19 August 2022).
- Doyle, T. Effect of Hurricane Wrack Deposition on Coastal Marsh Surface Elevation Change; U.S. Geological Survey: Reston, VA, USA, 2016.
- Platt, W.J.; Joseph, D.; Ellair, D.P. Hurricane Wrack generates landscape-level heterogeneity in coastal Pine Savanna. Ecography 2014, 38, 63–73. [Google Scholar] [CrossRef]
- Santos Santana, L.; Araújo E Silva Ferraz, G.; Bedin Marin, D.; Dienevam Souza Barbosa, B.; Mendes Dos Santos, L.; Ferreira Ponciano Ferraz, P.; Conti, L.; Camiciottoli, C.; Rossi, G. Influence of flight altitude and control points in the georeferencing of images obtained by Unmanned Aerial Vehicle. Eur. J. Remote Sens. 2021, 54, 59–71. [Google Scholar] [CrossRef]
- Pix4D. Improved Accuracy for Rolling Shutter Cameras. Pix4D. 2016. Available online: https://www.pix4d.com/blog/rolling-shutter-correction/ (accessed on 3 September 2022).
- Topodrone. Correction of the Rolling Shutter Distortion and Processing Survey Data from Topodrone DJI Mavic 2 pro L1/L2 RTK/PPK. 2020. Available online: https://topodrone.com/blog/917/ (accessed on 3 September 2022).
- Jensen, J.R. Drone Aerial Photography and Videography: Data Collection and Image Interpretation (Kindle ed.); Amazon Digital Services LLC: Seattle, WA, USA, 2018. [Google Scholar]
- Román-Rivera, M.A.; Ellis, J.T. The king tide conundrum. J. Coast. Res. 2018, 34, 769–771. [Google Scholar] [CrossRef]
- SC Climate Office. 2020 South Carolina Year in Review. 2021. Available online: https://www.dnr.sc.gov/climate/sco/ClimateData/yearly/cli_sc2020review.pdf (accessed on 2 September 2022).
- Fischer, J.M.; Reed-Andersen, T.; Klug, J.L.; Chalmers, A.G. Spatial pattern of localized disturbance along a southeastern salt marsh tidal creek. Estuaries 2000, 23, 565. [Google Scholar] [CrossRef]
- Alexander, C. Wrack Assessment Using Aerial Photography in Coastal Georgia. Final Report to the Georgia Coastal Zone Management Program, Department of Natural Resources, Coastal Resources Division, Brunswick, GA. 2008. Available online: http://tomscreek.info/Wrack%20Assessment%20Using%20Aerial%20Photography%202008.pdf (accessed on 3 September 2022).
- Peng, D.; Montelongo, D.C.; Wu, L.; Armitage, A.R.; Kominoski, J.S.; Pennings, S.C. A hurricane alters the relationship between mangrove cover and marine subsidies. Ecology 2022, 103, e3662. [Google Scholar] [CrossRef] [PubMed]
- Negrin, V.L.; Trilla, G.G.; Kandus, P.; Marcovecchio, J.E. Decomposition and nutrient dynamics in a Spartina alterniflora marsh of the Bahia Blanca Estuary, Argentina. Braz. J. Oceanogr. 2012, 60, 259–263. [Google Scholar] [CrossRef]
- Bertness, M.D.; Ellison, A.M. Determinants of pattern in a new england salt marsh plant community. Ecol. Monogr. 1987, 57, 129–147. [Google Scholar] [CrossRef]
- Higinbotham, C.B.; Alber, M.; Chalmers, A.G. Analysis of tidal marsh vegetation patterns in two Georgia estuaries using aerial photography and GIS. Estuaries 2004, 27, 670–683. [Google Scholar] [CrossRef]
- Montemayor, D.I.; Canepuccia, A.D.; Farina, J.; Addino, M.; Valiñas, M.; Iribarne, O.O. Effects of Spartina wrack on surface-active arthropod assemblage under different environmental contexts in southwest Atlantic Salt Marshes. Estuaries Coasts 2019, 42, 1104–1126. [Google Scholar] [CrossRef]
- Taylor, P.H. Do Salt Marshes Serve as Fish Nurseries? Gulf of Maine Times. 2005. Available online: http://www.gulfofmaine.org/times/summer2005/scienceinsights.html (accessed on 19 August 2022).
- Wang, C. At-sensor radiometric correction of a multispectral camera (rededge) for SUAS vegetation mapping. Sensors 2021, 21, 8224. [Google Scholar] [CrossRef]
- Johnson, B.J.; Manby, R.; Devine, G.J. Performance of an aerially applied liquid bacillus thuringiensis var. Israelensis formulation (strainAM65-52) against mosquitoes in mixed saltmarsh–mangrove systems and fine-scale mapping of Mangrove Canopy cover using affordable drone-based imagery. Pest Manag. Sci. 2020, 76, 3822–3831. [Google Scholar] [CrossRef]
- Zhou, Z.; Yang, Y.; Chen, B. Estimating Spartina alterniflora fractional vegetation cover and aboveground biomass in a coastal wetland using Spot6 satellite and UAV Data. Aquat. Bot. 2018, 144, 38–45. [Google Scholar] [CrossRef]
- Morgan, G.R.; Wang, C.; Morris, J.T. RGB indices and canopy height modelling for mapping tidal marsh biomass from a small unmanned aerial system. Remote Sens. 2021, 13, 3406. [Google Scholar] [CrossRef]
- Dale, J.; Burnside, N.G.; Hill-Butler, C.; Berg, M.J.; Strong, C.J.; Burgess, H.M. The use of unmanned aerial vehicles to determine differences in vegetation cover: A tool for Monitoring Coastal Wetland Restoration Schemes. Remote Sens. 2020, 12, 4022. [Google Scholar] [CrossRef]
- Woebbecke, D.M.; Meyer, G.E.; Von Bargen, K.; Mortensen, D.A. Color indices for weed identification under various soil, residue, and lighting conditions. Trans. ASAE 1995, 38, 259–269. [Google Scholar] [CrossRef]
- Hunt, E.R., Jr.; Doraiswamy, P.C.; McMurtrey, J.E.; Daughtry, C.S.; Perry, E.M.; Akhmedov, B. A visible band index for Remote Sensing Leaf chlorophyll content at the canopy scale. Int. J. Appl. Earth Obs. Geoinf. 2013, 21, 103–112. [Google Scholar] [CrossRef]
- Taddia, Y.; Pellegrinelli, A.; Corbau, C.; Franchi, G.; Staver, L.W.; Stevenson, J.C.; Nardin, W. High-resolution monitoring of tidal systems using UAV: A case study on poplar island, MD (USA). Remote Sens. 2021, 13, 1364. [Google Scholar] [CrossRef]
- Dai, W.; Li, H.; Chen, X.; Xu, F.; Zhou, Z.; Zhang, C. Saltmarsh expansion in response to morphodynamic evolution: Field observations in the Jiangsu Coast using UAV. J. Coast. Res. 2020, 95, 433. [Google Scholar] [CrossRef]
Figure 1.
(A). The state of South Carolina in the context of the USA. (B). Beaufort County (black outline) in the context of the state of South Carolina. (C). The study area (black X) in the context of Beaufort County. (D). The region of interest for each recurring flight with the ground control points marked with red crosses. The base map comes from the first data collection.

Figure 2.
(A) An example of a black and white GCP surrounding the area of interest. (B) The EMLID reach RS2 rover pole collecting data for the GCPs.
Figure 2.
(A) An example of a black and white GCP surrounding the area of interest. (B) The EMLID reach RS2 rover pole collecting data for the GCPs.
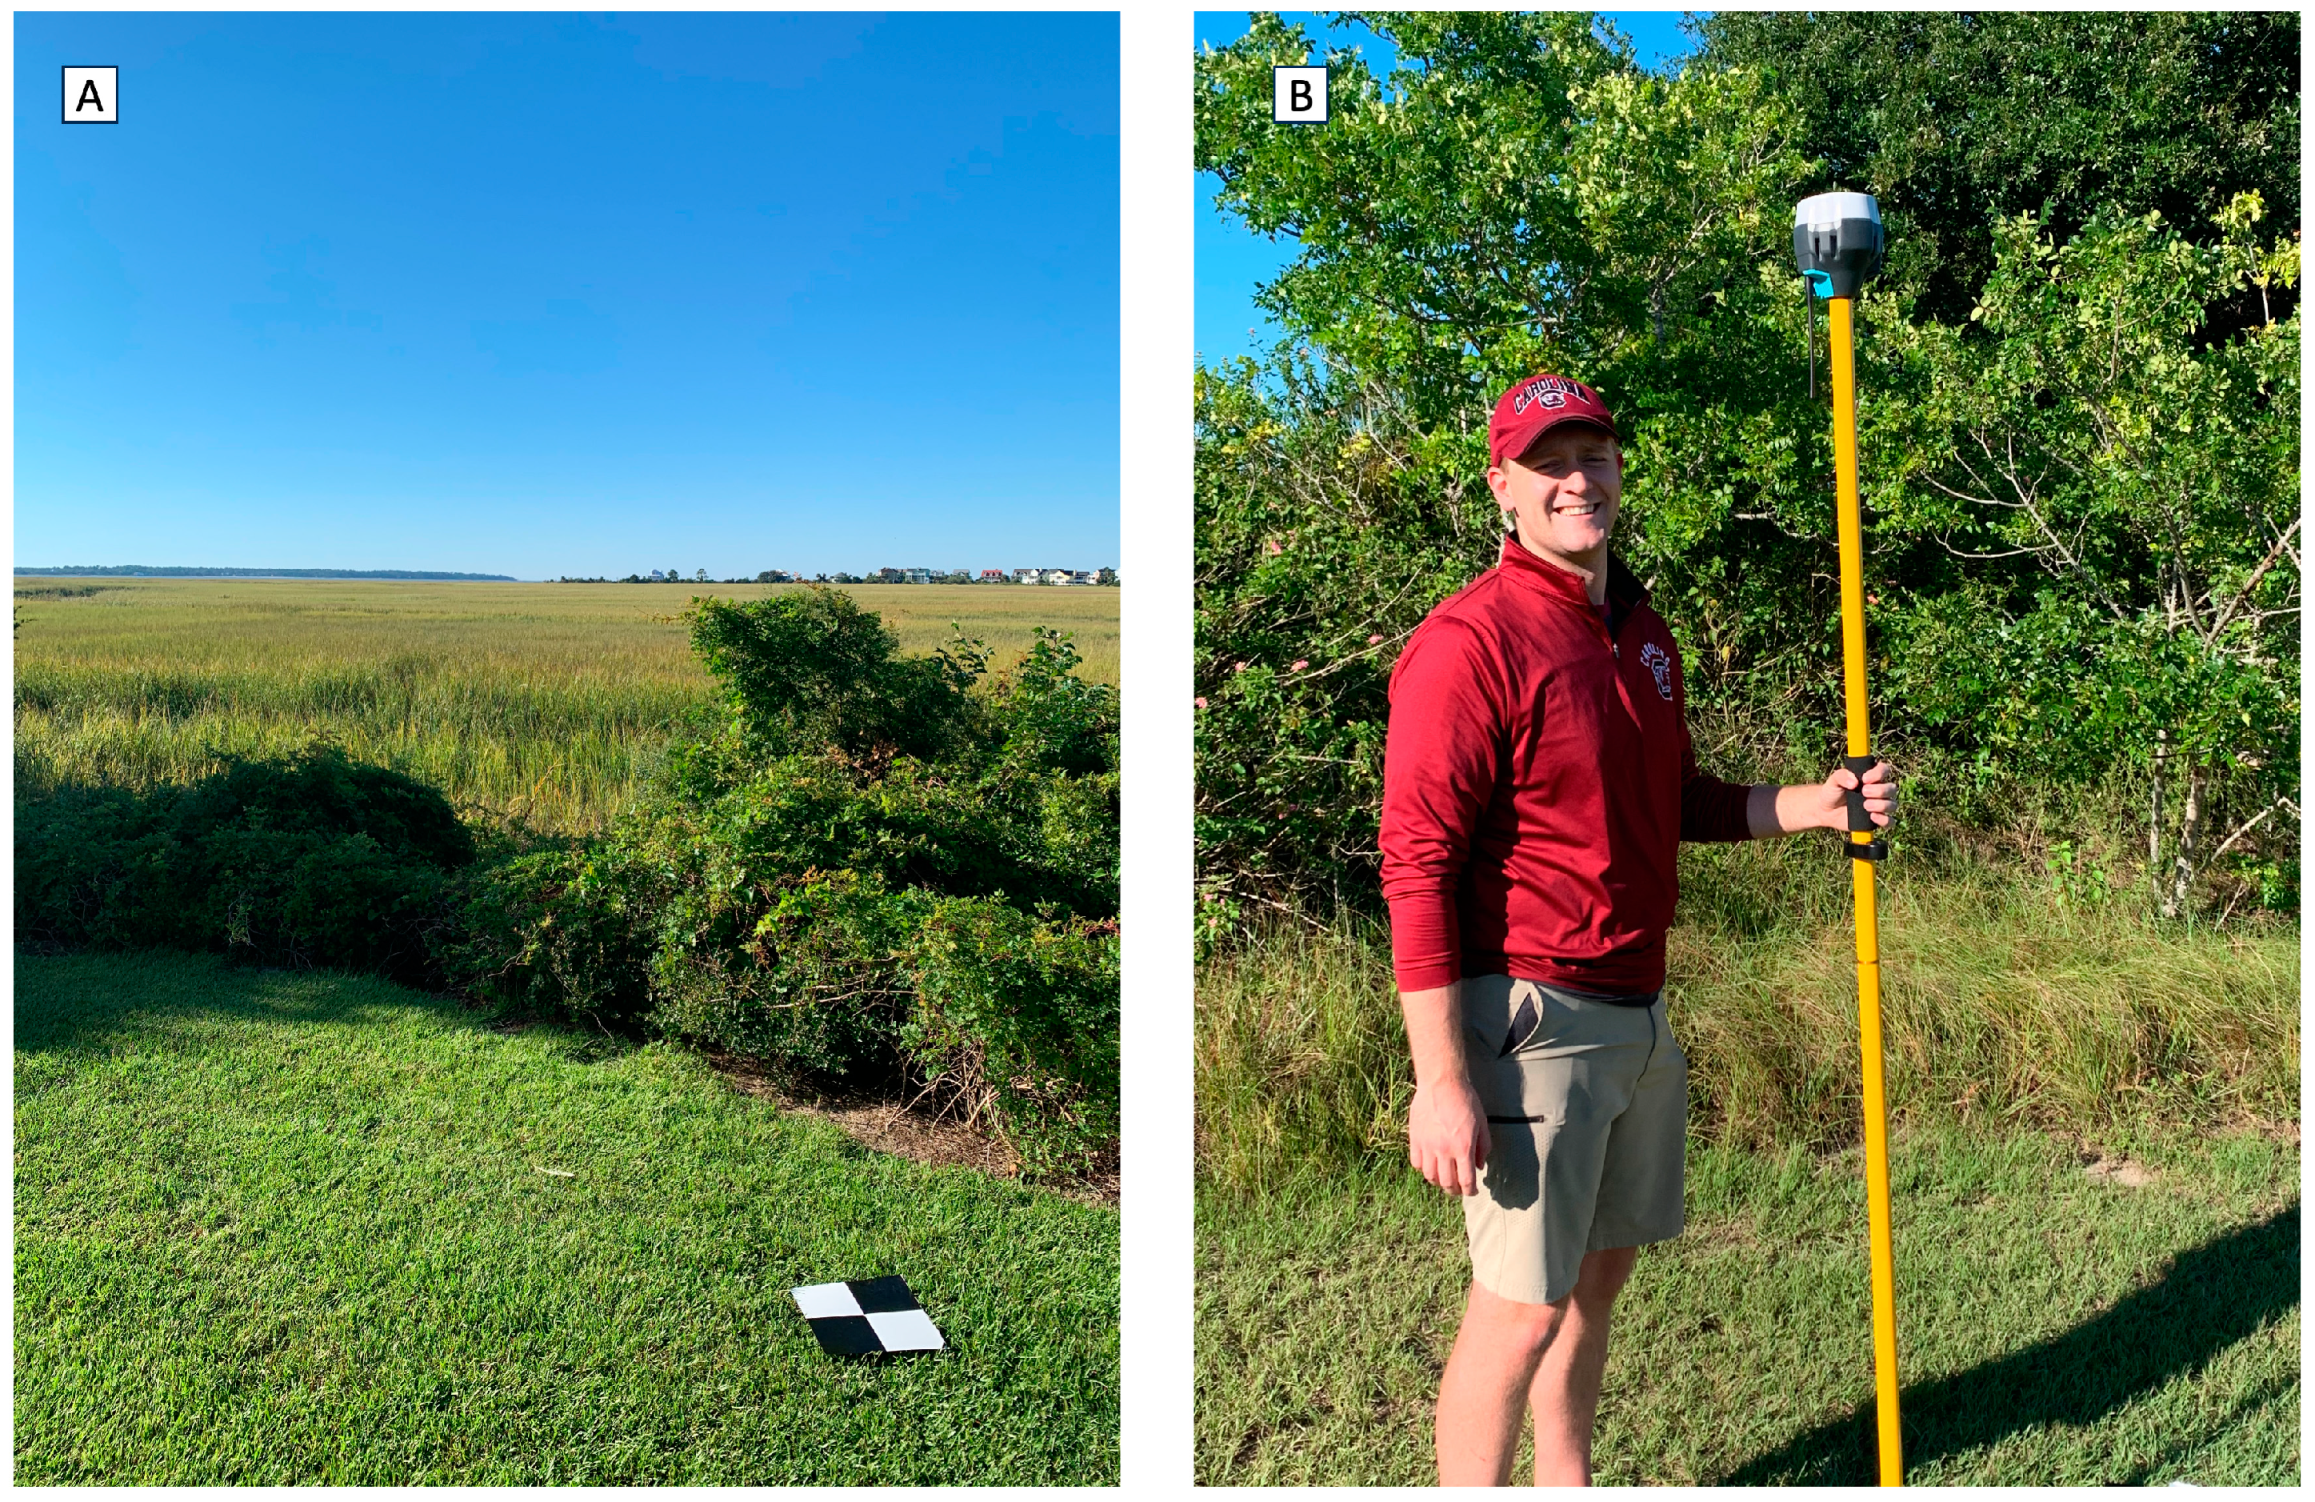
Figure 3.
Visually identifiable wrack (surrounded in red).
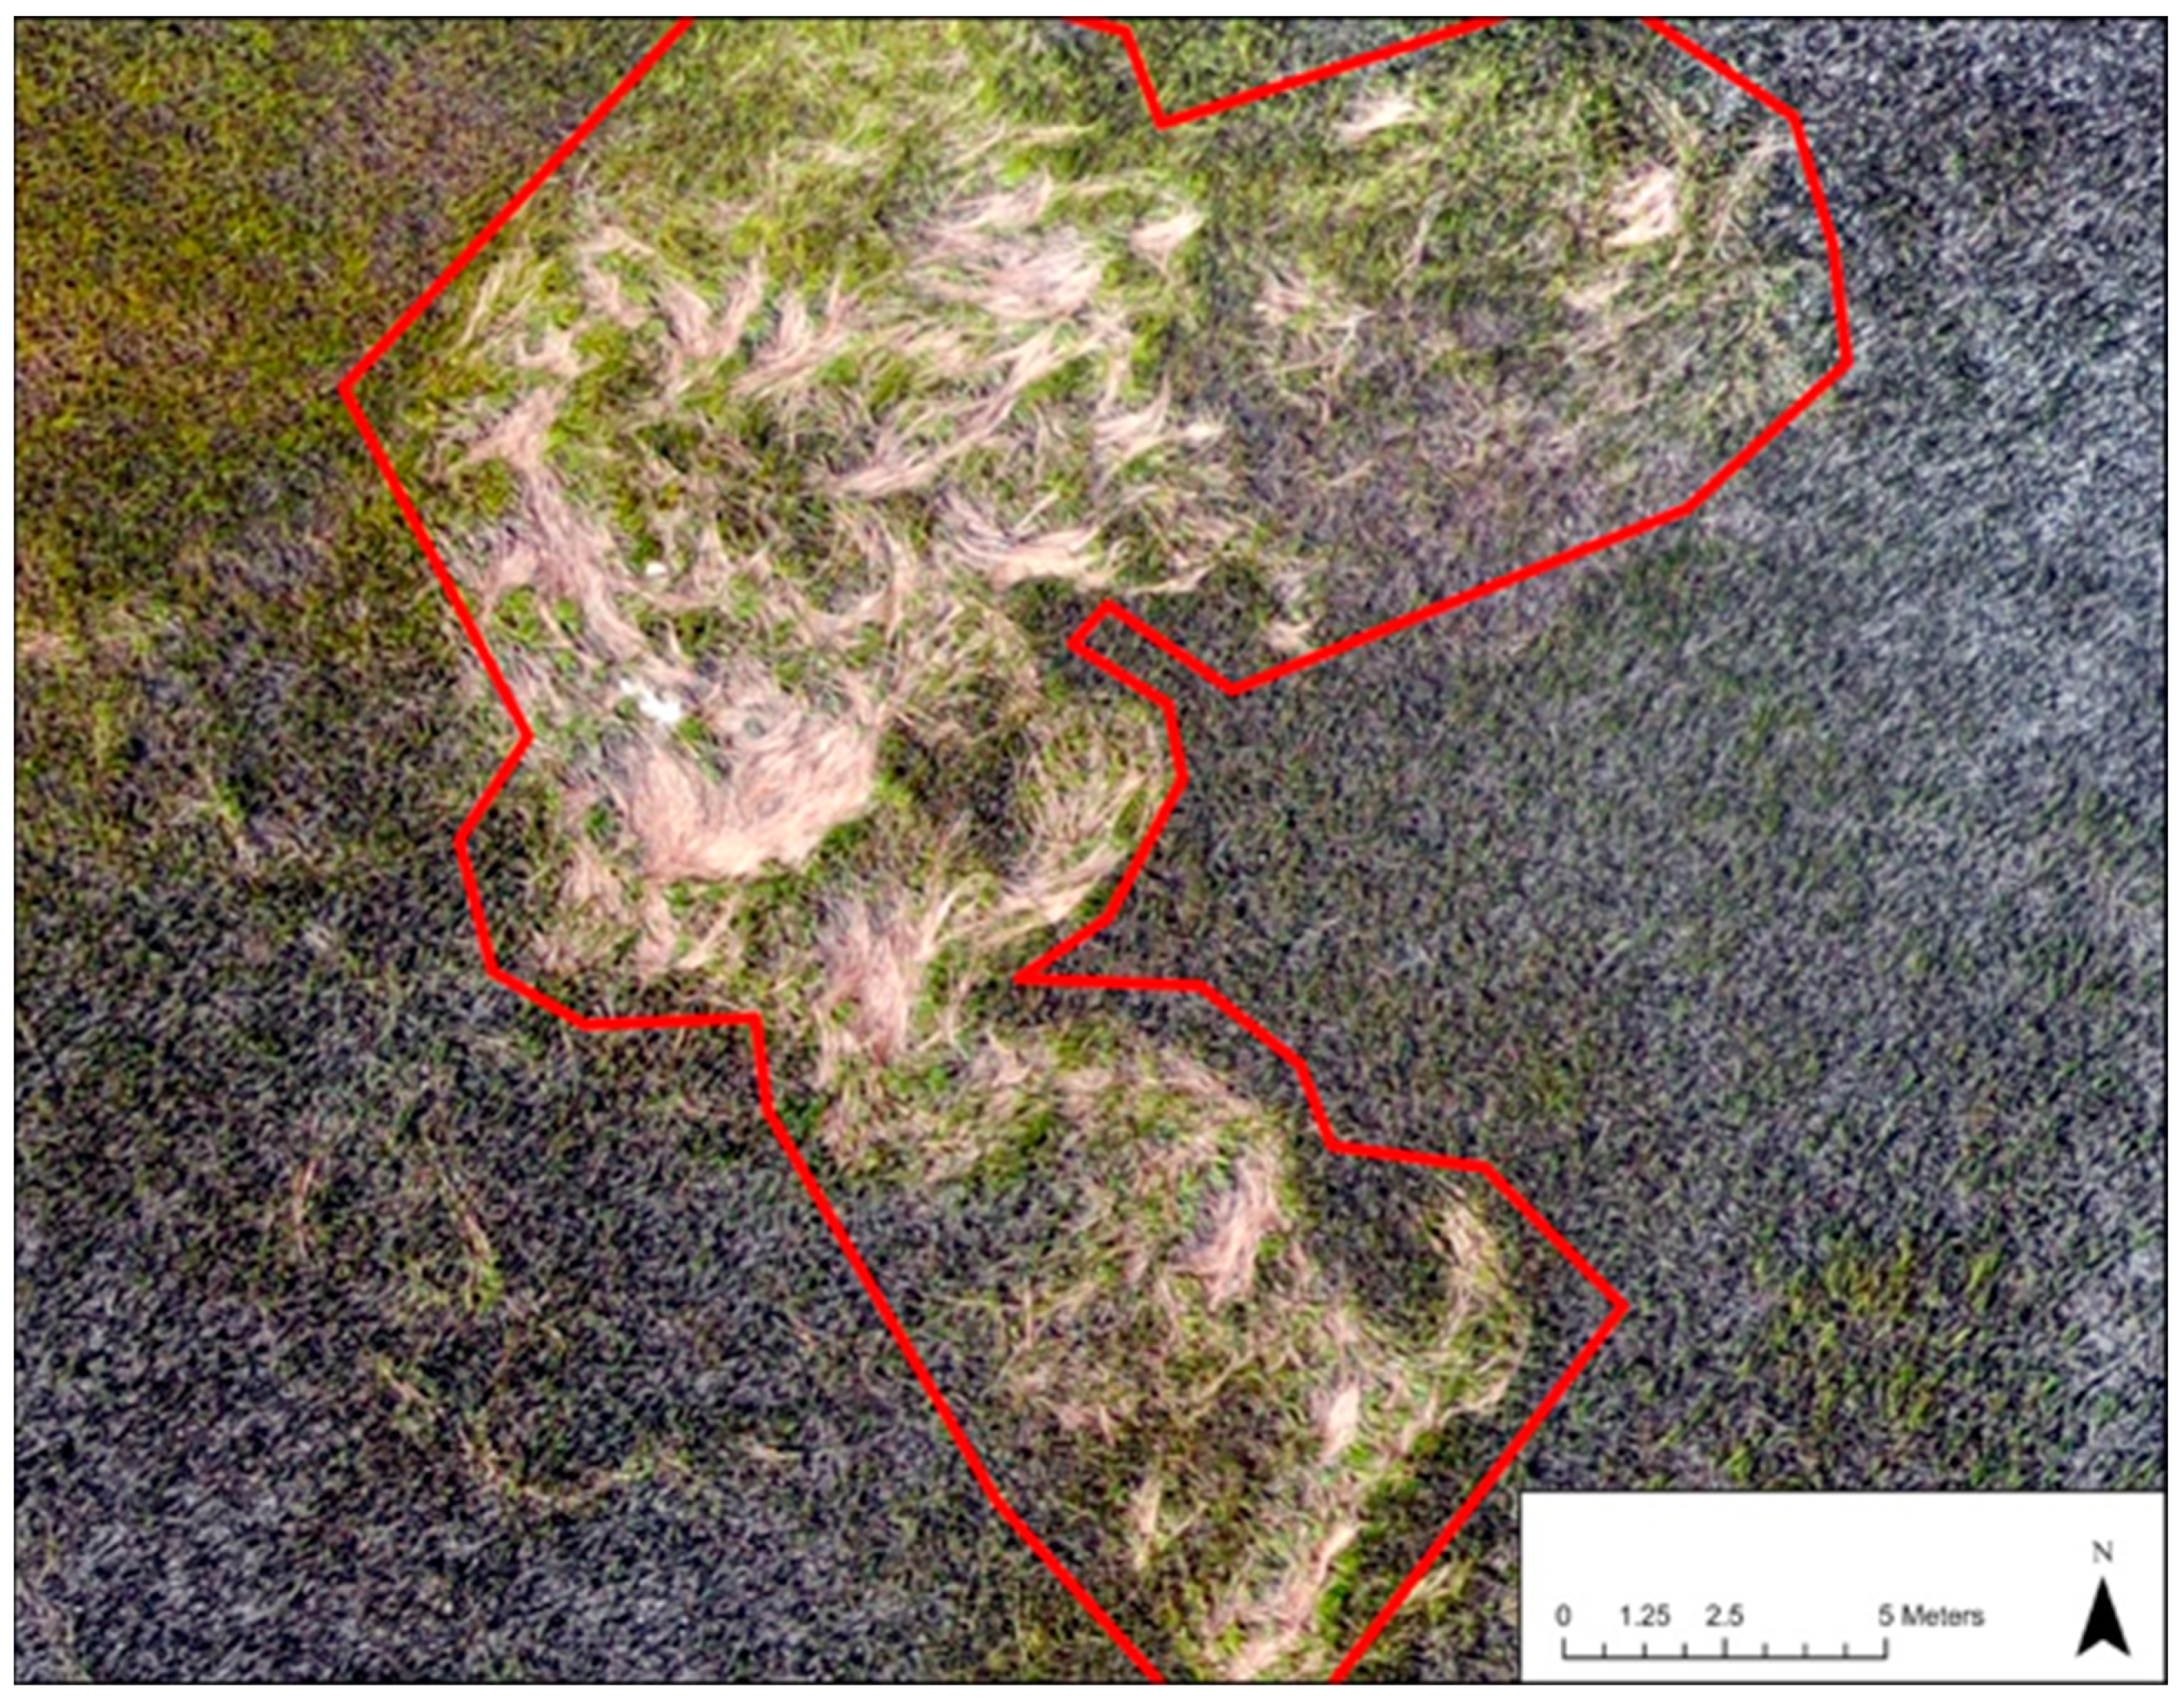
Figure 4.
Wrack change over time. Hurricane Isaias is marked with a hurricane symbol, and the king tide events that were found throughout the year are marked with a crown.
Figure 4.
Wrack change over time. Hurricane Isaias is marked with a hurricane symbol, and the king tide events that were found throughout the year are marked with a crown.
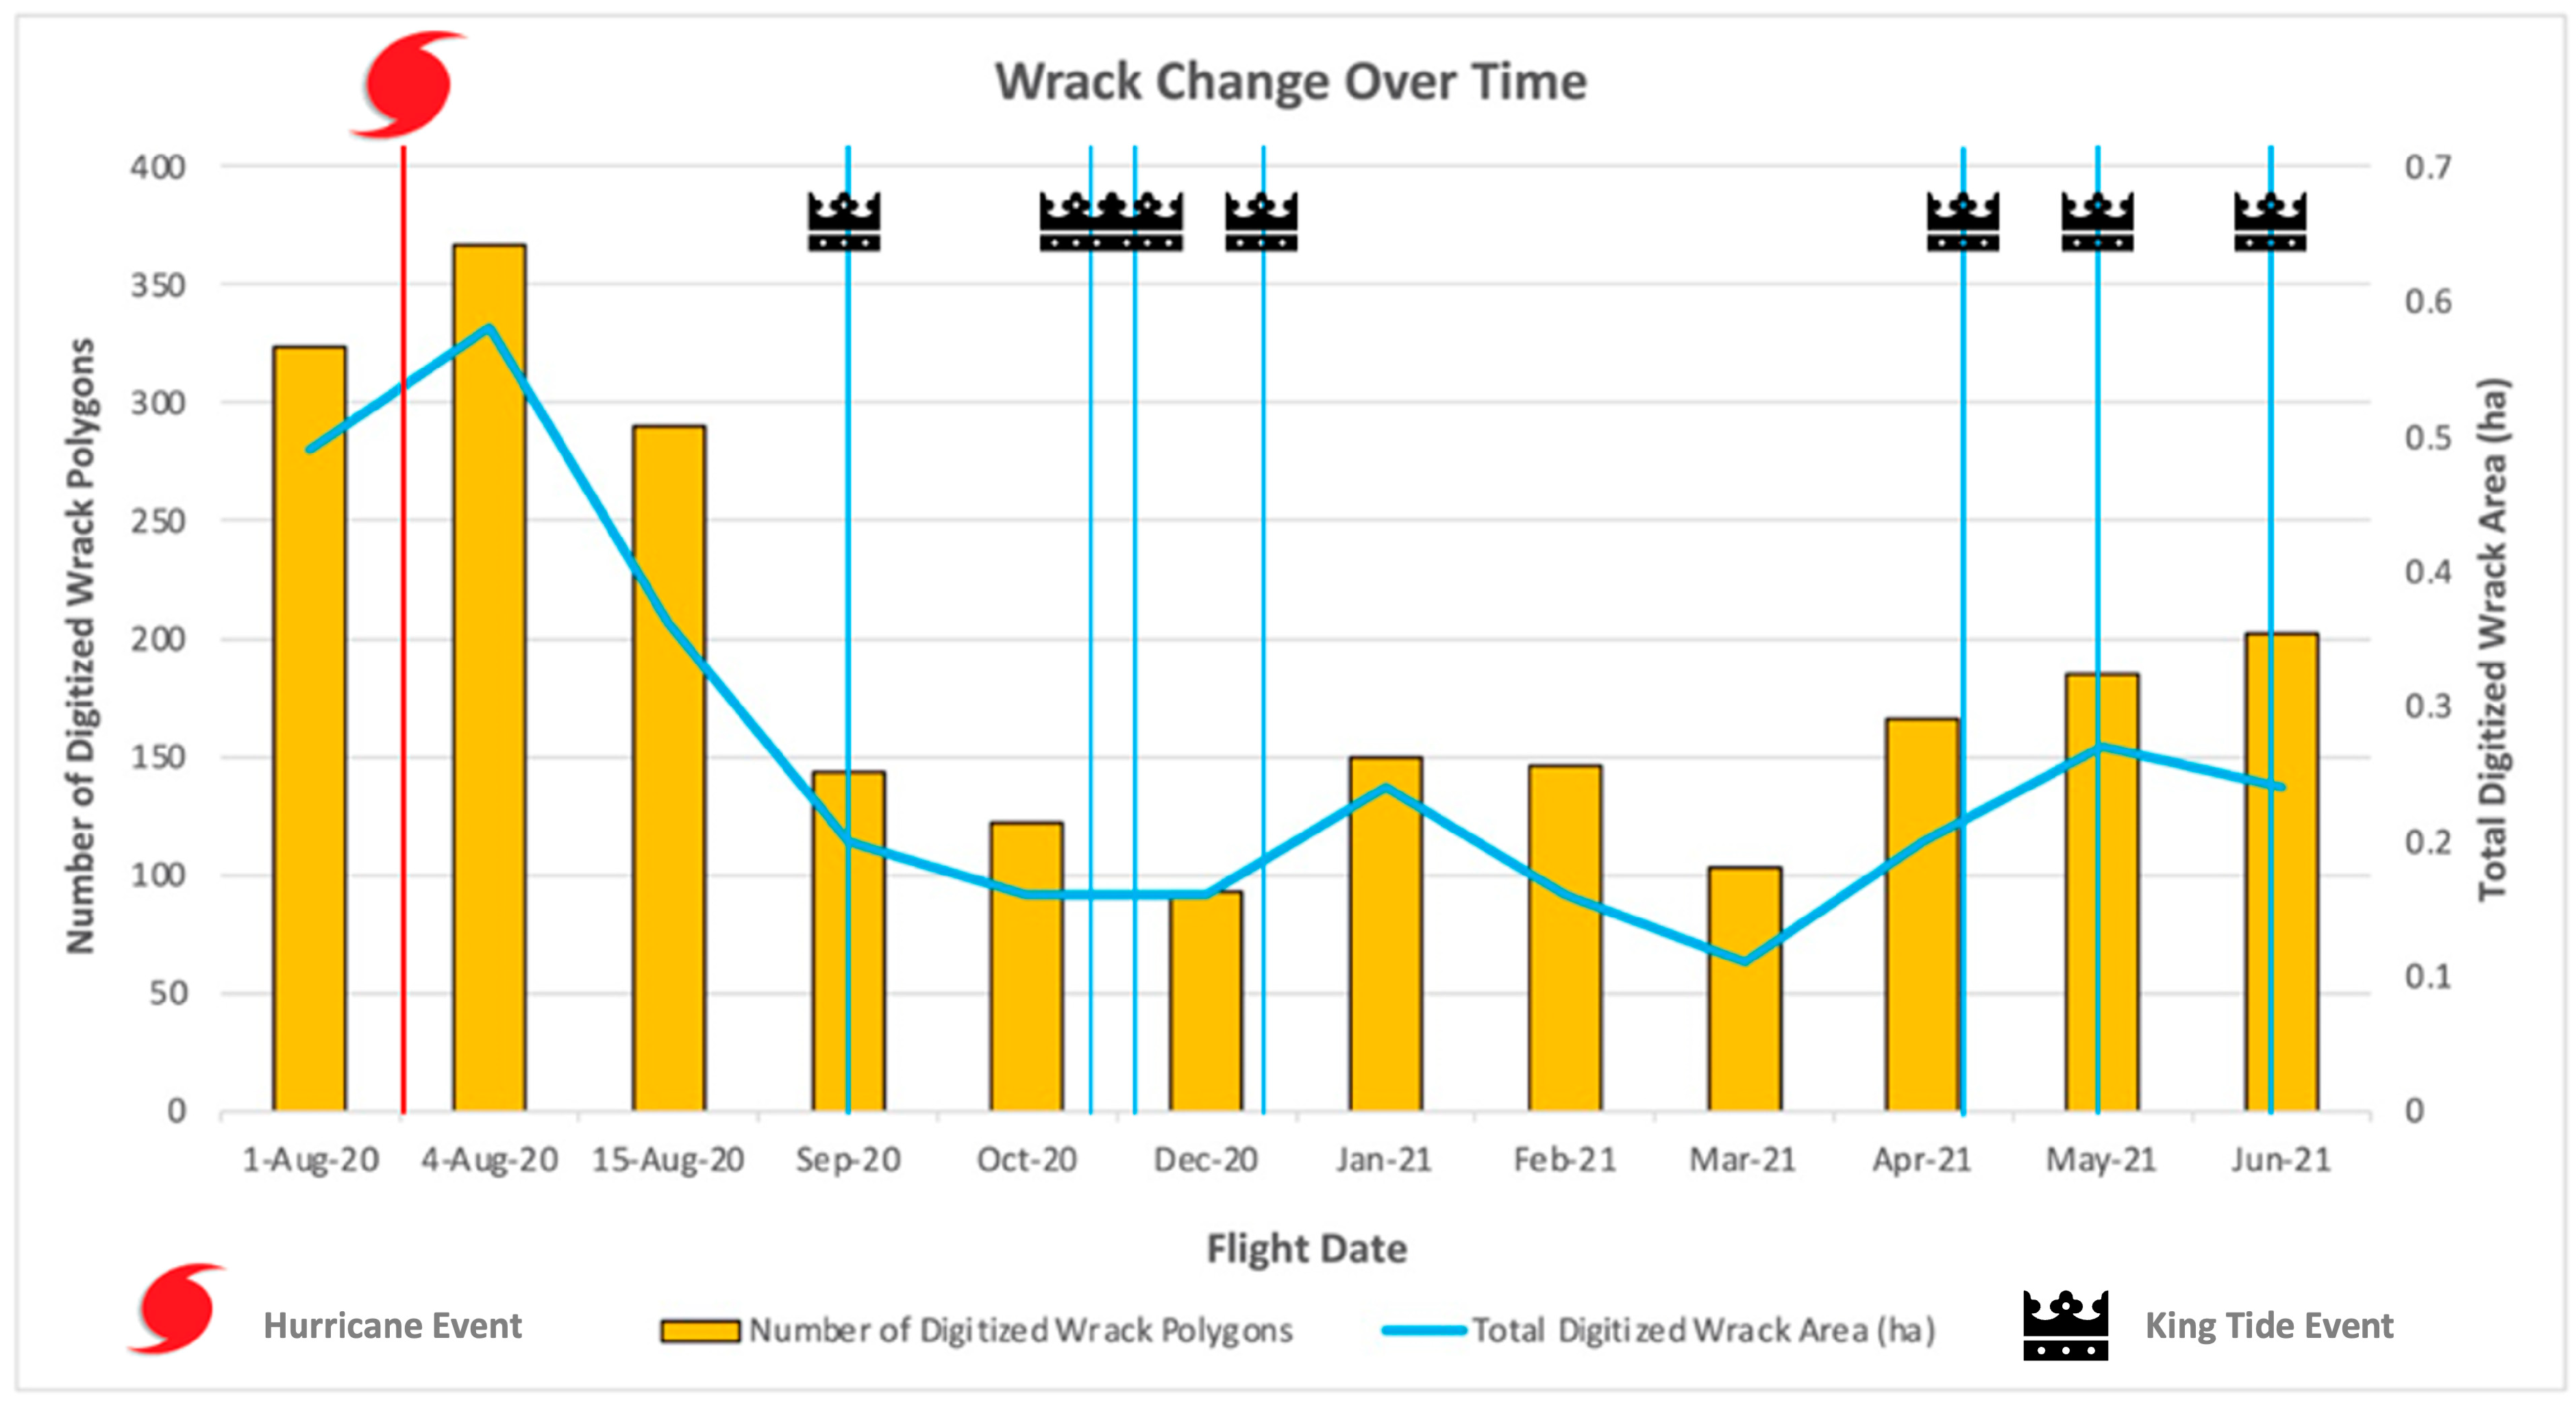
Figure 5.
This heat map assesses the digitized wrack from all 12 missions from August 2020 to June 2021 to determine where wrack was consistently deposited.
Figure 5.
This heat map assesses the digitized wrack from all 12 missions from August 2020 to June 2021 to determine where wrack was consistently deposited.
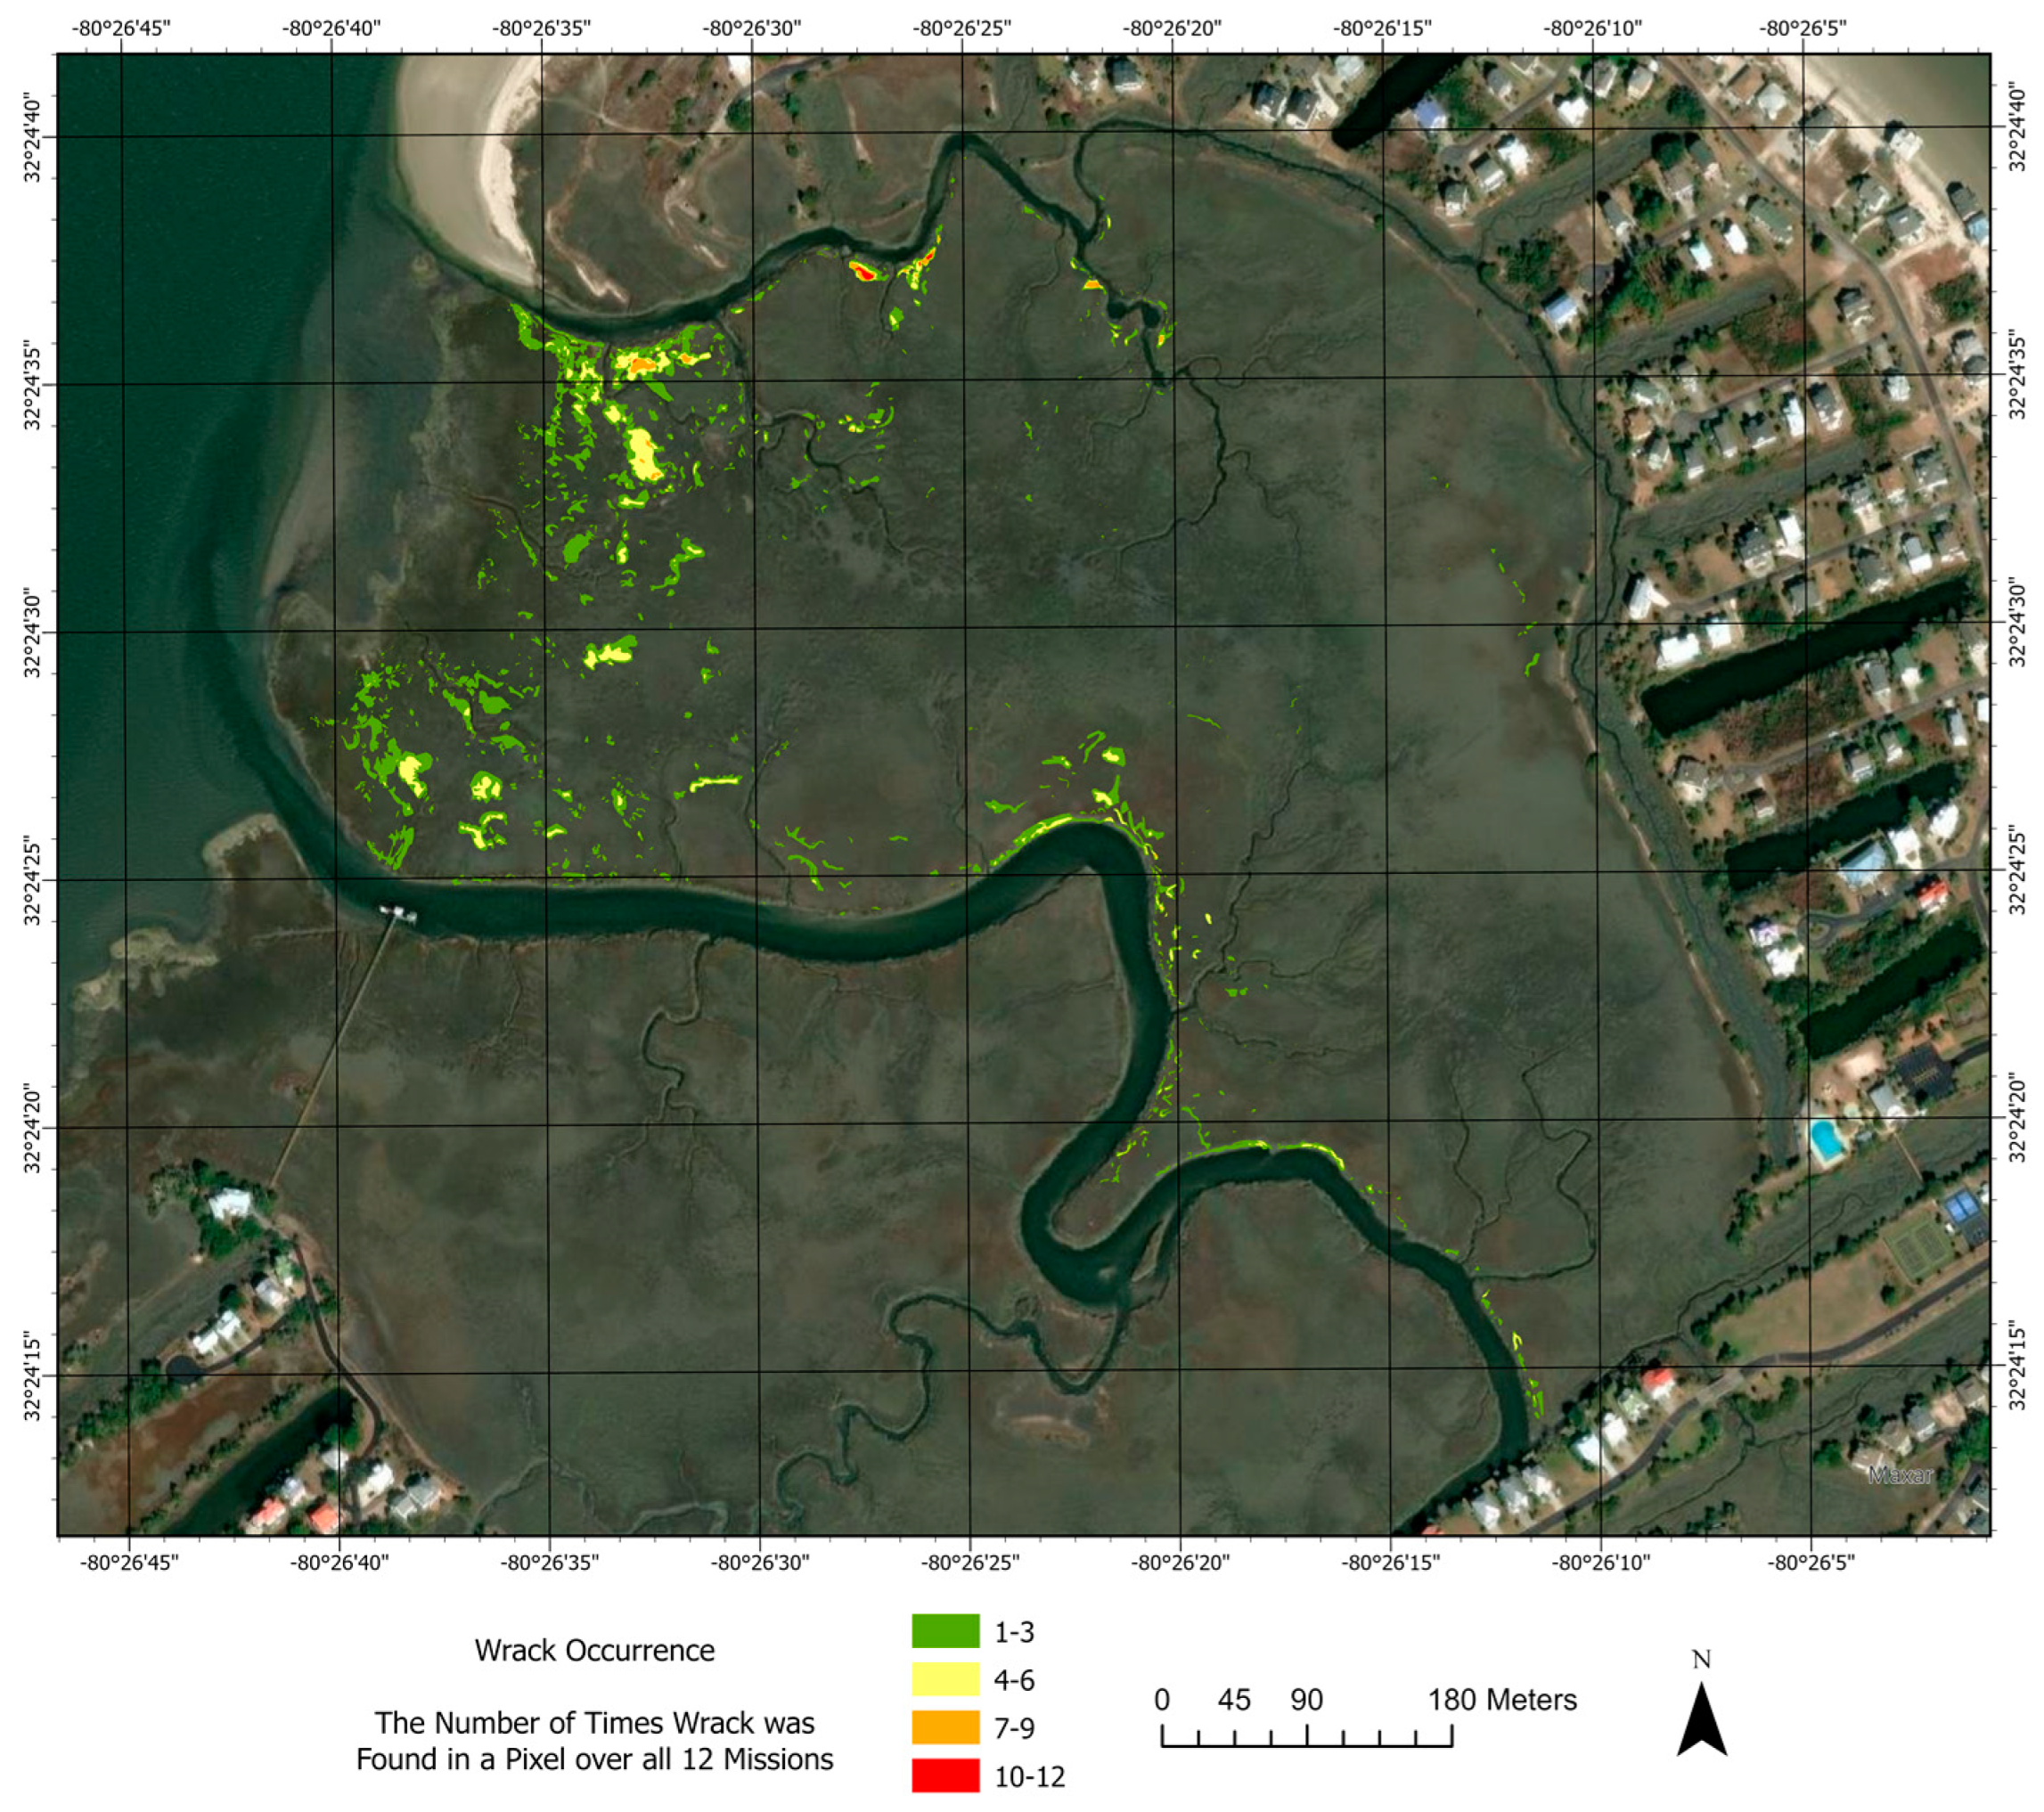
Figure 6.
Wrack distribution changes from the impact of the storm. The red circle indicates an area of interest where wrack was deposited further into the marsh system during the storm.
Figure 6.
Wrack distribution changes from the impact of the storm. The red circle indicates an area of interest where wrack was deposited further into the marsh system during the storm.
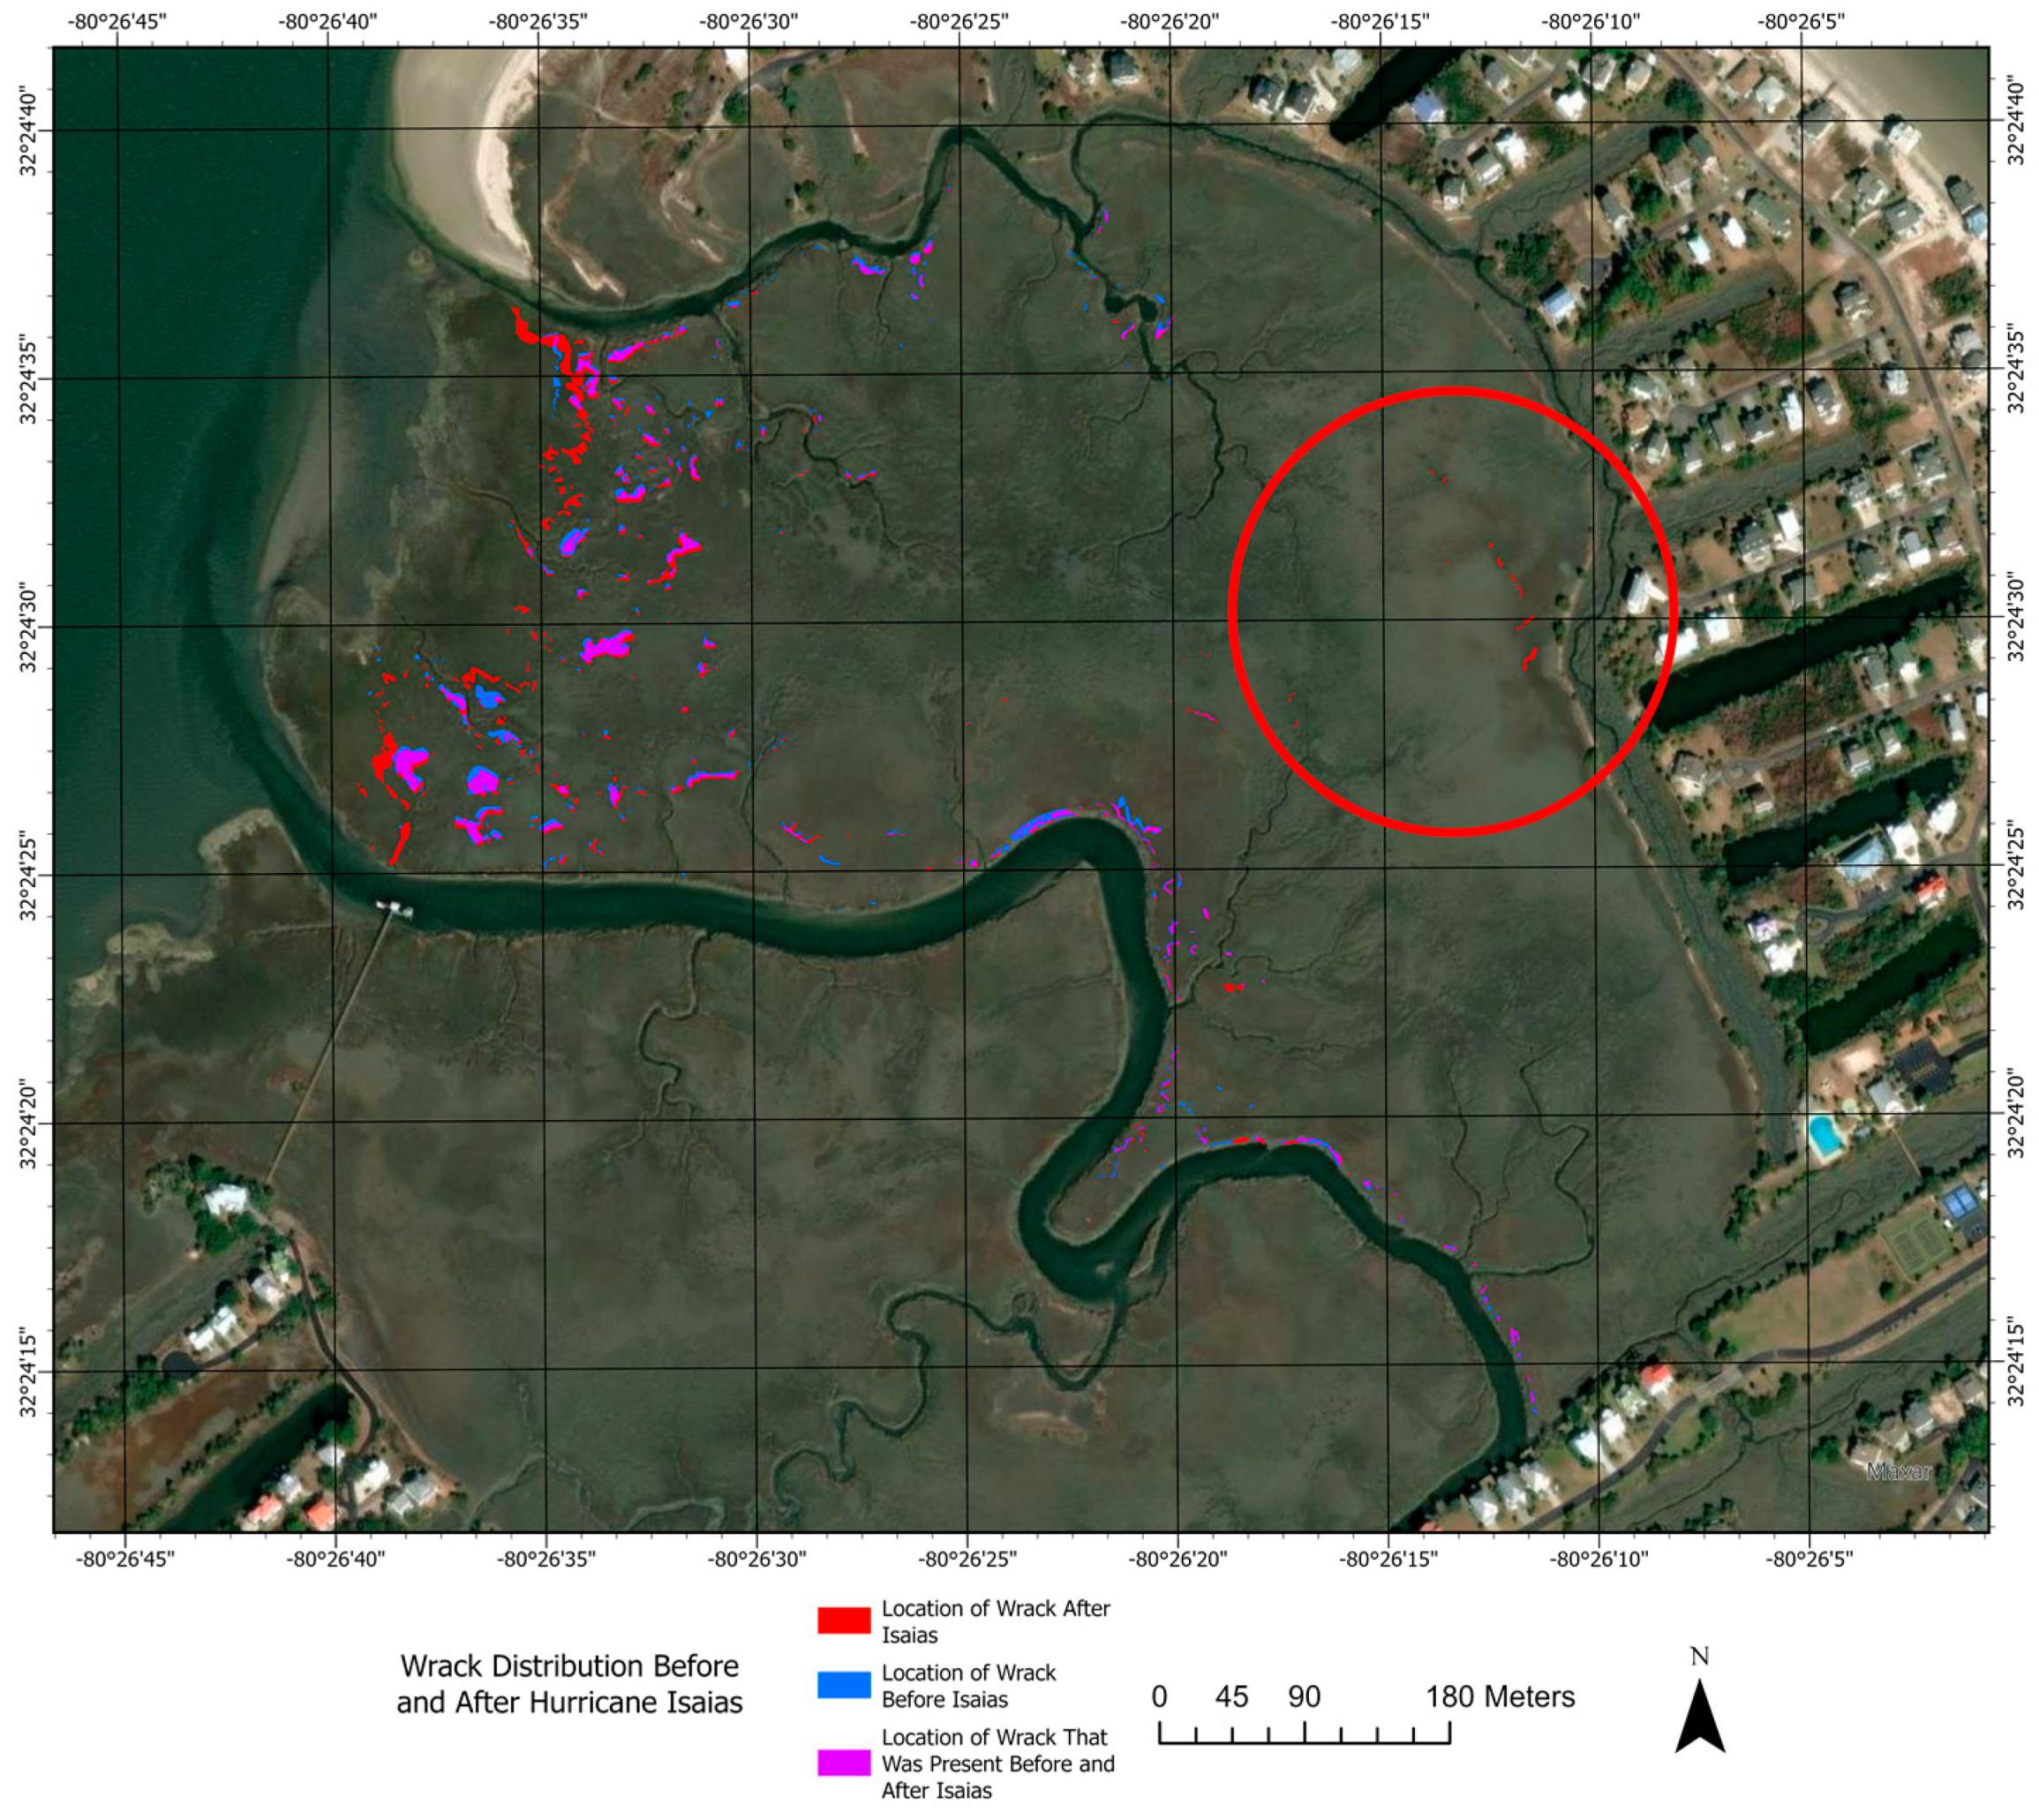
Figure 7.
(A) The change of a wrack before and after Hurricane Isaias and the eventual impact of persistent wrack presence. (B) Wrack change and the eventual impact of persistent wrack presence. Red circles are the original wrack mat location while the orange circles are the locations after movement.

Table 1.
Flight data.
| Date | Flight Time (EST/EDT) | Cloud Cover | Low Tide | Note |
|---|---|---|---|---|
| 1 August 2020 | 1:57 PM–2:44 PM | Some clouds | 1:13 PM | Pre-Hurricane Isaias Impact investigation |
| 4 August 2020 | 3:50 PM–4:40 PM | Some clouds | 3:39 PM | Post- Hurricane Isaias Impact |
| 15 August 2020 | 11:21 AM–12:11 PM | Some clouds | 11:49 PM | Post-Isaias 2 Week Check |
| 15 September 2020 | 12:31 PM–1:24 PM | Many clouds | 1:14 PM | Beginning of monthly operations |
| 29 October 2020 | 1:51 PM–2:38 PM | Many clouds | 1:47 PM | Data captured in between storms |
| 11 December 2020 | 12:05 PM–1:04 PM | No clouds | 11:17 AM | Clear sky/winds 3 mph from ENE |
| 11 January 2021 | 12:11 PM–12:59 PM | Completely cloudy | 12:56 PM | Captured between rain showers |
| 9 February 2021 | 1:22 PM–2:08 PM | Completely cloudy | 12:41 PM | Captured day after rain showers |
| 25 March 2021 | 12:06 PM–12:58 PM | Many clouds | 12:36 PM | No shadows due to clouds |
| 22 April 2021 | 11:31 AM–12:21 PM | No clouds | 11:04 AM | Clear sky/winds 14 mph from NE |
| 22 May 2021 | 10:47 AM–11:35 AM | Many clouds | 11:24 AM | No shadows due to clouds |
| 21 June 2021 | 11:56 AM–12:47 PM | Some clouds | 11:48 AM | Clear sky/winds 9 mph from W |
Table 2.
The distribution of wrack mat sizes within a distance from water.
| Date | Total Wrack | Avg Size m2 | Wrack within 10 m of Water | Avg Size m2 | Wrack within 15 m of Water | Avg Size m2 | Wrack within 20 m of Water | Avg Size m2 |
|---|---|---|---|---|---|---|---|---|
| 1 August 2020 | 324 | 15.00 | 199 | 14.82 | 223 | 14.00 | 244 | 13.54 |
| 4 August 2020 | 367 | 15.72 | 190 | 16.02 | 221 | 14.89 | 246 | 14.37 |
| 15 August 2020 | 290 | 12.41 | 128 | 14.25 | 164 | 12.84 | 184 | 12.02 |
| September 2020 | 148 | 13.67 | 66 | 12.93 | 83 | 12.16 | 91 | 12.37 |
| October 2020 | 122 | 12.91 | 76 | 14.86 | 87 | 15.35 | 99 | 14.01 |
| December 2020 | 93 | 17.17 | 54 | 17.91 | 69 | 19.29 | 74 | 18.16 |
| January 2021 | 150 | 15.97 | 83 | 17.54 | 98 | 15.24 | 109 | 19.65 |
| February 2021 | 146 | 11.12 | 92 | 10.26 | 107 | 9.55 | 118 | 13.14 |
| March 2021 | 103 | 10.33 | 72 | 8.96 | 79 | 9.68 | 85 | 9.79 |
| April 2021 | 166 | 12.33 | 85 | 11.28 | 98 | 11.95 | 119 | 14.53 |
| May 2021 | 185 | 14.40 | 97 | 12.35 | 113 | 13.05 | 131 | 15.57 |
| June 2021 | 202 | 11.89 | 116 | 10.22 | 132 | 9.69 | 145 | 12.33 |
Disclaimer/Publisher’s Note: The statements, opinions and data contained in all publications are solely those of the individual author(s) and contributor(s) and not of MDPI and/or the editor(s). MDPI and/or the editor(s) disclaim responsibility for any injury to people or property resulting from any ideas, methods, instructions or products referred to in the content. |
© 2023 by the authors. Licensee MDPI, Basel, Switzerland. This article is an open access article distributed under the terms and conditions of the Creative Commons Attribution (CC BY) license (https://creativecommons.org/licenses/by/4.0/).
Share and Cite
MDPI and ACS Style
Morgan, G.R.; Morgan, D.R.; Wang, C.; Hodgson, M.E.; Schill, S.R. The Dynamic Nature of Wrack: An Investigation into Wrack Movement and Impacts on Coastal Marshes Using sUAS. Drones 2023, 7, 535. https://doi.org/10.3390/drones7080535
AMA Style
Morgan GR, Morgan DR, Wang C, Hodgson ME, Schill SR. The Dynamic Nature of Wrack: An Investigation into Wrack Movement and Impacts on Coastal Marshes Using sUAS. Drones. 2023; 7(8):535. https://doi.org/10.3390/drones7080535
Chicago/Turabian StyleMorgan, Grayson R., Daniel R. Morgan, Cuizhen Wang, Michael E. Hodgson, and Steven R. Schill. 2023. "The Dynamic Nature of Wrack: An Investigation into Wrack Movement and Impacts on Coastal Marshes Using sUAS" Drones 7, no. 8: 535. https://doi.org/10.3390/drones7080535