
Joint Resource Slicing and Vehicle Association for Drone-Assisted Vehicular Networks †

College of Computer and Information Engineering (College of Artificial Intelligence), Nanjing Tech University, Nanjing 211816, China
*
Author to whom correspondence should be addressed.
†
Part of this work has been published in IEEE Symposium on Computers and Communications (ISCC).
Drones 2023, 7(8), 534; https://doi.org/10.3390/drones7080534
Submission received: 14 July 2023
/
Revised: 9 August 2023
/
Accepted: 10 August 2023
/
Published: 16 August 2023
(This article belongs to the Special Issue UAVs in 5G and beyond Networks)
Abstract
:The drone-small-cell-assisted air-ground integrated network is a promising architecture for enabling diverse vehicle applications. This paper presents a joint resource slicing and vehicle association framework for drone-assisted vehicular networks, which facilitates spectrum sharing among heterogeneous base stations (BSs) and achieves dynamic resource provisioning in the presence of network load dynamics. We formulate the network utility maximization problem as mixed-integer nonlinear programming, considering traffic statistics, quality-of-service (QoS) constraints, varying vehicle locations, load conditions in each cell, and interdrone interference. The original maximization problem is transformed into a biconcave optimization problem to ensure mathematical tractability. An alternate concave search algorithm is then designed to iteratively solve vehicle association patterns and spectrum partitioning among heterogeneous BSs until convergence. Simulation results show that the proposed scheme achieves a significant performance improvement in throughput and spectrum utilization compared with two other baseline schemes.
1. Introduction
As a typical fifth-generation (5G) and beyond scenario, vehicular networks connect vehicles, pedestrians, mobile devices, and base stations (BSs), providing a wide range of services, such as road safety and security, fleet, and traffic management [1]. Cellular vehicle-to-everything (C-V2X) is seen as a viable enabler for emerging use cases in 5G and beyond, offering low-latency, high-reliability, and high-throughput communications for various services and supporting massively interconnected vehicles [2]. However, increasing network capacity and accommodating various services with stringent quality-of-service (QoS) requirements necessitate innovations in network architecture. Ultradense deployment of BSs and roadside units can improve network capacity through network densification. Still, this solution may lead to low cell utilization efficiency, additional infrastructure deployment costs, and intercell interference [3]. Providing satisfactory QoS with fixed and rigid terrestrial cellular networks, particularly on busy urban roads during rush hours, is challenging.
Drones equipped with specialized wireless transceivers and computing modules have the potential to form drone-based small cells (DSCs). These flying base stations (BSs) can communicate with ground-based base stations (GBSs) and provide vehicle connectivity services. An integrated air-ground network architecture is promising for enabling ubiquitous connections, enhancing the performance of 5G and beyond vehicular networks. First, DSCs can fly in designated areas to form three-dimensional, configurable small cells. These small cells can be rapidly deployed to cover wireless “dead zones” for vehicular users, enabling better network extensibility. Second, combining GBSs with DSCs can provide broader coverage and greater capacity through a three-dimensional layered network. DSCs can act as airborne relays for GBSs to serve edge vehicles beyond GBS coverage. Third, drones can monitor traffic conditions in the air (including road congestion and accidents) and transmit this information to ground stations to be relayed to vehicular networks, which helps drivers choose optimal routes. Last but not least, DSCs flying at high altitudes avoid shadow fading in data transmission and increase the probability of establishing reliable short-distance line-of-sight (LoS) links, reducing delays and improving reliability [4]. Deploying DSCs under GBSs facilitates spectrum reuse owing to their low transmit power and flexible placement, relieving resource allocation pressures.
Resource allocation issues arise despite the numerous benefits of an integrated air-ground network architecture. First, the unique GBS-to-DSC (G2D) and DSC-to-vehicle (D2V) channels create a trade-off between effective coverage and spectrum utilization in DSC deployment. Resource allocation and vehicle association must consider DSC’s effective coverage impact. Second, the maneuverability of DSCs results in diverse vehicle association patterns, complicating spectrum slicing among heterogeneous base stations. Third, interference fluctuations in DSC deployment [5] make granular vehicle-level resource provisioning difficult. The movement of DSCs creates rapidly changing interference conditions and network topology. Fourth, DSC deployment and position adjustment should account for road direction and traffic variation. For example, DSCs should fly along the direction of high-speed vehicular traffic for better service coverage. Therefore, exploring efficient spectrum resource provisioning that cooperates with DSCs to support emerging vehicular applications is crucial.
Resource allocation issues arise despite the numerous benefits of an integrated air-ground network architecture. First, the unique ground-base-station-to-drone-small-cell (G2D) and drone-small-cell-to-vehicle (D2V) channels create a trade-off between effective coverage and spectrum utilization in DSC deployment. Resource allocation and vehicle association must consider DSC’s effective coverage. Second, the maneuverability of DSCs results in diverse vehicle association patterns, complicating spectrum slicing among heterogeneous base stations. Third, interference fluctuations in DSC deployment [5] make granular vehicle-level resource provisioning difficult. The movement of DSCs creates rapidly changing interference conditions and network topology. Fourth, DSC deployment should account for road direction and traffic variation for better service coverage.
1.1. Related Works
Many resource slicing methods are designed for terrestrial vehicular networks, highlighting service provision capability and QoS satisfaction for various services. Peng et al. in [6] developed a joint power control and resource slicing strategy to provide QoS-guaranteed downlink transmissions in multiaccess edge computing (MEC)–enabled vehicular networks. They also proposed a multidimensional resource management framework in [7] to maximize the number of offloaded tasks under heterogeneous QoS requirements. In [8], a multitimescale radio access network slicing and task offloading problem is investigated to maximize resource utilization with diverse QoS guarantees for autonomous driving tasks. Flexible wireless resource management is explored in [9], where radio access and processing functions run in software instances based on network function virtualization (NFV) [10]. Shen et al. in [11] proposed a network architecture that facilitates the interplay between the digital twin and network slicing paradigms, building on holistic network virtualization and edge intelligence. Zarandi and Tabassum in [12] investigated the delay minimization problem with task offloading, computation, and communication resource allocation in sliced multicell mobile edge computing (MEC) systems. They solved offloading decision-making and resource allocation subproblems through alternating optimization until convergence. A reinforcement learning method is developed in [13] for the decision making of network selection and autonomous driving in multiband vehicular networks, with the goal of enhancing the data rate through radio resource management.
Utilizing DSCs is crucial for effective service provisioning in vehicular networks. Recent research has focused on device association, DSC coverage, and resource allocation. Sun et al. in [14] examined the spectrum efficiency at end devices and explored how DSC deployment can enhance resource utilization. Shi et al. in [15] developed a drone ground coverage model to maximize end device coverage while adhering to the drone-to-ground link quality constraint. However, the impact of drone flight height on resource consumption and network coverage requires further investigation. In [16], a drone-assisted cellular networking scheme was proposed to improve coverage performance for machine-type communication services. Cheng et al. in [17] introduced a drone-assisted edge computing architecture for offloading computation-intensive applications. Additionally, a multi-DSC-assisted resource slicing problem for 5G uplink radio access networks was studied in [18] to minimize total resource consumption.
There is a scarcity of literature on resource management in DSC-assisted vehicular networks. Zhang et al. explored software-defined networking (SDN)-based resource management for air-space-ground integrated vehicular networks [19], where local and centralized controllers collaborate to manage resources. He et al. investigated the drone relay problem [20], considering the influence of communication interruption and energy consumption. To support more diversified IoT services in a dynamic network environment, Wu et al. studied a space-air-ground integrated framework for efficient network slicing and content services for vehicular networks [21]. Lyu et al. presented a service-oriented resource slicing framework for space-air-ground integrated vehicular networks to maximize system revenue and stabilize the time-averaged queue [22]. Additionally, Han et al. in [23] developed a drone-aided intelligent transportation system to support low-latency vehicular services. They studied the problem of how to minimize the average peak age of information by optimizing multidrone deployment.
Certain issues require further investigation. For instance, some research assumes that DSCs can provide services to vehicles without the support of GBSs while ignoring the resource consumption that occurs during the interaction between DSCs and GBSs. Moreover, when slicing resources among heterogeneous BSs, it is essential to take into account the traffic features of vehicle services and the distinctive channels used by drones.
1.2. Contributions and Organization
In a scenario where multiple DSCs and GBSs coexist, we propose an air-ground integrated spectrum management framework for delay-sensitive applications in 5G and beyond vehicular networks. Our focus is on maximizing network utility under the constraint of delay. This paper makes two main contributions.
- We construct an optimization framework for resource slicing and vehicle association, which takes into account DSC deployment, traffic statistics, inter-DSC interference, and QoS requirements. We formulate a network utility maximization problem using the logarithmic function to determine spectrum slicing ratios and vehicle association patterns. We transform the joint optimization problem into a tractable biconcave maximization problem.
- We develop a convex search algorithm that iteratively solves the transformed problem for vehicle association patterns and spectrum partition with reduced complexity. The algorithm converges to a set of partial optimal solutions. Simulation results demonstrate that the proposed solution outperforms two other resource slicing baseline schemes regarding resource utilization and network throughput.
The follow-up content is arranged in the following sections. Section 2 presents the system model under consideration. Section 3 offers an optimization problem formulation and decomposition. In Section 4, the optimization problem is transformed into a tractable biconcave problem, and an alternate algorithm is proposed to solve the transformed problem. The section also discusses DSC deployment and companion flight policy. The performance evaluation is presented in Section 5. Finally, Section 6 concludes the paper. Table 1 lists the main notations and variables, and the appendices provide the proof of the propositions and corollaries.
2. System Model
Consider a two-tier vehicular network with multiple GBSs underlaid by multiple DSCs, as shown in Figure 1. DSCs, as air relays, deployed on demand, can forward GBSs’ traffic to target vehicles. When not covered by DSCs, a vehicle chooses to connect to a GBS. Under the coverage of a DSC, a vehicle can choose to connect to the DSC or a GBS. Multiple access types are permitted. Vehicles can access MEC servers via GBSs or DSCs. GBSs can wirelessly charge hovering DSCs [24].
2.1. Resource Slicing Framework
The physical radio resources from GBSs and DSCs are abstracted as a centralized virtual radio resource pool [25,26]. By collecting vehicles’ request information, a MEC-enabled controller performs management. GBSs are divided into two groups, denoted by and , where GBSs in the same group share the same spectrum resources and are not adjacent. Take an example of a two-way lane scenario shown in Figure 2. GBS 1 and GBS 2 are two GBSs from the groups and , respectively. The system’s total available radio spectrum resources are denoted as W. Without loss of generality, we consider slicing the spectrum resources among GBS 1, GBS 2, and each DSC. Each DSC reuses spectrum resources to support D2V communications under a distance constraint among DSCs. Then, the spectrum resources are divided into three mutually orthogonal spectrum slices, 1, 2, and 3, with the slicing ratios , , and , and are allocated to GBS 1, GBS 2, and each DSC, satisfying
For instance, on the left side of Figure 2, the drone deployed at uses spectrum slices 2 and 3, of which slice 3 is shared by each drone, and slice 2 is assigned to GBS 2. Since the drone is far from GBS 2, the interference caused by UAV using slice 2 to GBS 2 is low, with improved resource utilization. Similarly, on the right side of Figure 2, the drone deployed at is assigned spectrum slices 1 and 3, where slice 1 comes from GBS 1.
Let denote a drone deployment position. The set of drone deployment positions under the coverage of GBS m is denoted as with being its cardinality (i.e., the number of available DSCs). The fraction of resources from allocated to associated vehicles to support GBS-to-vehicle (G2V) communications is denoted as . The fraction of resources from allocated to the DSC associated with GBS m at for G2D communications is denoted as (). The slicing ratios satisfy
Two-level spectrum reusing is considered. In addition to reusing the resources among DSCs, we allow the DSCs not covered by a GBS to reuse the GBS’s spectrum. The interference to GBSs caused by the DSCs can be controlled via proper deployment of DSCs. Take Figure 2 as an example. The DSCs at and can reuse the spectrum resource , and the DSCs at and can reuse .
The key to resource slicing is to determine the optimal set of slicing ratios to maximize the entire network utility. After slicing the spectrum resources, the controller allocates the slices to each BS. The resources in each slice is further partitioned among associated vehicles.
2.2. Communication Model
As shown in Figure 3, a complex vector space is used to characterize the effect of vehicle direction and speed on distance calculation, where is the distance vector from vehicle i to GBS m, and represents the velocity vector of vehicle i. During a period of length , the distance vector of vehicle i is expressed as . By the addition or subtraction of complex vectors, the Euclidean distance from vehicle i to GBS m with the vehicle velocity vector is defined as
Similarly, in the case where a vehicle is associated with a drone, as shown in Figure 4, the horizontal distance between vehicle i and the drone at the location is defined as
Let denote the path loss from GBS m destined for vehicle i, which is quantified by substituting (3) into the method described by Ye et al. [27].
With the introduction of LoS probability, we characterize the drone channel. Compared with a non-LoS connection, an LoS connection has less attenuation, which improves spectrum efficiency. By substituting (4) into the aerial channel model proposed in [14,28], we express the LoS probability of the D2V link from a DSC at to vehicle i as
where is the horizontal distance between vehicle i and , and and are constants determined by the environment. Based on [14] and (4), the average path loss of the D2V link forms the DSC at to vehicle i, which is expressed as
In (6), () is the additional loss for LoS (NLoS) links, involving the impacts of shadowing components, c represents the speed of light, and is the carrier frequency.
The vehicle set under the coverage of GBS m is denoted by . Based on the proposed spectrum management framework, vehicle experiences two kinds of interference: from transmissions of other GBSs in and of DSCs under the coverage of GBSs in . Let and represent the transmit power of GBS m and the DSC at . The spectral efficiency at vehicle from GBS 1 is expressed as
where is the average background noise power. Similarly, the spectrum efficiency at vehicle from GBS 2, , can be obtained. The achievable transmission rates of vehicle i associated with GBS m can be expressed as
where is the amount of spectrum (out of ) allocated to vehicle i from GBS m.
For the DSC at , let and be the amount of spectrum allocated to vehicle i out of and . The spectrum efficiency at vehicle i with D2V communications include two parts in terms of and , expressed as
and
The achievable transmission rate of vehicle i associated with the DSC at is the summation of and . Similarly, denote as the amount of spectrum allocated to vehicle i associated with the DSC at from by the DSC at under the coverage of GBS 2 (). Then, similar to (9) and (10), the two parts of spectrum efficiencies at the vehicle from the DSC under the coverage of GBS 2, i.e., and , can be obtained, and the achievable transmission rate at vehicle i associated with the DSC at is the summation of and . If a DSC is associated with GBS m, indication variable is set to 1; otherwise 0. Given and , the achievable transmission rates of vehicle i associated with the DSC at can be expressed as
Let represent the three-dimensional coordinates of GBS m. The distance between and GBS m is calculated as . Since the DSC flying height is usually higher than that of a GBS, the G2D link is an LoS connection. Denote , , as the terrestrial path-loss exponent, angle offset, and excess path-loss offset. Denote and as excess path-loss scalar and angle scalar. The average path loss from GBS m to is [29]
where represents the elevation angle between the antennas of the DSC at and GBS m. Similar to (7), the DSC at associated with GBS 1 experiences two kinds of interference. Then, the spectral efficiency from GBS 1 destined for the DSC at is expressed as
The spectral efficiency from GBS 2 destined for the DSC at can be obtained in the same way.
Denote as the resources (out of ) allocated to vehicle i from GBS m. When GBS m selects a DSC at to relay data to vehicle i, the achievable transmission rate at the DSC at can be uniformly expressed as
2.3. DSC Coverage Model
Consider a realistic drone coverage model. For a DSC placed at , the effective coverage mainly depends on LoS probability and the path-loss threshold in free space [15,28], satisfying
In (15), is the LoS probability threshold for D2V links, and is the free space path-loss threshold, determined by the minimum signal-to-noise ratio for signal decoding.
In the model, flight altitude determines the effective DSC coverage. Similar to the model in [18], the effective ground coverage radius of a DSC flying to a height of can be expressed as
Take Figure 5 as an example to explain the influence of the flying height on , where , , , and are set to 4.88, 0.43, and 89 dB and 0.5, respectively. The relationship between height and effective coverage radius is not linear.
2.4. Traffic Model
Consider delay-sensitive traffic (e.g., rear-end collision avoidance, platooning). The average arrival rate and data packet length are denoted as (packet/s) and (bit). The effective bandwidth theory [6,27] is used to calculate the minimum transmission rate to guarantee that the downlink transmission delay exceeding at most probability is expressed as
For downlink transmission to accommodate vehicles’ delay-sensitive requests, we can adjust through resource allocation, providing a probabilistic guarantee for delivery delay and reliability.
3. Problem Formulation
In the proposed spectrum management framework, the challenging issue is to determine the optimal spectrum slicing ratios and the association patterns to maximize the aggregate network utility while satisfying the QoS requirement.
Let be the set of vehicles located within the effective coverage of the DSC at . If vehicle establishes a connection with the DSC at , the indication variable is set to 1; otherwise, 0. If a DSC at connects to GBS m, is set to 1; otherwise, set to 0. Once a DSC flies to GBSs’ coverage area, it automatically connects to the GBS with the highest spectral efficiency.
A logarithmic utility function, which is concave and with diminishing marginal utility, is applied to capture proportional fair resource division among heterogeneous BSs. Based on (11), the network utility achieved by all vehicles associated with the DSC at is expressed as
where represents the set of association patterns between vehicles and DSCs and is the strategy set for vehicle-level resource allocation for D2V communications. If vehicle i connects to GBS m, the indication variable is set to 1; otherwise, 0. The network utility achieved by all vehicles associated with GBS m is expressed as
where and . Given , the network utility at the DSC at to relay associated vehicles’ traffic is calculated as
with being the strategy set for vehicle-level resource allocation for the relaying from the DSC at to GBS m.
Based on the logarithmic utility function, an aggregate utility maximization problem is formulated as in , under the constraints of DSC deployment, transmission rates, association patterns, and resource partitioning.
The objective function of is the summation of utilities achieved by all vehicles (as receivers) and DSCs (as relays). Constraints (21a)–(21c) ensure that the achievable transmission rate at each receiver is not less than . Constraint (21d) ensures that each DSC can only connect to one BS. Constraints (21e)–(21g) state the resource allocation requirements for each DSC and GBS. Constraint (21i) is a combination of (1) and (2), reflecting the resource slicing requirement. Constraints (21k)–(21m) demonstrate the requirements on resource allocation for each vehicle.
contains a nonlinear objective function and constraints, a mixed-integer nonlinear programming problem. Each vehicle’s spectrum allocation relies on association patterns and resource slicing, making problem solving difficult. For tractability, we first determine the optimal fractions and and allocated to vehicle i from the DSC at or GBS m, given , , and .
4. Solution to 1
In this section, we present a problem approximation method that separates the association schema and resource slice subproblems from Problem to facilitate processing. 1 is transformed into a biconcave optimization problem for mathematical tractability. We then design an alternate concave search algorithm to solve vehicle association patterns iteratively.
4.1. Problem Approximation
We simplify by expressing , , and as a function of to reduce the number of decision variables.
In , is a function of , indicating the aggregate utility of vehicles associated with the DSC at .
represents the aggregate utility of vehicles associated with GBS m, given by
denotes the utility of relaying vehicles’ traffic via the DSC at , given by
Based on (22)–(24), can be reformulated as .
Since , , and in are thee independent decision variable sets with uncoupled constraints, can be decomposed to three subproblems, , , and :
Proposition 1.
The solutions for , , and are (25)–(27).
The proof of Proposition 1 is given in Appendix A.1.
Proposition 1 indicates that the optimal fractions of resources allocated to vehicles from the associated GBSs/DSCs are equal partitioning.
From (25)–(27), the values of , , and are determined by , , and , respectively. Accordingly, we redefine , , and as
Based on (25)–(28), we reformulate as .
As , , and are coupled under (21i), cannot be decoupled in the same way as . is a mixed-integer combinatorial problem, which is difficult to solve. Therefore, it is necessary to transform into a tractable form.
4.2. Problem Transformation
To solve , we relax 0-1 variables in the sets and to real-valued variables contained in and , with and . is with substituted by . and can be considered as the probability of establishing the vehicle association in each spectrum slicing period [27].
Proposition 2.
The functions , , and are biconcave on the decision variable set .
The proof of Proposition 2 is given in Appendix A.2.
With the variable relaxation, is transformed to .
Constraints (30a) and (30b) belong to linear inequality constraint functions, and constraint (30d) is an affine equality constraint function. Note that , , and are , , and with and substituted by and . Constraint (30a) actually indicates that if the DSC at is associated with GBS m with , the spectrum resource allocation for the vehicle should satisfy
Constraints (30b) and (30c) indicate that if , the vehicle’s resource allocation should satisfy
and
Constraints (31)–(33) in indicate the limit on the number of vehicles associated with GBSs/DSCs given .
We next simplify to by substituting (30a)–(30c) with (31)–(33), respectively, to make tractable.
Compared with constraint (30a) in , constraint (31) in provides the lowest upper bound on the number of vehicles that can be associated with GBS m. Similarly, compared with constraints (30b) and (30c) in , constraints (32) and (33) in provide the lowest upper bound on the number of vehicles that can be associated with the DSC at .
4.3. Algorithm Design
is a biconcave maximization problem due to the biconcave objective function and the set of biconvex constraint functions for the biconvex decision variable set . We first summarize the concavity property of .
Corollary 1.
The objective function of is a biconcave function on the variable set , and is a biconcave optimization problem.
The proof of Corollary 1 is given in Appendix A.3.
Corollary 2.
Algorithm 1 can converge to a set of optimal solutions .
The proof of Corollary 2 is given in Appendix A.4.
| Algorithm 1: Alternate_search_algorithm |
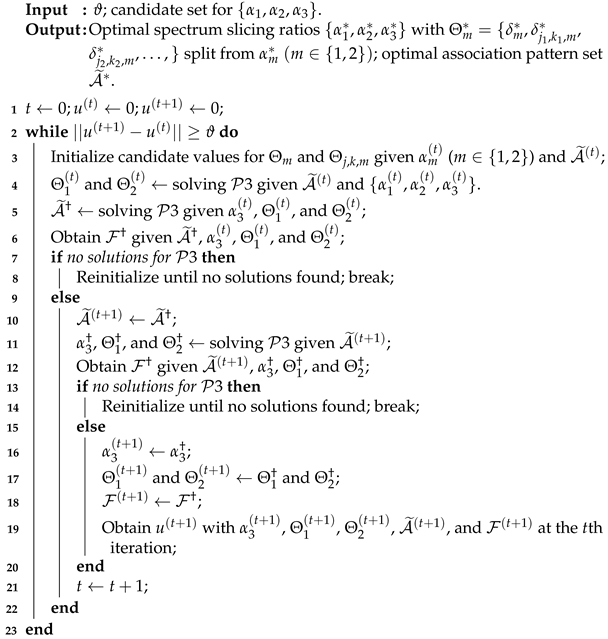 |
By exploring the biconcavity, we develop an alternate search algorithm to solve , summarized in Algorithm 1. The main logic is to iteratively solve optimal association patterns and optimal spectrum slicing ratios to maximize the objective function. In the th iteration, given a spectrum slicing ratio set, , and an association pattern set, , from the tth iteration, is solved to find a better association pattern set, with . To control computational complexity, we reduce the space of candidate slicing ratios. Let denote the maximum objective function value with at the beginning of the tth iteration. If the difference between and is less than the threshold , the iteration stops, and the algorithm converges to a set of optimal solutions, and ; otherwise, start the next iteration until it converges. As stated in Corollary 2, the algorithm can converge.
5. Performance Evaluation
Extensive simulations are carried out to verify the effectiveness of the proposed solution. All the simulations are carried out using MATLAB and Python and run on a computer with an Intel Core i3 processor and 8 GB RAM. Consider a scenario with two adjacent GBSs and multiple DSCs. Each GBS’s height and coverage radius are set to 10 and 800 m. The DSC flying height range on each x-y plane coordinate is [0, 200 m] with an adjacent height interval of 10 m, and the horizontal movement range on the x-y coordinate plane is set to [ m, 1600 m]. The DSC’s effective coverage at different heights is determined by (16). The number of DSCs and DSCs’ flight altitude determine the drone coverage ratio. Each GBS (DSC) has the same downlink transmit power of 46 dBm (24 dBm). Each lane’s vehicle density range is set to [0.05, 0.5] v/m, where the minimum vehicle distance is 5 m. The average rate of packet arrivals is 4 packet/s. The packet length () is 1048 bit. The packet deadline bound and deadline bound violation probability are 0.001 s and . Table 2 lists other important parameters.
The proposed scheme is categorized as versions I and II. The former is a full-featured version with flight altitude adaptation as in [18], while the latter does not allow DSCs to reuse GBSs’ spectrum resources.
For comparison, we provide two baseline schemes:
Each baseline is further categorized as versions I and II. The former uses the same dynamic DSC deployment as the proposed scheme, while the latter is with static deployment.
5.1. Impact of Available Spectrum Resources
The first simulation examines network throughput, presented as the system’s aggregate transmission rate. The average vehicle density is set to 0.1 vehicles/meter (v/m). Figure 6 compares the throughputs achieved by different approaches where two DSCs are deployed. As more resources are allocated, the amount provisioned per vehicle increases, leading to higher transmission rates. The throughput of the proposed scheme rises more rapidly than other schemes.
Additionally, dynamic DSC deployment outperforms static deployment. Specifically, the proposed scheme’s minimum spectrum resource requirement is 5 MHz, while at least 7 and 8 MHz are needed by the max-SINR and max-Cov schemes, respectively. Owing to efficient spectrum reuse and slicing, the proposed scheme’s network throughput is on average over 30% higher than the max-SINR scheme and over 45% higher on average than the max-Cov scheme.
In Figure 7, the starting point on the left represents the lower bound of resources required by different strategies under QoS constraints. As more DSCs are added, more vehicles can connect to DSCs, and overall spectrum utilization increases. Resource partitioning depends largely on DSC deployment and vehicle distribution. The proposed scheme achieves higher throughput than baselines given the same resource budget. The results demonstrate the proposed scheme’s ability to improve network throughput through dynamic resource allocation. The gains are achieved by maximizing spectrum reuse and slicing efficiency under QoS requirements.
5.2. Impact of Vehicle Density
In the following simulation, the amount of available spectrum resources is 20 MHz. Figure 8 shows the impact of average vehicle density on the minimum spectrum resource consumption for different methods. Increasing vehicle density leads to greater demand for spectrum resources. The proposed scheme’s minimum spectrum consumption is on average over 15% lower than the max-SINR scheme and over 25% lower on average than the max-Cov scheme, with a slower growth trend as vehicle density rises.
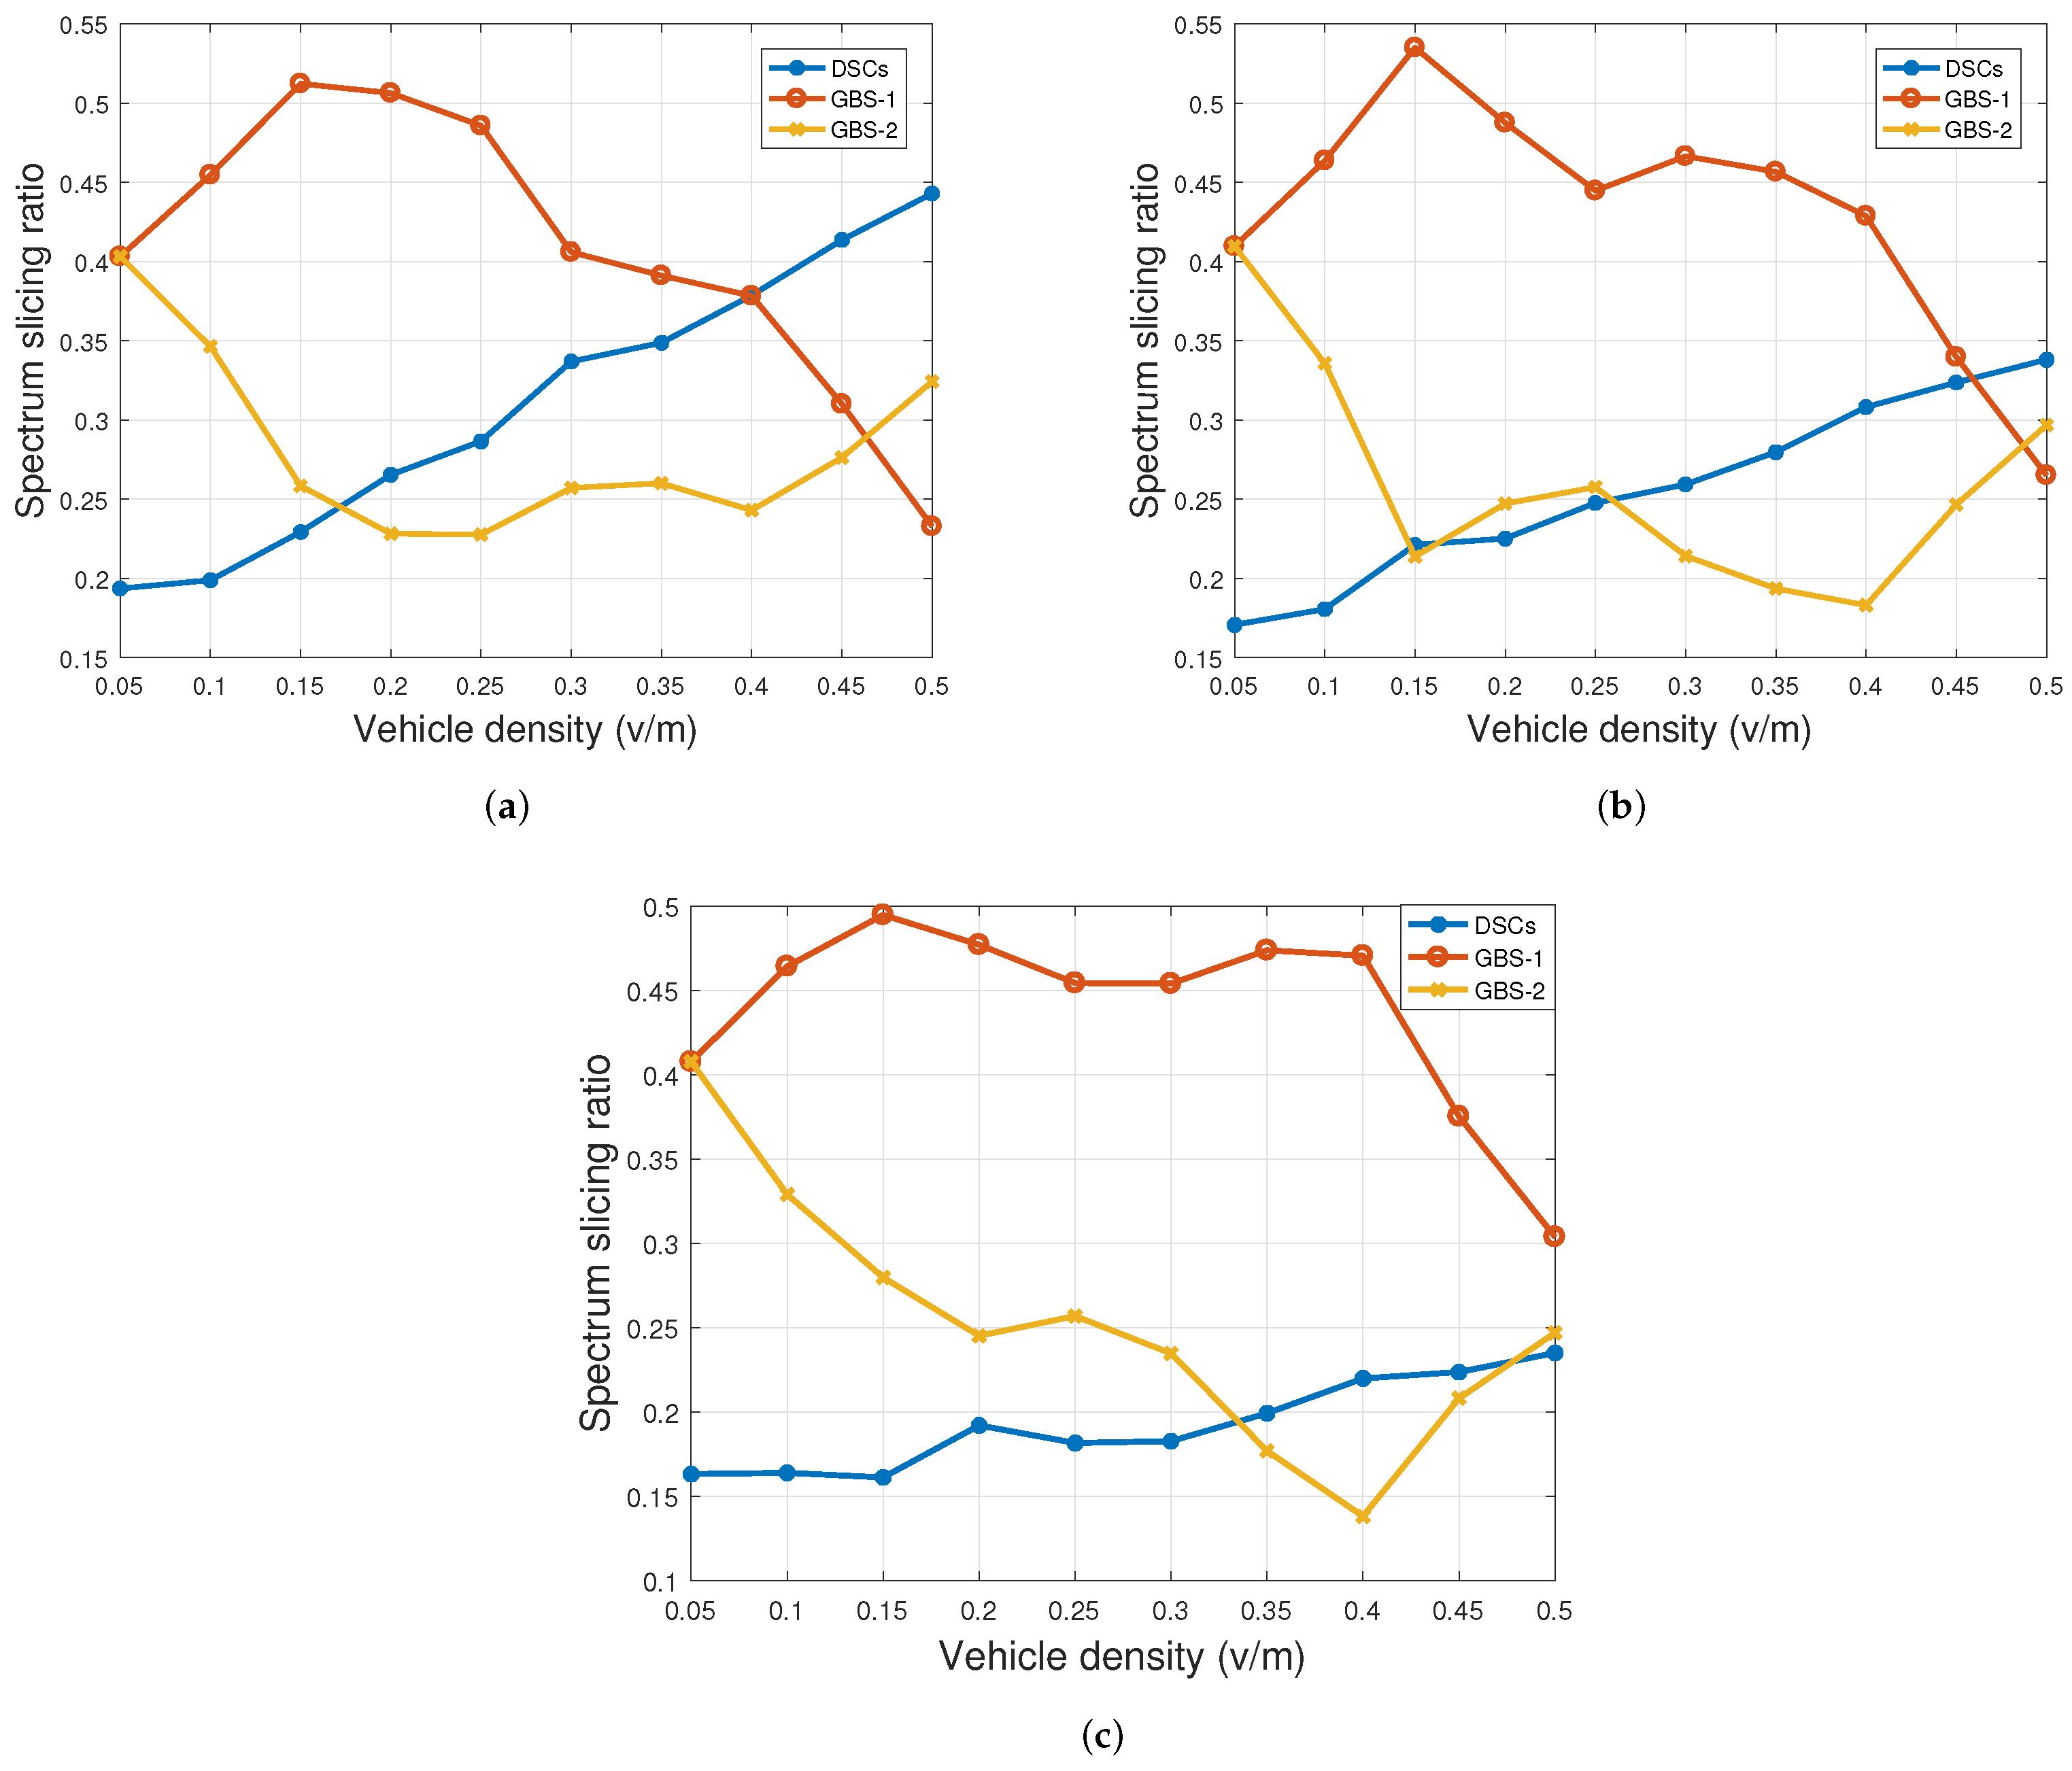
In Figure 9, increasing the number of DSCs can significantly improve spectrum utilization and throughput. The proposed method can more effectively leverage DSCs for spectrum reuse and partitioning. From Figure 10, the resource slicing ratios are adjusted accordingly as the average vehicle density grows from 0.05 to 0.5 v/m. A higher vehicle density makes spectrum resources more scarce, prompting more vehicles to connect to DSCs and increasing the resource portion allocated to DSCs. The proposed intelligent resource management is efficient, especially in dense vehicular scenarios. The dynamic spectrum slicing balances the resource allocation between GBSs and DSCs based on real-time demand.
The cooperation of drones enables the network to accommodate more vehicle access. Nonetheless, connected vehicles are a dynamic environment. The management of UAV deployment, resource allocation, and vehicle association must be brought into a unified framework to play the role of different platforms.
6. Conclusions
In this paper, we have proposed a spectrum management framework for drone-assisted vehicular networks. The goal is to maximize network utility subject to QoS constraints. The network utility maximization problem is formulated to determine vehicle–DSC association patterns and spectrum partitioning among heterogeneous BSs. The optimization problem is further transformed into a tractable biconcave form, followed by an alternate search algorithm to obtain optimal spectrum slicing ratios and association patterns. Simulation results demonstrate that the proposed method has advantages in throughput and spectrum utilization. The proposed framework is scalable and has the potential to be used to support content distribution in air-ground integrated vehicular networks. Our ongoing work will design a distributed machine-learning-based resource slicing method to adapt to large-scale vehicular network scenarios where multiple services coexist.
Author Contributions
H.S. put forward the original ideas and performed the research, Y.H. performed the experiments and analyzed the data, T.W. provided useful comments, and G.B. raised the research question and reviewed this paper. All authors have read and agreed to the published version of the manuscript.
Funding
This research was funded by the National Natural Science Foundation of China under Grants 61502230 and 61501224, the Natural Science Foundation of Jiangsu Province under Grant BK20201357, and the Six Talent Peaks Project in Jiangsu Province under Grant RJFW-020.
Data Availability Statement
Not applicable.
Conflicts of Interest
The authors declare no conflict of interest.
Appendix A
Appendix A.1. Proof of Proposition 1
Since DSCs reuse the slice , and each vehicle can only connect to one BS, can be decoupled into items, each for one DSC. According to (22), each item has four parts. For the first part, we construct the subproblem .
The objective function of can be further derived as
In (A2), can be seen as a constant independent of . Therefore, is equivalent to
Since the geometric average is not larger than the arithmetic average, we have
Under (A1a) and (A1b), the optimal resource allocation for vehicle i associated with the DSC at is obtained by (27).
The remaining proofs for (26) and (27) are similar, which are omitted here.
Appendix A.2. Proof of Proposition 2
Substituting (25) into , we have
By stating an equation for the coefficients using the indices and , we express the Hessian matrix of (A4) regarding as
For any nonzero vector , in the case of , we have
Since the Hessian matrix is negative definite, is a concave function with respect to for any given , and the reverse is also true.
Substituting (27) into , we have
The element in the Hessian matrix of with respect to is expressed as
In the case of and , we have
Since the matrix is negative definite, is a concave function in terms of for any given , and the reverse is also true.
The proof for is similar, which is omitted here.
Appendix A.3. Proof of Corollary 1
The objective function of is a non-negative linear combination of a set of biconcave functions, which also belongs to a biconcave function on the variable set [30].
Appendix A.4. Proof of Corollary 2
are closed sets, and the objective function of is continuous on its domain. To verify the uniqueness of and at the end of the t-th iteration, we refer to the proof of Corollary 1 that, given , the objective function of is a concave function of . Conversely, given , the objective function is also concave in terms of . Therefore, Algorithm 1 can converge to and .
References
- Zhuang, W.; Ye, Q.; Lyu, F.; Cheng, N.; Ren, J. SDN/NFV-Empowered Future IoV with Enhanced Communication, Computing, and Caching. Proc. IEEE 2020, 108, 274–291. [Google Scholar] [CrossRef]
- Chen, S.; Hu, J.; Shi, Y.; Zhao, L.; Li, W. A Vision of C-V2X: Technologies, Field Testing, and Challenges with Chinese Development. IEEE Internet Things J. 2020, 7, 3872–3881. [Google Scholar] [CrossRef]
- Shen, X.; Gao, J.; Wu, W.; Lyu, K.; Li, M.; Zhuang, W.; Li, X.; Rao, J. AI-assisted network-slicing based next-generation wireless networks. IEEE Open J. Veh. Technol. 2020, 1, 45–66. [Google Scholar] [CrossRef]
- Shi, W.; Li, J.; Cheng, N.; Lyu, F.; Shen, X. Multi-Drone 3D Trajectory Planning and Scheduling in Drone Assisted Radio Access Networks. IEEE Trans. Veh. Technol. 2019, 68, 8145–8158. [Google Scholar] [CrossRef]
- Liu, J.; Kato, N. A Markovian analysis for explicit probabilistic stopping-based information propagation in postdisaster ad hoc mobile networks. IEEE Trans. Wirel. Commun. 2015, 15, 81–90. [Google Scholar] [CrossRef]
- Peng, H.; Ye, Q.; Shen, X. Spectrum Management for Multi-Access Edge Computing in Autonomous Vehicular Networks. IEEE Trans. Intell. Transp. Syst. 2020, 21, 3001–3012. [Google Scholar] [CrossRef]
- Peng, H.; Shen, X. Multi-Agent Reinforcement Learning Based Resource Management in MEC- and UAV-Assisted Vehicular Networks. IEEE J. Sel. Areas Commun. 2021, 39, 131–141. [Google Scholar] [CrossRef]
- Ye, Q.; Shi, W.; Qu, K.; He, H.; Zhuang, W.; Shen, X. Joint RAN slicing and computation offloading for autonomous vehicular networks: A learning-assisted hierarchical approach. IEEE Open J. Veh. Technol. 2021, 2, 272–288. [Google Scholar] [CrossRef]
- Riggio, R.; Bradai, A.; Harutyunyan, D.; Rasheed, T.; Ahmed, T. Scheduling wireless virtual networks functions. IEEE Trans. Netw. Serv. Manag. 2016, 13, 240–252. [Google Scholar] [CrossRef]
- Yi, B.; Wang, X.; Li, K.; Huang, M. A comprehensive survey of network function virtualization. Comput. Netw. 2018, 133, 212–262. [Google Scholar] [CrossRef]
- Shen, X.; Gao, J.; Wu, W.; Li, M.; Zhou, C.; Zhuang, W. Holistic Network Virtualization and Pervasive Network Intelligence for 6G. IEEE Commun. Surv. Tutor. 2022, 24, 1–30. [Google Scholar] [CrossRef]
- Zarandi, S.; Tabassum, H. Delay minimization in sliced multi-cell mobile edge computing (MEC) systems. IEEE Commun. Lett. 2021, 25, 1964–1968. [Google Scholar] [CrossRef]
- Yan, Z.; Tabassum, H. Reinforcement Learning for Joint V2I Network Selection and Autonomous Driving Policies. arXiv 2022, arXiv:2208.02249. [Google Scholar]
- Sun, X.; Ansari, N. Jointly optimizing drone-mounted base station placement and user association in heterogeneous networks. In Proceedings of the IEEE ICC, Kansas City, MO, USA, 20–24 May 2018; pp. 1–6. [Google Scholar]
- Shi, W.; Li, J.; Xu, W.; Zhou, H.; Zhang, N.; Zhang, S.; Shen, X. Multiple drone-cell deployment analyses and optimization in drone assisted radio access networks. IEEE Access 2018, 6, 12518–12529. [Google Scholar] [CrossRef]
- Li, Y.; Cai, L. UAV-assisted dynamic coverage in a heterogeneous cellular system. IEEE Netw. 2017, 31, 56–61. [Google Scholar] [CrossRef]
- Cheng, N.; Lyu, F.; Quan, W.; Zhou, C.; He, H.; Shi, W.; Shen, X. Space/Aerial-Assisted Computing Offloading for IoT Applications: A Learning-Based Approach. IEEE J. Sel. Areas Commun. 2019, 37, 1117–1129. [Google Scholar] [CrossRef]
- Shen, H.; Ye, Q.; Zhuang, W.; Shi, W.; Bai, G.; Yang, G. Drone-Small-Cell-Assisted Resource Slicing for 5G Uplink Radio Access Networks. IEEE Trans. Veh. Technol. 2021, 70, 7071–7086. [Google Scholar] [CrossRef]
- Zhang, N.; Zhang, S.; Yang, P.; Alhussein, O.; Shen, X. Software Defined Space-Air-Ground Integrated Vehicular Networks: Challenges and Solutions. IEEE Commun. Mag. 2017, 55, 101–109. [Google Scholar] [CrossRef]
- He, Y.; Zhai, D.; Jiang, Y.; Zhang, R. Relay Selection for UAV-Assisted Urban Vehicular Ad Hoc Networks. IEEE Wirel. Commun. Lett. 2020, 9, 1379–1383. [Google Scholar] [CrossRef]
- Wu, H.; Chen, J.; Zhou, C.; Shi, W.; Cheng, N.; Xu, W.; Zhuang, W.; Shen, X.S. Resource Management in Space-Air-Ground Integrated Vehicular Networks: SDN Control and AI Algorithm Design. IEEE Wirel. Commun. 2020, 27, 52–60. [Google Scholar] [CrossRef]
- Lyu, F.; Yang, P.; Wu, H.; Zhou, C.; Ren, J.; Zhang, Y.; Shen, X. Service-Oriented Dynamic Resource Slicing and Optimization for Space-Air-Ground Integrated Vehicular Networks. IEEE Trans. Intell. Transp. Syst. 2022, 23, 7469–7483. [Google Scholar] [CrossRef]
- Han, R.; Wen, Y.; Bai, L.; Liu, J.; Choi, J. Age of Information Aware UAV Deployment for Intelligent Transportation Systems. IEEE Trans. Intell. Transp. Syst. 2021, 23, 2705–2715. [Google Scholar] [CrossRef]
- Kishk, M.; Bader, A.; Alouini, M.S. Aerial base station deployment in 6G cellular networks using tethered drones: The mobility and endurance tradeoff. IEEE Veh. Technol. Mag. 2020, 15, 103–111. [Google Scholar] [CrossRef]
- Azimi, Y.; Yousefi, S.; Kalbkhani, H.; Kunz, T. Energy-Efficient Deep Reinforcement Learning Assisted Resource Allocation for 5G-RAN Slicing. IEEE Trans. Veh. Technol. 2022, 71, 856–871. [Google Scholar] [CrossRef]
- Duan, Q.; Ansari, N.; Toy, M. Software-defined network virtualization: An architectural framework for integrating SDN and NFV for service provisioning in future networks. IEEE Netw. 2016, 30, 10–16. [Google Scholar] [CrossRef]
- Ye, Q.; Zhuang, W.; Zhang, S.; Jin, A.L.; Shen, X.; Li, X. Dynamic radio resource slicing for a two-tier heterogeneous wireless network. IEEE Trans. Veh. Technol. 2018, 67, 9896–9910. [Google Scholar] [CrossRef]
- Al-Hourani, A.; Kandeepan, S.; Lardner, S. Optimal LAP altitude for maximum coverage. IEEE Wirel. Commun. Lett. 2014, 3, 569–572. [Google Scholar] [CrossRef]
- Al-Hourani, A.; Gomez, K. Modeling Cellular-to-UAV Path-Loss for Suburban Environments. IEEE Wirel. Commun. Lett. 2018, 7, 82–85. [Google Scholar] [CrossRef]
- Gorski, J.; Pfeuffer, F.; Klamroth, K. Biconvex sets and optimization with biconvex functions: A survey and extensions. Math. Methods Oper. Res. 2007, 66, 373–407. [Google Scholar] [CrossRef]
Figure 1.
Drone-small-cell-assisted cellular vehicular networks.

Figure 2.
Spectrum management framework.

Figure 3.
Mobility-aware distance calculation when a vehicle is associated with GBS m (Case-1).
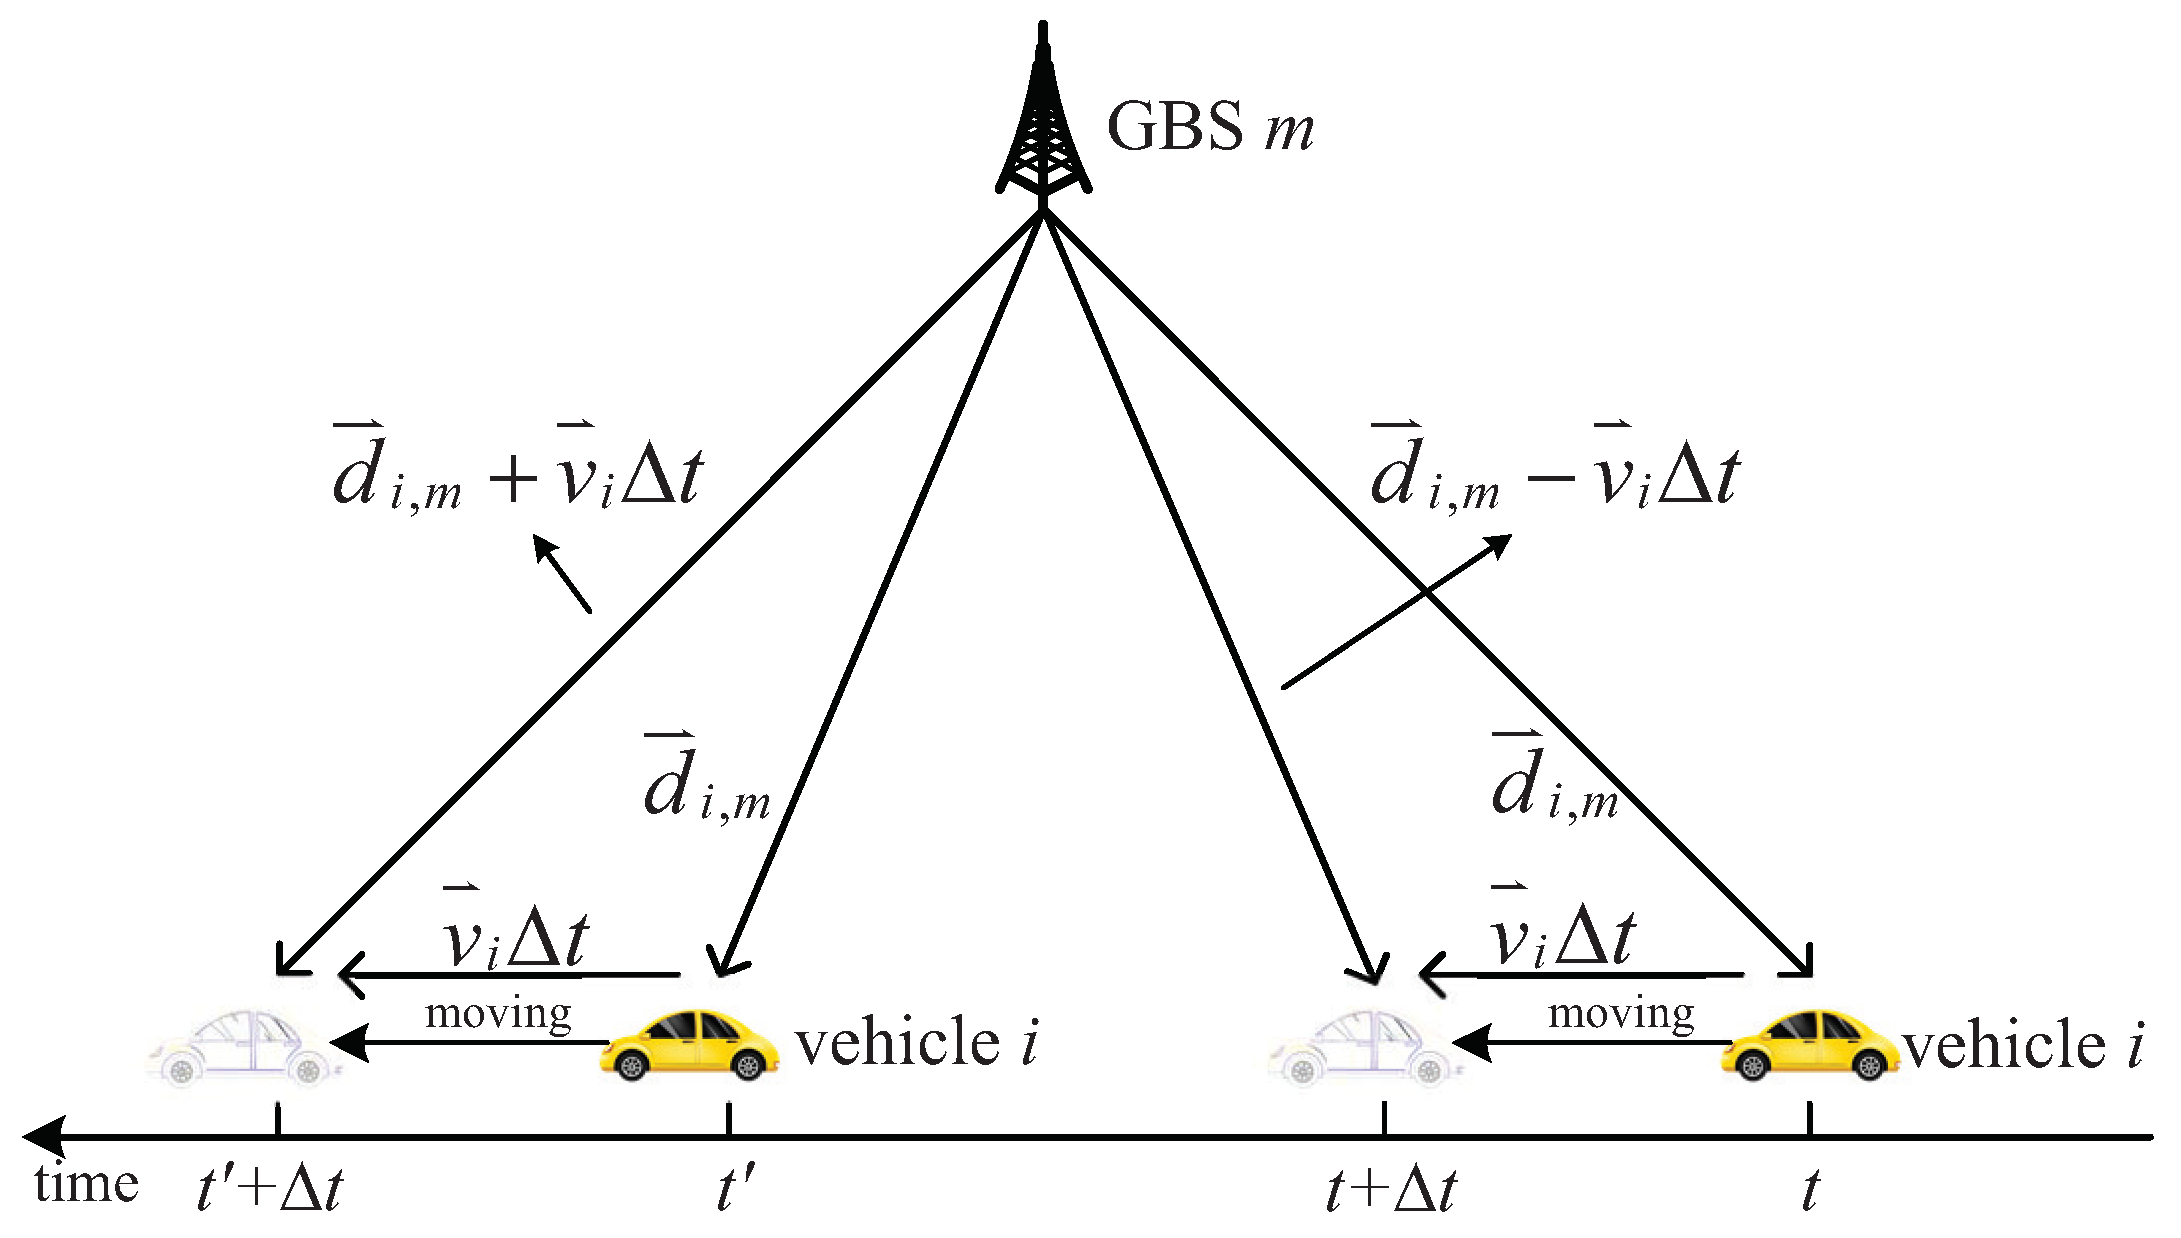
Figure 4.
Mobility-aware distance calculation when a vehicle is associated with a drone (Case-2).
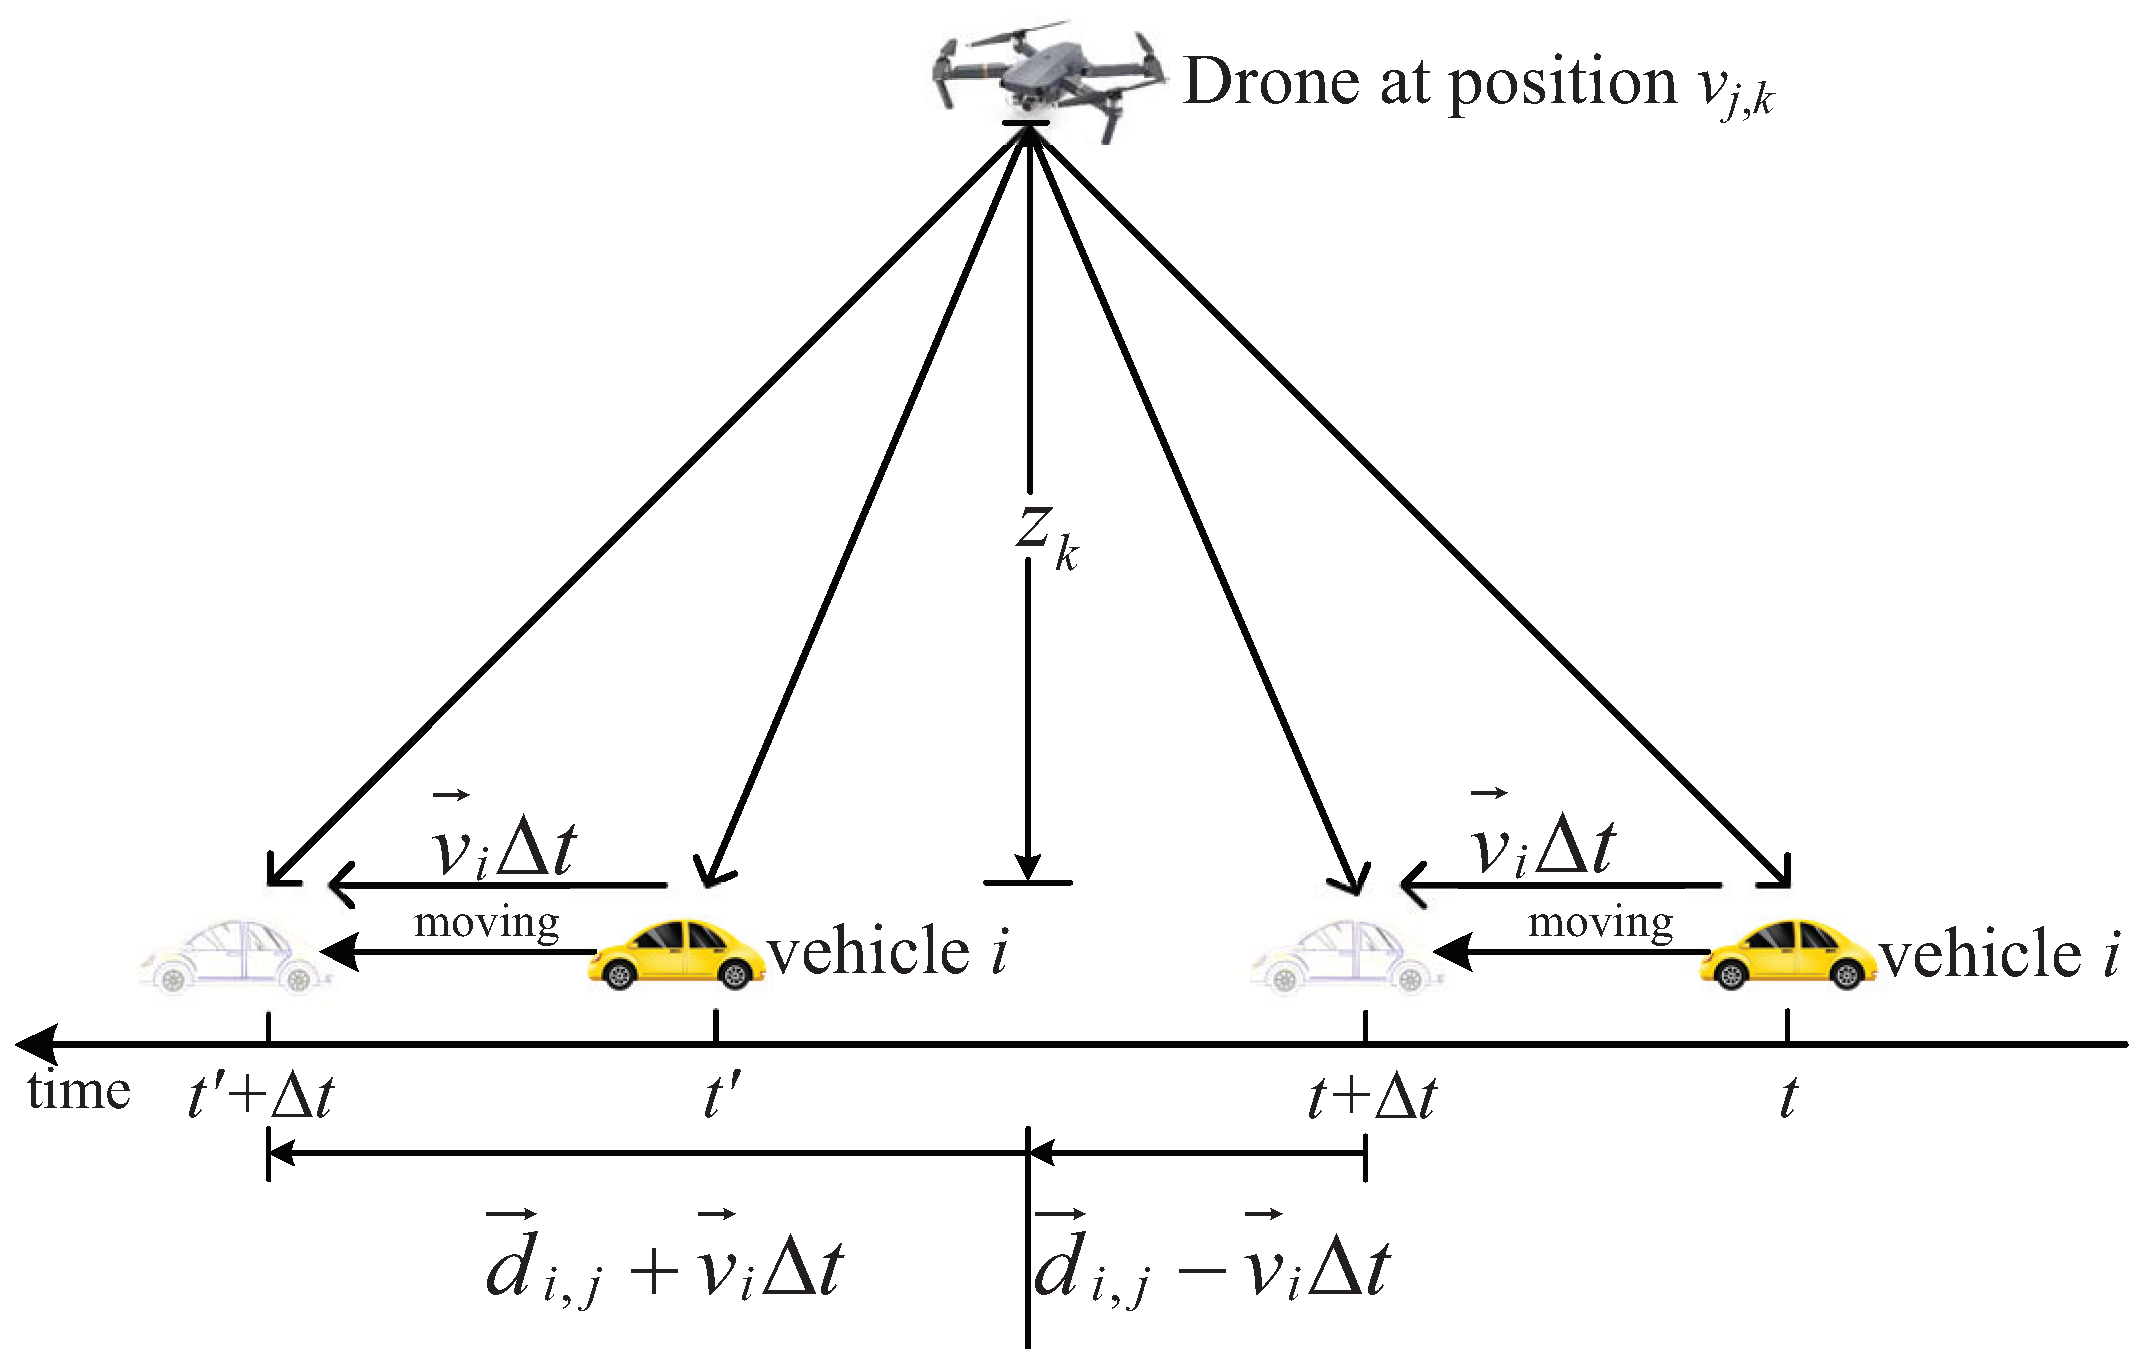
Figure 5.
Impact of flight altitude on effective coverage radius.
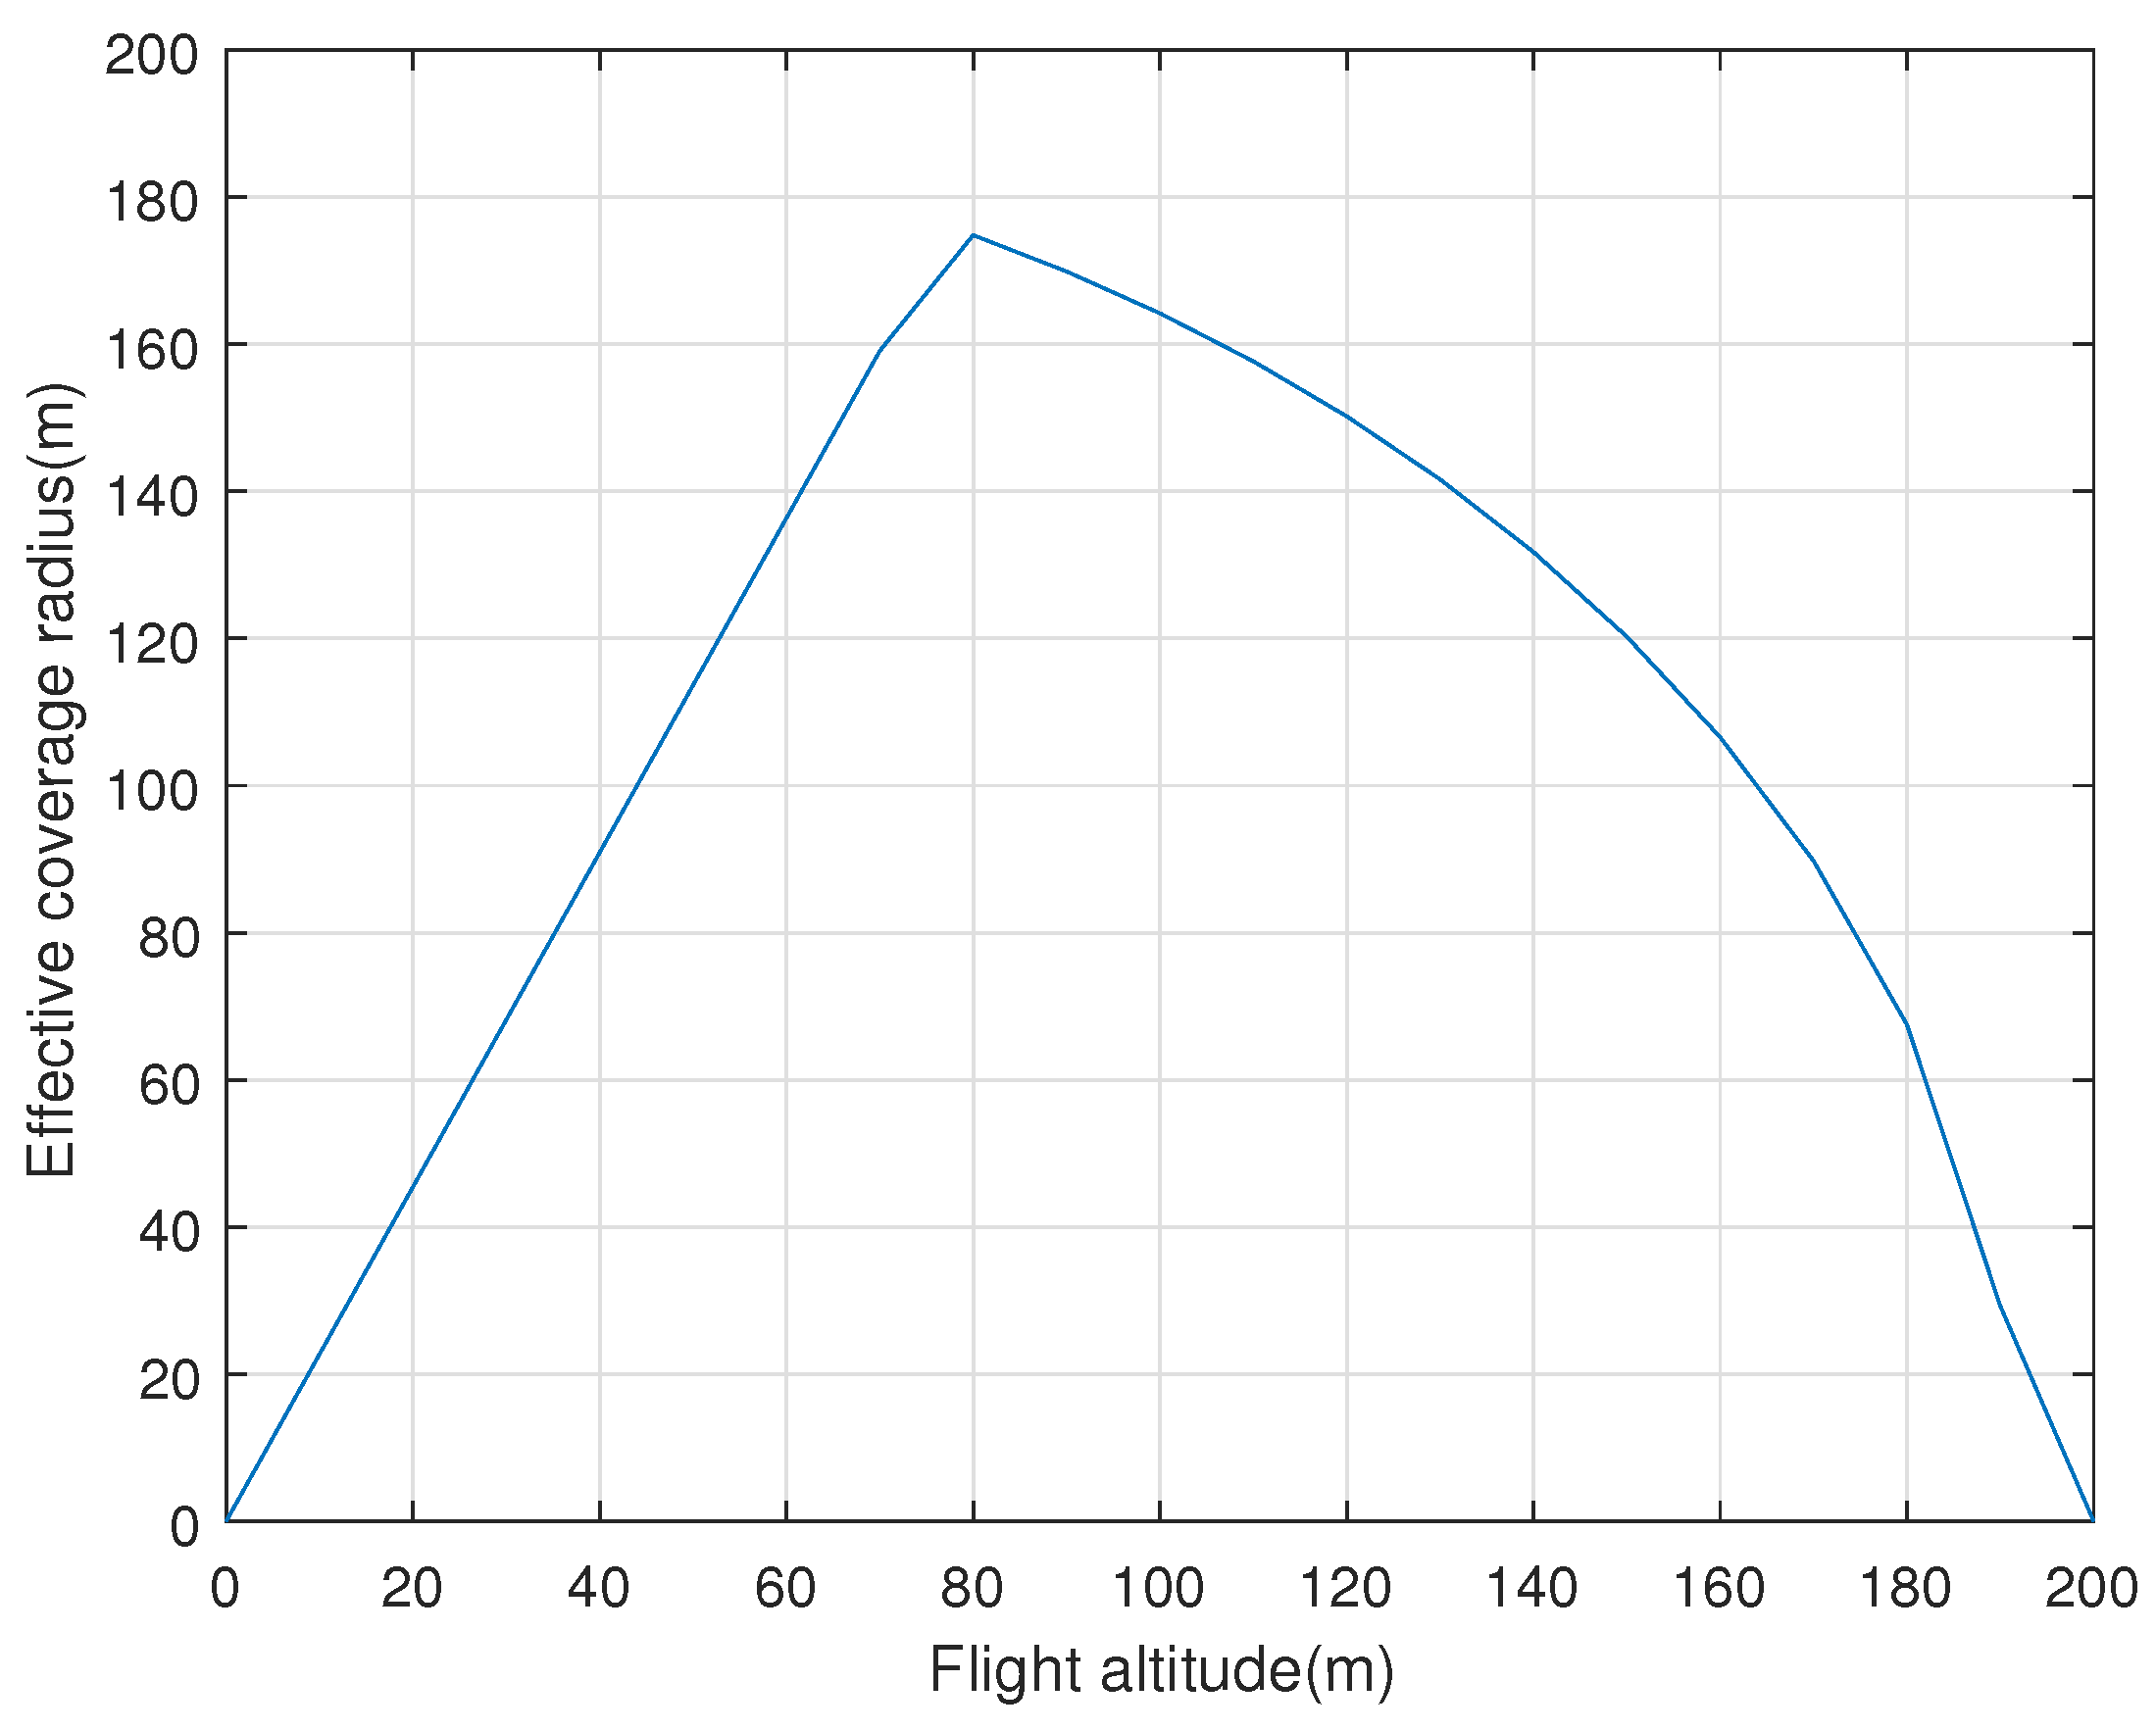
Figure 6.
Impact of spectrum resources on different schemes.
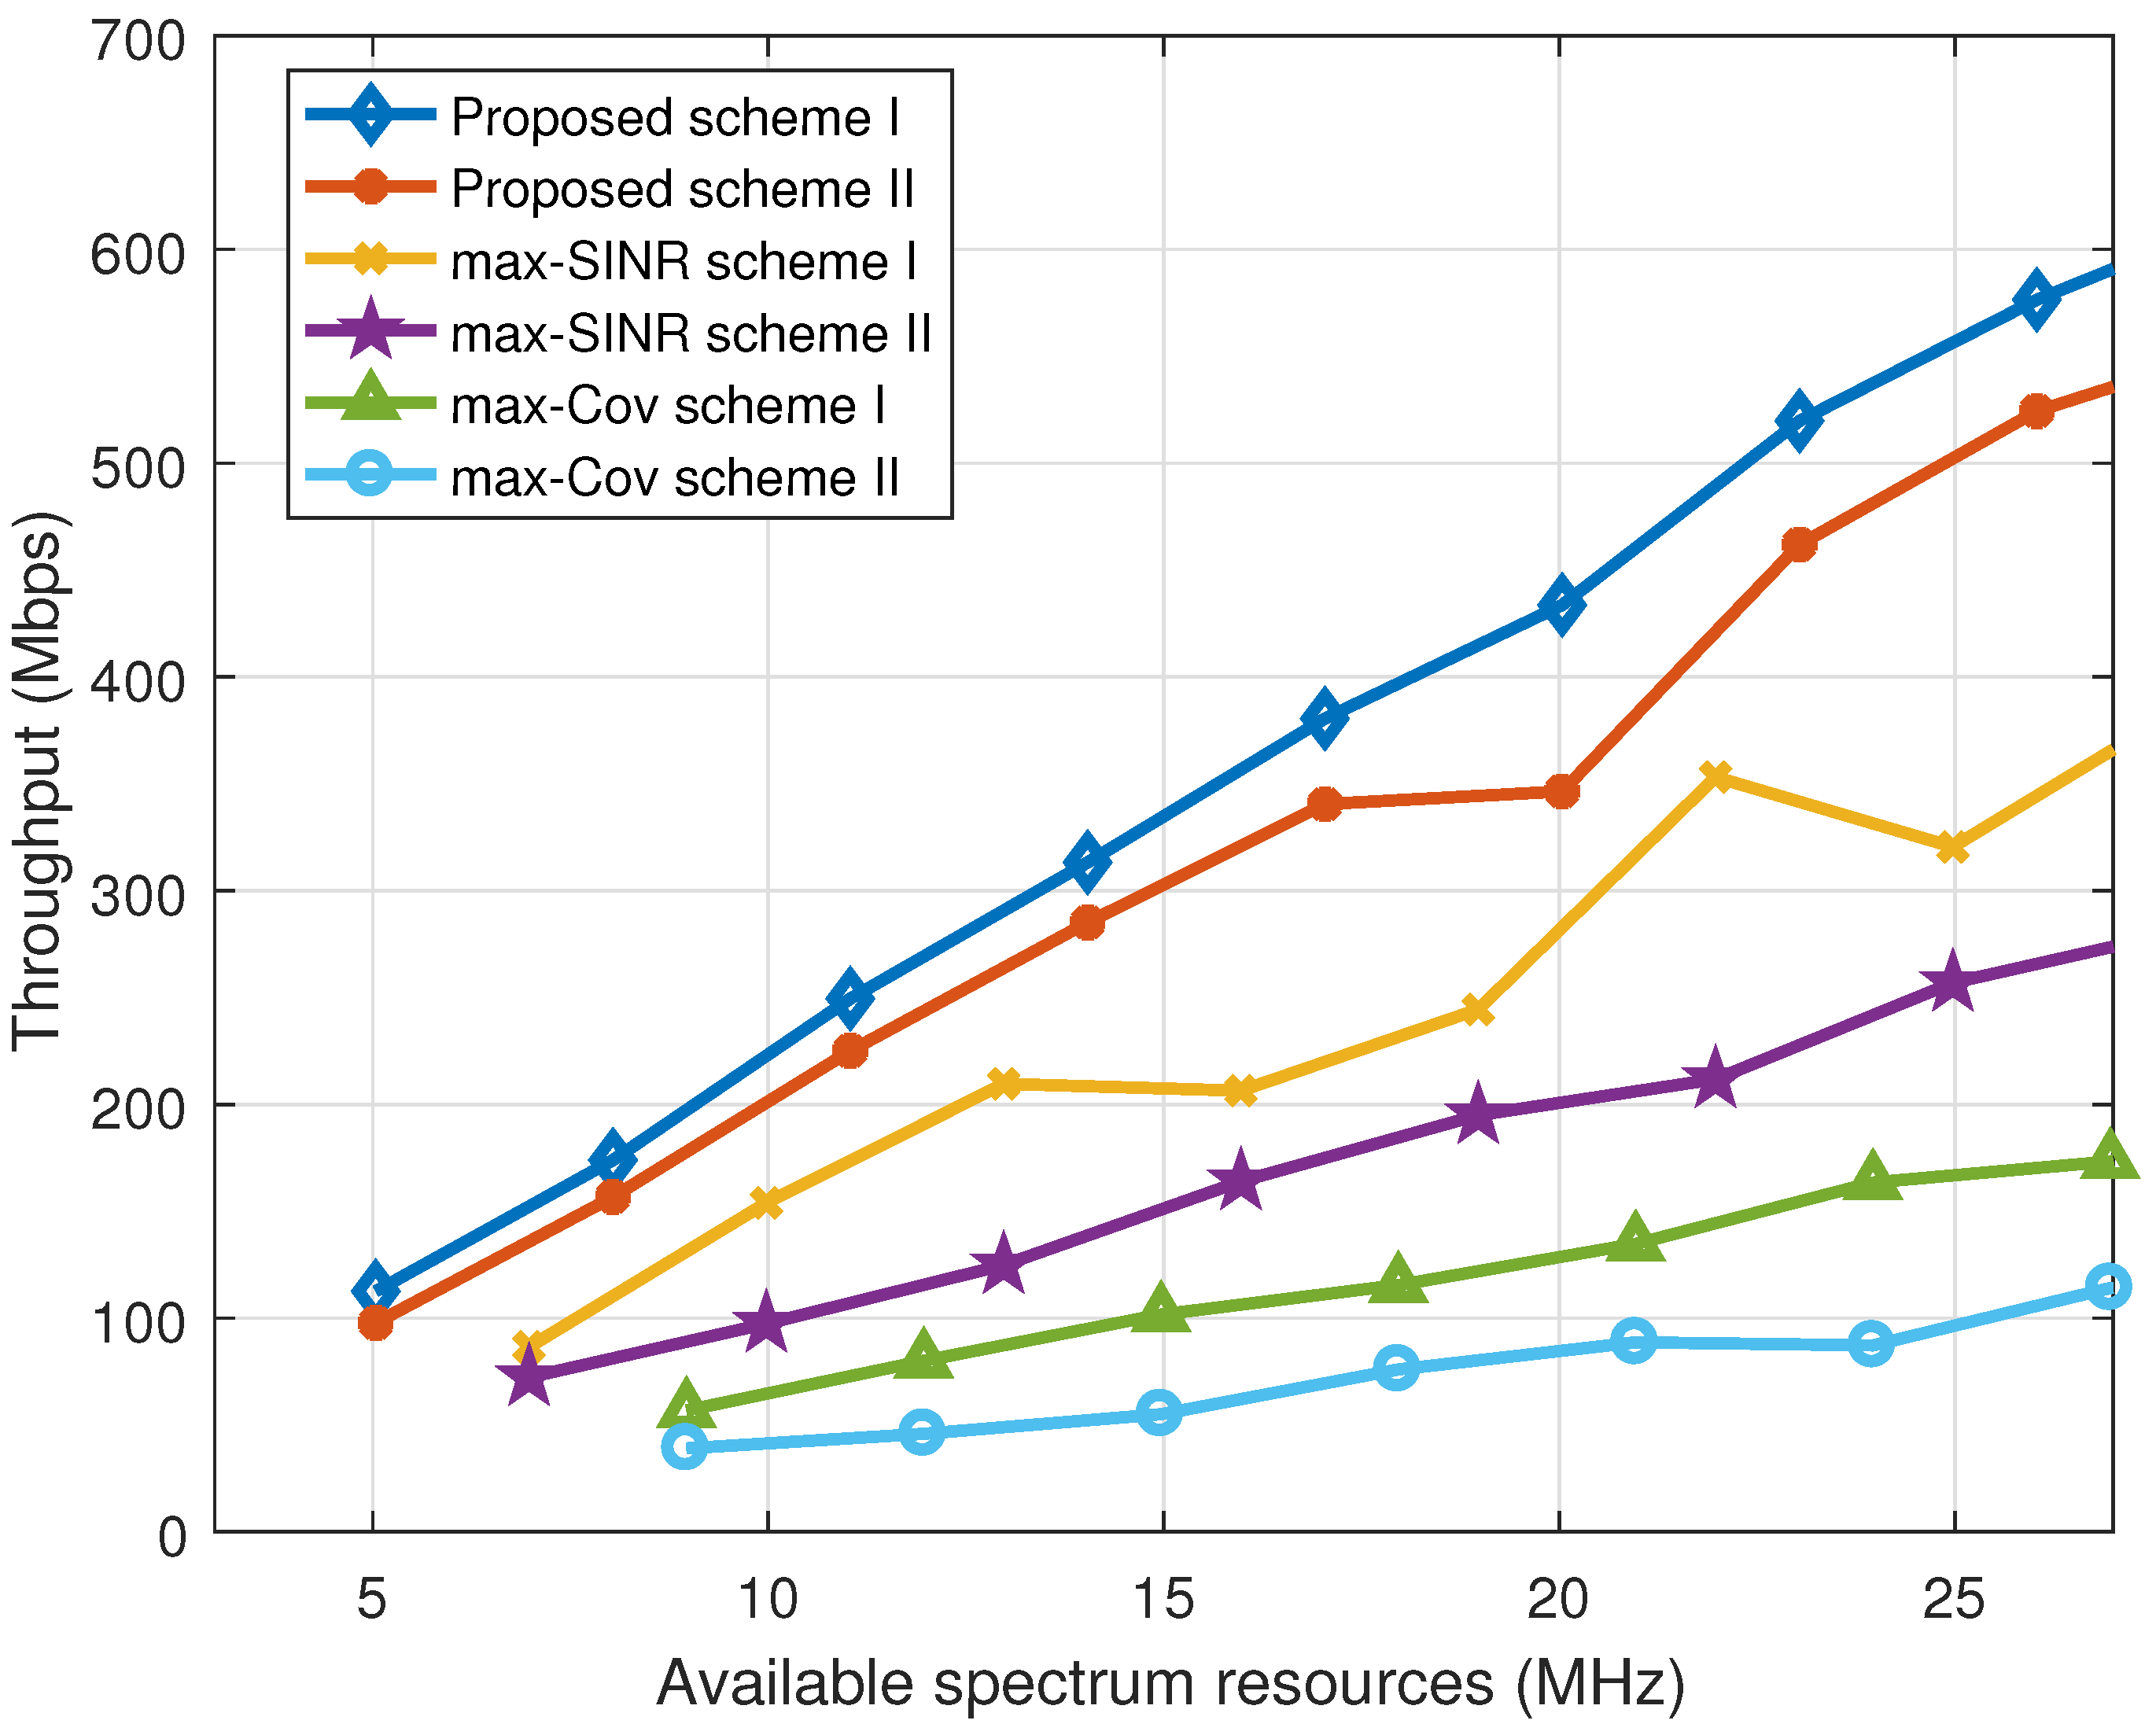
Figure 7.
Impact of spectrum resources and the number of DSCs: (a) proposed scheme I, (b) max-SINR scheme I, (c) max-Cov scheme I.
Figure 7.
Impact of spectrum resources and the number of DSCs: (a) proposed scheme I, (b) max-SINR scheme I, (c) max-Cov scheme I.
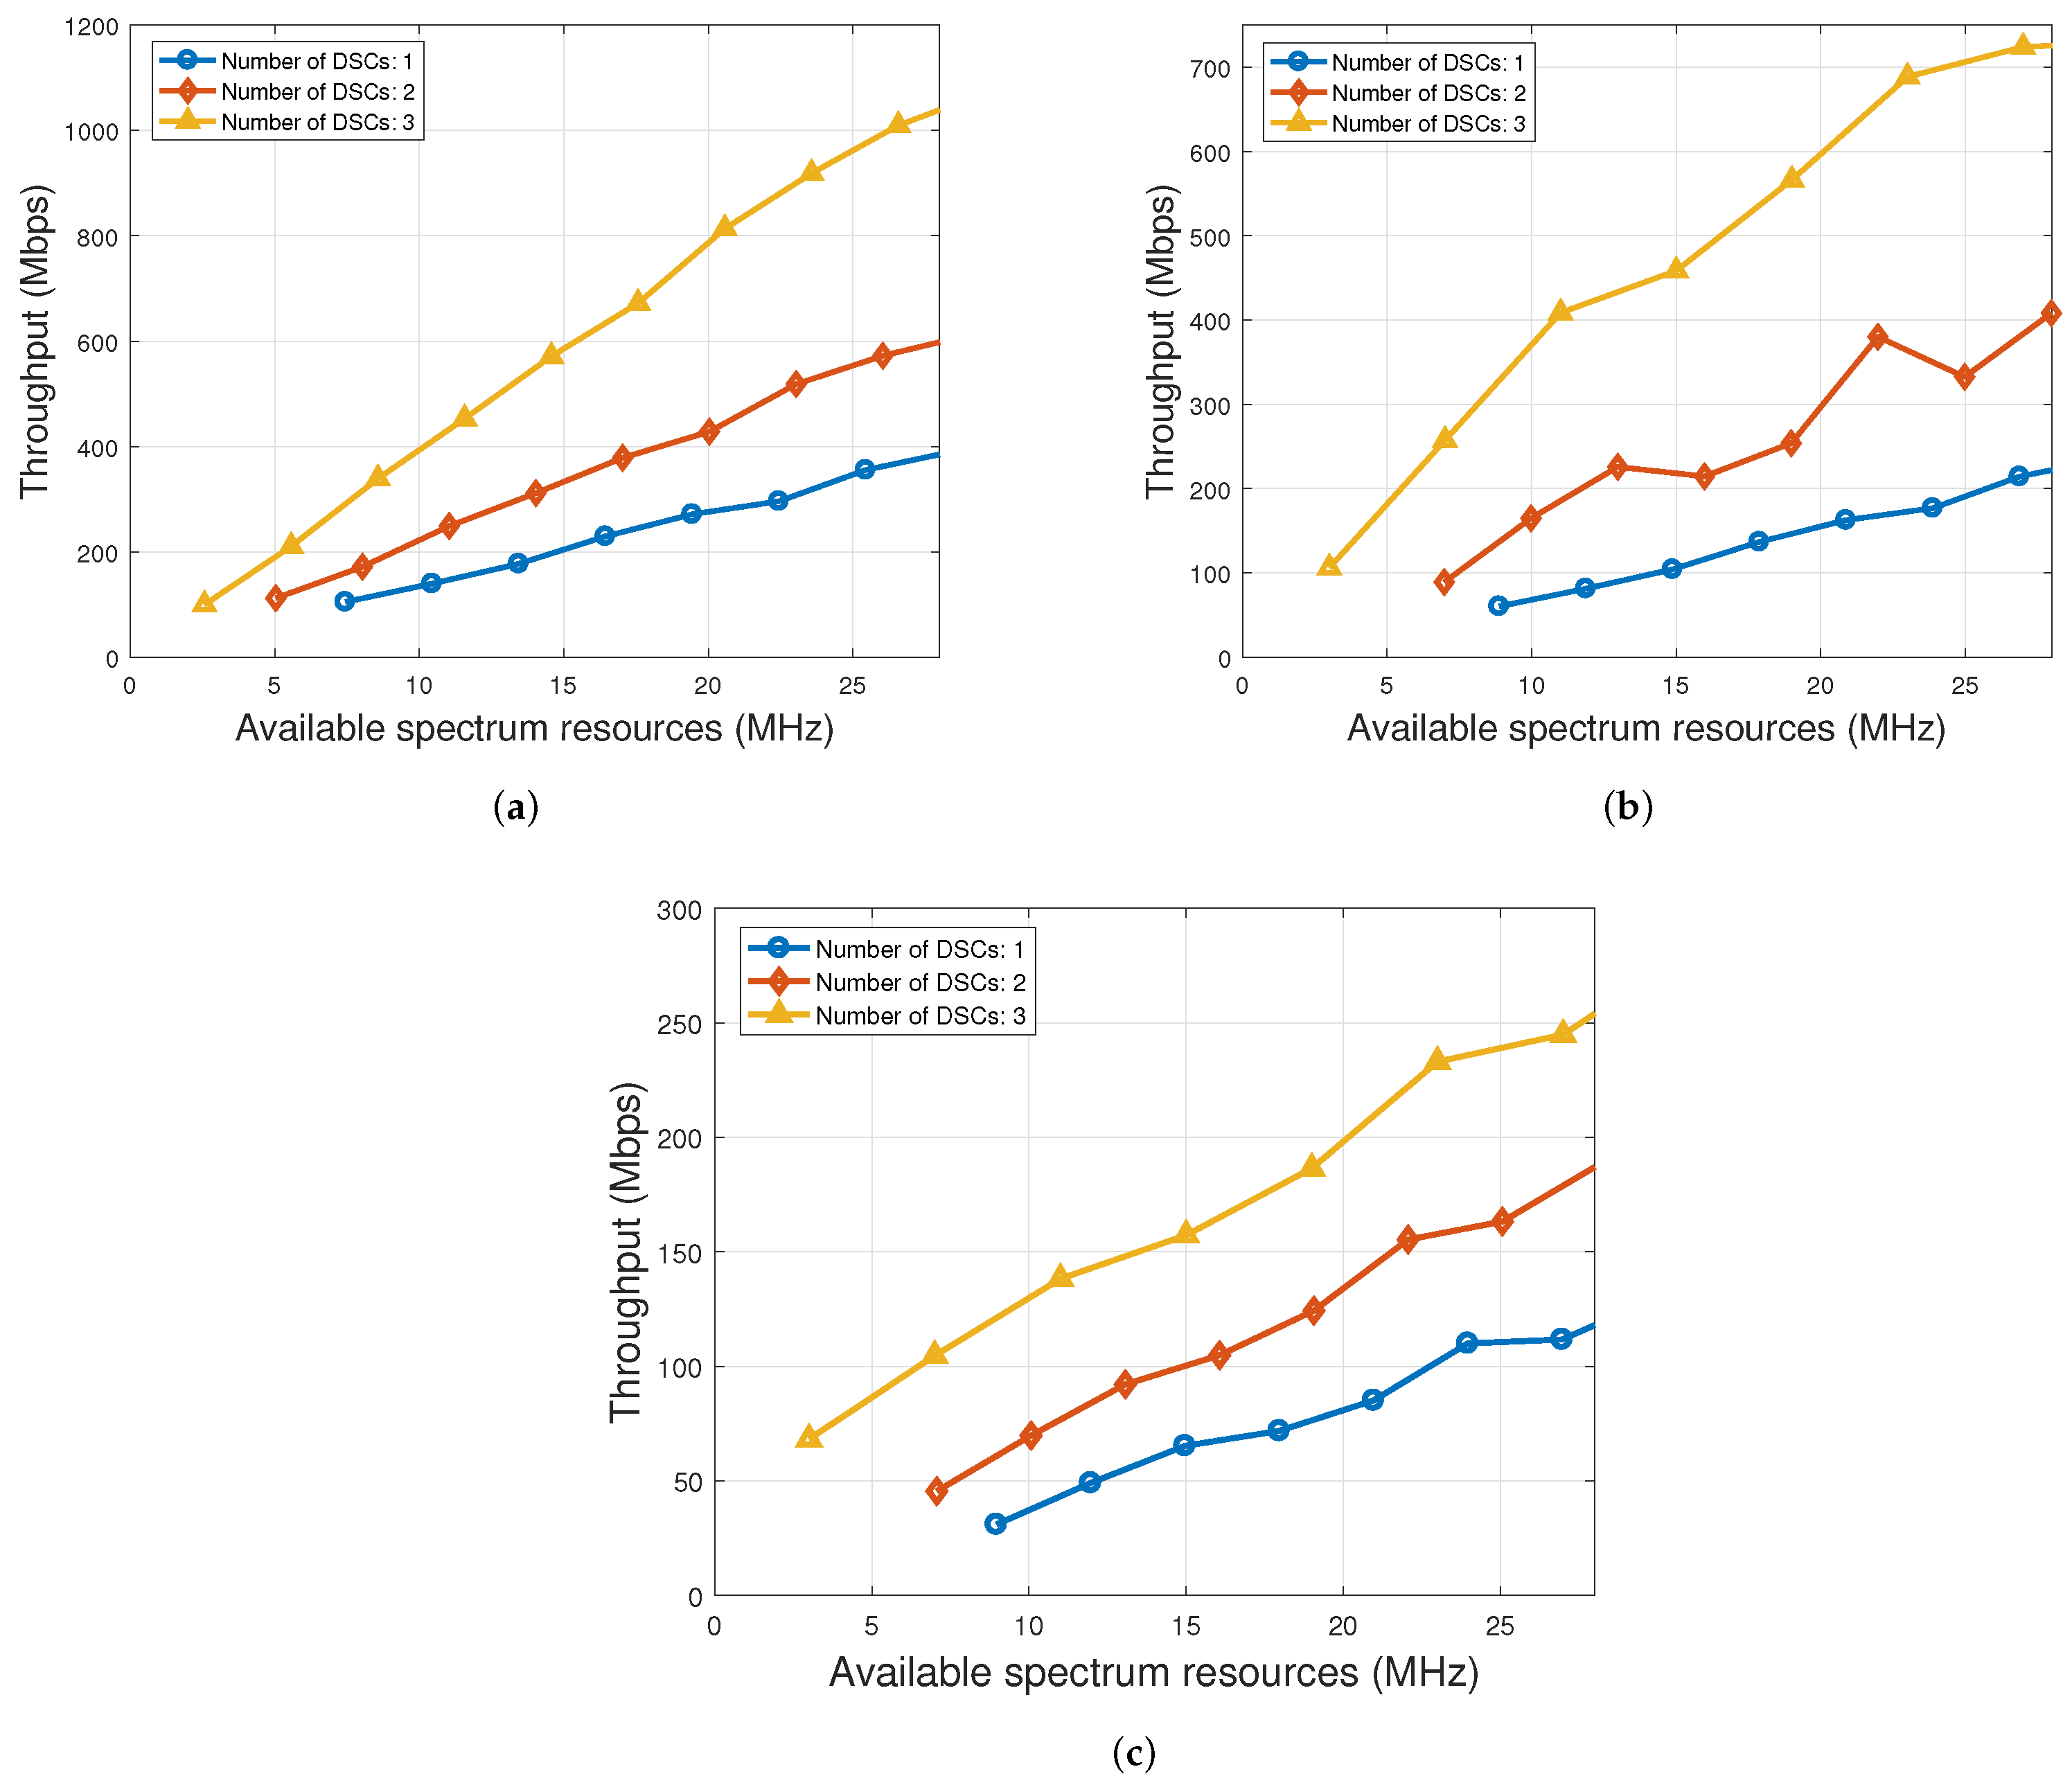
Figure 8.
Impact of vehicle density on different schemes.
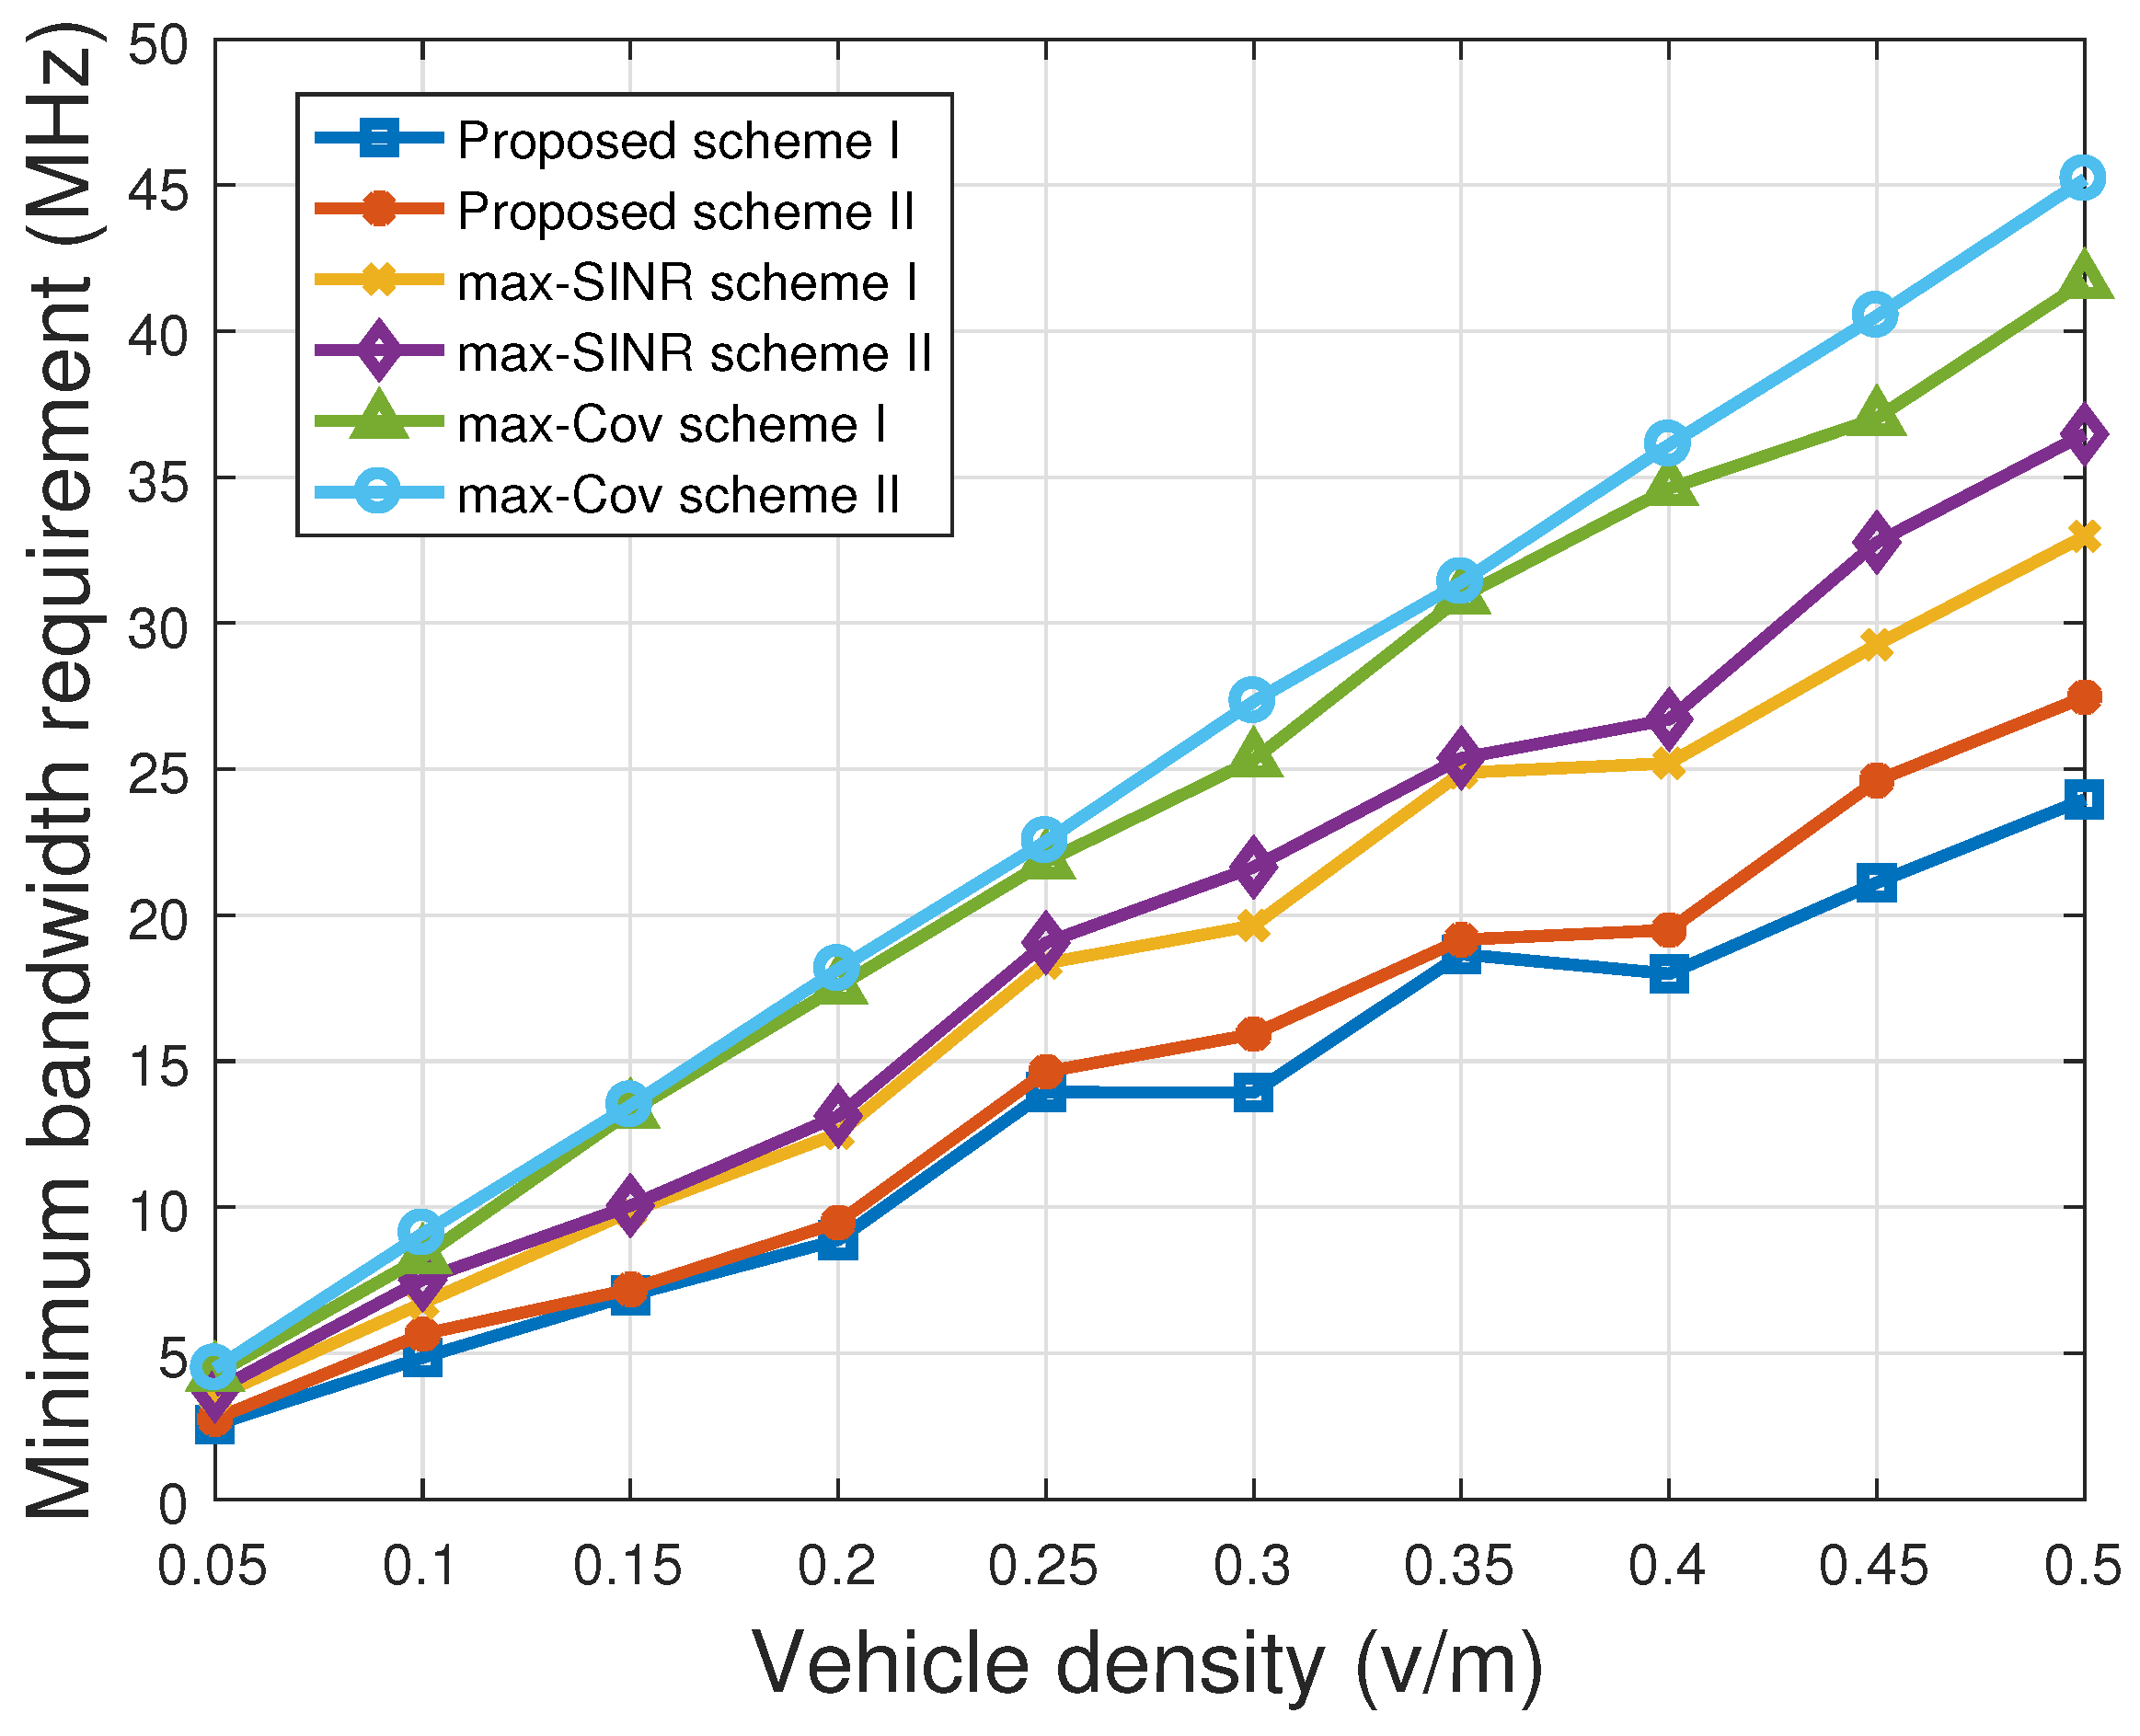
Figure 9.
Impact of vehicle density and the number of DSCs on throughput: (a) proposed scheme I, (b) max-SNR scheme I, (c) max-Cov scheme I.
Figure 9.
Impact of vehicle density and the number of DSCs on throughput: (a) proposed scheme I, (b) max-SNR scheme I, (c) max-Cov scheme I.

Figure 10.
Impact of vehicle density on spectrum slicing ratios: (a) proposed scheme I, (b) max-SNR scheme I, (c) max-Cov scheme I.
Figure 10.
Impact of vehicle density on spectrum slicing ratios: (a) proposed scheme I, (b) max-SNR scheme I, (c) max-Cov scheme I.

Table 1.
Main notations and variables.
| Symbols | Definition |
|---|---|
| Association indicator for vehicle i with the DSC at | |
| Association indicator for vehicle i with GBS m | |
| Achievable rates of vehicle i associated with the DSC at | |
| Achievable rate at vehicle i from the DSC at for | |
| Achievable rate at vehicle i from GBS m | |
| Achievable rate at the DSC at from GBS m for vehicle i | |
| Minimum rate for a bounded delay violation probability | |
| Euclidean distance between vehicle i and GBS m | |
| Horizontal distance between vehicle i and the DSC at | |
| Amount of spectrum allocated to vehicle i (out of ) from the DSC at | |
| Amount of spectrum allocated to vehicle i from GBS m | |
| Amount of spectrum allocated to vehicle i from GBS m | |
| Channel gain from GBS m to vehicle i | |
| Channel gain from the DSC at to vehicle i | |
| Channel gain from GBS m to the DSC at | |
| / | Set/Num. of candidate DSC positions covered by GBS m |
| / | Set/Num. of vehicles covered by the DSC at |
| / | Set/Num. of vehicles covered by GBS m |
| / | Set/Num. of plane position indexes in the coverage of GBS m |
| W | Available amount of radio spectrum resources to the system |
| / | Transmit power on GBS m/the DSC at |
| Spectrum efficiency at vehicle i from GBS m | |
| Spectrum efficiency at vehicle i from the DSC at for | |
| Spectrum efficiency at the DSC at from GBS m | |
| Effective ground coverage radius of the DSC at altitude | |
| Candidate DSC position | |
| / | Spectrum slicing ratio for GBS 1/GBS 2 |
| Spectrum slicing ratio for each DSC | |
| Fraction of spectrum resources from for G2V links | |
| Fraction of resources from allocated to the DSC at | |
| Arrival rate of the delay-sensitive packet | |
| LoS probability threshold for D2V links | |
| Free space path-loss threshold |
Table 2.
Parameter settings.
| Parameters | Values |
|---|---|
| GBS altitude m () | 10 m |
| Coverage radius of each GBS () | 800 m |
| Transmit power of GBS m () | 46 dBm |
| Transmit power of the DSC at () | 24 dBm |
| Urban environment parameter (/) | 4.88/0.43 |
| Excess path-loss scalar/angle scalar(/) | −23.29/4.14 |
| Additional loss for LoS/NLoS links (/) | 0.1/21 |
| Terrestrial path-loss exponent () | 3.04 |
| Angle offset () | 3.61 |
| Excess path-loss offset () | 20.7 |
| Carrier frequency (f) | 3.5 GHz |
| LoS probability threshold for D2V links () | 0.5 |
| Free space path-loss threshold () | 89 dB |
| Packet arrival rate () | 4 pkt/s |
| Packet length () | 1048 bit |
| Packet delay bound () | 0.001 s |
| Delay bound violation probability () | |
| Stop criterion () | 0.01 |
Disclaimer/Publisher’s Note: The statements, opinions and data contained in all publications are solely those of the individual author(s) and contributor(s) and not of MDPI and/or the editor(s). MDPI and/or the editor(s) disclaim responsibility for any injury to people or property resulting from any ideas, methods, instructions or products referred to in the content. |
© 2023 by the authors. Licensee MDPI, Basel, Switzerland. This article is an open access article distributed under the terms and conditions of the Creative Commons Attribution (CC BY) license (https://creativecommons.org/licenses/by/4.0/).
Share and Cite
MDPI and ACS Style
Shen, H.; Wang, T.; Heng, Y.; Bai, G. Joint Resource Slicing and Vehicle Association for Drone-Assisted Vehicular Networks. Drones 2023, 7, 534. https://doi.org/10.3390/drones7080534
AMA Style
Shen H, Wang T, Heng Y, Bai G. Joint Resource Slicing and Vehicle Association for Drone-Assisted Vehicular Networks. Drones. 2023; 7(8):534. https://doi.org/10.3390/drones7080534
Chicago/Turabian StyleShen, Hang, Tianjing Wang, Yilong Heng, and Guangwei Bai. 2023. "Joint Resource Slicing and Vehicle Association for Drone-Assisted Vehicular Networks" Drones 7, no. 8: 534. https://doi.org/10.3390/drones7080534