

Burrow-Nesting Seabird Survey Using UAV-Mounted Thermal Sensor and Count Automation
by
 , ,
, ,
Jacob Virtue
1,*,
Darren Turner
1,
Guy Williams
2,
Stephanie Zeliadt
3,
Henry Walshaw
4 and
Arko Lucieer
1 1
School of Geography, Planning, and Spatial Sciences, University of Tasmania, Hobart, TAS 7001, Australia
2
First Institute of Oceanography, Ministry of Natural Resources, Qingdao 266016, China
3
Commonwealth Scientific and Industrial Research Organization, Hobart, TAS 7004, Australia
4
FloodMapp, Brisbane, QLD 4006, Australia
*
Author to whom correspondence should be addressed.
Drones 2023, 7(11), 674; https://doi.org/10.3390/drones7110674
Submission received: 14 October 2023
/
Revised: 6 November 2023
/
Accepted: 10 November 2023
/
Published: 13 November 2023
(This article belongs to the Special Issue Drone Advances in Wildlife Research)
Abstract
:Seabird surveys are used to monitor population demography and distribution and help us understand anthropogenic pressures on seabird species. Burrow-nesting seabirds are difficult to survey. Current ground survey methods are invasive, time-consuming and detrimental to colony health. Data derived from short transects used in ground surveys are extrapolated to derive whole-colony population estimates, which introduces sampling bias due to factors including uneven burrow distribution and varying terrain. We investigate a new survey technique for nocturnally active burrow-nesting seabirds using unoccupied aerial vehicles (UAVs) and thermal sensor technology. We surveyed a three-hectare short-tailed shearwater (Ardenna tenuirostris) colony in Tasmania, Australia. Occupied burrows with resident chicks produced pronounced thermal signatures. This survey method captured a thermal response of every occupied burrow in the colony. Count automation techniques were developed to detect occupied burrows. To validate the results, we compared automated and manual counts of thermal imagery. Automated counts of occupied burrows were 9.3% higher and took approximately 5% of the time needed for manual counts. Using both manual and automated counts, we estimated that there were 5249–5787 chicks for the 2021/2022 breeding season. We provide evidence that high-resolution UAV thermal remote sensing and count automation can improve population estimates of burrow-nesting seabirds.
1. Introduction
One-third of seabird species are threatened with extinction [1,2]. Burrow-nesting seabirds make up 50% of these threatened seabird species [1,3]. Surface-nesting seabird population surveys can be undertaken visually or using aerial photographic methods. Visual surveys are not appropriate for burrow-nesting seabird surveys because (i) the birds can often nest in inaccessible terrains, (ii) they are nocturnally active and (iii) the chicks are deep in burrows. Hence, the populations of burrow-nesting seabirds are poorly understood [1,4].
The traditional population monitoring technique for burrow-nesting seabirds includes the leg banding of large numbers of adults [5] and manual burrow inspections to confirm occupancy [6,7]. These survey practices are invasive, laborious and can introduce sample biases in the count data. Orben et al. [8] reported that these monitoring techniques failed to capture the drastic decline in Leach’s storm petrels (Hydrobates leucorhoa) over the past 30 years. These invasive survey methods can also result in damage to burrows and occupants and sometimes cause egg abandonment, affecting reproductive success [9]. Additionally, snakes can often be found in burrows preying on eggs and chicks, which poses a significant threat to the manual surveyor. Despite being Australia’s most abundant seabird, the population of short-tailed shearwaters (also known as mutton birds) is not well understood. After returning each year from their Arctic foraging grounds, these nocturnally active, burrow-nesting seabirds breed in southern Australia, including on remote offshore islands. Very few studies have been conducted on the population size of short-tailed shearwaters [10,11,12]. As a result of their extensive distribution and the large biomass, surveys have yet to establish robust baseline population estimates of short-tailed shearwaters. The survey methods used to date have not been able to adequately track the population fluctuations of this species. Non-invasive population monitoring techniques have been undertaken for remote and inaccessible seabird colonies with varying success. Oppel et al. [13] used autonomous acoustic recording devices together with habitat mapping to estimate the population size of Cory’s shearwaters (Calonectris borealis). The precision of this technique was not sufficient to detect changes in population size over time. Orben et al. [8] tested passive acoustic monitoring, infra-red time-lapse cameras, and radar to remotely monitor burrow-nesting Leach’s storm petrels (Hydrobates leucorhoa) on different temporal and spatial scales. These new survey methods using various technologies can generate enormous data sets that require substantial analysis time; hence, the development of count automation is imperative.
The use of unoccupied aerial systems (UAVs) and UAV-mounted sensor technology is a powerful way to conduct agriculture and wildlife research [14,15,16,17,18,19]. UAV remote sensing allows increased spatial resolution and is cost- and time-efficient compared to ground field operations.
The emergence of UAV RGB imagery has dramatically changed how researchers conduct population studies of many bird species. Surface-nesting birds and birds’ nests in tree canopies have been surveyed using UAV RGB imagery [20,21]. Black-headed gull nests (Chroicocephalus ridibundus) [22] and raptor nest contents [23] were surveyed using UAV to assess population status. Using UAV RGB imagery to survey burrow nesting and nocturnally active species is, however, more difficult. Albores-Barajas et al. [24] used UAV RGB imagery to estimate the population of burrow-nesting black-vented shearwater (Puffinus opisthomelas) birds while ground-based work was needed to confirm occupation status.
Since the 1960s, thermal cameras have been used to monitor birds [25]. More recently, UAVs equipped with thermal sensors have been used for avian studies. The effectiveness of this survey method depends on the thermal gradient between the background and the target species and can be impacted by vegetation. Lee et al. [26] used UAV visual and thermal sensors in extreme environments to detect cryptic flocks of molting pink-footed geese (Anser brachyrhynchus) near inaccessible sea ice regions. They also surveyed incubating common ringed plovers (Charadrius hiaticula) in the Arctic and the endangered black-faced spoonbill (Platalea minor) in Korea. The geese and spoonbills in the study were detected with both visual and thermal sensors; however, the plovers were only distinguishable using the thermal sensor due to their cryptic coloration. Israel and Reinhard [27], using a UAV-mounted thermal camera, detected 93% of the known nests in a colony of northern lapwings (Vanellus vanellus). Burrow-nesting birds are, however, more difficult to detect, and improved survey methods are needed to further understand population dynamics.
Many seabird species breed in colonies with extremely high nest densities. Historically surveying whole colonies was logistically impractical and hence only a sub-sample of breeding birds was ever used to estimate breeding population size. The use of UAV imagery has increased our ability to collect data rapidly, while introducing new challenges around image processing and feature detection. Advanced image filtering, count automation techniques, and artificial intelligence have been developed to analyze the aerial imagery of birds, alleviating the time-consuming task of manually detecting and counting birds [28]. Several investigations have successfully used count automation for seabirds from aerial imagery [29,30]. Hayes et al. [31] used convolutional neural networks to detect and count whole colonies of Black-Browed Albatrosses (Thalassarche melanophris) and Southern Rockhopper Penguins (Eudyptes c. chrysocome) to within 5% of manual counts. Deep learning techniques applied to camera trap imagery have been used to automatically count 3.2 million birds across 48 species with 94% accuracy [32].
Algorithms have been developed for count automation using UAV thermal imagery for several mammal species [33]. Animal concentration, separation distances between animals, and contrast with the background are all important criteria to optimize count automation [34]. In thermal images, the background can be separated from the subject species using the processes of thresholding and segmentation [35]. Filtering techniques are also used to increase the contrast between background and the species surveyed [36]. Burrow-nesting seabird chicks can burrow over a meter deep and hence detection would depend on the strength of the chick’s thermal signature.
The aim of this study was to develop a technique to rapidly and accurately conduct population surveys of nocturnally active burrow-nesting seabirds. To mitigate the impact of invasive ground surveys, we used a UAV-mounted thermal sensor to survey short-tailed shearwaters. We conducted flights over a short-tailed shearwater colony during the breeding season to detect chicks in their ground burrows prior to fledging. Manual and automated counts were used to analyze the thermal imagery of occupied burrows to estimate chick production and create a permanent visual record of the colony.
2. Materials and Methods
2.1. Study Site
Short-tailed shearwaters were surveyed at Whale Bone Point (43.4400° S; 147.2335° E) on Bruny Island, Tasmania, Australia (Figure 1). The colony was chosen for its varying topographical relief and vegetation cover with pigface (Carpobrotus rossii) and silver tussock grass (Poa labillardierei). Surveys using an UAV-mounted thermal sensor were conducted during the 2021/22 breeding season. The study site was surveyed on the following dates: 10 December 2021, 5 and 16 February 2022, 13, 20 and 30 March 2022, 10 and 20 April 2022. The surveys were designed to target key periods in the short-tailed shearwater breeding phenology after they had returned from their trans-equatorial migration. These periods, as described by Woehler et al. [37], include (i) egg incubation (after returning to the nest from foraging in the Southern Ocean) (26 November–20 January), (ii) egg hatching and the rearing of chicks (21 January–15 April) and (iii) adult and fledgling departure from the colony (from 16 April onwards). The survey conducted on 13 March 2022 was chosen to undertake a comparison between manual and automated counts of occupied burrows. By this date, all viable eggs had hatched and the occupied borrows had thermal signatures that were distinguishable from the background. Burrows vary in depth and can be over a meter deep. By mid-March, the chicks’ thermal signatures were strong enough to be detected despite the burrow depth and their location in the burrow. Earlier in the season, the thermal signatures of younger chicks in deeper burrows were indistinguishable from the background. Very late in the season, just prior to fledging, although manually verified as still present in their burrows, the chicks were too well insulated to be detected via the thermal sensor.
2.2. UAV and Flight Planning
A DJI Phantom 4 (DJI, Shenzhen, China) was chosen in this study for its portability in the field (with a diagonal size of 350 mm and a weight of 1.39 kg). This platform can operate within a maximum wind velocity and flight speed of 20 kt and 58 km h−1, respectively. It has navigation-grade GNSS with a listed hover accuracy of ±1.5 m horizontally and ±0.5 m vertically (supplemented by a barometer) and has a 30 min flight time with no additional payload.
The mission planning software used for this study was the Maps Made Easy (MME) map pilot (version 3.1.4). The ‘Terrain Follow Feature’ in MME was used, and is based on shuttle radar topography, a NASA-collected terrain dataset from 2000 with a 30 m spatial resolution. This app controlled the flight speed and line spacing based on user input parameters.
Mapping missions were conducted at 40 m above ground level (with terrain following) using a forward and side overlap of 80% and 90%, respectively. This height of overlap was selected to compensate for the low pixel resolution (640 × 512 pixel) of the sensor, ensuring sufficient data capture over the study area. The forward overlap limited the speed over the ground to 4 ms−1, which is the maximum speed the UAV can move without causing motion blur in the thermal imagery at the prescribed height. To ensure that the UAV was in stable flight when operating above the study area, flight transects were extended beyond the areas to allow sufficient lead-in paths, as the UAV can make exaggerated movements when transitioning from one transect and re-positioning for the next.
2.3. Thermal Sensor
TeAx ThermalCapture Calibrator (TeAx Technology GmbH, Wilnsdorf, Germany) [38] was used in this study as the UAV-mounted thermal sensor. This commercially available sensor has an integrated heated shutter which acts as a mobile thermal reference target for on-the-fly sensor calibration. This shutter is built on the FLIR Tau 2 core, which is an uncooled radiometric microbolometer sensor with a 640 × 512 pixel array, a 13 mm lens, and 37° field of view. This sensor was mounted under the UAV on the landing gear using a custom mounting plate with anti-vibration grommets (Figure 2). A ThermalCapture GNSS receiver was used to add additional metadata, including position and time, to the captured thermal imagery to aid with image processing. The GNSS unit contained a u-blox 6 GNSS SuperSense chipset providing navigation-grade accuracy [38].
The preflight sensor configuration was conducted using the ThermalCapture 2.0 configuration application (version 1.9.1). The manufacturer’s default recommended settings were used and included an active external shutter, an active GNSS receiver, a maximum frame recording rate (8 Hz, then sub-sampled to 1 Hz) and a maximum of 1000 frames per file. The sensor captured raw binary files (BIN), which were manipulated with ThermoViewer (version 3.0.7) to export TIFF files for analysis. Images were captured with digital value numbers only, processed during analysis and thereafter converted into °C (see equation in Section 2.6).
2.4. Field Operations
The colony area was approximately 3 ha, requiring 60 min of flight time. On average, one battery was used per ha due to the added weight, increased overlap and low flying heights. Flying days were selected based on ambient temperature and wind conditions. Astronomical dawn was considered the optimal flight time to ensure the greatest temperature contrast between the targets (occupied burrows) and the background. This time was also considered to cause the least disturbance to the adult birds as they had already departed the colony on their daily foraging trip. Missions were flown on mornings with low wind (below 20 km h−1) to optimize battery consumption and minimize motion blur in the thermal imagery. Cold preceding nights (12° C or less) were preferred, providing greater thermal contrast between occupied burrows and surface temperatures. The UAV was launched and recovered ~250 m from the colony to minimize observer disturbance to the birds. All flight operations were executed over the colony using the mission planning software to limit irregular flying patterns, which could have stressed the birds and compromised the data.
2.5. Ground Validation
Manual burrow inspection was conducted during the day when the adults had left the colony. This was conducted to confirm that the thermal signatures aligned with those of the chick-occupied burrows. Adult birds, whilst on the ground and in burrows, had no appreciable thermal signature due to the insulative properties of their adult plumage. The manual burrow inspection was conducted in line with traditional survey methods, where the surveyor reaches into the burrow with a probe or arm. The probe was moved around the burrow until occupancy was either confirmed, denied or uncertain. If a burrow was determined to be occupied, a custom-made metal target was placed on the surface adjacent to the burrow entrance. These metal targets were made of 10 cm square sections of 0.5 mm sheet aluminum and fixed to bamboo stakes (Figure 3). The aluminum targets are visible in the thermal imagery as very cold pixels due to the low emissivity of aluminum. The targets equated to 4–6 pixels in the final orthomosaic (Figure 4). Seventy occupied burrows were marked in this manner for validation.
2.6. Thermal Orthomosaic Image Processing
Thermal orthomosaics were created using AgiSoft Photoscan (version 1.4.4). Images were aligned using the following settings: highest accuracy, reference preselection, key point limit = 40,000, and tie point limit = 4000. A mesh was created with aligned images using appropriate settings (face count: ‘high’; surface type: height field 2D and interpolation enabled). Thermal orthomosaics (Figure 4) were then exported from Agisoft and analyzed using QGIS (version 3.22.1). The manufacturer provided the following equation, which was used for conversions from the digital number (DN) into °C:
2.7. Study Area Boundary Definition
A mask was created in QGIS to define the study area and remove excess data from the edges of the thermal orthomosaic. This minimized the amount of additional and erroneous data analyzed whilst filtering and conducting count automation. The edge of the colony was visually assessed in QGIS, and a polygon was created along that boundary with a buffer of 2 m to the outside of burrow locations. This polygon was exported as a shapefile and used via the Python library Rasterio (version 1.3.2) in combination with the orthophoto for analysis.
2.8. Manual Counts
Manual counts were performed on the thermal orthomosaics using QGIS software. These thermal orthomosaics have an average resolution of 5 cm per pixel, while the size of the occupied burrows varied between 6 and 12 pixels. Each burrow exhibiting thermal activity was identified by a distinctive point marker within a multi-point shapefile layer. To facilitate the counting process, a grid of 10 m2 was superimposed over the entire study area, serving as a reference for counting (created using the ‘Create grid’ function within QGIS). Each thermal response was evaluated as either an ‘occupied burrow’, or ‘other thermal response’.
2.9. Count Automation
Python (version 3.9) and associated libraries (see Section 2.9.4) were used to analyze all data. For all automated data analysis, individual orthophotos were used. Individual orthophotos, rather than whole-colony orthomosaics, were used to minimize the impact of thermal drift within the sample set during analysis (see Section 3.1.1). This approach aimed to alleviate any potential distortions caused by variations in thermal response within the dataset. This step was achieved via the “Export Orthophoto” function in AgiSoft Photoscan, creating a series of overlapping individually orthorectified images. Additionally, this approach adds to robustness to count automation, as each burrow is imaged multiple times, requiring location-based clustering to resolve individual burrows, providing further validation of accurate detection.
2.9.1. Clustering
As a function of side and forward overlap, occupied burrows were detected multiple times in multiple individual orthophotos. To address this, a location-based clustering approach was implemented to eliminate duplicate counts and ensure that each burrow was treated as a single entity. The clustering process was executed using the Density-Based Spatial Clustering of Applications with Noise (DBSCAN) algorithm, leveraging the spatial proximity of occupied burrows for detection. Unlike traditional centroid-based clustering, DBSCAN operates by grouping data points that are densely connected while distinguishing outliers as noise. Specifically, points within a proximity of 0.5 m were considered part of the same burrow cluster. Additionally, an increased number of responses per occupied burrow positively correlated with higher confidence in identifying true positive burrow locations. An occupied burrow location was determined as the mean easting and northing of each automated detection.
2.9.2. Image Window Size and Selection
To mitigate the impact of edge lens distortion and vignetting during automated image analysis, a central window was used on each exported orthophoto. Multiple window sizes were evaluated, including 100%, 75%, 50%, and 25% of the total image area. The 25% window (320 × 256 pixels) was selected as the most effective window to reduce lens vignetting effects without impacting the result of count automation. The central window was calculated based on the original image dimensions of 640 × 512 pixels. Orthophotos varied in shape and size depending on the Agisoft Photoscan export process; however, only the portion of image that fell within the calculated window was used for analysis (Figure 5).
2.9.3. Validation of Count Automation
To compare the automated count with the manual count, we employed the intersection over union (IOU) method. Given the proximity of burrow locations within the study area (within 0.5 m), we defined an IOU box of 0.4 m, considering any overlap between the automated count and manual count a positive result. Slight variations in burrow locations can arise from factors such as camera misalignment, image capture angles, and the subjective placement of burrow locations during the manual count.
To assess the performance of the automated count, we calculated precision and accuracy statistics. By comparing the locations from the manual count to those from the automated count, we determined the true burrow locations, false-positive burrow locations, and false-negative burrow locations, which were then utilized to calculate precision. Recall and F-score were employed as measures to evaluate the goodness of fit between the automated count and the expert manual count.
2.9.4. Python Libraries Used for Image Analysis
Rasterio was used to load images for analysis. Rasterio was selected as it serves as an efficient package to read and manipulate geospatial raster data, ensuring a foundation for subsequent filtering techniques. Scikit-image (version 0.19.2) package filters were applied and used to aid the detection of occupied burrows and conduct the automated count, in the following sequential order.
The Rank.max filter was initially applied to amplify high-intensity regions within the images, potentially indicative of burrow locations. This filter, operating within a local neighborhood, pinpointed maximum pixel values, thereby accentuating bright features in the image. Subsequently, the White tophat filter was adopted to extract subtle image details that might have been obscured by the background or other components. By accentuating small-scale structures, this filter heightened the visibility of burrows against the surrounding terrain. The Sobel filter, a gradient-based edge detection technique, was employed to identify regions exhibiting notable intensity variations. By utilizing this filter, we aimed to outline potential burrow boundaries through the recognition of significant gradients. To focus on well-defined edges associated with burrows, the Threshold Sobel filter was employed to suppress weaker edges in the image, thus reducing the risk of false positives by retaining only the most pertinent edge information. The application of morphological operations (dilation and erosion) assisted in shaping detected burrow regions. Dilation filled gaps within identified burrow areas, while erosion eliminated small noisy regions that might have otherwise been misconstrued as burrows. Expanding on this, the subsequent morphology erosion/dilation step further refined burrow regions, eliminating residual artifacts from the earlier processing stages. The consecutive dilation step then extended the regions of interest, enhancing coverage and precision in the detection process. Finally, the intensity and size threshold of identified burrows was implemented to filter out regions that did not meet the established criteria for occupied burrows. By applying appropriate intensity and size thresholds, we ensured that only meaningful regions corresponding to actual burrows were retained.
The optimization of our filter parameters was achieved through rigorous experimentation and fine-tuning, specifically tailored to our dataset. This workflow was modeled on the Scikit-image processing tutorial workflow previously used by the authors.
2.10. Survey Methodology and Data Collection
We investigated multiple aspects such as image overlap, flight height, terrain follow, and time of day to acquire accurate thermal orthomosaics. As the thermal imaging system has a relatively coarse spatial resolution (640 × 512 pixels), accurate flight parameters were required to achieve optimal thermal imagery. These parameters included flying 40 m above ground level with an 80% forward and 90% side overlap. To maintain this height over varying elevations, the ‘Terrain Follow’ function of the mission planning software was utilized. Various flying heights of up to 120 m were tested, and it was determined that occupied burrows were unable to be accurately resolved when flying above 40 m. Flight planning software that did not allow for Terrain Follow was trialed; however, the images were either unable to be aligned, or if aligned, the burrows were unable to be detected in areas that were more than 40 m below the sensor.
As the temperature difference between the ground and the occupied burrow was only ±2 °C, it was important to conduct surveys at the time when the thermal contrast was greatest. Through trial and error, it was determined that an ambient night temperature below 12 °C was optimal. Imagery acquired just before sunrise (astronomical dawn) provided the greatest difference in thermal signatures between occupied burrows and the background.
3. Results
3.1. Manual and Automated Counts
The number of occupied burrows using the automated count was 9.3% higher than that using the manual count method. The manual count method utilized the entire orthomosaic for image analysis. By visually inspecting the orthomosaic, we were able to discriminate between the background and the occupied burrows based on temperature variations. This count method was labor-intensive, taking 3.5 h on average. However, with adequate breaks to reduce fatigue, this increased to approximately 6 h. The count automation of the same set of orthophotos took 10 min, at approximately 0.3 s per individual orthophoto with negligible clustering time (Table 1).
3.1.1. Digital Number Distribution Analysis
When conducting automated burrows counts, burrows were miscounted in the full orthomosaic due to imaging striping because of thermal sensor drift. To quantify this error, we examined the temperature distribution (per pixel) for the entire orthomosaic of the study area. Furthermore, we analyzed the individual orthophotos that the orthomosaic comprised and grouped them into quartiles to examine the temperature spread.
The temperature distribution in the orthomosaic exhibited a multi-modal spread. Temperatures within quartiles 1–3 had values between 6.49 and 9.69 °C (Figure 6a), indicating the presence of a detected temperature variation from thermal sensor drift, which was due to the shock cooling of the sensor and the change in ambient conditions as the sensor traveled over the study area [39]. As a result of sensor drift, we were unable to conduct automated counts on the full orthomosaic; hence, individual orthophotos were used for automated counting.
When examining the detected temperature distributions of the individual orthophotos, based on the quartile range calculated from the orthomosaic, we observed a localized and narrow range of temperatures (Figure 6b). This temperature distribution of the individual orthophotos showed distinct variations when separated into quartiles derived from the orthomosaic, which demonstrates that image analysis via simple thresholding on an orthomosaic is not feasible.
The analysis of automatically detected occupied burrows resulted in a normal temperature distribution ranging between 6 and 9 °C, with that of most burrows being between 7 and 8.5 °C (Figure 7). This analysis was based on the mean digital number of all the pixels in the detected burrow area, converted into °C (see Section 2).
3.1.2. Automated Counts
Count automation was significantly more time-efficient than was manual counting, taking approximately 10 min to complete (Table 1) and requiring no further user input once set up. As the automated count was conducted on the series of individual orthophotos, some occupied burrows were detected multiple times due to the overlap in the UAV flight planning and image capture software parameters used. Burrow identification was considered positive if it was detected in a minimum of three orthophotos (Figure 8), then clustered and stored as a unique point with eastings and northings.
3.1.3. Comparisons between Automated and Manual Counts
We utilized the IOU method to evaluate the correlation between the automated and manual counts. This analysis aimed to assess the alignment of the automated count results with the manual count. Since each burrow was imaged multiple times from various angles, and the manual count was not always precisely centered on each occupied burrow, it was necessary to evaluate the IOU. To accommodate the proximity of burrows within the colony, a small IOU tolerance was allowed. Consequently, any overlap of the union was considered a 100% match, accounting for slight variations in burrow positioning. The confusion matrix (Table 2) of these calculations resulted in approximately 70% (true positive) of true burrow detections being identified in both automated and manual counts and overlapping with the IOU result. Approximately 20% (false negative) (Figure 9) of burrows were counted in both automated and manual count, while not overlapping. Finally, less than 10% (false positive) of burrows were only identified in the automated count (Table 2). Table 3 details the comprehensive assessment scores of the model’s effectiveness in burrow detection.
3.2. Ground Validation
Custom-built thermally visible targets (Figure 3) were imaged via the UAV thermal sensor (Section 2.5). These thermal targets appear in the orthophotos as dark pixels due to their low emissivity (Figure 4 and Figure 10) and were readily detectable using the manual counting method, including the manual detection of the heat signature of the adjacent occupied burrow. The target and corresponding burrow were located and identified as occupied burrows. Additionally, count automation successfully detected 95% of the same burrows adjacent to the thermal target.
4. Discussion
The aim of this study was to develop and assess the effectiveness of a new method for detecting and counting occupied burrows while minimizing the disturbance to both burrows and their occupants.
4.1. Field Surveys
Limited studies have been conducted on the population size of short-tailed shearwaters due to the difficulty in surveying these birds. We surveyed an entire short-tailed shearwater colony at a time when the chicks were large enough to produce a detectable thermal signature and before developing their insulative adult plumage. Previous survey methods for this species included the use of short transects to check for burrow occupancy in selective, easy-to-access areas of each colony. These counts were then extrapolated colony-wide and regionally to derive the number of chicks per hectare [11,12,40,41]. Due to the amorphous nature of colonies and the fact that the distribution of burrows is not uniform, past population estimates are likely to have had a large margin of error.
In the present study, we used metal targets adjacent to selected burrows, and together with ground checks, this allowed us to confidently verify that these burrows were occupied by chicks. Both the automated and manual counting methods proved effective in detecting the burrows in the thermal images, enabling us to both count them and accurately identify their locations. Using both manual and automated counts of the thermal imagery, we were able to estimate the number of chicks in the entire colony at Whale Bone Point to be between 5249 and 5787 for the 2021/2022 breeding season. Our ability to detect thermal radiation from active burrows provides a method for building a permanent record of estimated seasonal chick production. Such detailed records will help detect population perturbations into the future and inform conservation management plans.
To determine the appropriate survey period, we conducted flights throughout the breeding season to document the changes in thermal signatures from when chicks hatched, to after the chicks were fully fledged. Flights were also conducted before and after the breeding season to test our ability to discriminate between the different resident species in the colony. Other colony occupants include little penguins (Eudyptula minor) and a small number (<20) of Bennett’s wallabies (Notamacropus rufogriseus). Little penguins were not thermally visible at the colony using our UAV thermal sensor. This may have been due to the penguins being well insulated at the time of our survey. While the little penguin breeding season varies between years, most fledge in November/December, well before the short-tailed shearwaters fledge in April [37,42,43]. Wallabies, however, were clearly thermally visible during the short-tailed shearwater’s breeding season and thereafter, as the thermal signature of the occupied burrows decreased. Differentiation between these wallabies (<20) and short-tailed shearwaters was possible visually during manual counts of thermal orthomosaics, as the thermal shape of a wallaby is very distinctive. Count automation, however, failed to distinguish between wallabies and short-tailed shearwaters, resulting in a negligible number of false thermal positives. If wallabies were present in higher numbers, we would have had to further refine detection methods to account for them.
Flights were conducted at different times of the day to determine the greatest thermal contrast. Astronomical dawn was considered optimal as the terrain was the coolest relative to the thermal signature of chicks in burrows. This time was also optimal in posing the least disturbance to birds, as the adult birds had already departed the colony on their daily foraging trips. Other studies using thermal sensors determined that lower temperatures during the morning and late afternoon were optimal survey times. Seymour et al. [33], surveying grey seal (Halichoerus grypus) breeding colonies in eastern Canada, reported that false positives from warm landscape features were either eliminated or substantially reduced by using UAV thermal images collected at early dawn. Lethbridge et al. [44], surveying macropods (western grey kangaroos (Macropus fuliginosus), eastern grey kangaroos (M. giganteus) and red kangaroos (Osphranter rufus)), across the state of Victoria, Australia, used aerial thermal imaging via helicopter and had problems with surface reflectance and thermal radiation during daytime flights. They suggested that conducting aerial surveys at night (although logistically more difficult with light aircraft) would improve the thermal contrast between animals and non-animal targets.
While thermal sensors integrated with UAV technology have successfully been used for surveys of surface-dwelling animals, few studies have been conducted on fossorial (burrowing) animals. Boonstra et al. [45] used handheld far-infrared thermal imaging to survey active burrows of fossorial Arctic ground squirrels (Spermophilus parryii). They used warm burrows as a relative index of species density. Cox et al. [46] used UAV-borne thermal sensors to detect radiant heat from rabbit burrows for eradication purposes. They tested several types of infrared sensors in the field and found that some brands detected more burrows than were detected in visual inspections. Although they could not determine the rabbit population using this survey method, with an unknown number of rabbits potentially in each burrow, they successfully identified active burrows. On the other hand, short-tailed shearwaters only lay one egg; hence, every occupied burrow indicates the presence of one chick (and likely represents two adult birds).
4.2. Image Processing
Thermal sensors are notorious for having issues with thermal drift, resulting in difficulties in acquiring accurate temperatures [39]. The microbolometers used to detect infrared radiation in uncooled thermal cameras create non-uniform responses to scene temperatures, which are not always linear [47]. The use of factory-level non-uniformity correction may not sufficiently eliminate this thermal drift. Thermal drift results in vignetting at the periphery of the thermal image, which subsequently appears thermally cooler than the center. One way to alleviate this issue is to use only the center of orthophotos for analysis [48,49,50,51]. This reduces the usable portion of the image and is only possible when there is a substantial overlap of the orthophotos. To compensate for thermal drift, flying lower at reduced speeds [52] or planning lengthy stabilization periods have been suggested [17,49]. However, both actions substantially reduce flight time and survey area. In the present study, we used a heated shutter described by Virtue et al. [39], which reduced the shift in sensor digital number, negating the need for lengthy stabilization. As suitable overlap was available, cropping the orthophotos resulted in reduced vignetting and facilitated burrow detection during count automation. Additionally, correct kernel selections significantly contributed to the reliability of the automated count analysis. The potential distortion caused by vignetting was minimized, ensuring an improved detection of occupied burrow locations.
Although highly accurate thermal information is more important in agricultural applications than in wildlife studies, it is far easier and more efficient to automatically process images that are stable with a little thermal gradient. However, even though we used a heated shutter in this study, the thermal variation across the scene was masked by a slight variation in shutter sensor accuracy of approximately 0.5 °C, which was also reported by Virtue et al. [39].
Vignetting can also introduce artefacts during the structure-from-motion process when orthomosaics are created [53]. Due to the temperature variations observed across our study area, results were inconsistent when applying automated thresholding methods to the orthomosaics. However, by analyzing single-image orthophotos, instead of a merged orthomosaic, the variations in temperature signatures caused by thermal sensor drift were minimized, allowing for the detection of more occupied burrows.
In the current study, standard techniques such as simple thresholding, both manual and automatic, could not be used due to the temperature gradient between the burrow and the background being too narrow, and the thermal variation across the orthomosaic being too large due to sensor drift. Image filtering techniques were required to enhance thermal features to assist count automation. Other studies in high-contrast environments and/or on larger species with greater thermal signatures such as seals [33], monkeys [54], koalas [55] and kangaroos [44] have successfully used thresholding in count automation studies.
4.3. Count Automation
Surveying entire colonies of short-tailed shearwaters produces substantially more data than does conducting traditional surveys that undertake short 100 m transects covering only 0.5% of colonies [12]. These traditional survey methods have been used to determine the total population of short-tailed shearwaters, which is estimated at 23 million, with the largest colony on Babel Island, Tasmania, with 2.86 million burrows [41]. We undertook a rapid UAV thermally derived census of one small colony, producing data for every active burrow detected. Despite being a smaller colony, manually counting the thermal orthomosaic imagery was laborious with over 5000 short-tailed shearwater chicks detected.
Image filtering and feature detection was used in the present study to conduct automated counts of occupied burrows which were comparable to the manual counts of the thermal images (Table 1). Additionally, a density-based clustering algorithm was used to group proximate burrow locations from the individual orthophotos into a single burrow location. Although there have been many animal surveys using automation techniques of RGB imagery, fewer studies have used the automation of thermal imagery. Akçay et al. [56] compared manual and automated counts of RGB imagery for a variety of bird species. While they reported count results being positively correlated, automated (neural network) methods outperformed manual counting in terms of accuracy and time taken. Francis et al. [57], using a semi-automated method to count water birds from visual UAV data, reported an accuracy that was between 91 and 98% and 500% faster than manual counting.
Automated counts of the thermal imagery in the current study were 9.3% higher than the manual counts. This could have been due to overestimation issues or counter fatigue associated with manual counting. Count automation would have included approximately 20 wallabies that transited through the colony. The difference in counts could also be attributed to subtle variations in thermal signatures that were not detected by the manual counter. Our results were marginally more disparate than those of other studies comparing the counting methods of thermal imagery. Seymour et al. [33] used spectral thresholds and the pixel cluster size sorting of-UAV derived thermal imagery to detect grey seals and reported automated counts to be within 95–98% of human estimates. Bird et al. [58] used a semi-automated workflow of UAV-derived thermal imagery of Adélie penguins in the Western Antarctic Peninsula that revealed no significant difference between automated and manual counts.
4.4. Limitations of Thermal Sensors
The miniaturization of thermal sensors for use with UAV has meant a reduction in their resolution and sensitivity. Consequently, the current generation of uncooled thermal sensors specific for UAV have non-trivial limitations. In addition to the previously mentioned thermal drift issue, these sensors struggle in situations where the target species are well insulated, resulting in a narrowing of the thermal gradient from the background source. Additionally, the ability to distinguish animals in dense vegetation using thermal sensors is limited as the thermal penetration is compromised.
Larger cooled infrared thermal sensors mounted on satellites or aircraft are more powerful than are UAV-mounted uncooled thermal sensors. Lethbridge et al. [44] used a helicopter-mounted thermal sensor to survey kangaroos in wooded areas. The sensor had higher resolution and greater thermal sensitivity than those of uncooled sensors. The sensor weighed 2 kg (FLIR T1K), which is approximately 20 times heavier (and 5 times more expensive) than the UAV-mounted thermal sensor (115 g) used in the current study. In wooded areas, Lethbridge et al. [44] were able to estimate kangaroo numbers, which were almost double those detected by human observers. They suggested that conventional surveys may underestimate the population densities of these kangaroos. Despite the limitations of uncooled thermal sensors, our study successfully surveyed all active burrows in the colony, primarily because vegetation cover was minimal. The colony surveyed consisted of tussock grass and surface succulent ground cover, and thermal penetration was not compromised by this type of vegetation.
The temperature of the background and the target species, and the degree of insulation by either fur, fat or feathers are factors to consider when conducting surveys using uncooled thermal sensors. Spaan et al. [54] successfully detected spider monkeys in a closed canopy forest using an UAV-mounted thermal sensor, partly because the monkeys resided in the terminal branches, and more importantly, because they were not well insulated, contrasting starkly with their surroundings. An extreme example is the highly insulated polar bear, which shows no thermal response, as determined using ground-based thermal equipment [59]. However, using sensors via light aircraft, a thermal signature could be detected in the ice around them and their dens [60]. The short-tailed shearwater chicks surveyed in the current study were not well insulted before fledging. Consequently, they had distinct thermal signatures despite being deep in burrows. Earlier in the season, this method may not have been able to detect failed nests. However, the use of high-resolution UAV thermal remote sensing was appropriate for this species in this colony to determine chick production.
5. Conclusions
The use of UAV is transforming the way we survey and monitor wildlife, especially where access is difficult and when species are highly sensitive to disturbance. UAV visual surveys, however, are not appropriate for nocturnally active, burrow-nesting seabirds and other fossorial animals. The use of UAV equipped with thermal sensors proved time-efficient and cost-effective compared to previous survey methods for short-tailed shearwaters. By utilizing automated techniques alongside the manual counting of thermal imagery, a comprehensive understanding of burrow distribution and occupancy can be achieved. The count automation workflow was substantially quicker than was manually counting occupied burrows in the thermal images. Once the digital number distributions were analyzed, automated counts of occupied burrows for the whole colony took approximately 10 min to complete. The automated and manual count did not achieve the same results; however, the 9.3% discrepancy is a better estimation of chick production than that achieved in previous ground-based surveys using extrapolation methods. This assessment technique for burrow-nesting seabird colonies provides estimates of chick production across the entire colony. Incorporating count automation and clustering techniques of UAV thermally derived data allows replicate surveys to be conducted at key times over the reproductive season prior to fledging. These data can be used to estimate chick mortality over the season. This survey method can also be used to investigate the seasonal timing of reproduction, monitor colony occupancy and assess the colony footprint over time.
Author Contributions
J.V., D.T., G.W. and A.L. conceived the project. J.V., D.T., A.L. and G.W. designed the experimental method, and J.V., G.W. and S.Z. conducted the experiments and data acquisition. J.V., S.Z., G.W., H.W. and D.T. analyzed the data. J.V. wrote the manuscript with contributions from all co-authors. All authors have read and agreed to the published version of the manuscript.
Funding
This research was funded from a UTAS Research Training Program (RTP) stipend to J.V. The TeAX thermal capture calibrator and GNSS rover was funded by Terraluma research group. The FPVR used in this study was funded by the Australian Research Council (ARC-FT130100692) to G.W. Sensor calibration facilities used for the calibration of the TeAX thermal sensor were funded by ARC LE180100118. A.L.’s contribution was facilitated through the ARC LP170101090 and ARC DP180103460 projects. This research was supported by a Winifred Violet Scott Trust grant to J.V. This research was conducted under an Animal Ethics Permit from the University of Tasmania and a wildlife permit from the Department of Natural Resources and Environment Tasmania.
Data Availability Statement
All drone and airborne orthomosaic data, shapefiles, and codes will be made available on request to the corresponding author’s email.
Acknowledgments
Thanks go to to Matt Dell and Zbynˇek Malenovský for discussions and guidance at various stages throughout this study. Terraluma research group (School of Geography, Planning, and Spatial Sciences, University of Tasmania) provided equipment for this research. The authors wish to thank two anonymous reviewers for their constructive comments, which helped improve the quality of this manuscript. This research took place on Lunawanna-Allonah, the unceded land of the Palawa people, the traditional and continuing custodians of Lutruwita.
Conflicts of Interest
Author Henry Walshaw was employed by the company FloodMapp.
References
- Croxall, J.P.; Butchart, S.H.M.; Lascelles, B.E.N.; Stattersfield, A.J.; Sullivan, B.E.N.; Symes, A.; Taylor, P. Seabird conservation status, threats and priority actions: A global assessment. Bird Conserv. Int. 2012, 22, 1–34. [Google Scholar] [CrossRef]
- Paleczny, M.; Hammill, E.; Karpouzi, V.; Pauly, D. Population Trend of the World’s Monitored Seabirds, 1950–2010. PLoS ONE 2015, 10, e0129342. [Google Scholar] [CrossRef] [PubMed]
- Spatz, D.R.; Newton, K.M.; Heinz, R.; Tershy, B.; Holmes, N.D.; Butchart, S.H.M.; Croll, D.A. The Biogeography of Globally Threatened Seabirds and Island Conservation Opportunities. Conserv. Biol. 2014, 28, 1282–1290. [Google Scholar] [CrossRef] [PubMed]
- Brooke, M.d.L. The food consumption of the world’s seabirds. Proc. R. Soc. Lond. Ser. B Biol. Sci. 2004, 271, S246–S248. [Google Scholar]
- Bradley, J.S.; Skira, I.J.; Wooller, R.D. A long-term study of Short-tailed Shearwaters Puffinus tenuirostris on Fisher Island, Australia. Ibis 1991, 133, 55–61. [Google Scholar] [CrossRef]
- Parker, G.C.; Rexer-Huber, K. Guidelines for Designing Burrowing Petrel Surveys to Improve Population Estimate Precision; Agreement on the Conservation of Albatrosses and Petrels Conservation Guidelines Series; Agreement on the Conservation of Albatrosses and Petrels: Hobart, Australia, 2016. [Google Scholar]
- Pearson, S.F.; Hodum, P.J.; Good, T.P.; Schrimpf, M.; Knapp, S.M. A Model Approach for Estimating Colony Size, Trends, and Habitat Associations of Burrow-Nesting Seabirds: Un Enfoque Modelo Para Estimar el Tamaño de la Colonia, las Tendencias y las Asociaciones de Habitat en Aves Marinas Que Anidan en Madrigueras. Condor 2013, 115, 356–365. [Google Scholar] [CrossRef]
- Orben, R.A.; Fleishman, A.B.; Borker, A.L.; Bridgeland, W.; Gladics, A.J.; Porquez, J.; Sanzenbacher, P.; Stephensen, S.W.; Swift, R.; McKown, M.W.; et al. Comparing imaging, acoustics, and radar to monitor Leach’s storm-petrel colonies. PeerJ 2019, 7, e6721. [Google Scholar] [CrossRef]
- Carey, M.J. Incubation routine, duration of foraging trips and regulation of body mass in Short-tailed Shearwaters (Ardenna tenuirostris). Emu—Austral. Ornithol. 2011, 111, 166–171. [Google Scholar] [CrossRef]
- Skira, I.J.; Brothers, N.P.; Pemberton, D. Distribution, abundance and conservation status of Short-tailed Shearwaters Puffinus tenuirostris in Tasmania, Australia. Mar. Ornithol. 1996, 24, 1–14. [Google Scholar]
- Skira, I.; Brothers, N. Seabird Islands No. 184: Great Dog Island, Furneaux Group, Tasmania. Corella 1988, 12, 82–84. [Google Scholar]
- Vertigan, C.A. The life-history of Short-Tailed Shearwaters (Puffinus tenuirostris) in Response to Spatio-Temporal Environmental Variation. Ph.D. Thesis, University of Tasmania, Hobart, Australia, 2010. [Google Scholar]
- Oppel, S.; Hervías-Parejo, S.; Oliveira, N.; Pipa, T.; Silva, C.; Geraldes, P.; Goh, M.; Immler, E.; McKown, M. Estimating population size of a nocturnal burrow-nesting seabird using acoustic monitoring and habitat mapping. Nat. Conserv. 2014, 7, 1–13. [Google Scholar] [CrossRef]
- Christie, K.S.; Gilbert, S.L.; Brown, C.L.; Hatfield, M.; Hanson, L. Unmanned aircraft systems in wildlife research: Current and future applications of a transformative technology. Front. Ecol. Environ. 2016, 14, 241–251. [Google Scholar] [CrossRef]
- Gómez-Candón, D.; Virlet, N.; Labbé, S.; Jolivot, A.; Regnard, J.-L. Field phenotyping of water stress at tree scale by UAV-sensed imagery: New insights for thermal acquisition and calibration. Precis. Agric. 2016, 17, 786–800. [Google Scholar] [CrossRef]
- Hoffmann, H.; Jensen, R.; Thomsen, A.; Nieto, H.; Rasmussen, J.; Friborg, T. Crop water stress maps for an entire growing season from visible and thermal UAV imagery. Biogeosciences 2016, 13, 6545–6563. [Google Scholar] [CrossRef]
- Smigaj, M.; Gaulton, R.; Suarez, J.C.; Barr, S.L. Use of miniature thermal cameras for detection of physiological stress in conifers. Remote Sens. 2017, 9, 957. [Google Scholar] [CrossRef]
- Scholten, C.; Kamphuis, A.; Vredevoogt, K.; Lee-Strydhorst, K.; Atma, J.; Shea, C.; Lamberg, O.; Proppe, D. Real-time thermal imagery from an unmanned aerial vehicle can locate ground nests of a grassland songbird at rates similar to traditional methods. Biol. Conserv. 2019, 233, 241–246. [Google Scholar] [CrossRef]
- Dickens, J.; Hollyman, P.R.; Hart, T.; Clucas, G.V.; Murphy, E.J.; Poncet, S.; Trathan, P.N.; Collins, M.A. Developing UAV Monitoring of South Georgia and the South Sandwich Islands’ Iconic Land-Based Marine Predators. Front. Mar. Sci. 2021, 8, 654215. [Google Scholar] [CrossRef]
- Drever, M.C.; Chabot, D.; O’Hara, P.D.; Thomas, J.D.; Breault, A.; Millikin, R.L. Evaluation of an unmanned rotorcraft to monitor wintering waterbirds and coastal habitats in British Columbia, Canada. J. Unmanned Veh. Syst. 2015, 3, 256–267. [Google Scholar] [CrossRef]
- Hodgson, J.C.; Mott, R.; Baylis, S.M.; Pham, T.T.; Wotherspoon, S.; Kilpatrick, A.D.; Raja Segaran, R.; Reid, I.; Terauds, A.; Koh, L.P. Drones count wildlife more accurately and precisely than humans. Methods Ecol. Evol. 2018, 9, 1160–1167. [Google Scholar] [CrossRef]
- Sardà-Palomera, F.; Bota, G.; Viñolo, C.; Pallares Valls, O.; Sazatornil, V.; Brotons, L.; Gomariz, S.; Sardà, F. Fine-scale bird monitoring from light unmanned aircraft systems. Ibis 2012, 154, 177–183. [Google Scholar] [CrossRef]
- Junda, J.; Greene, E.; Bird, D.M. Proper flight technique for using a small rotary-winged drone aircraft to safely, quickly, and accurately survey raptor nests. J. Unmanned Veh. Syst. 2015, 3, 222–236. [Google Scholar] [CrossRef]
- Albores-Barajas, Y.V.; Soldatini, C.; Ramos-Rodríguez, A.; Alcala-Santoyo, J.E.; Carmona, R.; Dell’Omo, G. A new use of technology to solve an old problem: Estimating the population size of a burrow nesting seabird. PLoS ONE 2018, 13, e0202094. [Google Scholar] [CrossRef]
- McCafferty, D.J. Applications of thermal imaging in avian science. Ibis 2013, 155, 4–15. [Google Scholar] [CrossRef]
- Lee, W.Y.; Park, M.; Hyun, C.-U. Detection of two Arctic birds in Greenland and an endangered bird in Korea using RGB and thermal cameras with an unmanned aerial vehicle (UAV). PLoS ONE 2019, 14, e0222088. [Google Scholar] [CrossRef] [PubMed]
- Israel, M.; Reinhard, A. Detecting nests of lapwing birds with the aid of a small unmanned aerial vehicle with thermal camera; 2017. In Proceedings of the International Conference on Unmanned Aircraft Systems (ICUAS), Miami, FL, USA, 13–16 June 2017; pp. 1199–1207. [Google Scholar] [CrossRef]
- Chabot, D.; Francis, C.M. Computer-automated bird detection and counts in high-resolution aerial images: A review. J. Field Ornithol. 2016, 87, 343–359. [Google Scholar] [CrossRef]
- Grenzdörffer, G. UAS-based automatic bird count of a common gull colony. Int. Arch. Photogramm. Remote Sens. Spat. Inf. Sci. 2013, 1, W2. [Google Scholar] [CrossRef]
- Ratcliffe, N.; Guihen, D.; Robst, J.; Crofts, S.; Stanworth, A.; Enderlein, P. A protocol for the aerial survey of penguin colonies using UAVs. J. Unmanned Veh. Syst. 2015, 3, 95–101. [Google Scholar] [CrossRef]
- Hayes, M.C.; Gray, P.C.; Harris, G.; Sedgwick, W.C.; Crawford, V.D.; Chazal, N.; Crofts, S.; Johnston, D.W. Drones and deep learning produce accurate and efficient monitoring of large-scale seabird colonies. Ornithol. Appl. 2021, 123, duab022. [Google Scholar] [CrossRef]
- Norouzzadeh, M.S.; Nguyen, A.; Kosmala, M.; Swanson, A.; Palmer, M.S.; Packer, C.; Clune, J. Automatically identifying, counting, and describing wild animals in camera-trap images with deep learning. Proc. Natl. Acad. Sci. USA 2018, 115, E5716–E5725. [Google Scholar] [CrossRef]
- Seymour, A.; Dale, J.; Hammill, M.; Halpin, P.; Johnston, D. Automated detection and enumeration of marine wildlife using unmanned aircraft systems (UAS) and thermal imagery. Sci. Rep. 2017, 7, 1–10. [Google Scholar] [CrossRef]
- Cunningham, D.J.; Anderson, W.H.; Anthony, R.M. An image-processing program for automated counting. Wildl. Soc. Bull. 1996, 24, 345–346. [Google Scholar]
- Lhoest, S.; Linchant, J.; Quevauvillers, S.; Vermeulen, C.; Lejeune, P. How many hippos (HOMHIP): Algorithm for automatic counts of animals with infra-red thermal imagery from UAV. Int. Arch. Photogramm. Remote Sens. Spat. Inf. Sci. 2015, 40, 355–362. [Google Scholar] [CrossRef]
- Laliberte, A.S.; Ripple, W.J. Automated Wildlife Counts from Remotely Sensed Imagery. Wildl. Soc. Bull. 1973–2006 2003, 31, 362–371. [Google Scholar]
- Woehler, E.; Raymond, B.; Watts, D.J. Convergence or divergence: Where do short-tailed shearwaters forage in the Southern Ocean? Mar. Ecol. Prog. Ser. 2006, 324, 261–270. [Google Scholar] [CrossRef]
- TeAX. ThermalcaptureCalibrator2. Available online: https://thermalcapture.com/thermalcapture-calibrator-2/ (accessed on 10 October 2023).
- Virtue, J.; Turner, D.; Williams, G.; Zeliadt, S.; McCabe, M.; Lucieer, A. Thermal Sensor Calibration for Unmanned Aerial Systems Using an External Heated Shutter. Drones 2021, 5, 119. [Google Scholar] [CrossRef]
- Skira, I. Food of the Short-Tailed Shearwater, Puffinus tenuirostris, in Tasmania. Wildl. Res. 1986, 13, 481–488. [Google Scholar] [CrossRef]
- Skira, I. The Short-tailed Shearwater: A review of its biology. Corella 1991, 15, 45–52. [Google Scholar]
- Kemp, A.; Dann, P. Egg size, incubation periods and hatching success of Little Penguins, Eudyptula minor. Emu—Austral. Ornithol. 2001, 101, 249–253. [Google Scholar] [CrossRef]
- Robinson, S.; Chiaradia, A.; Hindell, M.A. The effect of body condition on the timing and success of breeding in Little Penguins Eudyptula minor. Ibis 2005, 147, 483–489. [Google Scholar] [CrossRef]
- Lethbridge, M.; Stead, M.; Wells, C. Estimating kangaroo density by aerial survey: A comparison of thermal cameras with human observers. Wildl. Res. 2019, 46, 639–648. [Google Scholar] [CrossRef]
- Boonstra, R.; Krebs, C.J.; Boutin, S.; Eadie, J.M. Finding Mammals Using Far-Infrared Thermal Imaging. J. Mammal. 1994, 75, 1063–1068. [Google Scholar] [CrossRef]
- Cox, T.E.; Matthews, R.; Halverson, G.; Morris, S. Hot stuff in the bushes: Thermal imagers and the detection of burrows in vegetated sites. Ecol. Evol. 2021, 11, 6406–6414. [Google Scholar] [CrossRef] [PubMed]
- Calik, R.C.; Tunali, E.; Ercan, B.; Öz, S. A Study on Calibration Methods for Infrared Focal Plane Array Cameras. In Proceedings of the VISIGRAPP (4: VISAPP), Funchal, Portugal, 27–29 January 2018; pp. 219–226. [Google Scholar]
- Yuan, W.; Hua, W. A Case Study of Vignetting Nonuniformity in UAV-Based Uncooled Thermal Cameras. Drones 2022, 6, 394. [Google Scholar] [CrossRef]
- Kelly, J.; Kljun, N.; Olsson, P.-O.; Mihai, L.; Liljeblad, B.; Weslien, P.; Klemedtsson, L.; Eklundh, L. Challenges and Best Practices for Deriving Temperature Data from an Uncalibrated UAV Thermal Infrared Camera. Remote Sens. 2019, 11, 567. [Google Scholar] [CrossRef]
- Aasen, H.; Honkavaara, E.; Lucieer, A.; Zarco-Tejada, P.J. Quantitative remote sensing at ultra-high resolution with UAV spectroscopy: A review of sensor technology, measurement procedures, and data correction workflows. Remote Sens. 2018, 10, 1091. [Google Scholar] [CrossRef]
- Meier, F.; Scherer, D.; Richters, J.; Christen, A. Atmospheric correction of thermal-infrared imagery of the 3-D urban environment acquired in oblique viewing geometry. Atmos. Meas. Tech. 2011, 4, 909–922. [Google Scholar] [CrossRef]
- Maes, W.H.; Huete, A.R.; Steppe, K. Optimizing the processing of UAV-based thermal imagery. Remote Sens. 2017, 9, 476. [Google Scholar] [CrossRef]
- Goldman, D.B. Vignette and exposure calibration and compensation. IEEE Trans. Pattern Anal. Mach. Intell. 2010, 32, 2276–2288. [Google Scholar] [CrossRef]
- Spaan, D.; Burke, C.; McAree, O.; Aureli, F.; Rangel-Rivera, C.E.; Hutschenreiter, A.; Longmore, S.N.; McWhirter, P.R.; Wich, S.A. Thermal Infrared Imaging from Drones Offers a Major Advance for Spider Monkey Surveys. Drones 2019, 3, 34. [Google Scholar] [CrossRef]
- Howell, L.G.; Clulow, J.; Jordan, N.R.; Beranek, C.T.; Ryan, S.A.; Roff, A.; Witt, R.R. Drone thermal imaging technology provides a cost-effective tool for landscape-scale monitoring of a cryptic forest-dwelling species across all population densities. Wildl. Res. 2022, 49, 66–78. [Google Scholar] [CrossRef]
- Akçay, H.G.; Kabasakal, B.; Aksu, D.; Demir, N.; Öz, M.; Erdoğan, A. Automated Bird Counting with Deep Learning for Regional Bird Distribution Mapping. Animals 2020, 10, 1207. [Google Scholar] [CrossRef] [PubMed]
- Francis, R.; Lyons, M.; Kingsford, R.; Brandis, K. Counting Mixed Breeding Aggregations of Animal Species Using Drones: Lessons from Waterbirds on Semi-Automation. Remote Sens. 2020, 12, 1185. [Google Scholar] [CrossRef]
- Bird, C.N.; Dawn, A.H.; Dale, J.; Johnston, D.W. A Semi-Automated Method for Estimating Adélie Penguin Colony Abundance from a Fusion of Multispectral and Thermal Imagery Collected with Unoccupied Aircraft Systems. Remote Sens. 2020, 12, 3692. [Google Scholar] [CrossRef]
- Stirling, I. Polar bears and oil: Ecologic perspectives. In Sea Mammals and Oil: Confronting the Risks; Academic Press: Cambridge, MA, USA, 1990; pp. 223–234. [Google Scholar]
- Amstrup, S.; York, G.; McDonald, T.; Nielson, R.; Simac, K. Detecting Denning Polar Bears with Forward-Looking Infrared (FLIR) Imagery. BioScience 2009, 54, 337–344. [Google Scholar] [CrossRef]
Figure 1.
Short-tailed shearwater (Ardenna tenuirostris) colony at Whale Bone Point, Bruny Island, Tasmania, Australia. The map on the left was created with RGB imagery acquired during the 2022 survey, with QGIS software (version 3.6.2) using QuickMapsServices’ contributed pack. Source: ESRI Grey layer and ESRI satellite layer (coordinate system: GDA2020 UTM55S).

Figure 2.
DJI Phantom 4 Pro with thermal sensor and custom mounting bracket. (Left) Front side view showing the custom mounting bracket attached to the underside. The external GPS custom aluminum bracket seen to the right-hand side of the airframe is clear of propellors and does not interfere with the onboard GNSS. (Right) Under view of the DJI Phantom 4 Pro.

Figure 3.
Occupied burrows of short-tailed shearwater chicks in varying vegetation types. (a) Coastal sword-sedge (Lepidosperma gladiatum), (b) coastal tussock grass (Poa poiformis), (c) Poa poiformis, and (d) pigface (Carpobrotus rossii). Ground validation was achieved with the aluminum targets on bamboo stakes shown next to the burrow entrances.
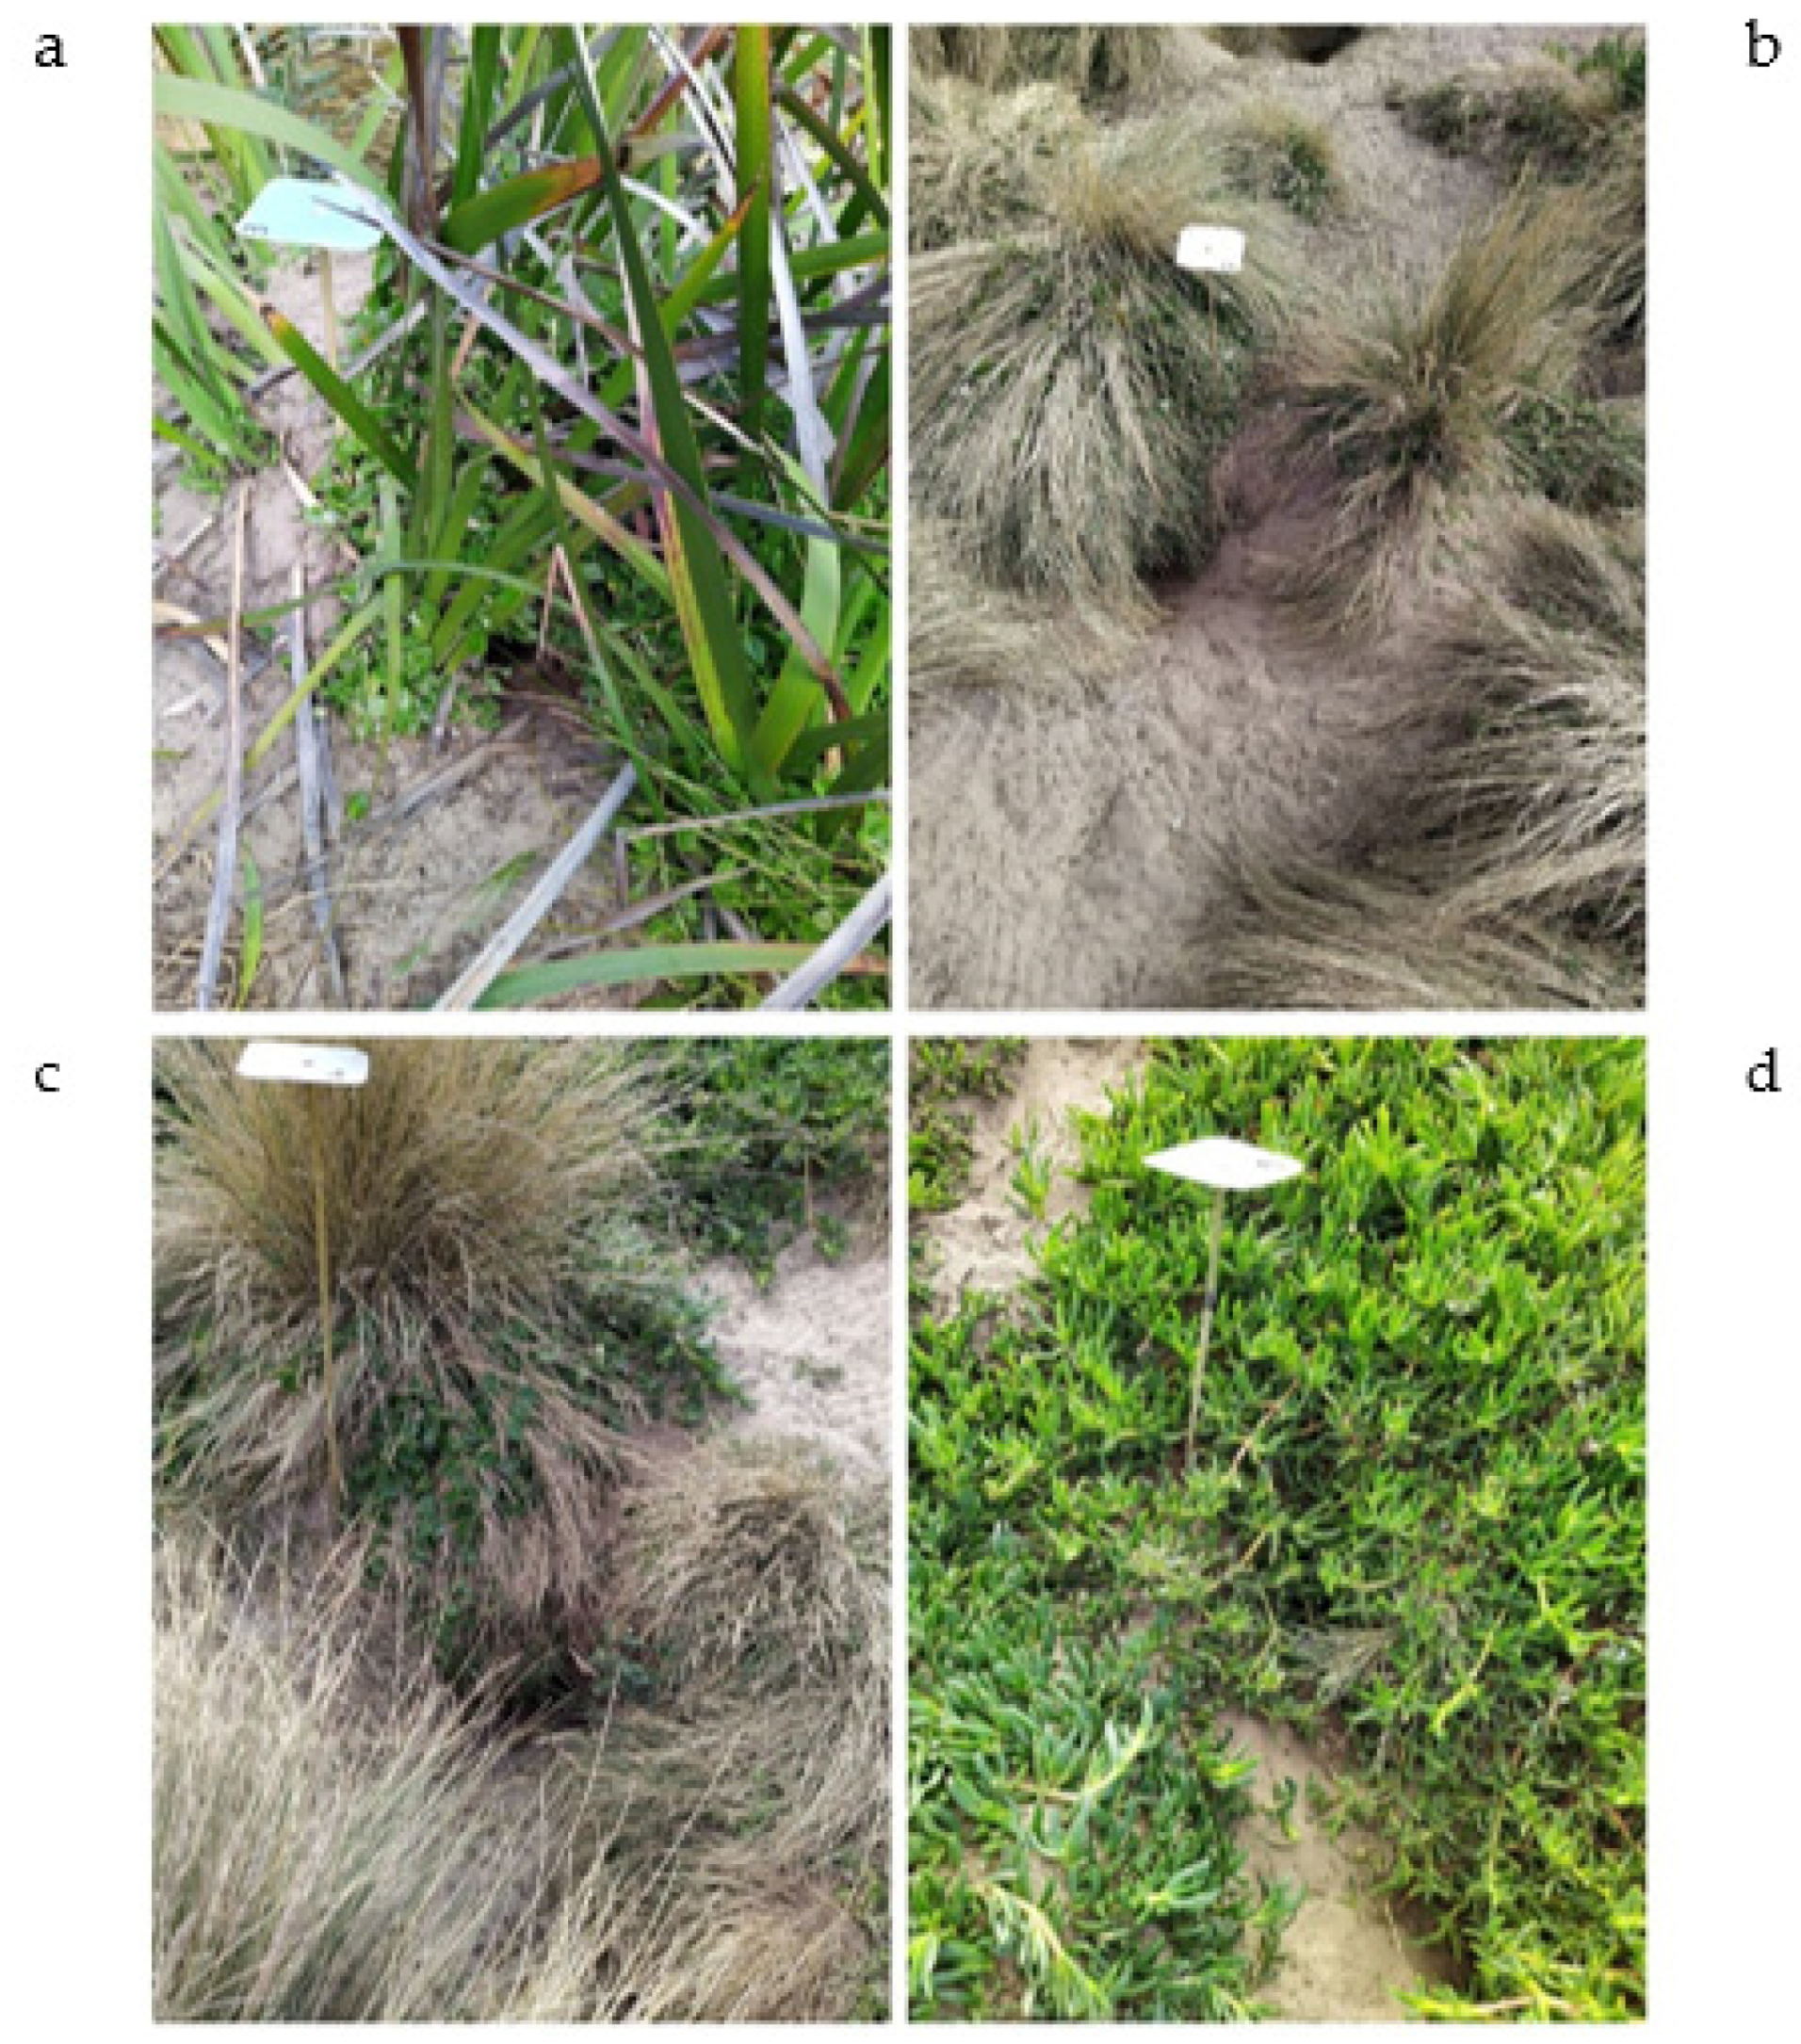
Figure 4.
Thermal orthomosaic of the short-tailed shearwater (Ardenna tenuirostris) colony at Whale Bone Point, Bruny Island, Tasmania, during the 2021/2022 breeding season. This orthomosaic was constructed from thermal images captured using a TeAx thermal imaging camera attached to a DJI Phantom 4 Pro. This image was created with AgiSoft PhotoScan (Version 1.4.4) (coordinate system: GDA2020 UTM55S). The insert on the right represents a 12 m2 subsection of the study area displaying positive thermal responses (light dots circled with white) of occupied burrows, negative thermal responses (black dots circled with red) and responses due to aluminum targets being placed adjacent to manually inspected occupied burrows.
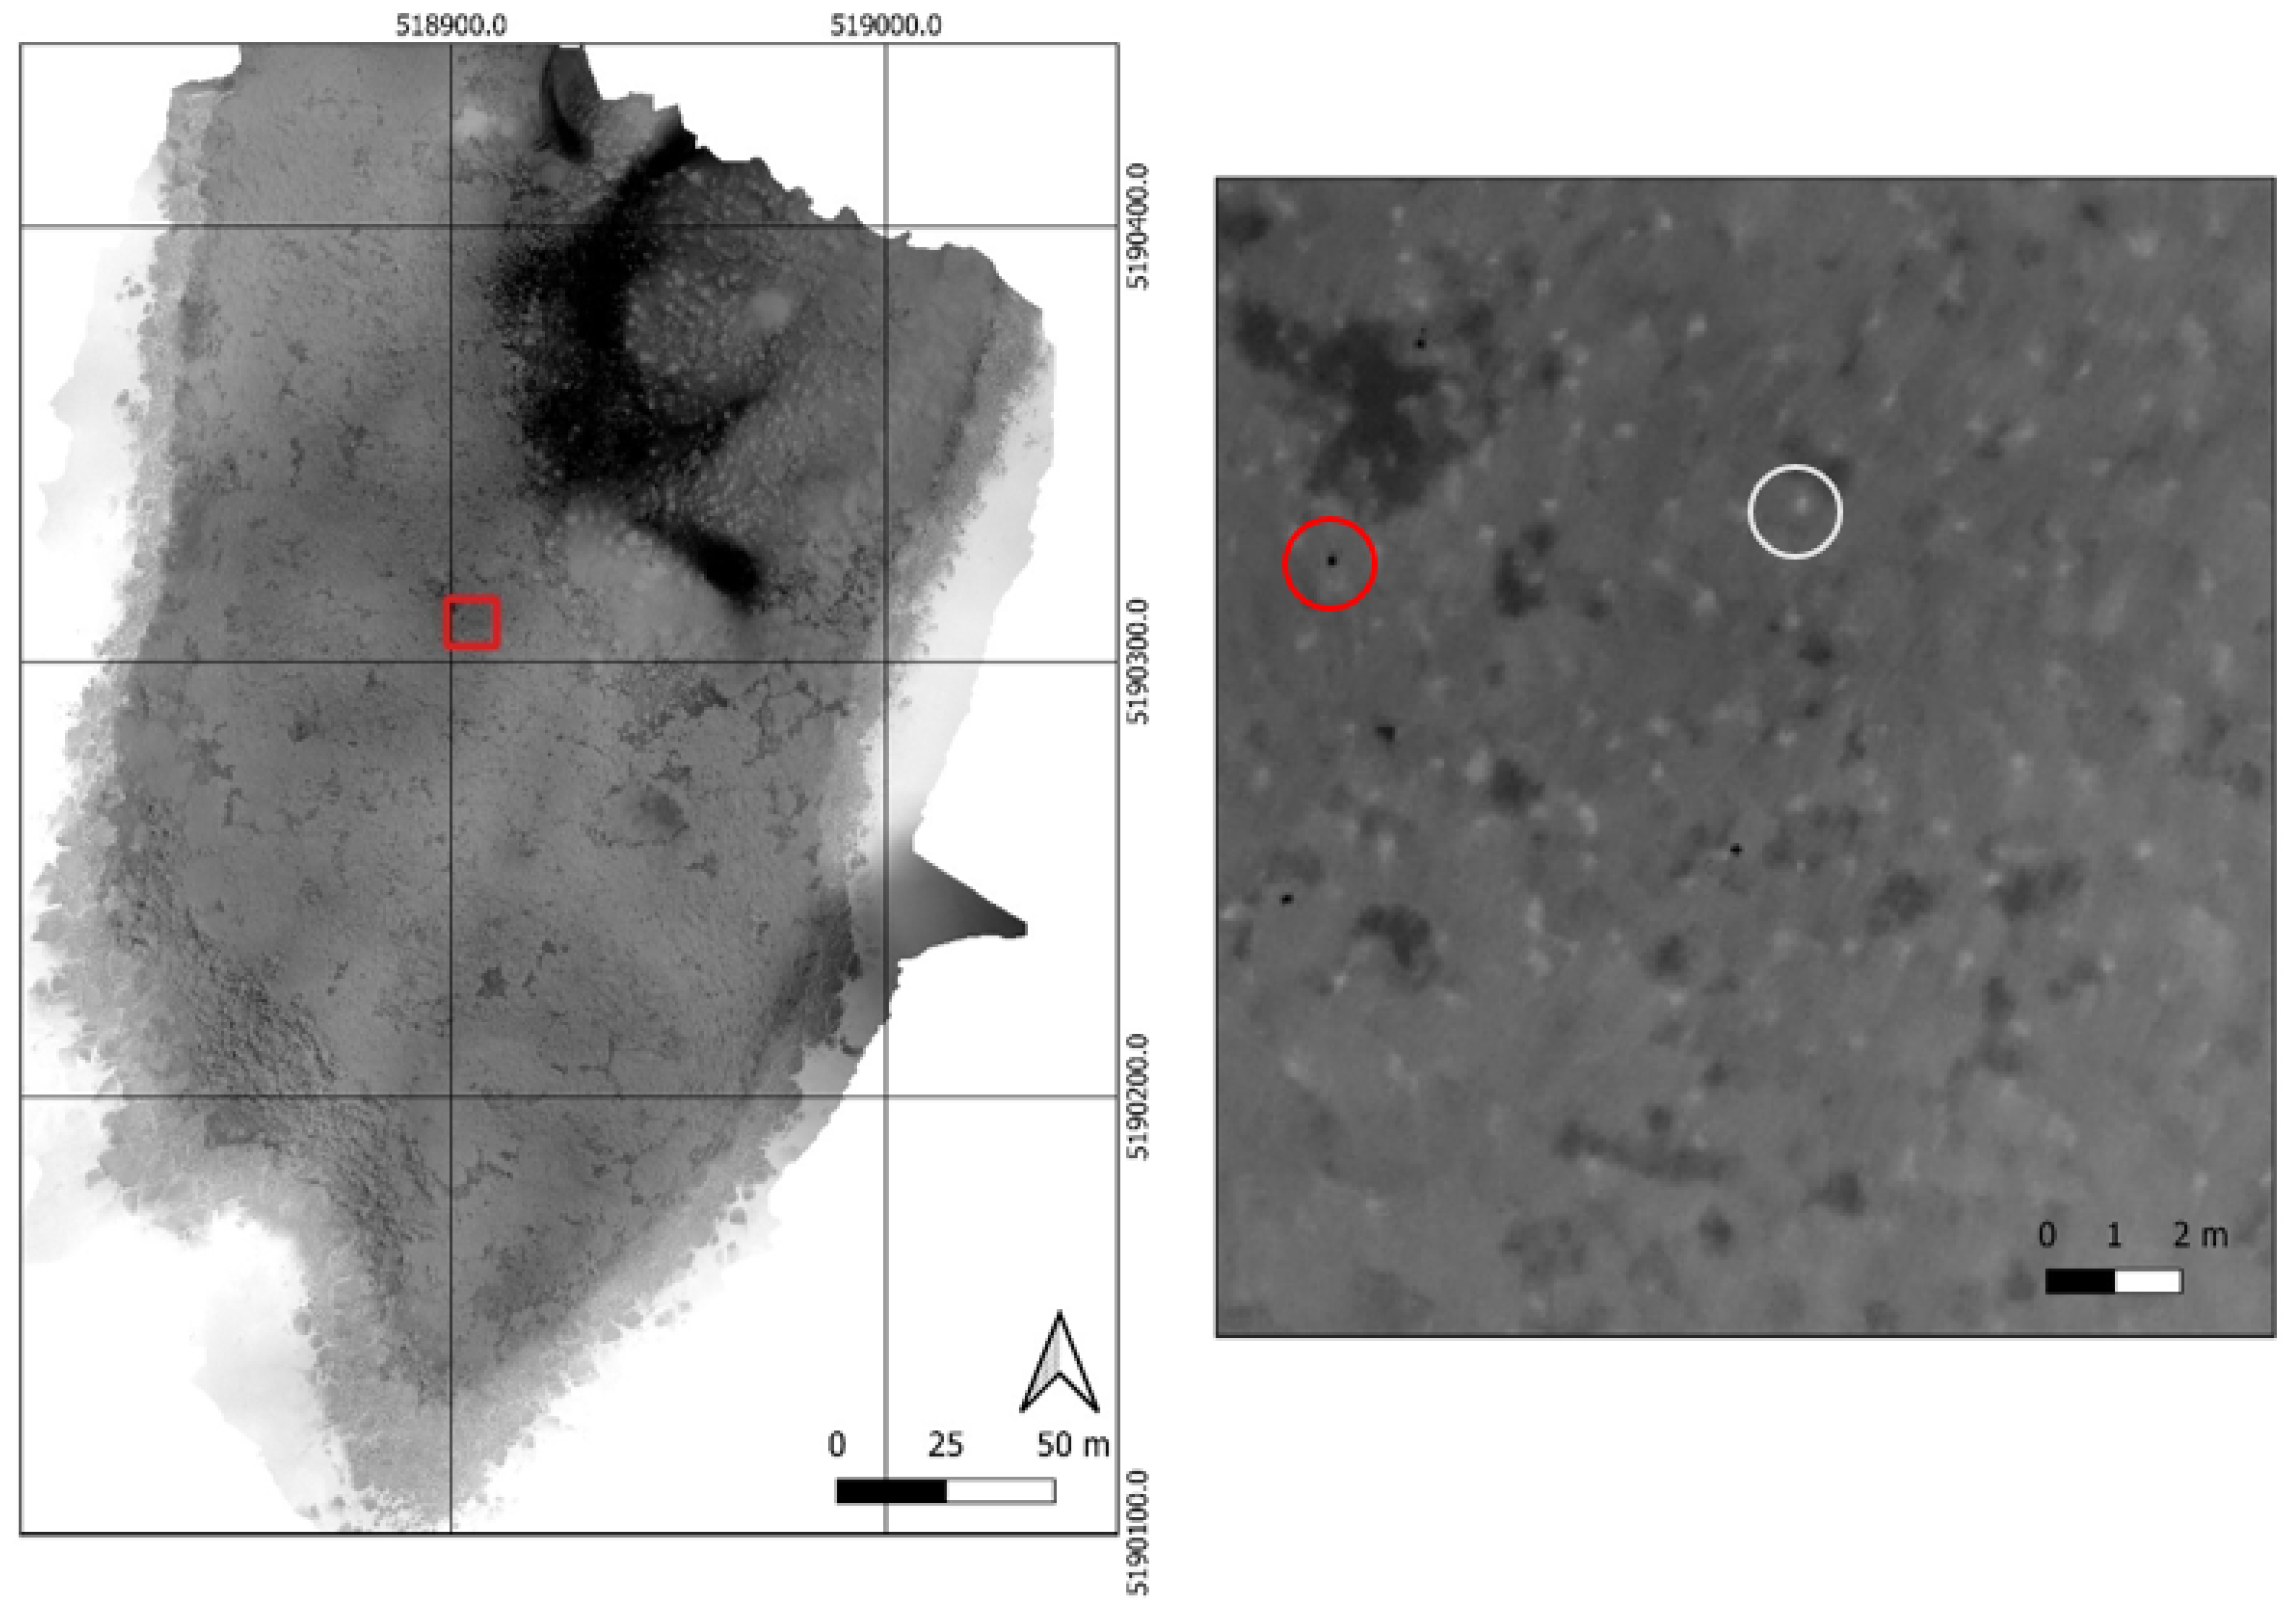
Figure 5.
An example of a window used to crop an orthophoto. (a) Exported orthophoto; (b) central 50% window overlaid on an orthophoto; and (c) the resultant portion of an orthophoto that fell within the central window used for analysis.
Figure 5.
An example of a window used to crop an orthophoto. (a) Exported orthophoto; (b) central 50% window overlaid on an orthophoto; and (c) the resultant portion of an orthophoto that fell within the central window used for analysis.

Figure 6.
The distribution of temperatures in both orthomosaics and orthophotos due to sensor drift. (a) Distribution of temperature pixel count in the full orthomosaic of occupied burrows in the short-tailed shearwater colony. (b) Distribution of temperature pixel count in individual orthophotos which make up the orthomosaic. The orthophoto pixel calculations are grouped by quartiles based on orthomosaic pixel values.
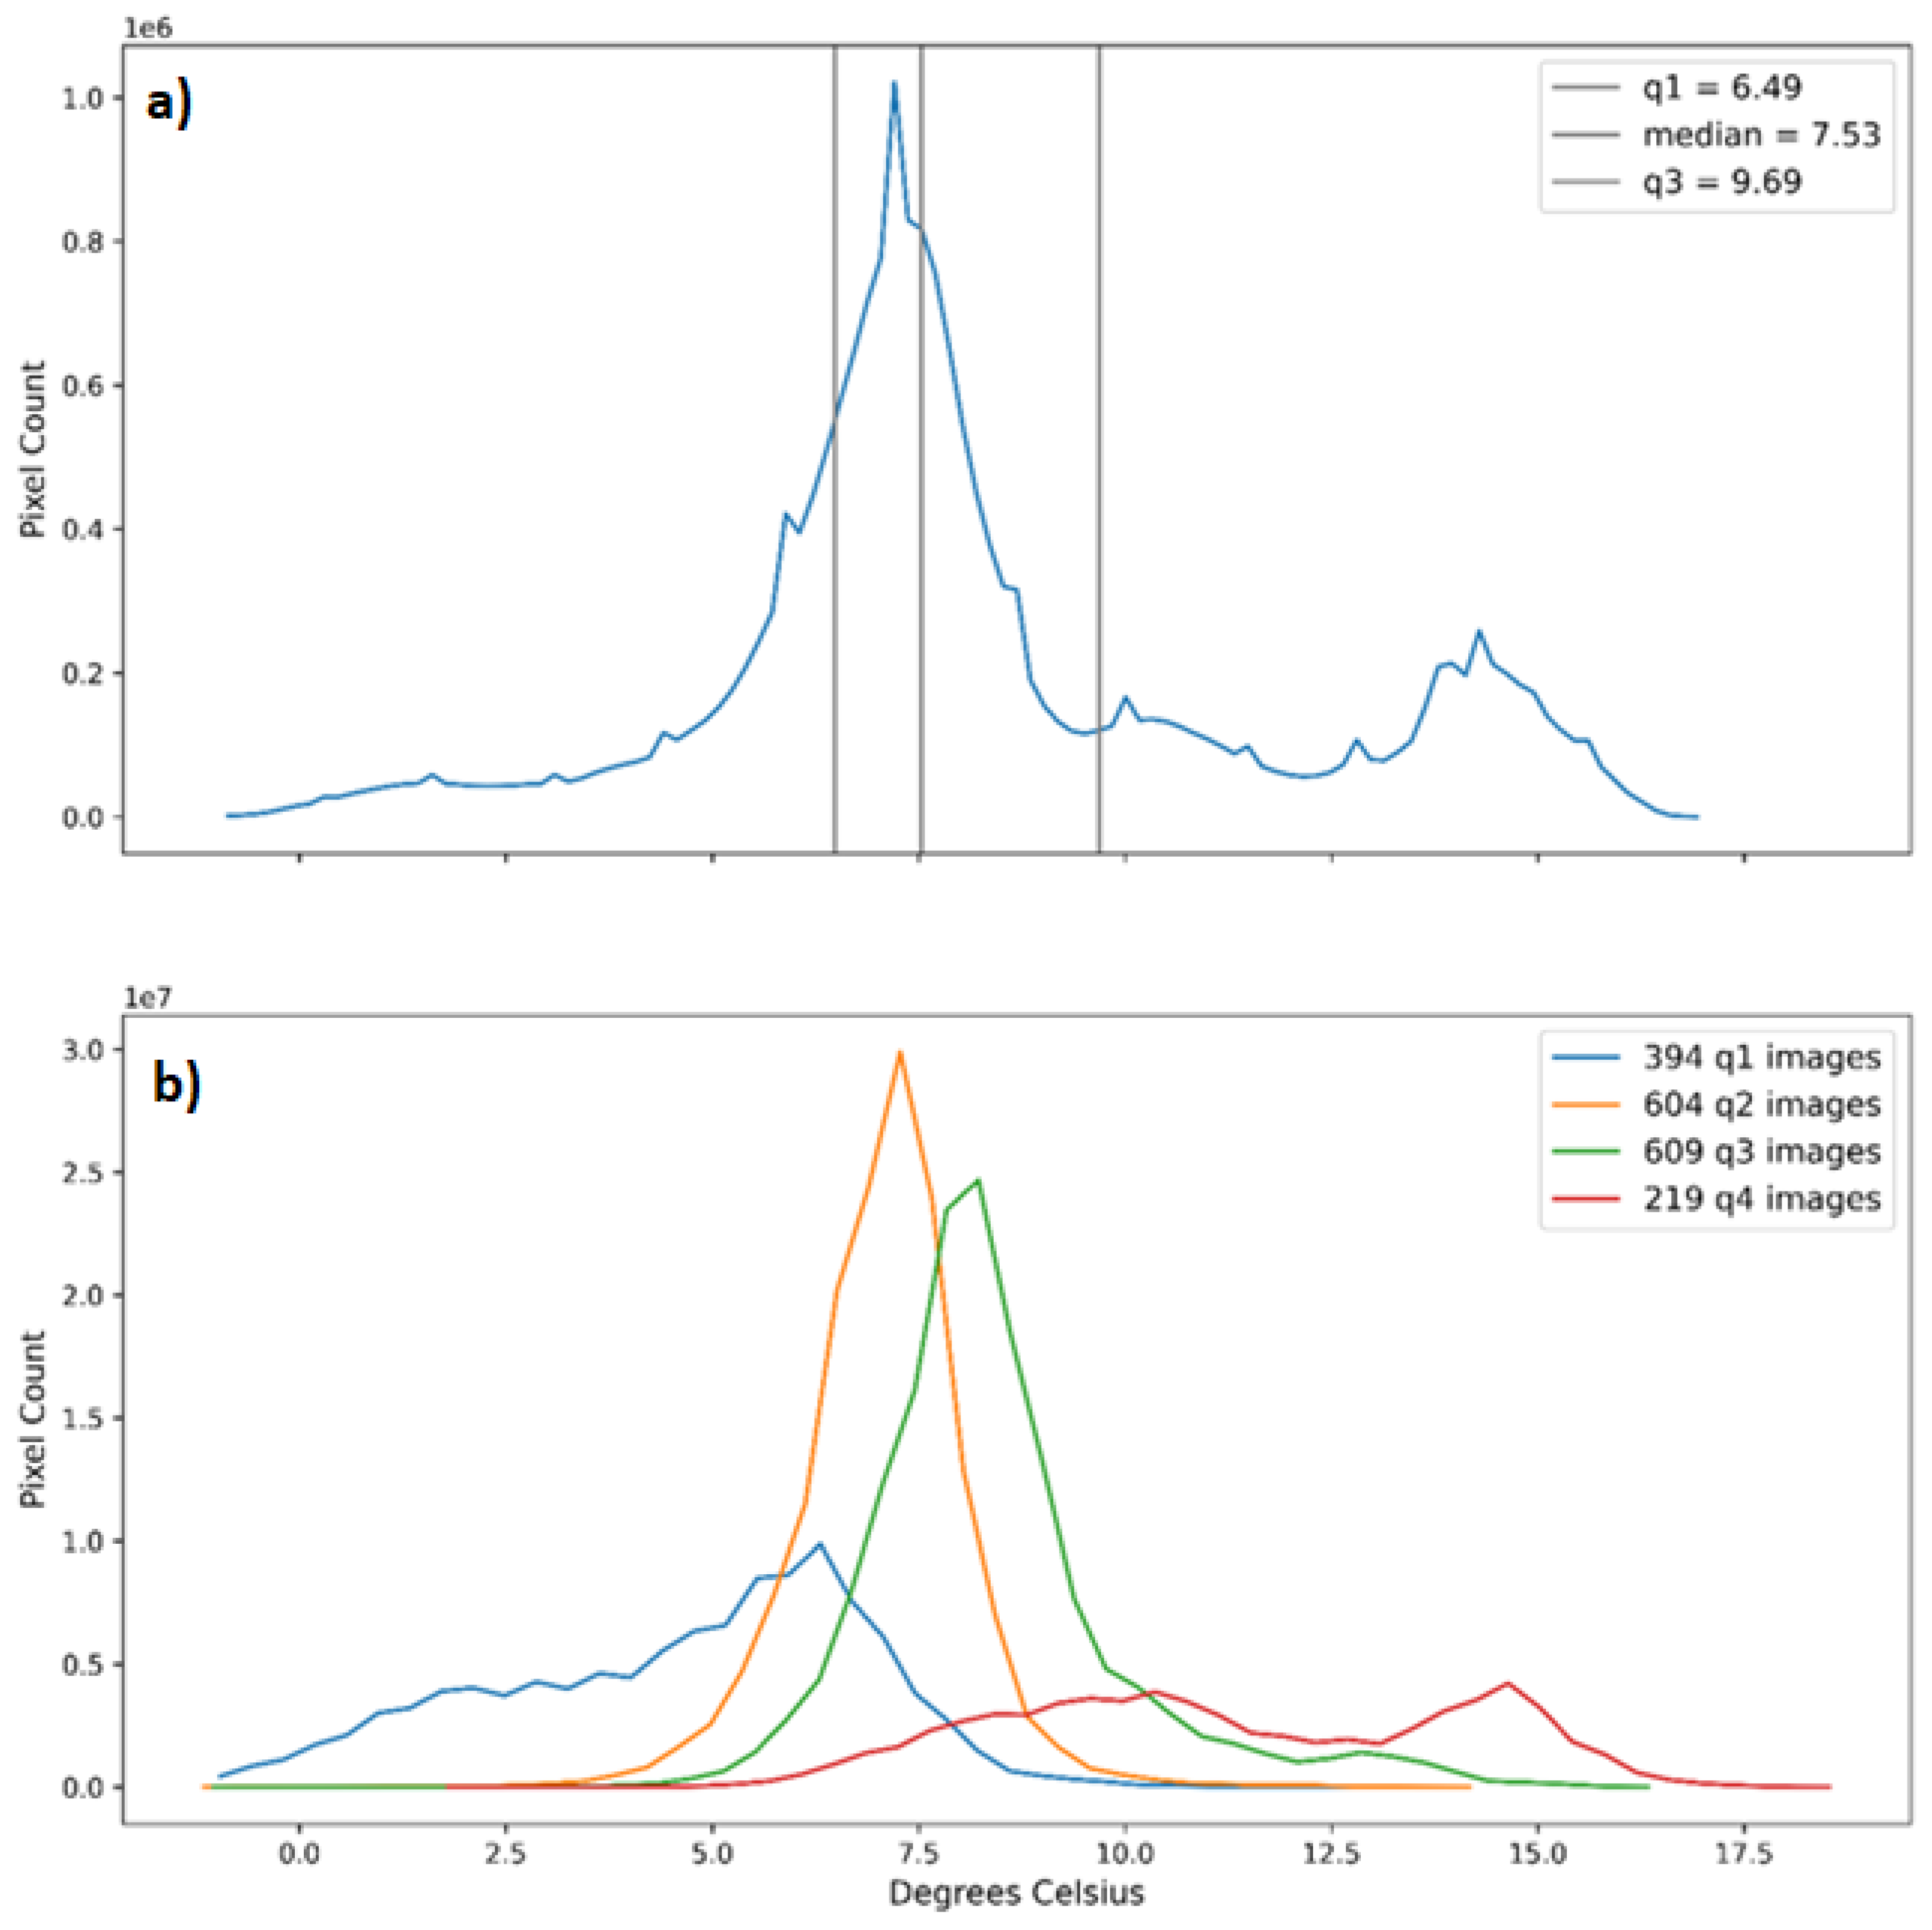
Figure 7.
Distribution of mean temperatures (°C) of occupied short-tailed shearwater burrows calculated from the count automation process based on the individual burrow locations.
Figure 7.
Distribution of mean temperatures (°C) of occupied short-tailed shearwater burrows calculated from the count automation process based on the individual burrow locations.
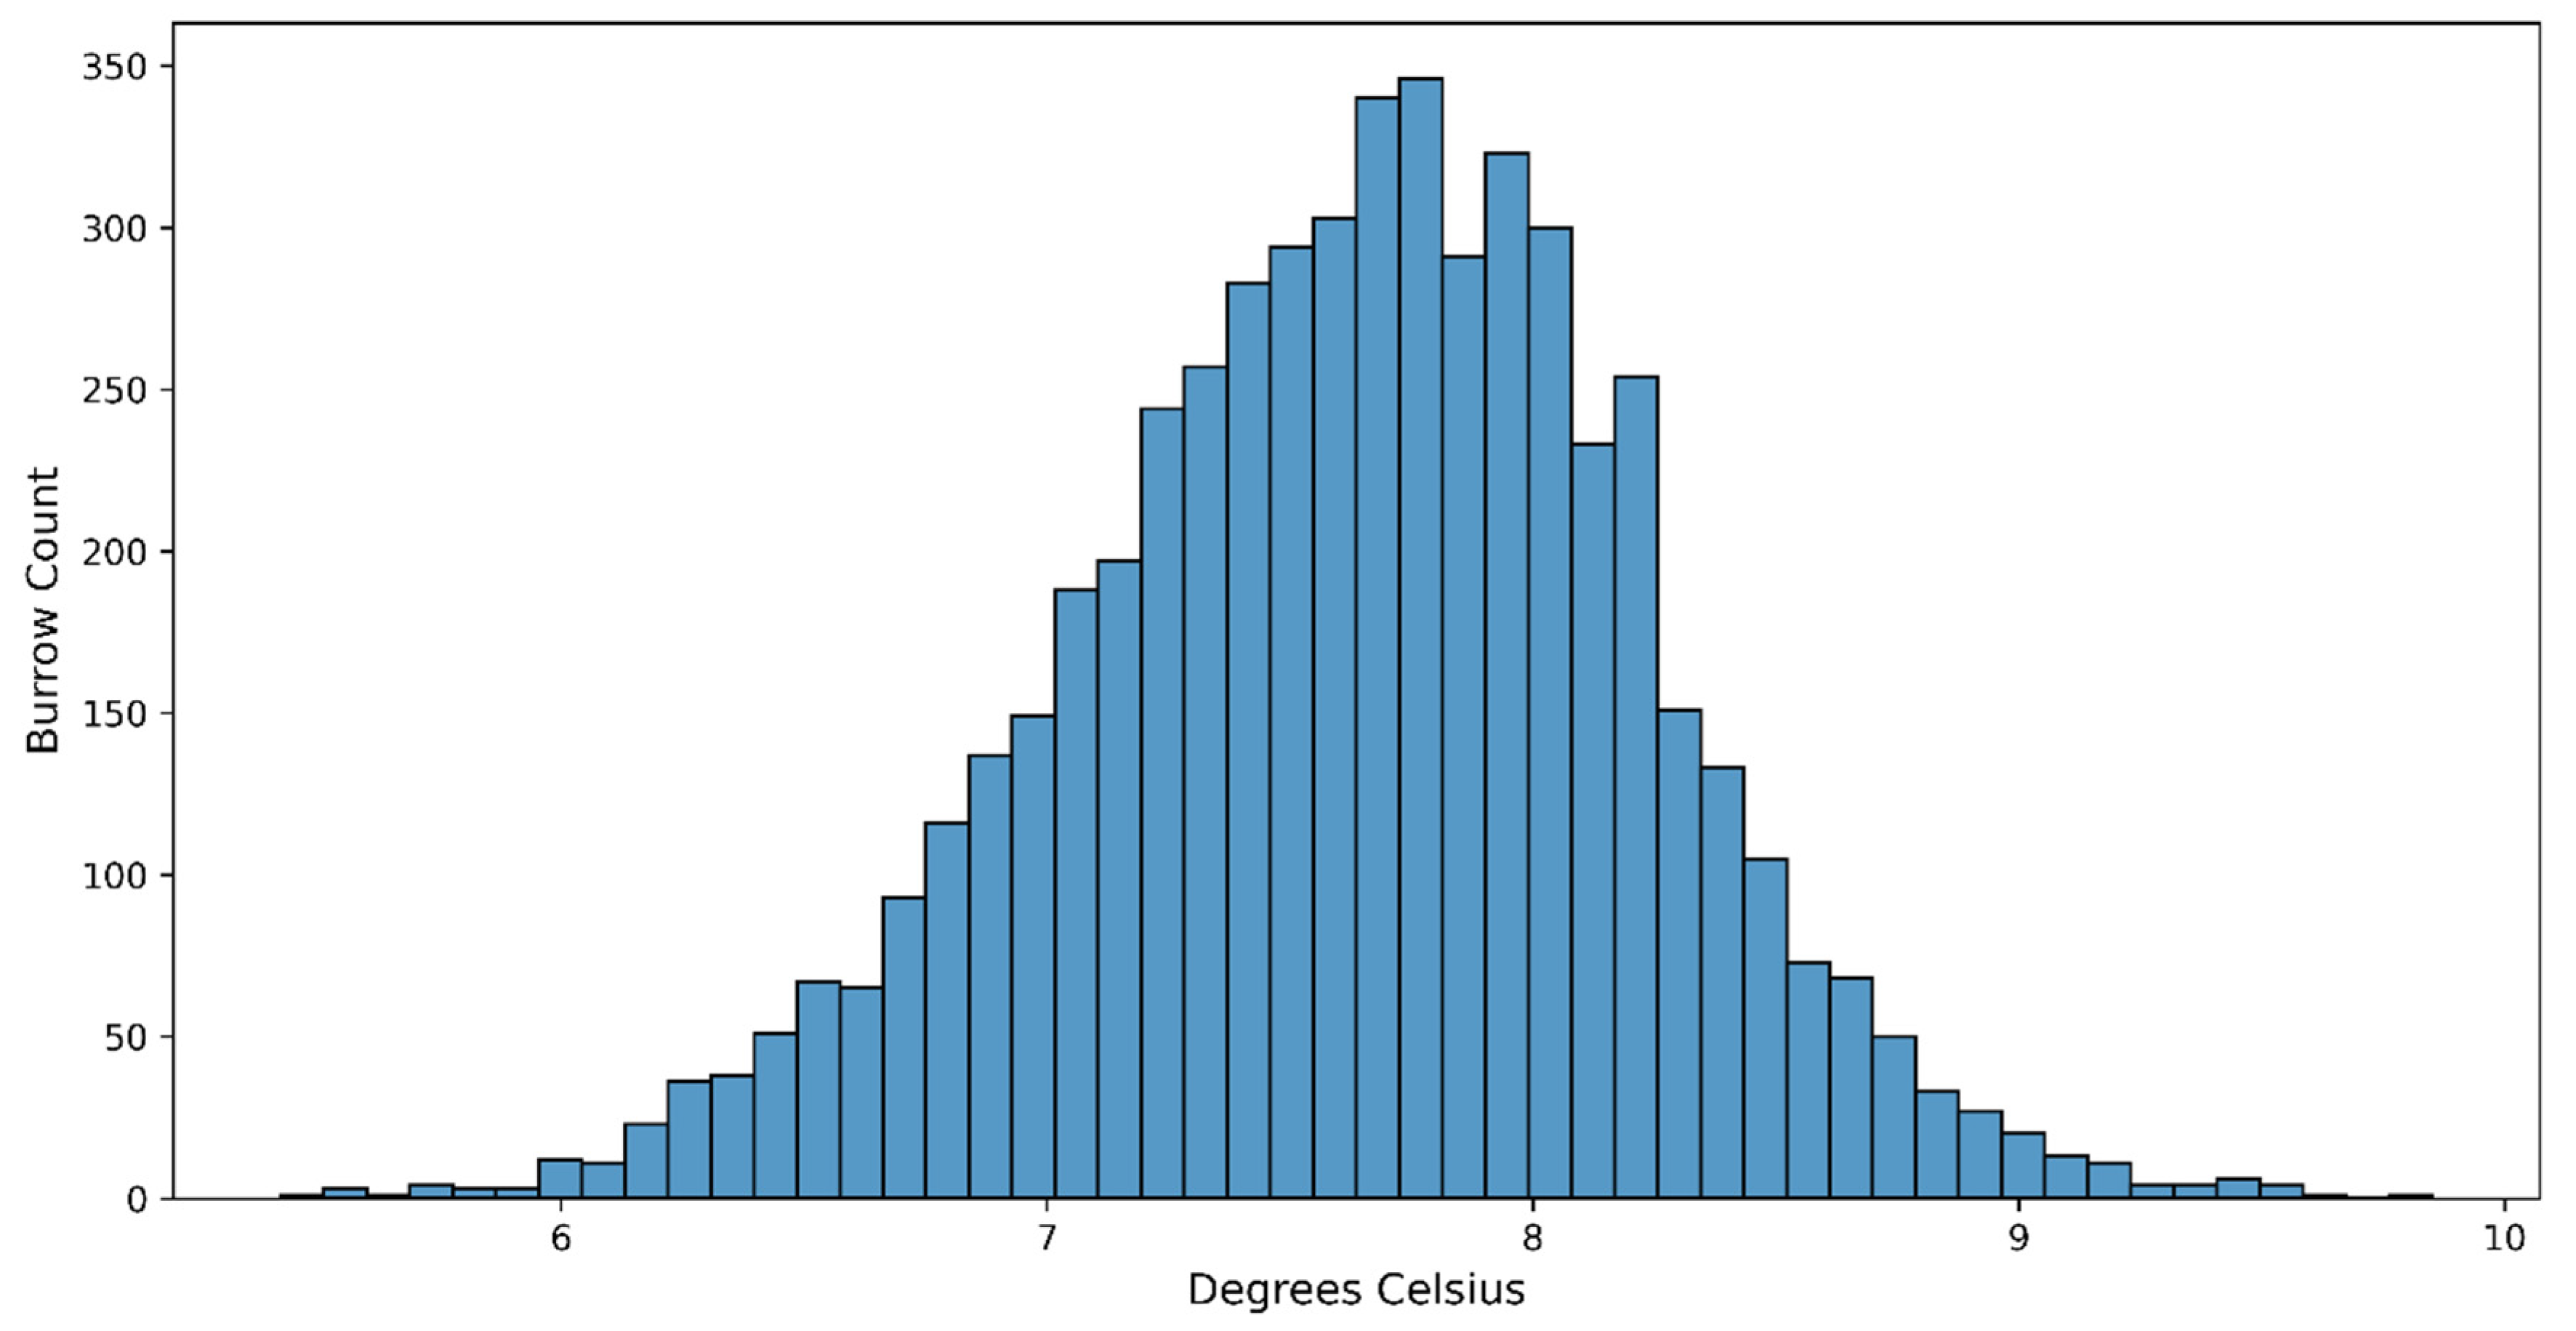
Figure 8.
Cluster analysis applied to the automated count dataset of occupied short-tailed shearwater burrows. Burrow detections in the orthophotos that were near each other are grouped together within clusters.
Figure 8.
Cluster analysis applied to the automated count dataset of occupied short-tailed shearwater burrows. Burrow detections in the orthophotos that were near each other are grouped together within clusters.
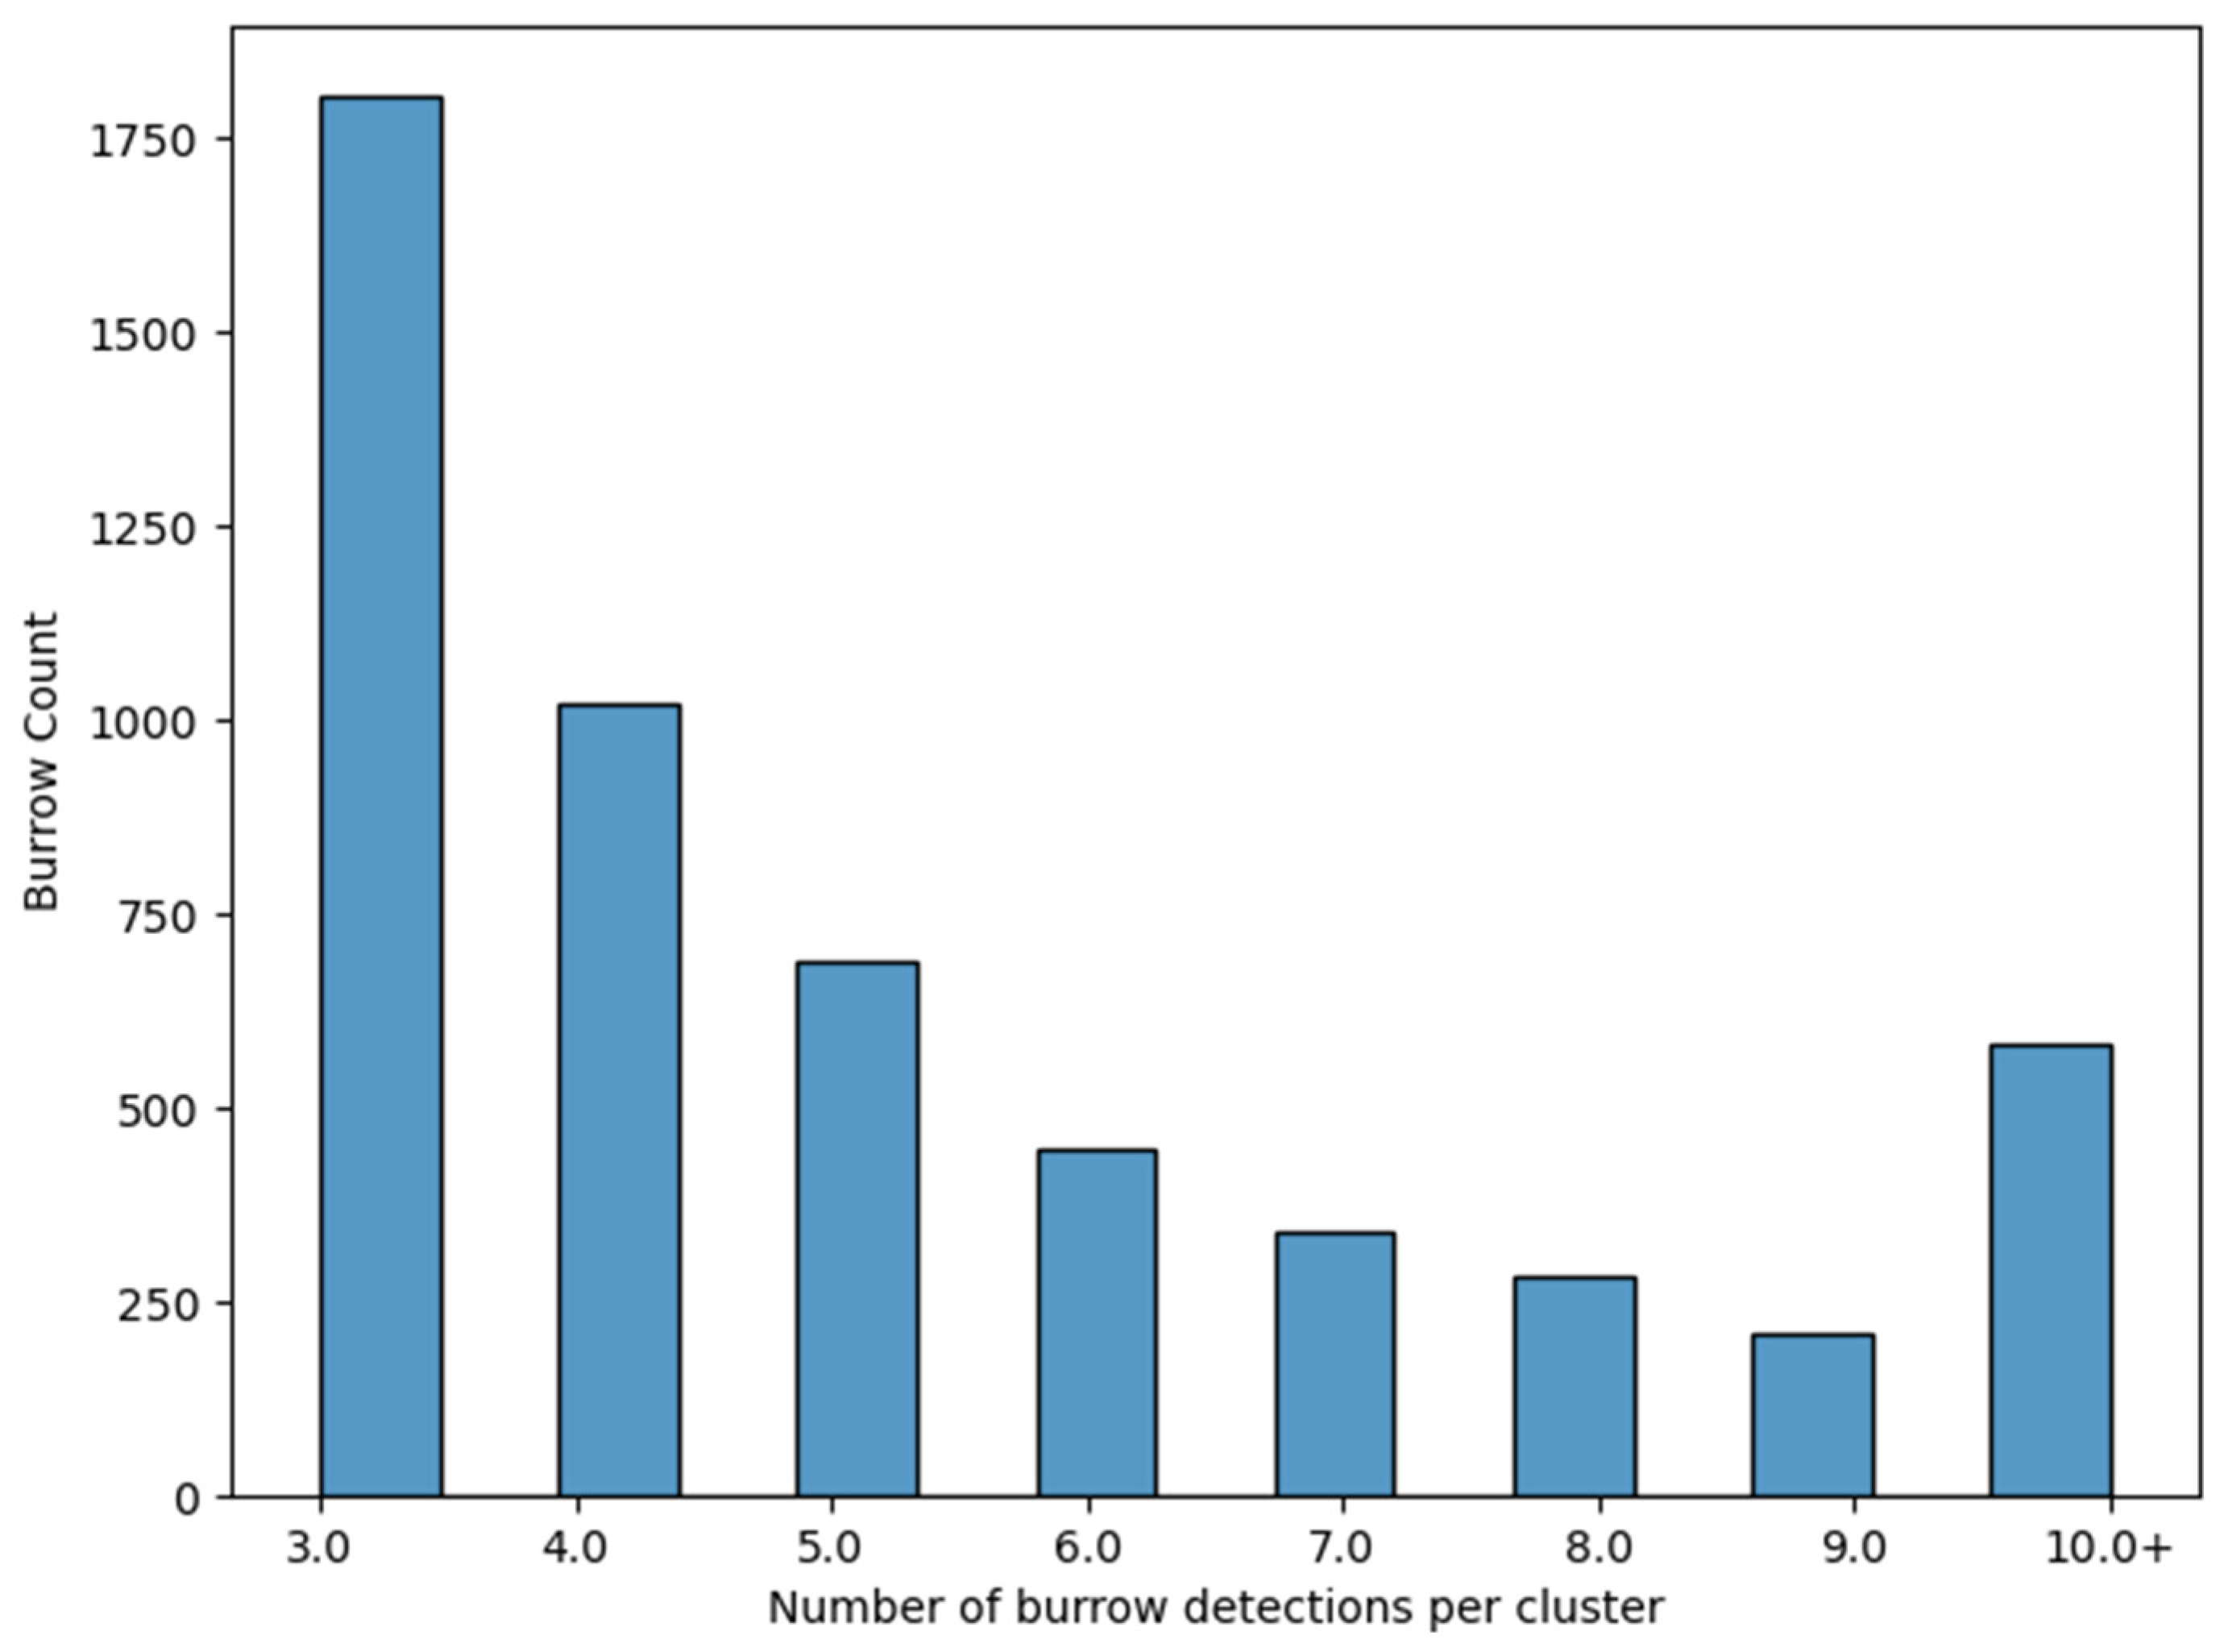
Figure 9.
Images illustrating the difference in automated and manual short-tailed shearwater burrow count and showing false negatives. Red boxes and dots relate to automated counts, blue boxes and dots relate to manual counts, green dots are automated detections pre-cluster. (a) Two distinct burrows clustered to a single automated count resulting in a false negative. (b) The center of the cluster in the automated count is occasionally offset from the actual burrow location due to imaging from multiple angles as a result of UAV flight line.
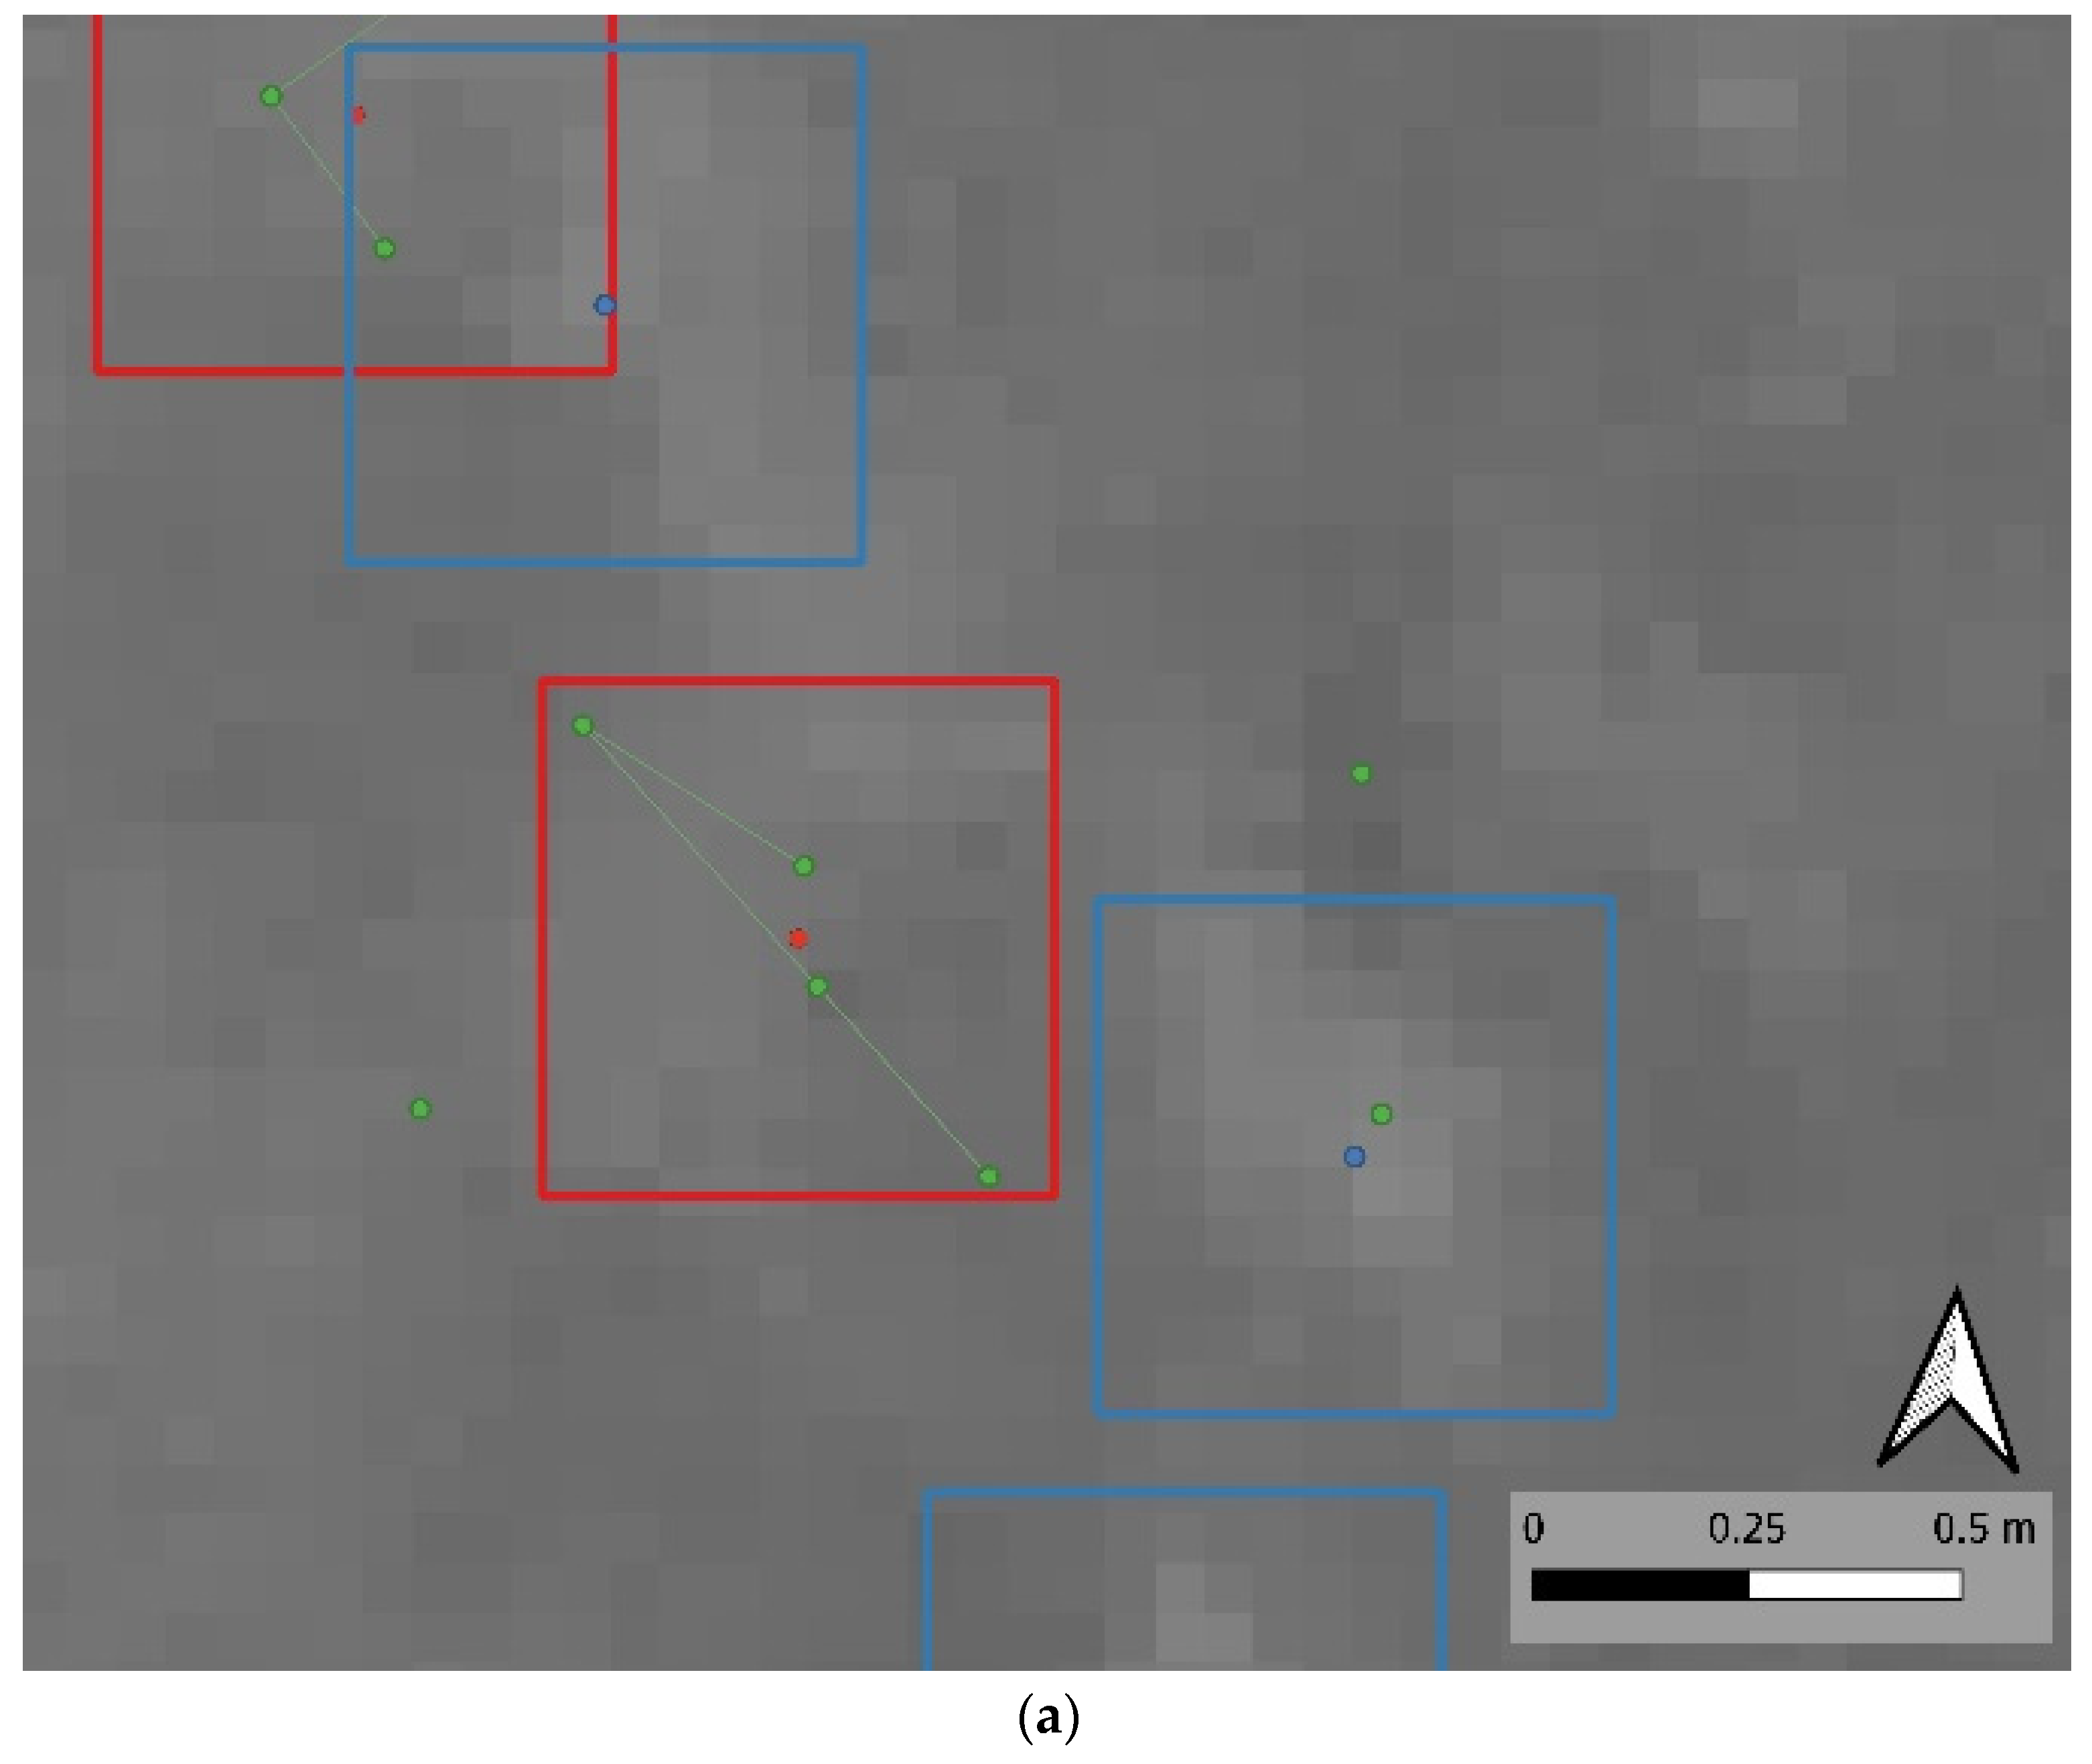
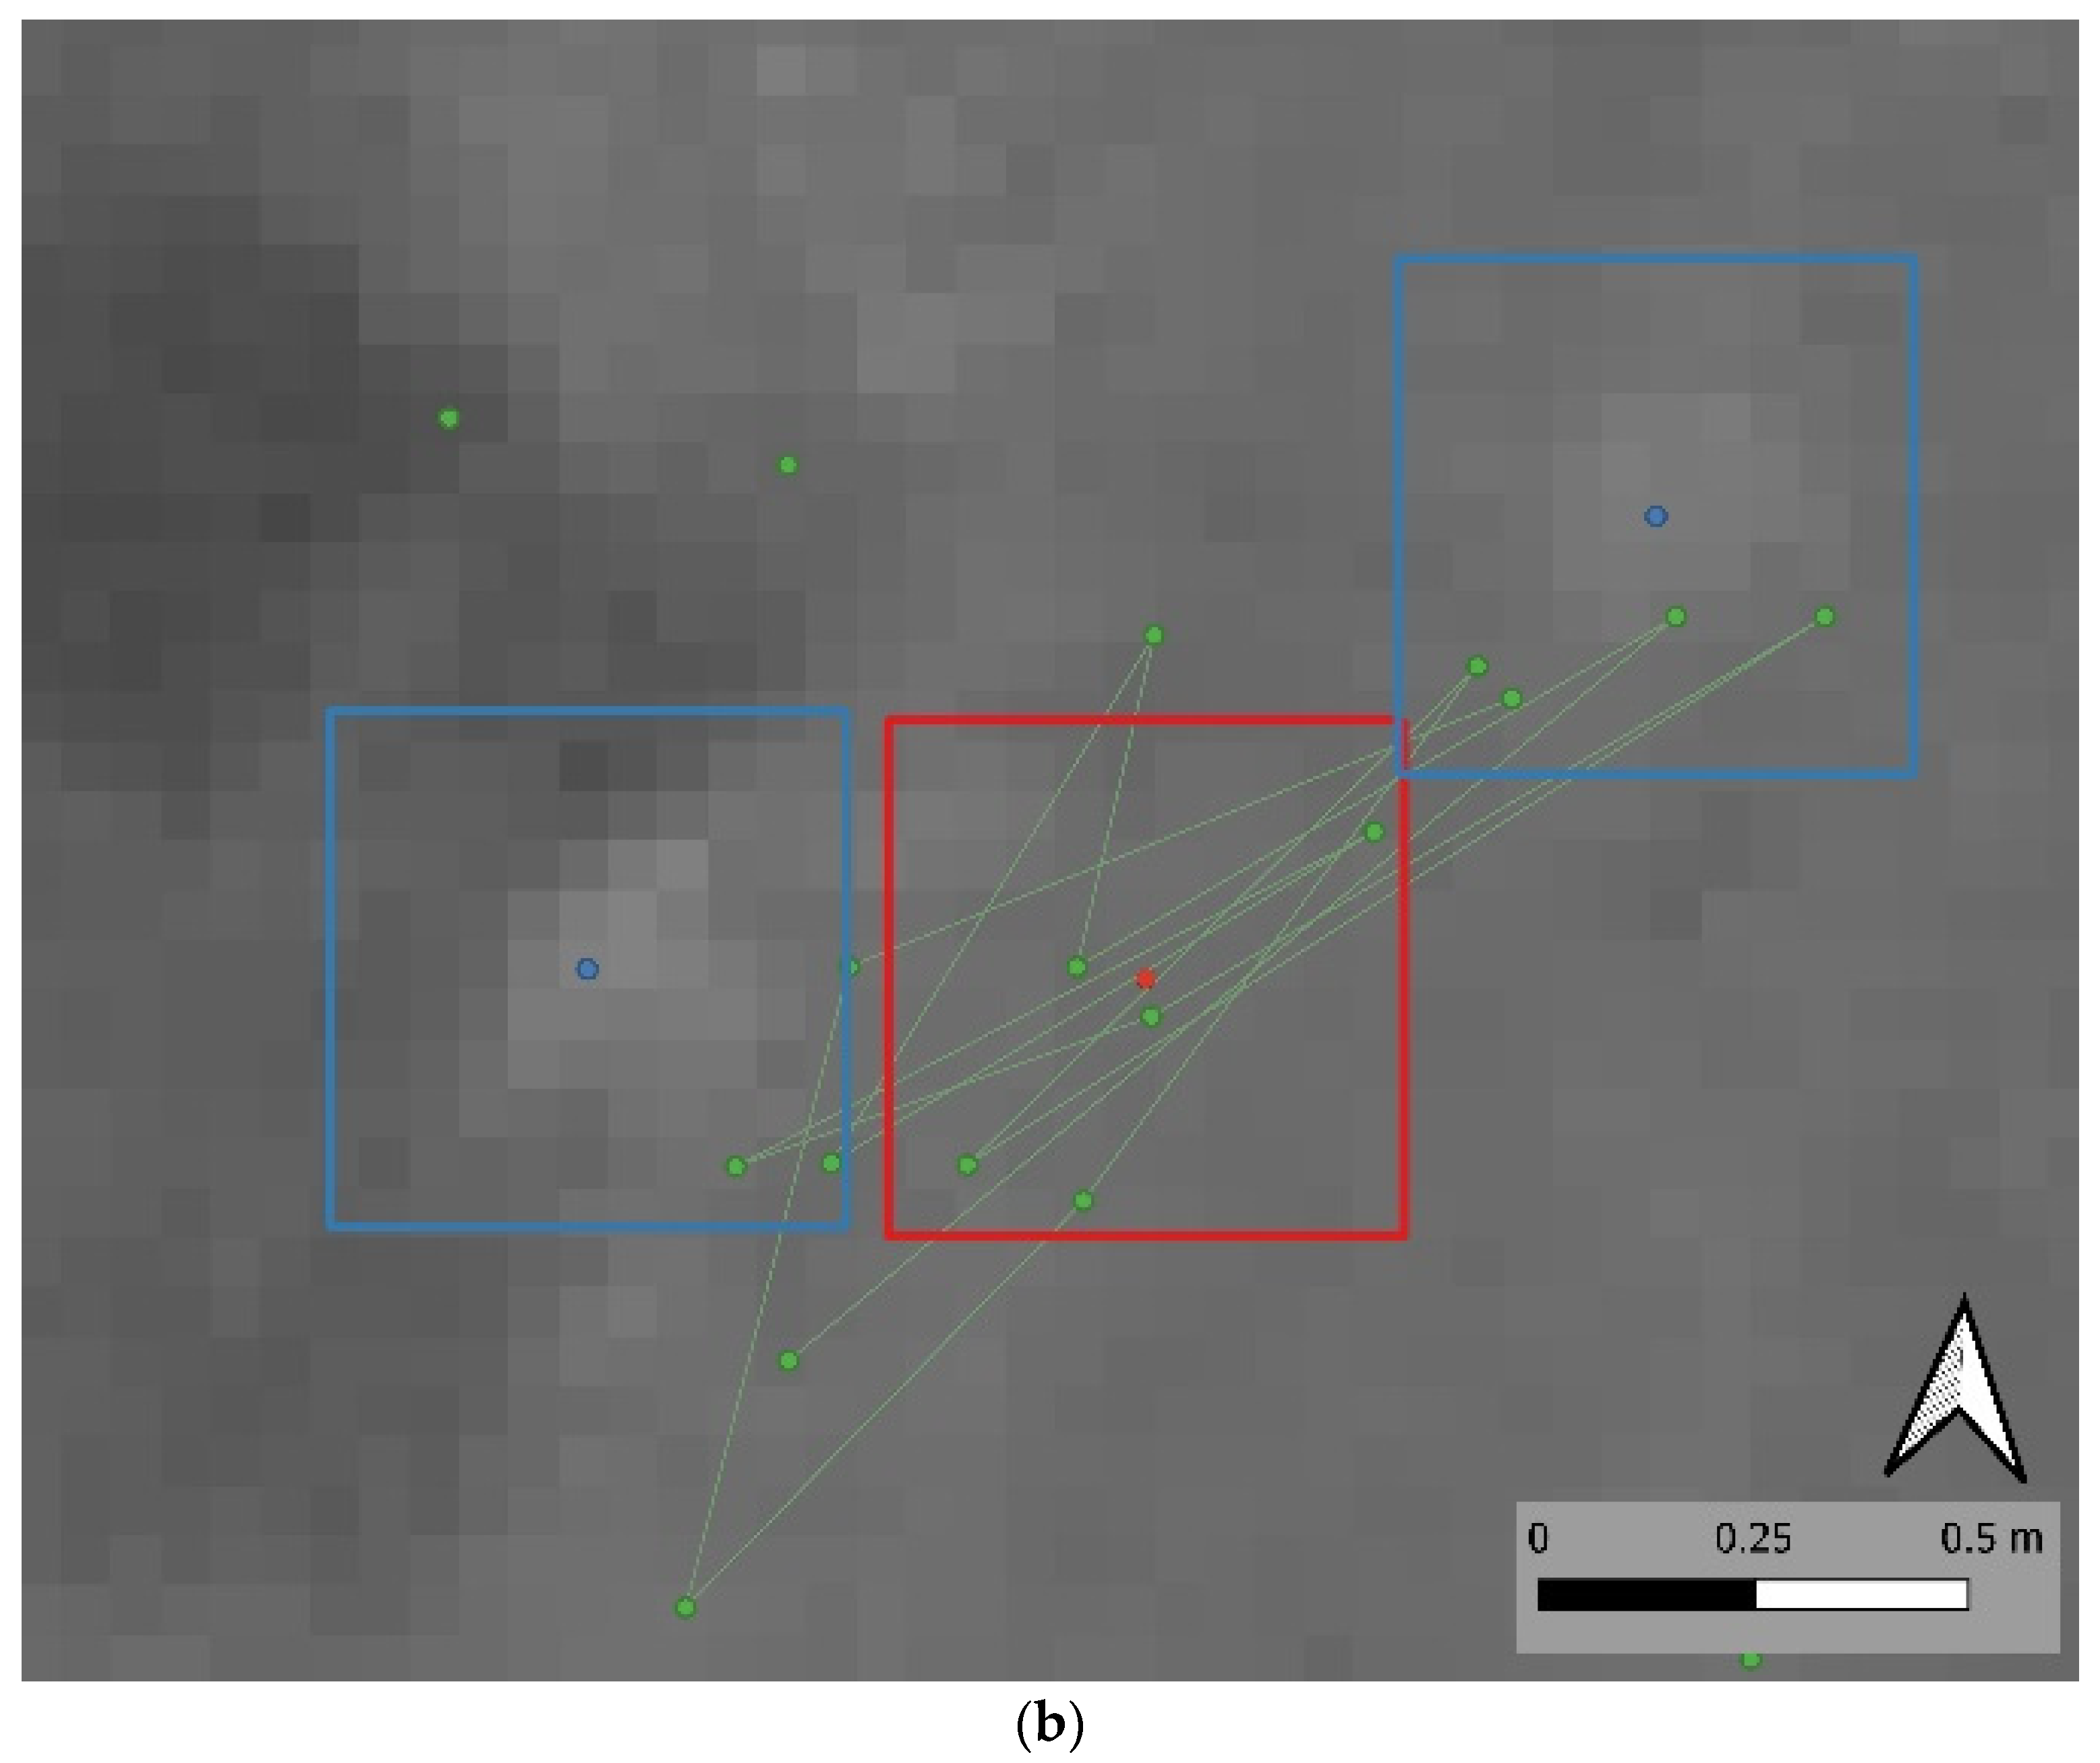
Figure 10.
An orthophoto taken from an altitude of 40 m above ground level. An aluminum target (red arrow) of approximately 5 pixels was used to verify a short-tailed shearwater chick in a burrow. Adjacent to the metal target, a burrow (the blue dot in the blue box) was confirmed via both the manual count and the clustered automated method (red box). The automated method detected this single burrow multiple times in the orthophotos (green dots). This burrow was verified via ground inspection, and entrance location was recorded using the GNSS rover (white dot).


Table 1.
Comparison of count method and time taken to undertake counts of occupied burrows of short-tailed shearwater chicks in the thermal imagery used in this study.
Table 1.
Comparison of count method and time taken to undertake counts of occupied burrows of short-tailed shearwater chicks in the thermal imagery used in this study.
| Burrows Counted | Time Taken (Minutes) | |
|---|---|---|
| Automated Count | 5787 | 10 |
| Manual Count | 5249 | 210 |
Table 2.
Confusion matrix depicting the performance evaluation of count automation compared to the manual counts of occupied short-tailed shearwater burrows. The confusion matrix illustrates the classification outcomes indicating true-positive, false-positive, false-negative, and true-negative counts.
| Predictions | |||
|---|---|---|---|
| 0 | 1 | ||
| Actuals | 0 | − True Negatives | 538 (9%) False Positives |
| 1 | 1266 (22%) False Negatives | 3983 (69%) True Positives | |
Table 3.
Comprehensive assessment scores of the model’s effectiveness in burrow detection. Accuracy is the percentage of correctly identified burrows. Precision is the ability to correctly identify burrows. Recall is the ability to correctly identify and include all existing burrows in the dataset. F1 is the harmonic mean of precision and recall. F1 combines both precision and recall into a single metric.
| Score | |
|---|---|
| Accuracy | 0.69 |
| Precision | 0.88 |
| Recall | 0.79 |
| F1 | 0.82 |
Disclaimer/Publisher’s Note: The statements, opinions and data contained in all publications are solely those of the individual author(s) and contributor(s) and not of MDPI and/or the editor(s). MDPI and/or the editor(s) disclaim responsibility for any injury to people or property resulting from any ideas, methods, instructions or products referred to in the content. |
© 2023 by the authors. Licensee MDPI, Basel, Switzerland. This article is an open access article distributed under the terms and conditions of the Creative Commons Attribution (CC BY) license (https://creativecommons.org/licenses/by/4.0/).
Share and Cite
MDPI and ACS Style
Virtue, J.; Turner, D.; Williams, G.; Zeliadt, S.; Walshaw, H.; Lucieer, A. Burrow-Nesting Seabird Survey Using UAV-Mounted Thermal Sensor and Count Automation. Drones 2023, 7, 674. https://doi.org/10.3390/drones7110674
AMA Style
Virtue J, Turner D, Williams G, Zeliadt S, Walshaw H, Lucieer A. Burrow-Nesting Seabird Survey Using UAV-Mounted Thermal Sensor and Count Automation. Drones. 2023; 7(11):674. https://doi.org/10.3390/drones7110674
Chicago/Turabian StyleVirtue, Jacob, Darren Turner, Guy Williams, Stephanie Zeliadt, Henry Walshaw, and Arko Lucieer. 2023. "Burrow-Nesting Seabird Survey Using UAV-Mounted Thermal Sensor and Count Automation" Drones 7, no. 11: 674. https://doi.org/10.3390/drones7110674