Article

Active Transportation Decision-Making against the Background of Air Quality Information Provision: Walking Route Preferences of German Residents

by
Joerg Koenigstorfer
Department of Sport & Health Management, Technische Universität München, Uptown Munich—Campus D, Georg-Brauchle-Ring 60/62, 80992 Munich, Germany
Urban Sci. 2018, 2(1), 19; https://doi.org/10.3390/urbansci2010019
Submission received: 31 January 2018 / Revised: 20 February 2018 / Accepted: 26 February 2018 / Published: 28 February 2018

Abstract

:
The study aims to assess whether, and how, provision of information about air quality along inner-city roads influences individuals’ intentions to walk further away from traffic-dense roads. In an experiment, German residents (n = 597) were either exposed to a map that showed, or a map that did not show, air pollution levels along two routes. The routes had the same starting and end points but differed with respect to expected traffic density. Furthermore, the availability of green space (i.e., a park environment) and two air pollution information provision elements—traffic light color-coding and explanations about the relationship between air pollution and health—were experimentally manipulated. Both the availability of green space and the provision of air quality information along the two routes increased the intentions to walk along the low (vs. high) traffic density road. Spatial psychological distance mediated the effect of the availability of green space on intentions to walk along the low traffic density road. The mediation effect disappeared when traffic lights were used for informing individuals about air pollution levels. Public policy makers can therefore be recommended to increase availability of green space and raise awareness of air quality conditions along roads via intuitively interpretable schemes.

1. Introduction

The idea of active transportation is to use human-powered transportation forms for the benefit of human health, the environment, social interactions, cost savings, and reducing road congestion. In particular, active transportation increases human mobility and promotes physical activity levels [1]; regular physical activity in turn provides a wide range of health benefits to individuals. Also, active transportation has positive environmental effects. For example, walking and cycling—the two most prominent forms of active transportation—are space-efficient and low-emission travel modes compared to other modes [2].
This study is concerned with walking in cities. If more individuals chose to walk in cities, human health could improve, and traffic density, environmental pollution, and climate change could be reduced. Although the benefits of walking are widely recognized, and walking is promoted by leading institutions around the world, walking often goes along with an increased exposure to motorized traffic and its emissions (i.e., air pollution), particularly in cities [3,4]. This is a concern to individuals because bad air quality decreases quality of life and increases mortality. In particular, road transportation-related air pollutants (i.e., carbon monoxide, black carbon, nitrogen dioxide, volatile organic compounds, ultrafine particles, and fine particulate matter) [5] are harmful to human health because they promote pulmonary diseases [6,7], cardiovascular diseases [8], as well as lung and prostate cancer [9,10].
Thus, it is important to direct individuals toward walking routes that expose them to as little air pollution as possible. To date, however, the factors that influence people to choose one walking route over another are largely unknown. While motives and time constraints have been shown to be important [11], this research considers the effects of the provision of information about air quality against the background of whether walking routes go through green public space or not. Such green space is an important aspect in cities that has several positive effects on both individuals and society [12]. The intended walking route (be it along either low or high traffic density roads) is the dependent variable considered in this research.
The purpose of this study is (1) to assess whether, and how, the availability of green space increases individuals’ intentions to walk further away from (vs. close to) traffic-dense roads in cities and (2) to assess whether, and how, the provision of information about air quality along different inner-city roads that people can take to get from a starting point to an end point influences their walking intentions.
In what follows, the study first derives the hypothesis that the availability of green space makes individuals more likely to walk along roads where the green space is found (i.e., in low traffic density areas), and that this is due to a decrease in psychological distance to air quality matters. Then, the study considers two elements of how information about air pollution along roads can be communicated to people: (1) the use of traffic light color-coding (where rather unpolluted areas are labeled green and rather polluted areas are labeled red) and (2) the use of educational tools showing the relationship between air pollution and health (where people are informed about health effects according to the recommendations of the World Health Organization [WHO]). In particular, the study assesses whether these factors influence individuals’ intentions to walk along a low (vs. high) traffic density road in cities.

1.1. Availability of Green Space and Individuals’ Walking Preferences

Green space in cities has various positive health effects, such as improved quality of life and lower mortality. The potential reasons are lower air pollution, better human temperature and stress regulation, increased physical activity, and more social contact [12]. The more opportunities and physical settings a green urban space provides and the larger it is, the more positively individuals perceive the space [13,14]. Features that relate to the attractiveness of the space are trees, water features, and bird life [14], for example. Kaplan [15] argued that such exposure to nature can be “restorative,” that is, they give people a sense of being away from their usual setting and a sense of happiness resulting from exposure to aspects of nature. These arguments were supported by an experimental study, among others, that allocated walkers and runners to use either urban parks or streets (or engage in a reading task [the reading task group was added as a control group]); the first group evaluated the experience as more restorative than the latter groups [16]. In the present research, it is assumed that most individuals have experienced the restorative effects of being in green space that is open to the public in cities and that they evaluate this experience positively [16,17]. Therefore, they should be more likely to agree to take the time to walk along a road that is further away from traffic. Thus, Hypothesis 1 is stated as follows:
Hypothesis 1 (H1):
Availability of green space within cities increases individuals’ intentions to walk a longer route that is further away from traffic-dense roads (vs. a shorter route that is closer to traffic-dense roads) under the assumption that only the longer route allows them to walk through the green space to get from one point to another point.
What are the potential reasons for why individuals may be willing to devote their time to taking a longer walking route (over a shorter route with a higher traffic density) when the first (but not the latter) route goes through green space? This study argues that a decrease in psychological distance in relation to air quality is one aspect that makes individuals change their walking route preferences toward the healthier alternative.
Psychological distance describes mental representations of closeness (or distance) along four dimensions: (1) spatial (i.e., how close is the target or the situation [here: concerns about air quality matters] from a person geographically?); (2) temporal (i.e., how much time separates the person and the target or the situation?); (3) social (i.e., how different is a social object as the target or the situation from the person’s self?); and (4) hypothetical (i.e., how likely is the target or situation to happen, or how close is it to the perceiver’s reality?) [18]. For example, the spatial component describes individuals’ beliefs about whether a certain environmental threat (here: air quality concerns) will affect them locally, or whether it is more likely to affect other geographical areas.
If a map shows green space for a longer walking route, individuals are expected to decrease psychological distance in relation to air quality matters because differences in air quality (as a central attribute during the decision-making process [12]) between green space roads with a rather low traffic density and traffic-dense roads are highlighted. Individuals should then feel more psychologically close to air quality matters. Furthermore, psychological closeness (but not distance) positively relates to pro-health and pro-environmental actions [19,20,21]. Thus, the higher the psychological distance is, the less likely it will be that individuals would choose the longer walking route through green space (over a shorter route with a higher traffic density). Psychological distance then acts as a mediator. Hypothesis 2 is thus formulated as follows:
Hypothesis 2 (H2):
Psychological distance in relation to air pollution mediates the effects stated in Hypothesis 1, that is, the availability of green space within cities will decrease psychological distance related to air pollution, and hence, individuals will be more likely to choose a longer, low traffic density walking route through green space (vs. a shorter route outside of this space with high traffic density).

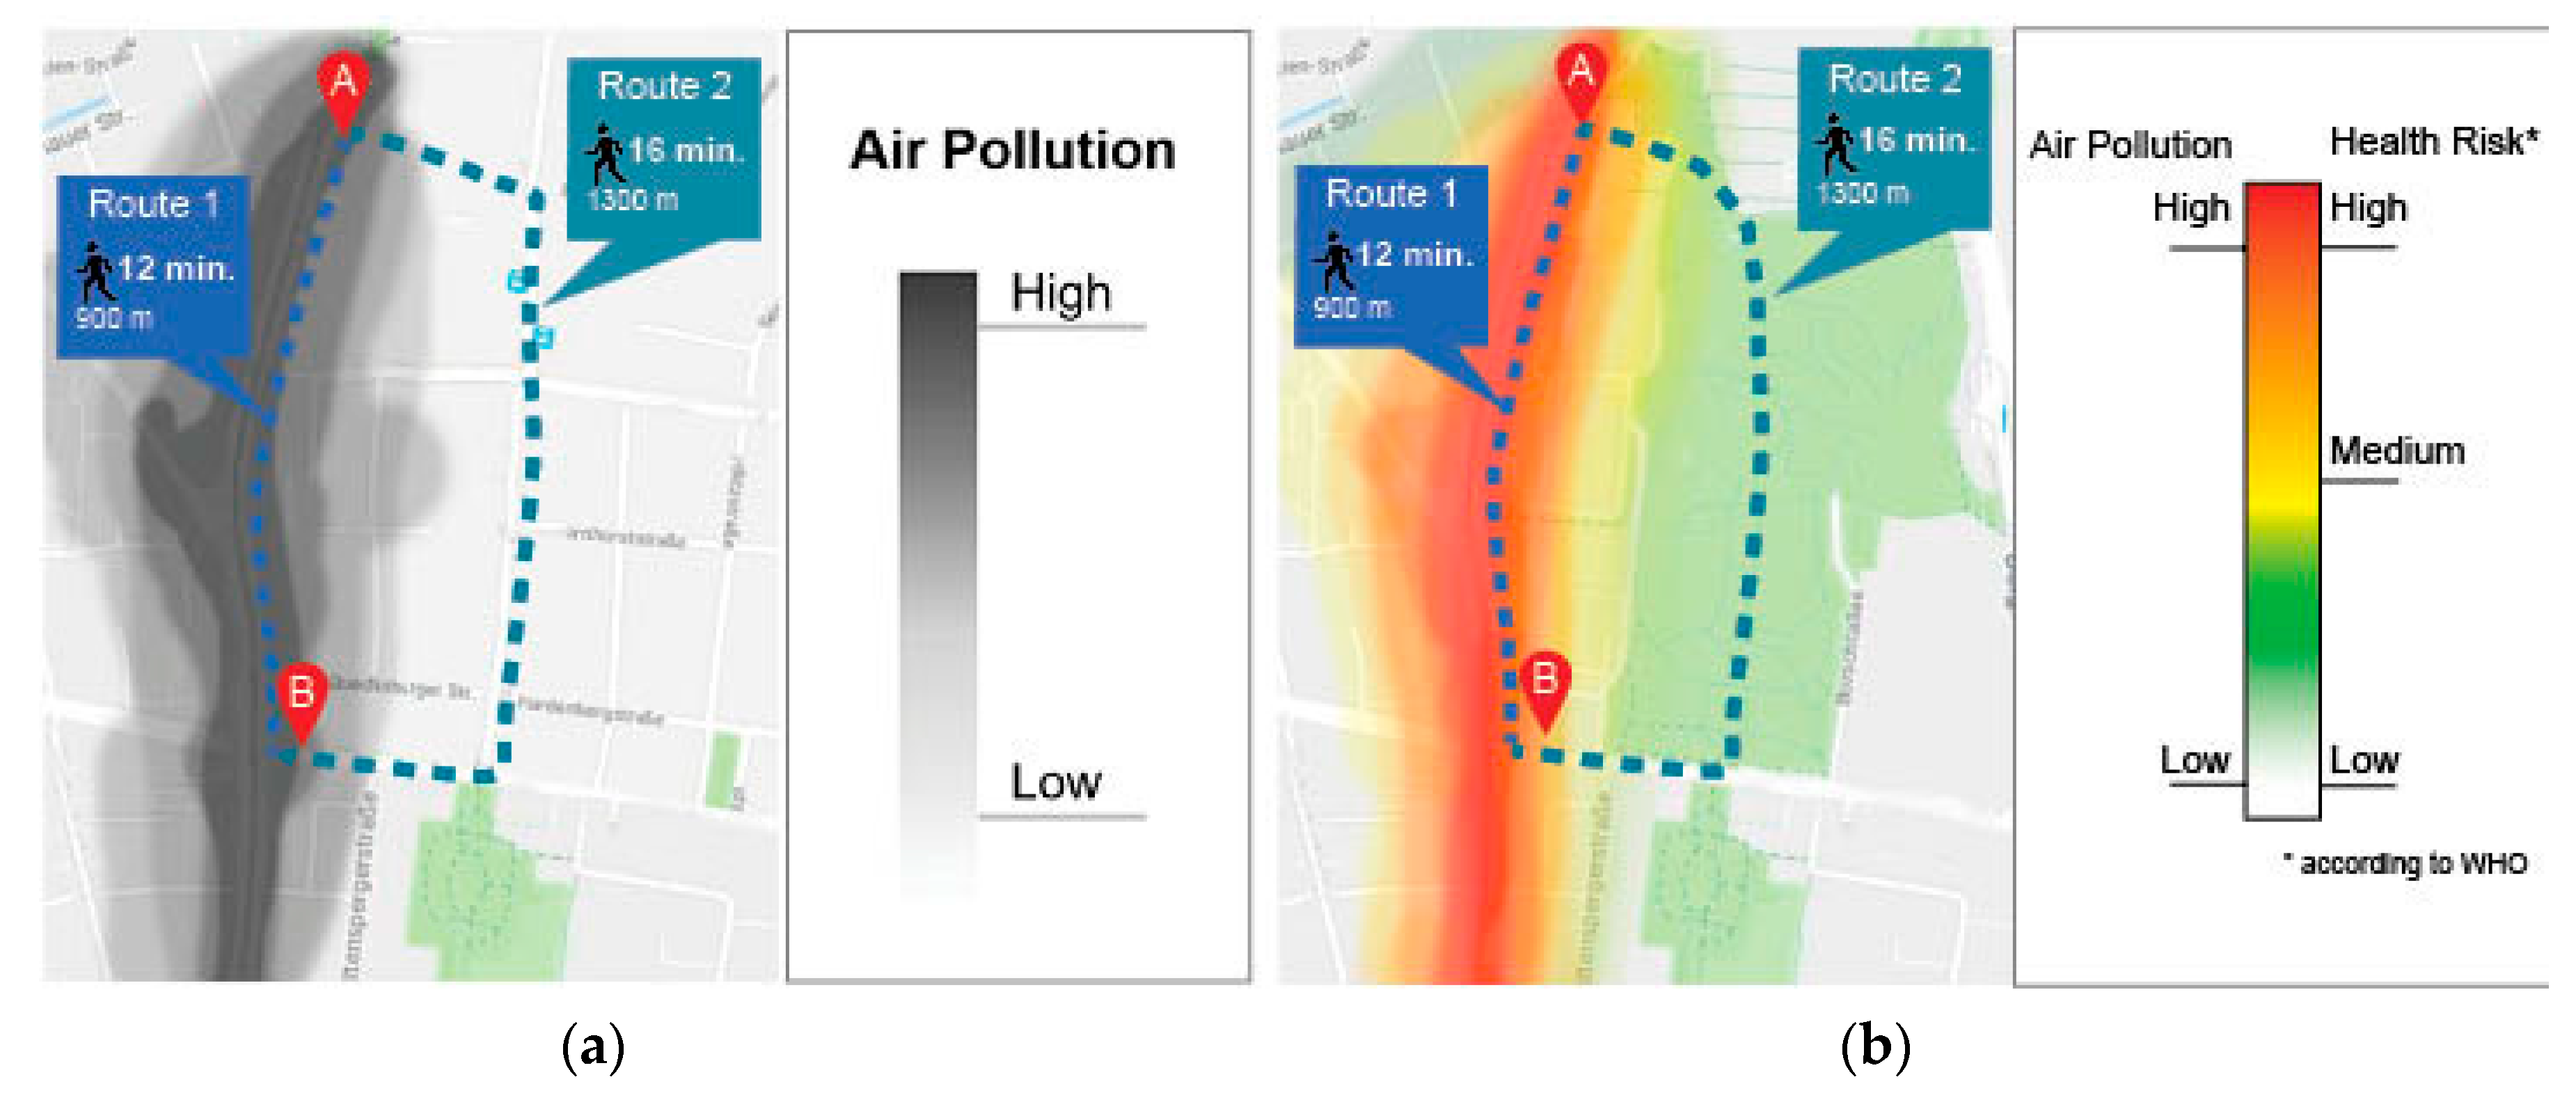
1.2. Provision of Air Quality Information along Different Roads and Individuals’ Walking Preferences

Aside from the availability of green space to walk through, the provision of information about air quality along different routes may change individuals’ psychological distance perception as well as their intentions for the different walking routes. This study does not only look at the information provision per se but also considers two different elements regarding how information is presented to individuals: traffic light color-coding and explanations about the relationship between air pollution and health as an educational tool.
First, traffic light color-coding of maps is considered. These color codes are common labeling tools that facilitate interpretation of air quality index (AQI) information [22]. The traffic light colors indicate different levels of air quality (green = good, yellow = medium, red = bad). Individuals have learned the meaning of these colors: red (vs. green) is associated with danger, prohibition, and need for vigilance [23,24], particularly in traffic contexts (where green is associated with “go” [25]). The use of traffic colors (vs. no use of these colors) may reduce psychological distance and/or increase the likelihood that individuals choose the longer walking route (over a shorter route with a higher traffic density). The effect may be present both when green space is made available to walk through and when it is not available to individuals.
Second, explanations about the relationship between air pollution and health are considered. Particularly, the WHO [26] publishes information about the relationship between air pollution and health. If such information is provided (vs. not), psychological distance in relation to air quality may decrease (as risk perception should be higher [27]). Thus, the likelihood that individuals choose the longer walking route (over a shorter route with a higher traffic density) may increase. The effect may again be present both when green space is made available to walk through and when it is not available to individuals.
The following research question is formulated that guides the following research efforts aside from the aforementioned hypotheses: Do the two methods of presenting information about air quality for walking routes along roads—traffic light color coding of maps and explanations about the relationship between air pollution and health—influence individuals’ route choice intentions as well as the relationships stated in Hypotheses 1 and 2?

2. Materials and Methods

An experimental study was conducted to answer the hypotheses and the research question. Participants were recruited from an online panel of German residents. In total, 597 individuals took part in the study (45% female; M = 36 years, SD = 13 years, age range between 18 and 70 years). Participants received a monetary reward of €1.70 as a compensation for their time for participation. The employment status of the participants was as follows: 50% were employed; 23% self-employed; 17% in education; 3% unemployed; 4% retired; and 3% unable to work. The highest education levels were as follows: 1% had no educational degree; 2% secondary general school-leaving certificate; 12% intermediate school-leaving certificate; 31% upper secondary school-leaving certificate; 14% apprenticeship; 16% bachelor’s degree; 22% master’s degree or diploma; and 1% PhD. The distribution of household income (net, per month) was as follows: 26% earned €1300 or less; 10% between €1301 and 1700; 17% between €1701 and 2600; 13% between €2601 and 3600; 10% between €3601 and 5000; and 4% more than €5000; 20% did not want to report their income. About 57% of the participants indicated they live in an urban area in Germany and 43% indicated they live in a rural area in Germany.
Participants were informed that the study was about their walking preferences in cities and all of them gave their informed consent for participation in the study. In the survey, a task was described to the participants first. Participants were asked to imagine that they intended to walk from starting point A to end point B in a city (Figure 1). Next, they were asked which of two route options they would intend to take: route 1 (900 m, 12 min estimated time until arrival) or route 2 (1300 m, 16 min estimated time until arrival). The first route went along roads with high traffic density (expected) and the second route went along roads with low traffic density (expected).
The study applied a between-participant experimental design [28]. Participants were randomly assigned to one of twelve conditions. Eight conditions were generated by applying a 2 × 2 × 2 design, manipulating the availability of green space (presence vs. absence of a park along the longer road), traffic light color-coding for the provision of air quality information (traffic light color-coding vs. gray-level coding of the map), as well as the provision of an explanation about the relationship between air pollution and health (presence vs. absence of the WHO’s interpretation).
Another four conditions were added as control groups: a first condition, in which no air quality information was provided and no green-space option was made available (control group 1); a second condition, in which no air quality information was provided, but a green-space option was made available (control group 2); a third condition, in which only a reminder of different air quality levels, and their relation to health, in gray-level coding but no air quality information along the two routes was provided (including the green-space option; control group 3); please note that, in this condition, participants were not shown where (on the map) the different levels of air quality were occurring; and a fourth condition, in which only a reminder of different air quality levels in traffic light color-coding, and their relation to health, but no air quality information along the two routes was presented (including the green-space option; control group 4); again, note that participants were not shown where (on the map) the different levels of air quality were occurring. All the experimental conditions are shown in the Appendix; two samples are shown in Figure 1. Each participant was randomly assigned to only one of the 12 experimental conditions. There were no differences in any of the socio-demographics between the experimental groups.
In an open-ended question, participants were asked to state the reason for their preferred choice. They were also asked to state how important some attributes were when they stated their preferred choice, using a standardized scale. Psychological distance in relation to air quality was measured via an eight-item and four-dimensional scale proposed by Spence, Poortinga, and Pidgeon [29] and Jones, Hine, and Marks [30]. The items were anchored at 1 = low psychological distance (meaning that individuals feel psychologically close to air pollution in relation to space, time, social, and certainty aspects) and 7 = high psychological distance (meaning that individuals feel psychologically distant from air pollution in relation to the four aspects). A sample statement for spatial psychological distance is the following: “Air pollution will mostly affect areas that are far away from here”, 1 = “I strongly disagree” and 7 = “I strongly agree”). This study also assessed some confounding variables, manipulation check variables, and socio-demographics. At the end of the study, participants were thanked for their participation and they took part in a funneled debriefing.
As confounding variables, environmental consciousness was measured via Dunlap, Van Liere, Mertig, and Jones’s [31] 15-item revised “new ecological paradigm” scale (α = 0.90). Health consciousness was measured via Kraft and Goodell’s [32] health consciousness scale (α = 0.86). The items were anchored at 1 = “I strongly disagree” and 7 = “I strongly agree”. Also, the study assessed perceived health risks of bad air quality (single item: “Exposure to bad air quality is a serious risk to my health”, anchored at 1 = “I strongly disagree” and 5 = “I strongly agree”) and objective knowledge about air pollution (anchored at 0 = “low knowledge” and 5 = “high knowledge”, based on five true-or-false statements on the WHO’s [26] facts of evidence).
To check whether the manipulation worked, the study asked participants to indicate their level of agreement with the following statements: “I was informed about the air quality of the two routes,” “I had the option to walk through a park environment”, “The colors clearly indicated where air quality was good and where it was bad,” and “I was informed about the relationship between air quality and health”. The items were anchored at 1 = “I strongly disagree” and 7 = “I strongly agree”.

3. Results

3.1. Individuals’ Walking Route Preferences

There was great variance in individuals’ walking route preferences depending on the twelve experimental conditions. Table 1 provides an overview, using the probability of the choice along the low traffic density road (1300 m, 16 min) over the high traffic density road (900 m, 12 min) as the outcome variable. This represents the desirable outcome from the clean-air perspective (as more traffic lanes typically correlate with more traffic and hence higher levels of air pollution [33]).
In the control condition without green space and without any further indication (control group 1), only 7.1% of the participants chose the walking route that went along low traffic density roads, that is, the desirable outcome. Please note that even in this condition, high traffic density could be interpreted from the fact that the short route went along a four-lane road, while the long route went along a two-lane road. Simply adding the possibility of being able to walk in green space when taking the longer route (control group 2) increased individuals’ stated preferences for taking the low traffic density route. In this condition, 38.5% of individuals intended to choose the desirable walking route. The increase is significant (χ2(1) = 15.30, p < 0.001). These results thus provide initial support for Hypothesis 1 (without consideration of the provision of air quality information as an additional factor that was manipulated experimentally in the study).
As Table 1 shows, on average, 35.4% of the participants in the control conditions intended to choose the desirable outcome, and 62.8% of the participants in the experimental conditions intended to choose the desirable outcome (χ2(1) = 43.80, p < 0.001). In all the experimental conditions that provided air quality information along the two walking route options to participants, the stated preference for the desirable walking route was 50% or higher. There were three experimental conditions that revealed stated walking preferences for taking the low traffic density route of over 70%: conditions 6, 10, and 12 (see Appendix for the corresponding maps). Thus, one may assume that the provision of air quality information along the two routes, as well as the format for how air pollution information—using traffic light color-coding and/or explanations about the relationship between air pollution and health—was presented may have had an additional effect on individuals’ stated preferences. In what follows, the study will use a regression-based moderated mediation analysis that allows for the simultaneous testing of the two hypotheses and the research question.

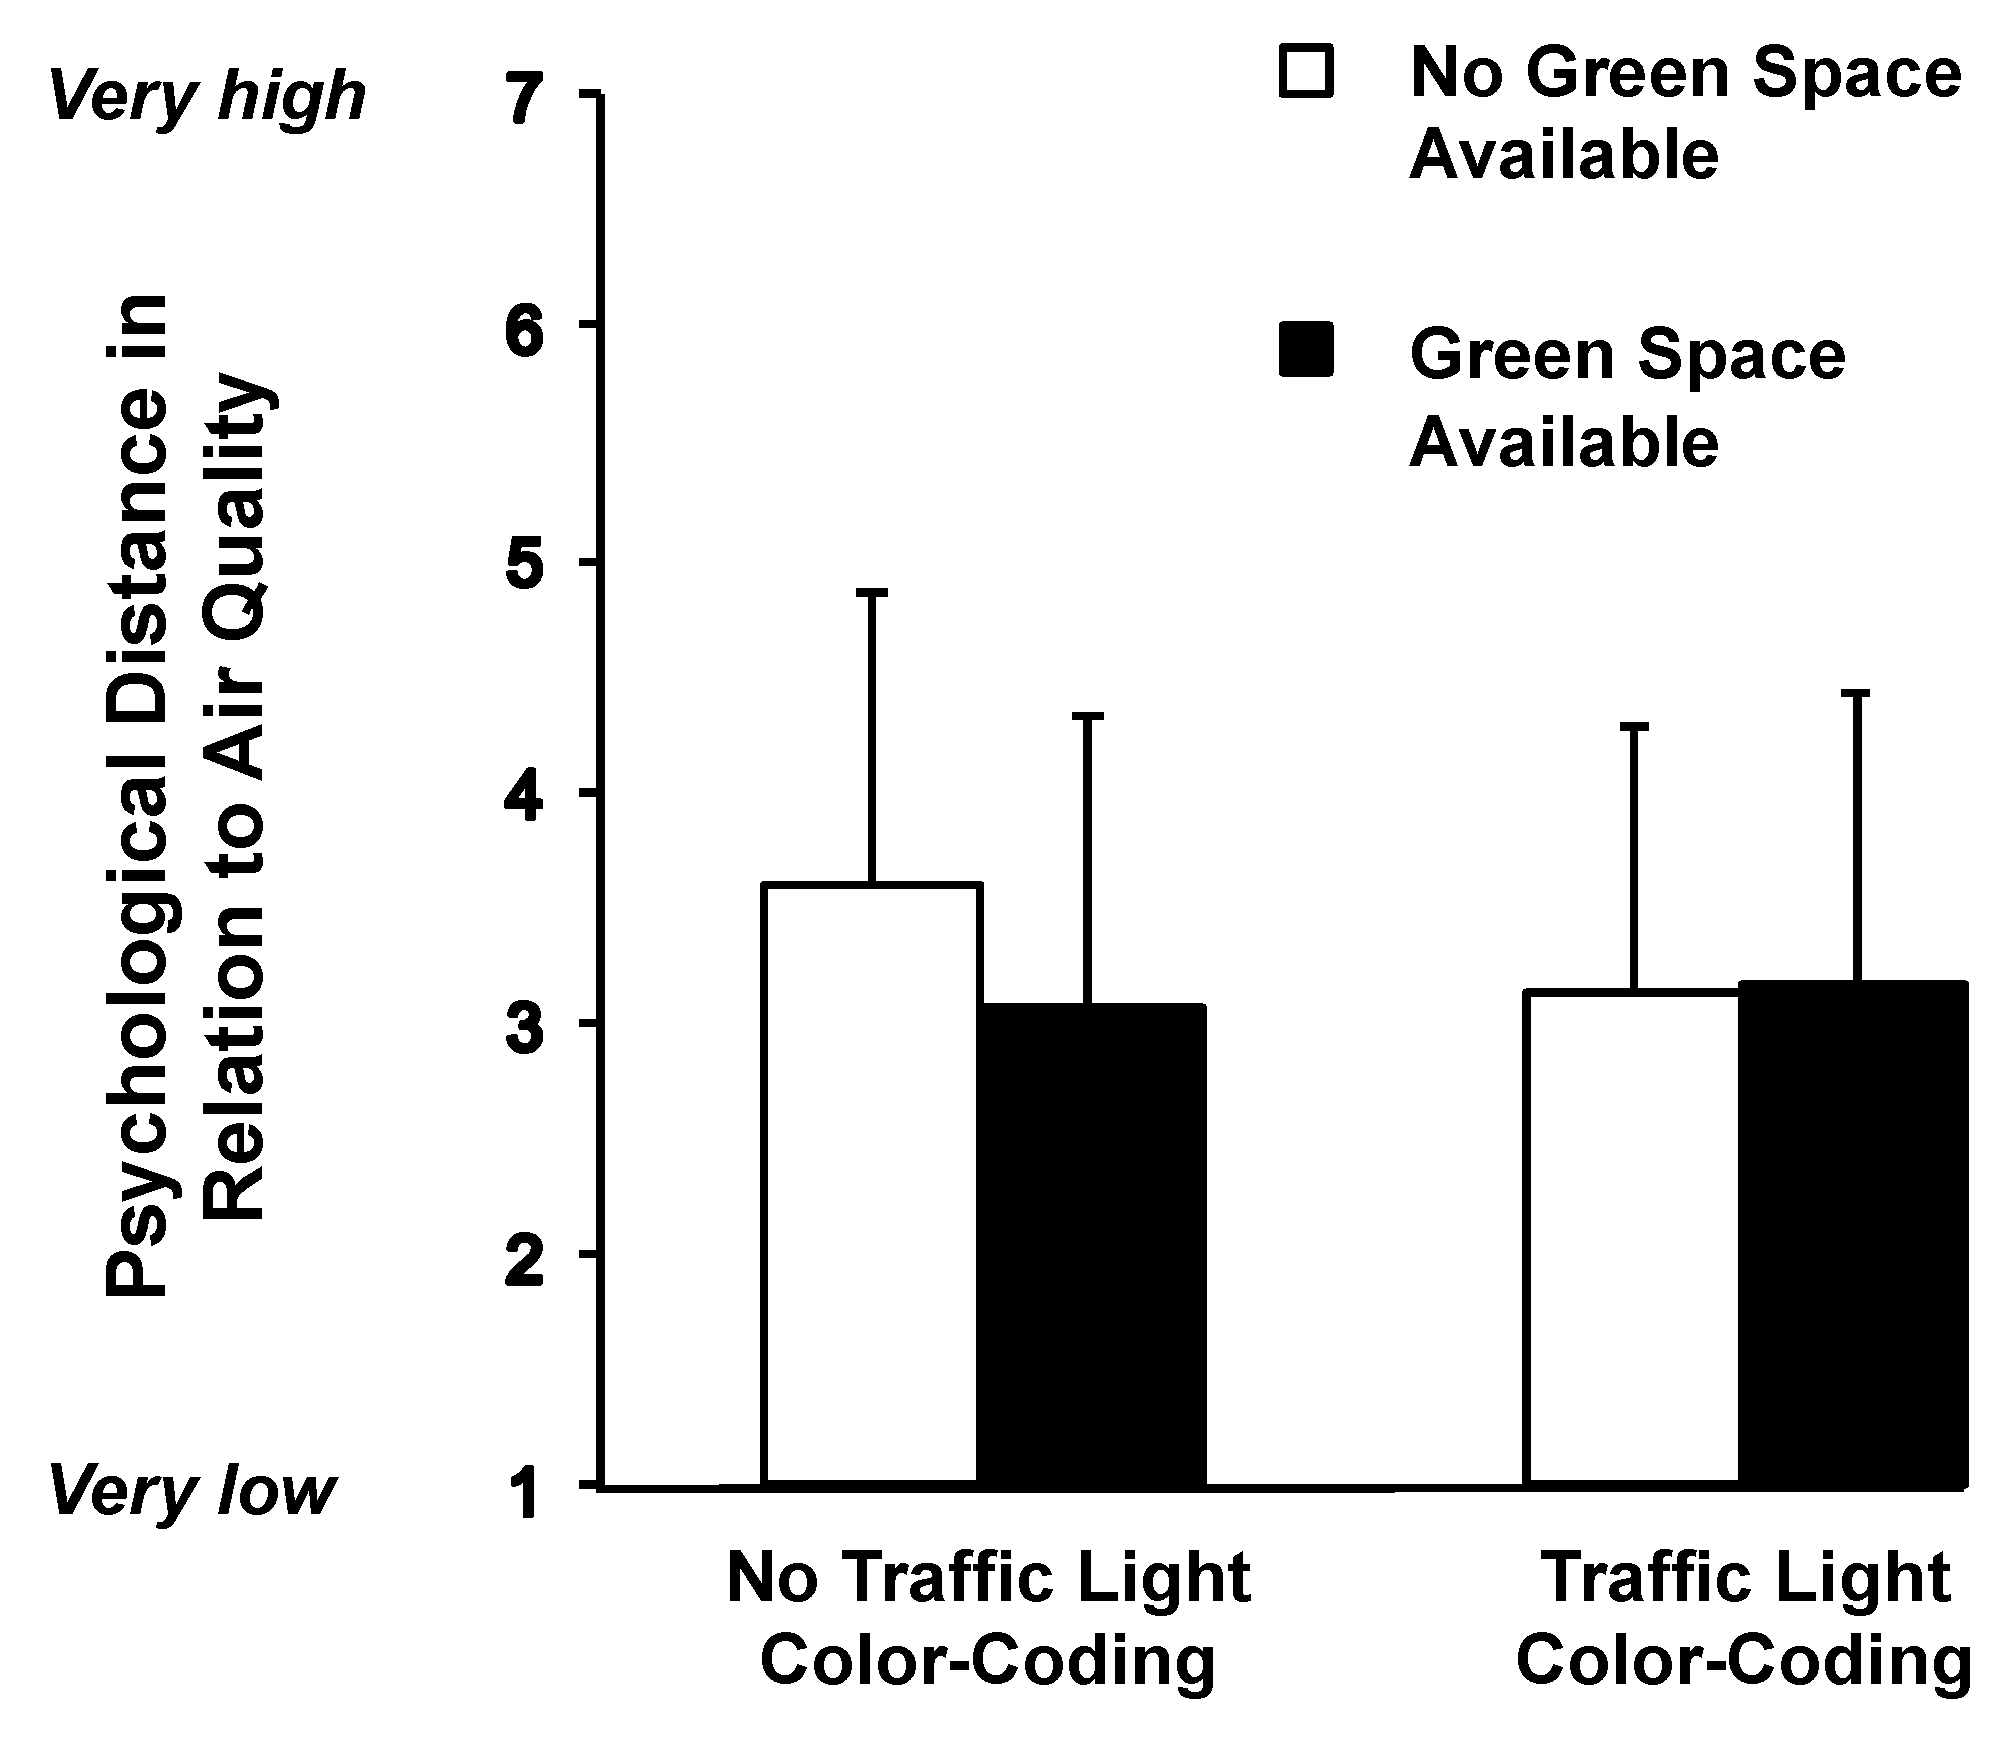
3.2. Mediating Effects of Psychological Distance

Before the hypotheses testing, analyses that assessed whether the experimental manipulations worked (or not) were performed. As anticipated, there were significant differences between the eight experimental conditions of the 2 × 2 × 2 design, which provided information about the air quality along the two routes (conditions 5–12), and the four control groups (conditions 1–4) with regard to the degree to which participants acknowledged that they were informed about the air quality along the two routes (M = 6.01, SD = 1.54 vs. M = 3.37, SD = 1.97, on a scale from 1 [lowest level of agreement] to 7 [highest level of agreement]; F(11,585) = 37.98, p < 0.001, with all the post hoc test results in agreement with the study’s assumptions).
Next, the study assessed whether participants assigned to those conditions in which green space was shown on the map (vs. no availability of green space) were more aware of the fact that they could walk through green space. As expected, participants in the experimental conditions where green space was made available (vs. unavailable) indicated higher agreement with the statement that they had the option to walk in a park environment (M = 6.11, SD = 1.27 vs. M = 4.27, SD = 1.80; F(1,387) = 132.77, p < 0.001). Thus, awareness of the availability of green space is higher for these participants. Also, participants in the experimental conditions where the traffic light color-coding was present (vs. absent) indicated higher agreement with the statement that the colors clearly indicated where air quality was good and where it was bad (M = 6.24, SD = 1.22 vs. M = 6.01, SD = 1.50; F(1,387) = 3.97, p < 0.05). The high ratings of the participants that were assigned to the condition without traffic light color-coding indicate that the gray-level coding also helps individuals identify areas of good (vs. bad) air quality. Lastly, participants in the experimental conditions where the WHO interpretation on the relationship between air quality and health was present (vs. absent) indicated higher agreement with the statement that they were informed about the relationship between air quality and health (M = 4.27, SD = 2.05 vs. M = 3.50, SD = 2.00; F(1,387) = 13.23, p < 0.001). Thus, it can be assumed that the experimental manipulations (i.e., the systematic change in information added to the map) worked.
A regression-based mediation analysis was conducted next to test the two hypotheses and the research question. The analysis was done for all the participants who were assigned to one of the experimental conditions of the 2 × 2 × 2 design. All three independent variables as well as their interactions were included in the analysis. The intended choice of the walking route along the low traffic density road was the dependent variable. The analysis was done for each of the four dimensions of psychological distances as mediators.
The models for the temporal, social, and certainty-related dimensions of psychological distance as mediators were non-significant (F’s < 1.17 and p’s > 0.32). However, the model for the spatial dimension was significant (F(7,387) = 2.32, p = 0.02). The results are shown in Table 2. The analysis showed that the direct effect of the availability of green space on individuals’ stated preferences to walk a longer route through green space (vs. a shorter route outside of this space) to get from one point to another point in the city, controlling for spatial psychological distance, is significant (b = 0.21, SE = 0.11, p = 0.05). The results thus provide additional support for Hypothesis 1: The availability of green space increases the tendency of individuals to walk a longer, low traffic density road.
The mediating influence of spatial psychological distance was assessed by looking at the relationships between the availability of green space and spatial psychological distance as well as between spatial psychological distance and individuals’ stated walking route preference for the low traffic density road. As anticipated, the availability of green space reduced spatial psychological distance (b = −0.12, SE = 0.06, p = 0.04). Furthermore, there is a negative relationship between spatial psychological distance and stated route preference, that is, a lower distance goes along with a higher stated preference for walking along the low traffic density road (b = −0.27, SE = 0.09, p = 0.004). Thus, there is partial mediation and Hypothesis 2 is supported.
The indirect effect of the availability of green space on stated walking preferences via spatial psychological distance, however, depends on the presence (vs. absence) of traffic light color-coding of air quality information (index of moderated mediation = −0.07 [−0.21, −0.02]): the indirect effect is significant when traffic light color-coding is not provided (b = 0.07 [0.02, 0.16]), while it is non-significant when the coding is provided (b = −0.004 [−0.07, 0.04]). Thus, the decrease in spatial psychological distance when green space is made available (vs. unavailable) only holds true in situations where the traffic light color-coding does not provide guidance to the participants (t(198) = 2.88, p = 0.004). When the traffic light color-coding is present on the map, the levels of spatial psychological distance are identical (t(193) = −0.12, p = 0.91) for both conditions (no matter whether green space is made available or not). Figure 2 visualizes these findings.
Furthermore, the explanation about the relationship between air pollution and health provided by the WHO reduced spatial psychological distance (b = −0.12, SE = 0.06, p = 0.05). Thus, in addition to the availability of green space, the education about the relationship between air pollution levels and health reduced psychological distance. The indirect effect on stated choice preference for walking along the low traffic density road, however, failed to reach significance (b = 0.03 [−0.01, 0.10]). Also, the traffic light color-coding had an insignificant effect on psychological distance (b = −0.09, SE = 0.06, p = 0.16).
Thus, the research question can be answered as follows: both the availability of green space (when no traffic light color-coding is added) and the WHO explanation about the relationship between air pollution and health decrease spatial psychological distance to air quality matters; and both lower psychological distance and the availability of green space trigger favorable route choice intentions. Psychological distance partially mediates the effect of the availability of green space on favorable walking intentions of individuals from the perspective of air quality when no traffic light color-coding of air quality information along routes is present.

4. Discussion

The purpose of this study was to assess whether, and how, the provision of information about air quality along inner-city roads, aside from the availability of green space, helps shift individuals’ intentions to walk further away from (vs. close to) traffic-dense roads in cities. The results showed that the possibility of walking through a park increased individuals’ intentions to walk along the low traffic density road. The provision of air quality information along the two routes also increased the intentions to walk along the low traffic density road. Spatial psychological distance mediated the effect of the availability of a green-space option on route choice intentions along low traffic density roads (but not the effects of the provision of WHO information about the relationship between air pollution and health). The indirect effect of the availability of green space on favorable walking intentions of individuals disappeared when the traffic light colors were used to inform individuals about air pollution levels along the two different routes. The temporal, social, and certainty-related dimensions of psychological distance did not act as mediators.
The findings contribute to the research streams on air pollution, active transportation, and mobility decision-making against the background of health and environment contexts in cities. First, the results showed that the availability of green space increases individuals’ intentions to take more time to walk along a low traffic density road—most likely, to profit from the restoration effect [15]. Thus, highlighting green space in maps when individuals make mobility decisions may increase their physical activity levels via walking [34]. The present research focused on stated walking preferences along low traffic density roads and found support for Hypothesis 1.
Second, the provision of information of air quality has the potential to change individuals’ stated preferences for routes along low traffic density roads. This effect (that should be beneficial to health when intentions turn into actions) can be explained by a decrease in spatial psychological distance. The findings thus contribute to Construal Level Theory and psychological distance. Not only engagement in fighting climate change [19], perceiving threats from diseases [20], and avoiding indulging in unhealthy food choices [21], as shown in previous studies, but also intentions to walk in good air depend on psychological distance. But why did the temporal, social, and certainty-related dimensions of psychological distance not produce similar effects? One can only speculate about the reasons, but the visualization of good or bad air conditions on maps may have added to individuals’ knowledge that air quality is a topic that very much depends on geographical factors. When spatial psychological distance is small, air quality threats may be perceived to be more prevalent in one’s own geographical area and this may increase feelings of urgency to take action (here: via taking a low traffic density walking route). The visualization via a map may have helped participants draw conclusions about the geographic implications of air quality.
Lastly, the findings that both the availability of green space (when no traffic light color-coding is added) and the provision of the WHO explanation about the relationship between air pollution and health decrease spatial psychological distance deserve attention. The interaction effect found in the study may indicate that the green coloring of the park itself may give individuals enough guidance to prefer a favorable route over an unfavorable route; if the guidance is not provided and no traffic light color-coding is present, spatial psychological distance increases, which then has unfavorable consequences on the stated walking preferences. Future research may investigate this relationship in more detail. The positive effect of the provision of the WHO explanation about the relationship between air pollution and health agrees with the literature on warning labels [35].
Based on the results of the study, public policy makers can be recommended to (1) increase availability of green space in cities; (2) raise awareness of air quality conditions along roads via intuitively interpretable schemes that also describe the relationship between air quality and health on maps; and (3) potentially use color-coding schemes on maps (at least for highlighting green space) to make these areas attractive to walk through when individuals consult maps for making route decisions. While the first recommendation includes changes in the environment, the latter recommendations may be realized via various social marketing campaigns and alternations to map designs. The campaigns and design elements to be implemented may be easier and cheaper to achieve and diffuse than changing the built environment.
The study is not free of limitations. First, external validity concerns may be raised because the sample is not representative of the German population because it used an online sample of German residents. Thus, it remains unknown whether the findings can be transferred to the general population. Second, internal validity concerns may be raised due to individuals’ tendency to give inaccurate judgments about their likelihood of walking along different routes in a city. Indeed, it remains unclear whether individuals accept longer travel times along low traffic density roads in real life. Even though the experimental design made random assignments to the experimental conditions and disguised the purpose of the study, overestimations may still be possible. However, one can assume that the bias, if present, applies to all the experimental groups. Future studies may consider actual behavioral decisions of individuals while manipulating information about air quality on-site. The studies may include both individuals who inform themselves about way finding opportunities via mobile devices and individuals who do not rely on such media. The salience of the map would thus be another factor that can be manipulated in experimental studies.
To conclude, this study found that both the availability of green space and the provision of air quality-related information for different walking routes guided individuals’ intentions to take low traffic density routes. As such stated preferences are desirable, the author of this study hopes to inspire researchers and practitioners to build on the study’s findings to produce pro-environmental effects and positive health effects by shifting individuals’ decisions away from decisions that entail bad air quality exposure (or even high emission mobility) to decisions that entail exposure to good air conditions (and low emission mobility).

Acknowledgments

No funds were received for the research. Monetary incentives were paid from the chair’s budget. The author thanks Michaela Söllner for designing the stimulus material.

Author Contributions

Joerg Koenigstorfer conceived and designed the experiments, performed the experiments; analyzed the data, and wrote the paper.

Conflicts of Interest

The author declares no conflict of interest.

Appendix A

Control (1–4) and experimental conditions (5–12) used in the study.
Urbansci 02 00019 i001aUrbansci 02 00019 i001b

References

  1. Dora, C. A different route to health: Implications of transport policies. Br. Med. J. 1999, 318, 1686. [Google Scholar] [CrossRef]
  2. Banister, D. The sustainable mobility paradigm. Transp. Policy 2008, 15, 73–80. [Google Scholar] [CrossRef]
  3. De Nazelle, A.; Nieuwenhuijsen, M.J.; Antó, J.M.; Brauer, M.; Briggs, D.; Braun-Fahrlander, C.; Cavill, N.; Cooper, A.R.; Desqueyroux, H.; Fruin, S.; et al. Improving health through policies that promote active travel: A review of evidence to support integrated health impact assessment. Environ. Int. 2011, 37, 766–777. [Google Scholar] [CrossRef] [PubMed]
  4. Mueller, N.; Rojas-Rueda, D.; Cole-Hunter, T.; de Nazelle, A.; Dons, E.; Gerike, R.; Götschi, T.; Panis, L.I.; Kahlmeier, S.; Nieuwenhuijsen, M. Health impact assessment of active transportation: A systematic review. Prev. Med. 2015, 76, 103–114. [Google Scholar] [CrossRef] [PubMed]
  5. Hoek, G.; Krishnan, R.M.; Beelen, R.; Peters, A.; Ostro, B.; Brunekreef, B.; Kaufman, J.D. Long-term air pollution exposure and cardio-respiratory mortality: A review. Environ. Health 2013, 12, 1. [Google Scholar] [CrossRef] [PubMed]
  6. Brauer, M.; Hoek, G.; van Vliet, P.; Meliefste, K.; Fischer, P.; Gehring, U.; Heinrich, J.; Cyrys, J.; Bellander, T.; Lewne, M. Estimating long-term average particulate air pollution concentrations: Application of traffic indicators and geographic information systems. Epidemiology 2003, 14, 228–239. [Google Scholar] [CrossRef] [PubMed]
  7. Salam, M.T.; Islam, T.; Gilliland, F.D. Recent evidence for adverse effects of residential proximity to traffic sources on asthma. Curr. Opin. Pulm. Med. 2008, 14, 3–8. [Google Scholar] [CrossRef] [PubMed]
  8. Brugge, D.; Durant, J.; Rioux, C. Near-highway pollutants in motor vehicle exhaust: A review of epidemiologic evidence of cardiac and pulmonary health risks. Environ. Health 2007, 6, 1–12. [Google Scholar] [CrossRef] [PubMed]
  9. Gauderman, W.J.; Vora, H.; McConnell, R. Effect of exposure to traffic on lung development from 10 to 18 years of age: A cohort study. Lancet 2007, 369, 571–577. [Google Scholar] [CrossRef]
  10. Parent, M.-É.; Goldberg, M.S.; Crouse, D.L.; Ross, N.A.; Chen, H.; Valois, M.-F.; Liautaud, A. Traffic-related air pollution and prostate cancer risk: A case-control study in Montreal, Canada. Occup. Environ. Med. 2013, 70, 511–518. [Google Scholar] [CrossRef] [PubMed]
  11. Schneider, R.J. Theory of routine mode choice decisions: An operational framework to increase sustainable transportation. Transp. Policy 2013, 25, 128–137. [Google Scholar] [CrossRef]
  12. Nieuwenhuijsen, M.J.; Khreis, H.; Triguero-Mas, M.; Gascon, M.; Dadvand, P. Fifty shades of green: Pathways to healthy urban living. Epidemiology 2017, 28, 63–71. [Google Scholar] [CrossRef] [PubMed]
  13. Burgess, J.; Harrison, C.M.; Limb, M. People, parks and the urban green: A study of popular meanings and values for open spaces in the city. Urban Stud. 1988, 25, 455–473. [Google Scholar] [CrossRef]
  14. Giles-Corti, B.; Broomhall, M.H.; Knuiman, M.; Collins, C.; Douglas, K.; Ng, K.; Lange, A.; Donovan, R.J. Increasing walking: How important is distance to, attractiveness, and size of public open space? Am. J. Prev. Med. 2005, 28, 169–176. [Google Scholar] [CrossRef] [PubMed]
  15. Kaplan, S. The restorative benefits of nature: Toward an integrative framework. J. Environ. Psychol. 1995, 15, 169–182. [Google Scholar] [CrossRef]
  16. Hartig, T.; Mang, M.; Evans, G. Restorative effects of natural environment experiences. Environ. Behav. 1991, 23, 3–26. [Google Scholar] [CrossRef]
  17. Maas, J.; Verheij, R.A.; Groenewegen, P.P.; De Vries, S.; Spreeuwenberg, P. Green space, urbanity, and health: How strong is the relation? J. Epidemiol. Commun. Health 2006, 60, 587–592. [Google Scholar] [CrossRef] [PubMed]
  18. Trope, Y.; Liberman, N.; Wakslak, C. Construal levels and psychological distance: Effects on representation, prediction, evaluation, and behavior. J. Consum. Psychol. 2007, 17, 83–95. [Google Scholar] [CrossRef]
  19. Scannell, L.; Gillford, R. Personally relevant climate change the role of place attachment and local versus global message framing in engagement. Environ. Behav. 2013, 45, 60–85. [Google Scholar] [CrossRef]
  20. White, A.E.; Johnson, K.A.; Kwan, V.S. Four ways to infect me: Spatial, temporal, social, and probability distance influence evaluations of disease threat. Soc. Cognit. 2014, 32, 239–255. [Google Scholar] [CrossRef]
  21. Merle, A.; Herault-Fournier, C.; Werle, C.O. The effects of indication of local geographical origin on food perceptions. Rech. Appl. Mark. 2016, 31, 26–42. [Google Scholar] [CrossRef]
  22. Shooter, D.; Brimblecombe, P. Air quality indexing. Int. J. Environ. Pollut. 2009, 305–323. [Google Scholar] [CrossRef]
  23. Elliot, A.J.; Maier, M.A.; Binser, M.J.; Friedman, R.; Pekrun, R. The effect of red on avoidance behavior in achievement contexts. Pers. Soc. Psychol. Bull. 2009, 35, 365–375. [Google Scholar] [CrossRef] [PubMed]
  24. Moller, A.C.; Elliot, A.J.; Maier, M.A. Basic hue-meaning associations. Emotion 2009, 9, 898–902. [Google Scholar] [CrossRef] [PubMed]
  25. Bargh, J.A. The ecology of automaticity: Toward establishing the conditions needed to produce automatic processing effects. Am. J. Psychol. 1992, 105, 181–199. [Google Scholar] [CrossRef] [PubMed]
  26. World Health Organization. Air Quality Guidelines: Global Update 2005. Particulate Matter, Ozone, Nitrogen Dioxide and Sulfur Dioxide; WHO Regional Office for Europe: Copenhagen, Denmark, 2006. [Google Scholar]
  27. Van der Linden, S.; Maibach, E.; Leiserowitz, A. Improving public engagement with climate change: Five “best practice” insights from psychological science. Perspect. Psychol. Sci. 2015, 10, 758–763. [Google Scholar] [CrossRef] [PubMed]
  28. Field, A.; Hole, G. How to Design and Report Experiments; Sage: London, UK, 2003; ISBN 9780761973836. [Google Scholar]
  29. Spence, A.; Poortinga, W.; Pidgeon, N. The psychological distance of climate change. Risk Anal. 2012, 32, 957–972. [Google Scholar] [CrossRef] [PubMed]
  30. Jones, C.; Hine, D.W.; Marks, A.D. The future is now: Reducing psychological distance to increase public engagement with climate change. Risk Anal. 2017, 37, 331–341. [Google Scholar] [CrossRef] [PubMed]
  31. Dunlap, R.E.; Van Liere, K.D.; Mertig, A.G.; Jones, R.E. Measuring endorsement of the new ecological paradigm: A revised NEP scale. J. Soc. Issues 2000, 56, 425–442. [Google Scholar] [CrossRef]
  32. Kraft, F.B.; Goodell, P.W. Identifying the health conscious consumer. J. Health Care Mark. 1993, 13, 18–25. [Google Scholar] [PubMed]
  33. Weichenthal, S.; Farrell, W.; Goldberg, M.; Joseph, L.; Hatzopoulou, M. Characterizing the impact of traffic and the built environment on near-road ultrafine particle and black carbon concentrations. Environ. Res. 2014, 132, 305–310. [Google Scholar] [CrossRef] [PubMed]
  34. Cohen, D.A.; McKenzie, T.L.; Sehgal, A.; Williamson, S.; Golinelli, D.; Lurie, N. Contribution of public parks to physical activity. Am. J. Public Health 2007, 97, 509–514. [Google Scholar] [CrossRef] [PubMed]
  35. Wogalter, M.S.; Laughery, K.R. Warning! Sign and label effectiveness. Curr. Dir. Psychol. Sci. 1996, 5, 33–37. [Google Scholar] [CrossRef]
Figure 1. Two examples of the twelve conditions as part of the experimental manipulation in the study: (a) a map that that did not provide a green-space option; absence of both traffic light color-coding and the WHO interpretation; (b) a map that made a green-option available; presence of both traffic light color-coding and the WHO interpretation.
Urbansci 02 00019 g001
Figure 2. Spatial psychological distance ratings (standard deviations) depending on the availability of green space and the provision of traffic light color-coding of air pollution information on the map.
Urbansci 02 00019 g002
Table 1. Walking preferences along roads away from traffic depending on the experimental manipulations of information that was provided to the participants on a map.
Information Provision about Air Quality along the Two Routes 1Information Provision of the General Range of Air Quality Levels 2Conditions of the 2 × 2 × 2 DesignWalking Preference Away from Traffic (%) 3
Presence of Green SpacePresence of Traffic Light Color-CodingPresence of WHO Interpretation
Control groups
1NNNNN7.1
2NNYNN38.5
3NYYNY44.9
4NYYYY51.1
Mean35.4
Experimental groups
5YYNNN50.0
6YYYNN71.4
7YYNYN60.0
8YYYYN55.6
9YYNNY60.0
10YYYNY72.0
11YYNYY60.0
12YYYYY73.3
Mean62.8
1 Shadings were used to indicate variations in air quality along the routes on the map; 2 Bar charts were used to indicate the ranges of air quality next to the map; 3 The variable indicates the preference for walking along the low traffic density road (i.e., the desirable outcome from the perspective of healthy air). Y = Yes (element of the experimental manipulation is present); N = No (element of the experimental manipulation is absent). Means are calculated across control and experimental groups, respectively.
Table 2. Spatial psychological distance as mediator between the availability of green space, depending on information provision about air quality, and intended walking route along the low (vs. high) traffic density road in cities.
Relationships 1B 2SE 3p/CI 4
Direct effects on the mediator (spatial psychological distance)
GSA−0.120.060.04
TLC−0.090.060.16
WHO−0.120.060.05
GSA × TLC0.140.060.02
GSA × WHO−0.010.060.85
TLC × WHO−0.020.060.80
GSA × TLC × WHO0.070.060.28
Direct effects on dependent variable (preference for the low traffic density road)
Spatial psychological distance−0.270.090.004
GSA0.210.110.05
TLC−0.050.110.63
WHO0.120.110.25
GSA × TLC−0.100.110.38
GSA × WHO0.050.110.65
TLC × WHO0.040.110.71
GSA × TLC × WHO0.170.110.12
Indirect effects on the dependent variable (preference for the low traffic density road)
Effect when no traffic light color-coding is provided0.06950.030.0170, 0.1595
Effect when traffic light color-coding is provided−0.00370.02−0.0653, 0.0367
1 The following abbreviations were used for the independent variables: GSA = green space availability, TLC = traffic light color-coding of air quality, WHO = World Health Organization’s interpretation on the relationship between air quality and health provision; 2 b = beta coefficient, indicating the magnitude of change in the outcome variable when the predictor variable changes; 3 Standard errors, indicating how precisely the coefficient’s value is estimated in the model; 4 p = significance value; CI = confidence intervals; CIs are reported for the testing of the indirect effects (bootstrapping). If the CIs exclude zero, the indirect effect is significant.

