1. Introduction
An Urban Heat Island (UHI)—an urban area that is warmer with respect to the surrounding rural (or suburban) areas—is a well-known issue concerning urban environments. It is due to the alterations of thermal (i.e., heat capacity and thermal conductivity), reflective (i.e., solar reflectance or albedo and infrared emittance or emissivity) and mechanical (i.e., roughness) properties of the soil connected to urbanization.
Recognized at the beginning of the nineteenth century by Luke Howard in the city of London [
1], nowadays UHIs are widespread phenomena affecting the urban population which represented 54.5% of the world population in 2016 and it is expected to grow up to 60% by 2030 [
2]. Moreover, Li and Bou Zeid [
3] have highlighted UHIs’ synergy with urban heat waves.
UHIs produce changes in the structure of the atmospheric boundary layer [
4,
5] and in the local atmospheric dynamic, showing a typical circulation characterized by a convergent flow towards the urban area near the ground and a diverging flow at upper levels [
5,
6]. This, together with the alteration of the thermal field, significantly influences the formation and the dispersion of pollutants [
7,
8]. Studies on the effects of the UHI on pollutants have mainly focused on the ozone and NOx chemistry; therefore, in this work we also consider particulate matter. The authors of [
9,
10] show that in the urban area of Seoul, ozone increases by 16 and 13 ppb during the nighttime and daytime, respectively, essentially due to NOx dilution, and a contribution of the release of anthropogenic heat estimated to be 5.3 and 2.4 ppb, respectively. Furthermore, the authors of [
9] highlight the role of local circulations, such as urban-breeze and valley-breeze, in the transport of NOx and ozone. The redistribution of primary and secondary pollutants between the surface and the upper levels of the atmosphere also plays a crucial role. According to [
11], this phenomenon, together with the increase in temperature, results in an increase in surface ozone concentrations in urban areas with a maximum of 2.5 ppb in winter and 4 ppb in summer. The authors of [
12] show that on average, daytime ozone concentrations decrease by about 2 ppbv in the lower boundary layer, while they increase by about 40 ppbv in the upper levels in a city downwind of Shanghai.
Considering the processes of generating a UHI and the associated local circulation, measures to mitigate this phenomenon can be based on changes in the reflective and thermal properties of building materials (e.g., albedo and emissivity) or in the amount of green areas. Changes of the related physical parameters make it possible to modify the surface energy balance in order to “cool” a city. Green roofs (covered with vegetation) and cool materials (characterized by high values of albedo and emissivity) are being increasingly used, and their effectiveness in reducing average and peak ambient temperatures has been demonstrated [
13].
The impact of these techniques on atmospheric composition has also been investigated [
14,
15]. For example, according to [
16], an increase in both albedo and urban vegetation in the city of Stuttgart would result in a reduction of daily mean ozone concentration, but would be accompanied by an increase in peak ozone concentrations of up to 12%.
The city of Milan (Italy) was used as the urban area of application and the modeling tool based on Weather Research and Forecasting (WRF) and CHIMERE models was run at high resolution to carry out numerical experiments. Milan is an important Italian city, as well as the second most populous city in Italy. The UHI in Milan was diagnosed in the 1990s [
17,
18] using urban and airport temperature series, that showed an average difference between the city center and Linate airport close to 1.4 °C. The UHI in Milan was analyzed also using satellite maps [
19,
20], and surface and canopy layer heat islands were distinguished; the surface UHI effect was found to be a noticeable phenomenon throughout the whole diurnal cycle, while the canopy layer UHI emerged after sunset and was absent during the daytime. Regarding the application of UHI mitigation strategies in Milan, the authors of [
21] addressed the issue in terms of urban design options (e.g., the partitioning of trees, grass, asphalt and buildings), highlighting the importance of the increased size of soil water reservoirs to enhance the mitigating effect of urban vegetation.
Milan is located in the Po Valley and is considered a pollution “hot spot” in Europe [
22,
23]. However, to our knowledge, there have been no studies connecting the UHI issue with the air quality levels in the city of Milan and its surroundings. The authors of [
16] point out how the results of related numerical studies depend strongly on the city of interest, for example, because of the peculiar relationship between local meteorology and air quality. In this study, we characterized the UHI in Milan with a high-resolution numerical simulation and we evaluated the influence of the UHI on atmospheric composition. The analysis includes an investigation on the potential impact of the use of highly reflective materials on the meteorology and PM10 ozone concentrations in the urban area and its surroundings. We simulate a reference case with a low value of albedo for all urban surfaces, and two tests cases, with a high value of albedo for all surfaces (roofs, building walls and roads) or for roofs only, during a 10-day period in the summer of 2014. The simulated period was chosen as it was a cool year on average compared to recent years (2012–2016), in order to avoid the confounding role played by heat waves and isolate the contribution due to the city.
A previous study investigated the secondary effects of UHI mitigation techniques in the city of Stuttgart (Germany) during the 2003 heat wave [
16], using the online model WRF/Chem. In this work, we used the offline WRF/CHIMERE model in order to isolate the effect of changed surface albedo in the city on meteorological and air quality variables, without the direct or indirect feedback of pollutants on dynamics and radiation. Moreover, we consider two different scenarios for the increase in albedo values, while in [
16] a single high-albedo was run for the roofs and facades scenario.
2. Materials and Methods
We used the mesoscale Weather Research and Forecasting model (WRF, [
24]) and the Eulerian off-line chemistry-transport model CHIMERE [
25], so that meteorological fields computed by WRF were used as input to CHIMERE.
Figure 1 shows the four one-way nested domains used in WRF. CHIMERE domains cover geographical areas similar to WRF, even if WRF domains are on a Lambertian projection, while CHIMERE domains are on a regular latitude–longitude projection. The horizontal grid resolution increases with a grid ratio of 4, from 36 km on the European domain to 1.3 km on the domain over Milan for WRF, and from 0.5° to 0.015° for CHIMERE. The resolution and number of cells for each domain are listed in
Table 1. The top of WRF domains is at 50 hPa: 33 eta vertical levels with 11 levels below 1000 m and the lowest one at about 23 m. The top of CHIMERE domains is at 500 hPa: 12 vertical sigma levels with 7 levels below 1000 m and the lowest one at about 21 m. For meteorological simulations, initial and global boundary conditions were taken from Global Forecasting System (GFS) operational analyses, provided by the National Center for Environmental Prediction (NCEP), at a spatial resolution of 1° × 1° and a temporal resolution of 6 h. Furthermore, WRF simulations were performed in 30-h blocks, starting at 18:00 Local Time (LT) of each day with the first 6 h discarded as model spin-up. Since we used the model for sensitivity tests, we prefer this run strategy to be called “reforecast” [
26], in order to avoid analysis nudging that would dampen the effect of the perturbation on model parameters. The WRF physics options adopted are reported in
Table 2, including the Multi-layer Building Environment Parameterization (BEP, [
27]) as the urban physics option with default input values for thermal and geometric parameters. This scheme expects three types of urban texture (commercial, high residential, low residential), but in this work we employ the same value of parameters for the three types since the MODIS land use dataset used here includes just one urban category.
For the simulations with CHIMERE, the inventory of anthropogenic emissions from the European Monitoring and Evaluation Programme (EMEP,
http://www.emep.int) with a resolution of 0.5° × 0.5° was used for the domain over Europe, and the inventory from the National Thematic Center for Atmosphere, Climate, Emissions (CTN-ACE, [
28]) with a resolution of 5 km × 5 km was used for the domains over Italy. We carried out CHIMERE simulations in 24-h blocks, starting at 00:00 LT of each day and restarting from the previous run.
Three numerical experiments were performed differing in the values of albedo assigned to the urban surfaces (roofs, buildings walls, roads), as shown in
Table 3. Albedo is the reflection coefficient of a surface with regard to solar radiation; at the same downward solar radiation, low-albedo surfaces reflect less radiation and become warmer than high albedo materials. The reference (Ref) case is characterized by an albedo equal to the default value of 0.2 for roofs, walls and roads; the test case simulating highly-reflective materials covering roofs (AlbRoof) has an albedo value equal to 0.7 for roofs and an albedo equal to 0.2 (default value) for buildings and roads; the last test case (AlbAll) simulates the use of highly-reflective materials for all surfaces; therefore, albedo is equal to 0.7 for roofs, walls and roads. An albedo of 0.7 is reported as the value of cool white roofing materials in [
29] and it is used by various studies as a characteristic value of highly reflective materials [
16,
30]. According to [
30], values of albedo greater than 0.7 are not realistic. The choice of the same value also for roads and walls is based on [
29,
30]. The simulated time period is from 14 to 23 July 2014 and is the same for the three experiments.
3. Results and Discussion
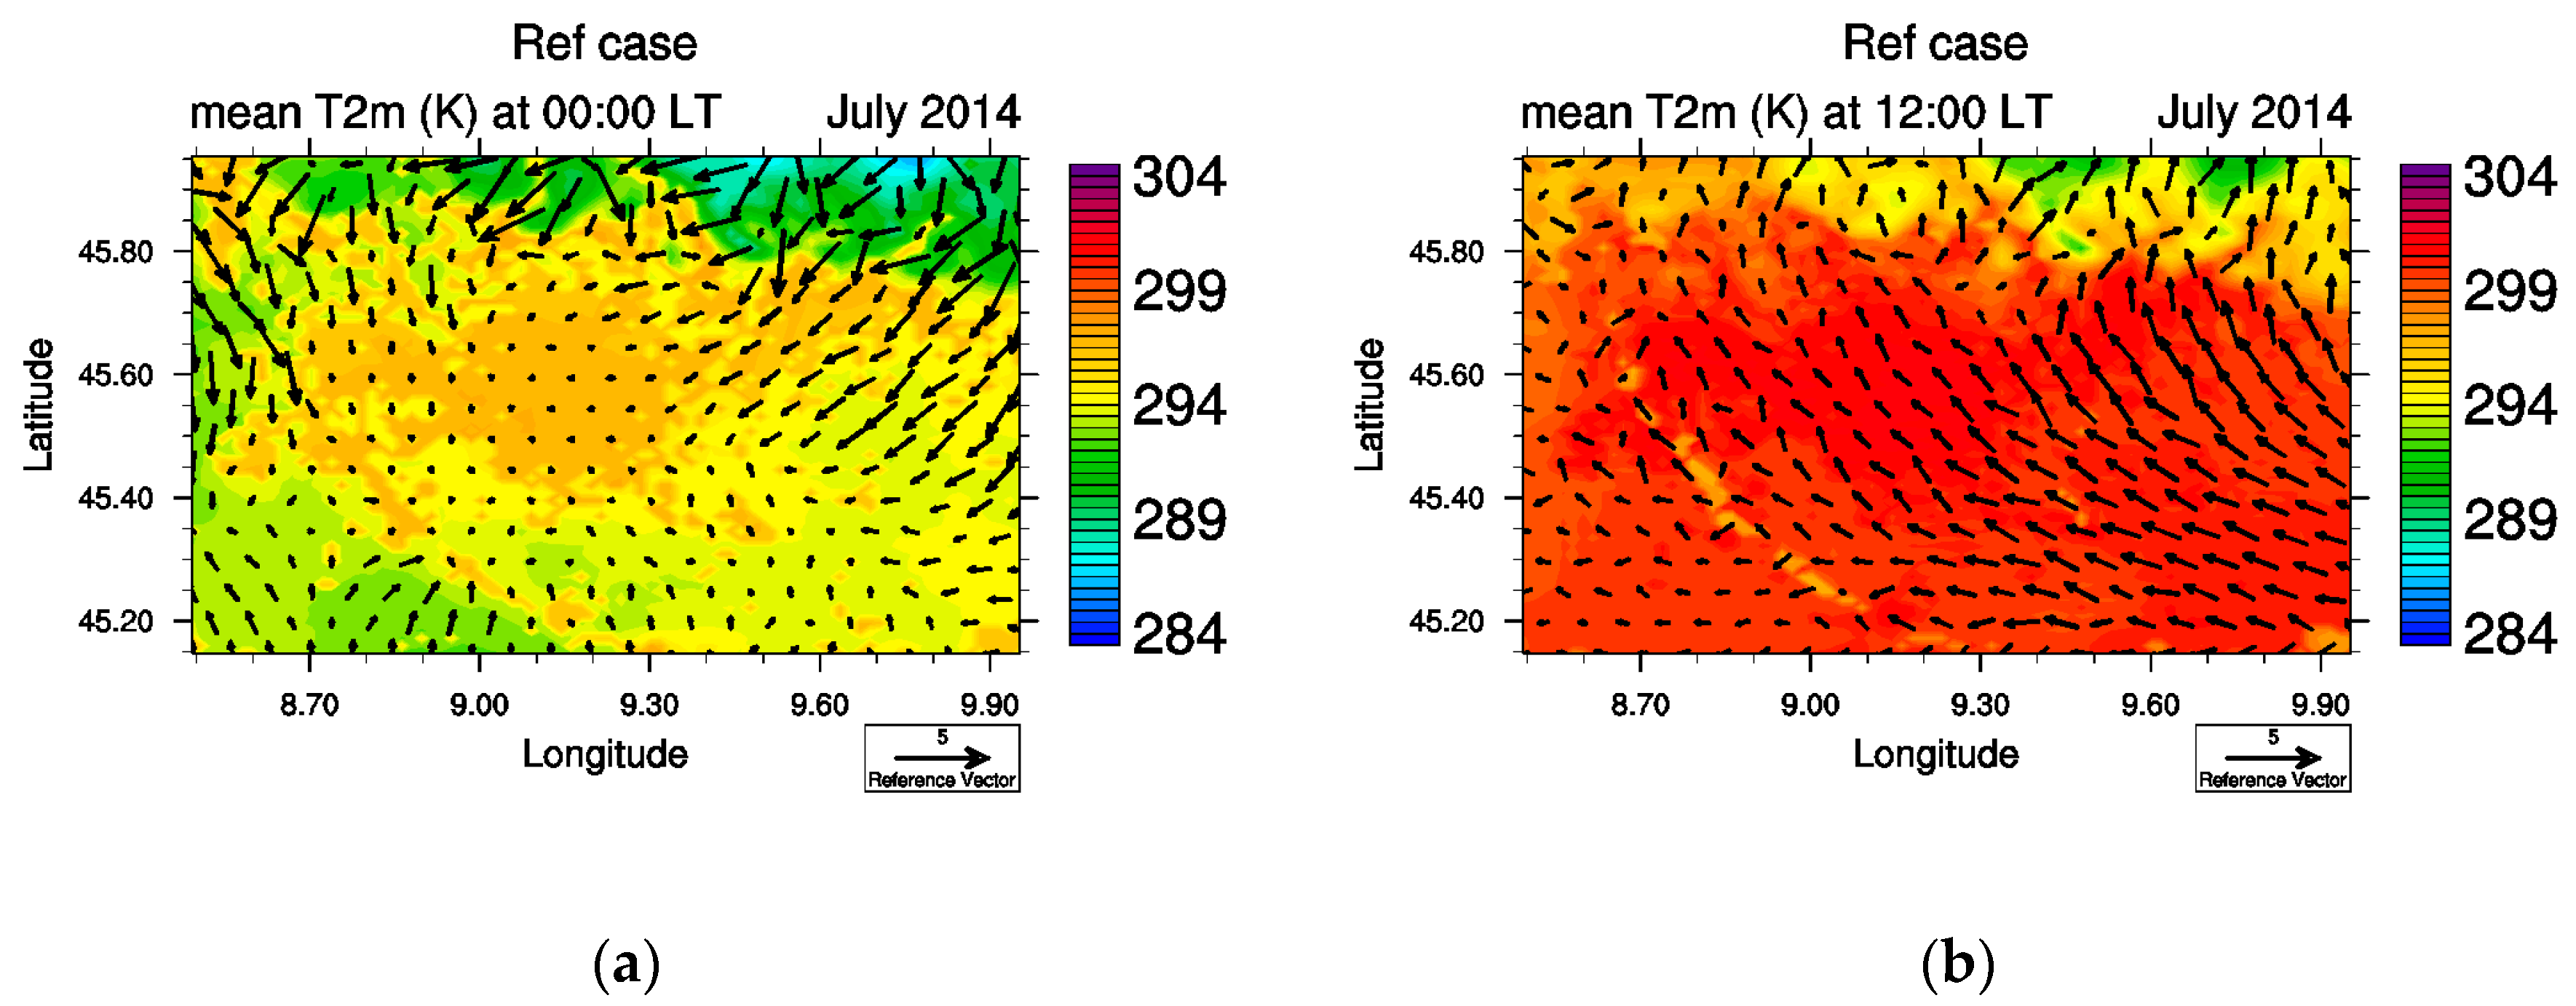
Maps of the average T2m in the domain over Milan for the reference case (
Figure 2) clearly show that the temperature is higher in the area with the urban land use both at 00:00 LT and 12:00 LT. The urban–non-urban T2m difference is called UHI intensity and in this study we computed UHI intensity as the difference of the average T2m between the urban and non-urban areas (Rural and Suburban) according to the land use categories depicted in
Figure 1 (mixed forests and croplands respectively).
Figure 2 and
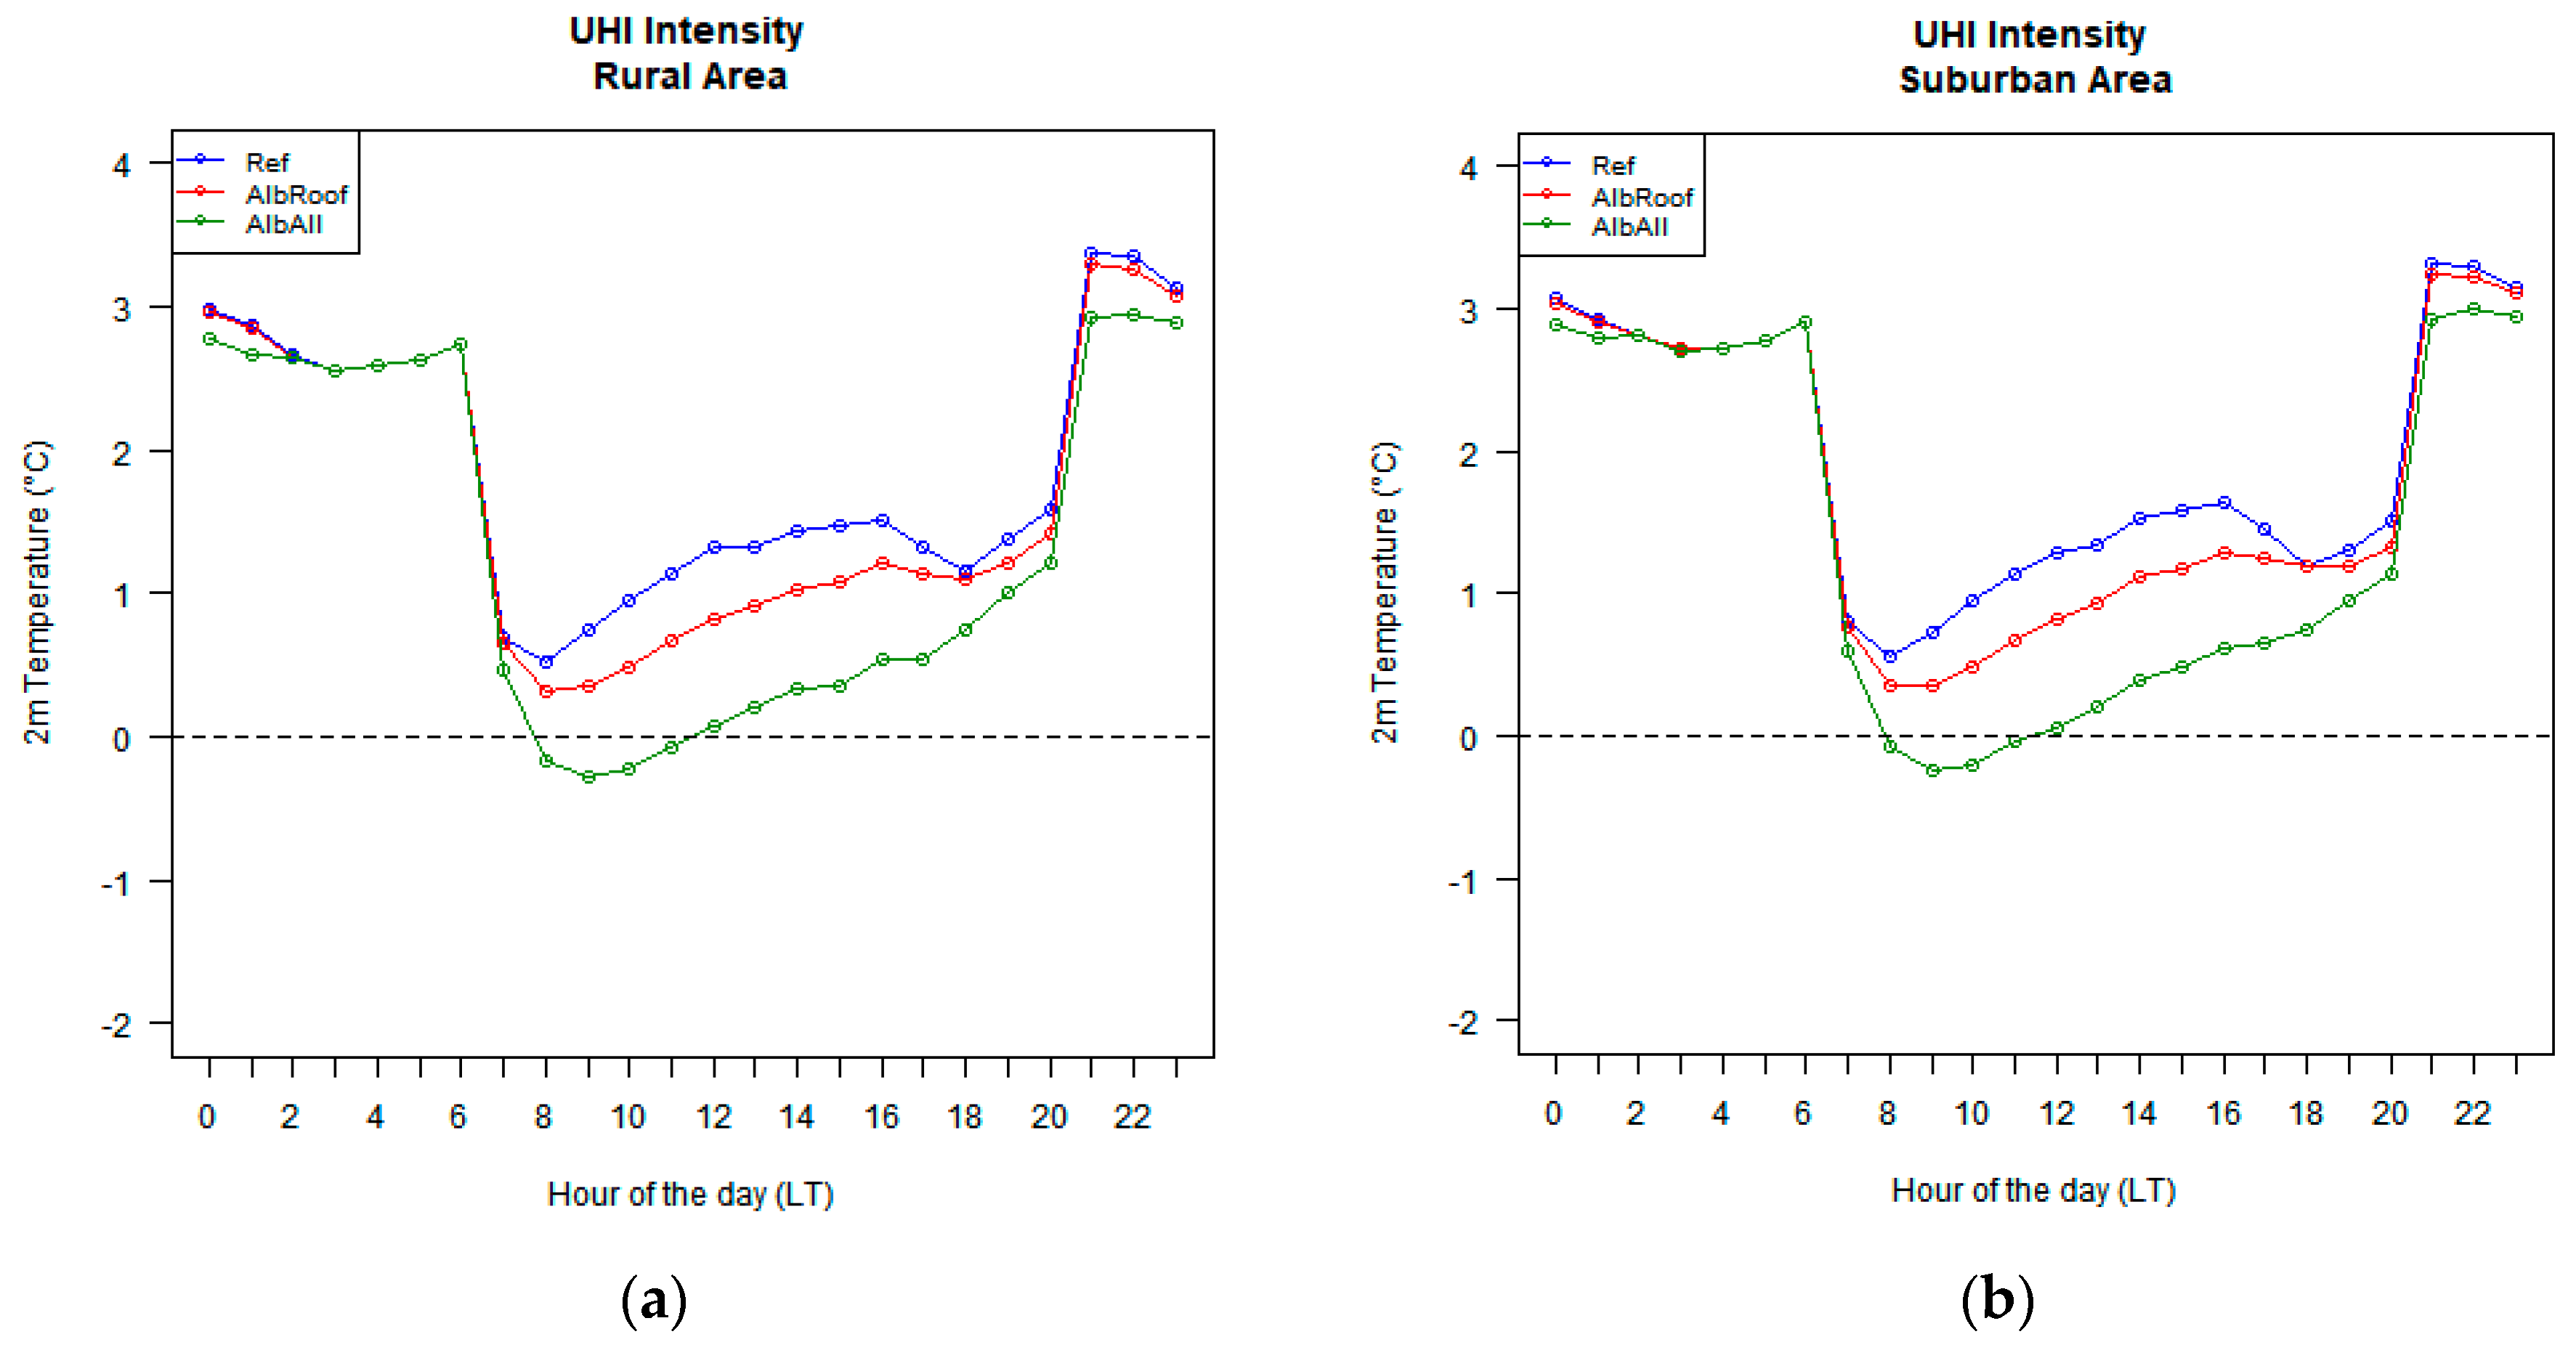
Figure 3 show that UHI intensity is greater during nighttime consistent with the nature of UHI, being typically a nocturnal phenomenon. In particular, as shown in
Figure 3, UHI intensity is higher during the nighttime both in the rural and suburban areas, regardless of the use of highly reflective materials.
Increases in albedo values of materials covering urban surfaces determine the increase in the fraction of reflected shortwave radiation and consequently of the surface temperature. Indirect consequences on the surface energy budget are the increase in the sensible and latent heat fluxes and of upward long-wave radiation. In this section, we investigated the effects on the temperature at 2 m height (T2m), on the planetary boundary layer (PBL) height (PBLH) and on wind speed. The effect on the surface concentrations of O
3 and PM10 were also studied. Results on PM25 and NO
2 concentrations are included as
Supplementary Material as their analysis does not add significant elements with respect to the purpose of this work.
Preliminary results (Falasca and Curci, under review) show that the overestimation of PM10 concentrations and the under estimation of ozone concentrations by the WRF-CHIMERE model does not depend on the land use category (urban, suburban, rural). Therefore, the bias between observations and model does not affect differences in concentrations between areas characterized by different land use that are analyzed in this paper. A statistical summary of models to observation comparison for 2 m temperature, 10 m wind speed, ozone and PM10 concentrations for tests using different urban canopy models is included as
Supplementary Material.
The effect of the use of highly reflective materials is present essentially during the daytime as they act on the reflection of shortwave radiation. In
Figure 3 it can be observed that the reduction of T2m of the urban areas in AlbAll case causes UHI intensity to be smaller than the other test cases also carried out between 20:00 LT to 24:00 Coordinated Universal Time (UTC). The introduction of highly reflective materials leads to a reduction of UHI intensity, higher in the AlbAll case compared to the AlbRoof, up to 1.5 °C both in the rural and suburban areas. Notably, between 08:00 LT and 11:00 LT, UHI intensity becomes negative in the extreme AlbAll case, meaning that the city is colder than the surrounding areas. It is also worth noting that the Refand AlbRoof cases show a decrease in UHI intensity between 16:00 LT and 18:00 LT before rising rapidly, while the AlbAll case has a smoother trend that continues until 20:00 LT.
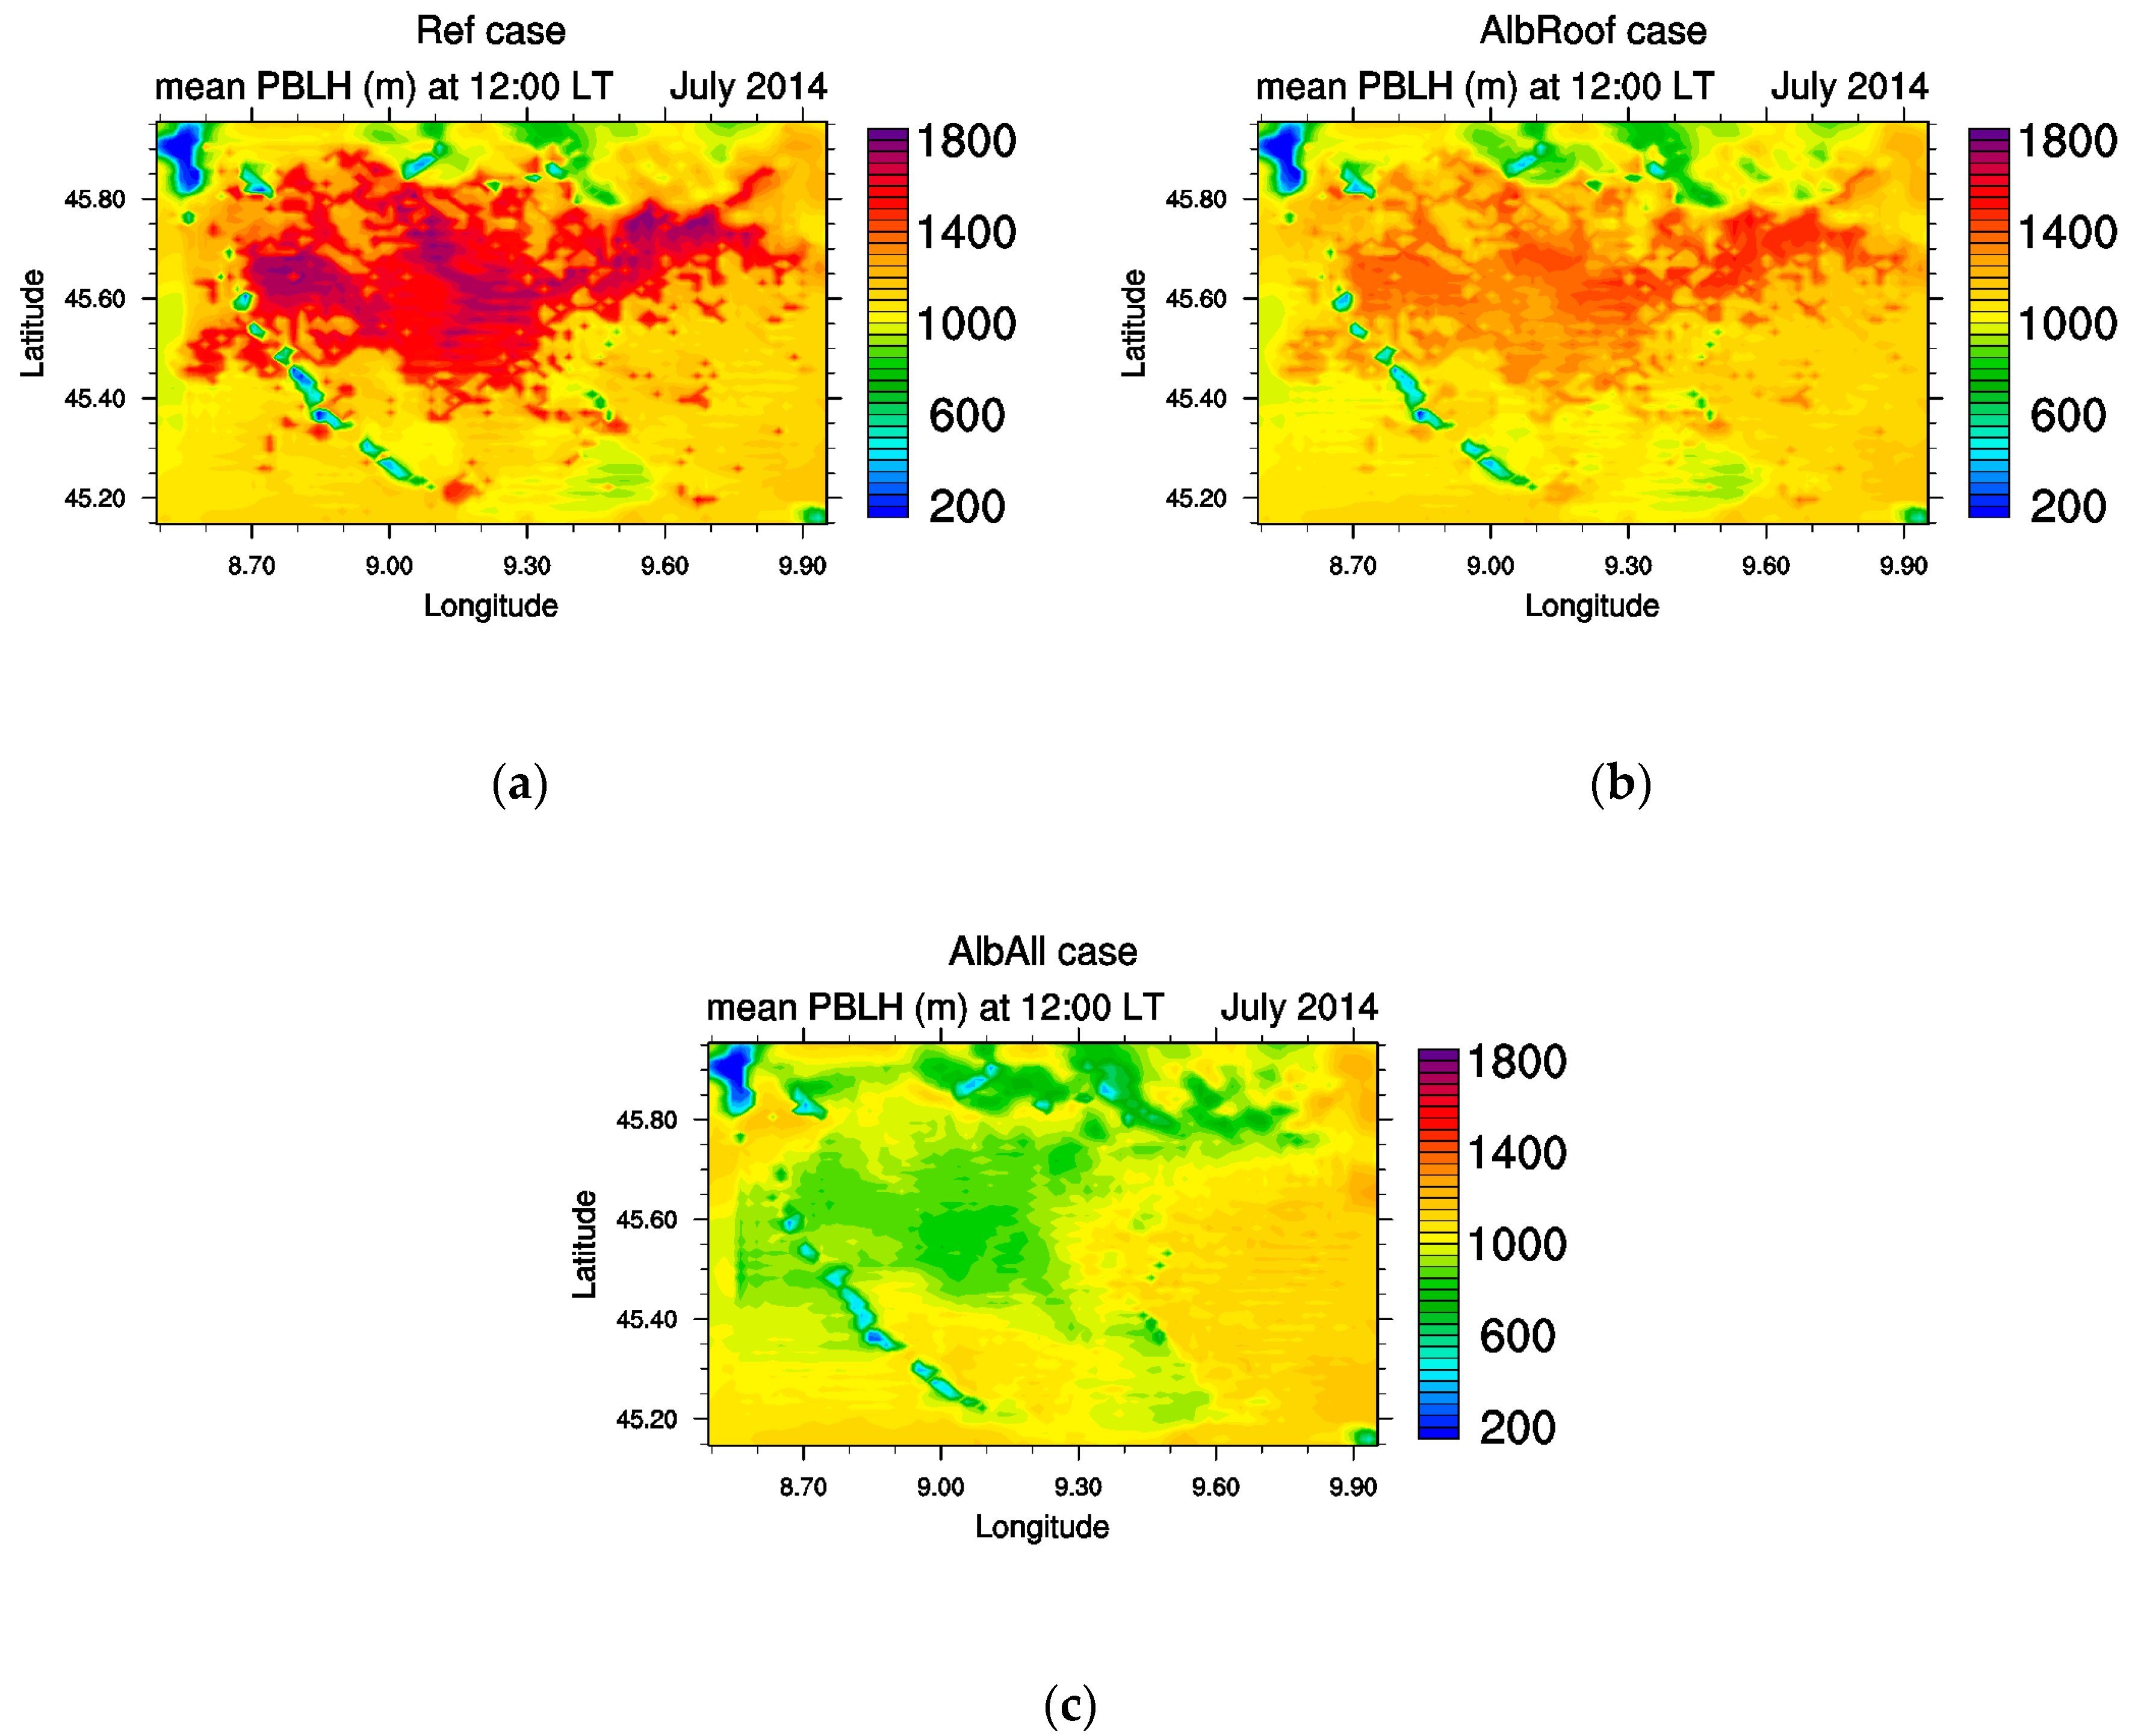
Figure 4 shows the progressive reduction of PBL height (PBLH) in the city for the AlbRoof and AlbAlltest cases at 12:00 LT, so that in the AlbAll case PBLH is lower in urban than in the non-urban areas.
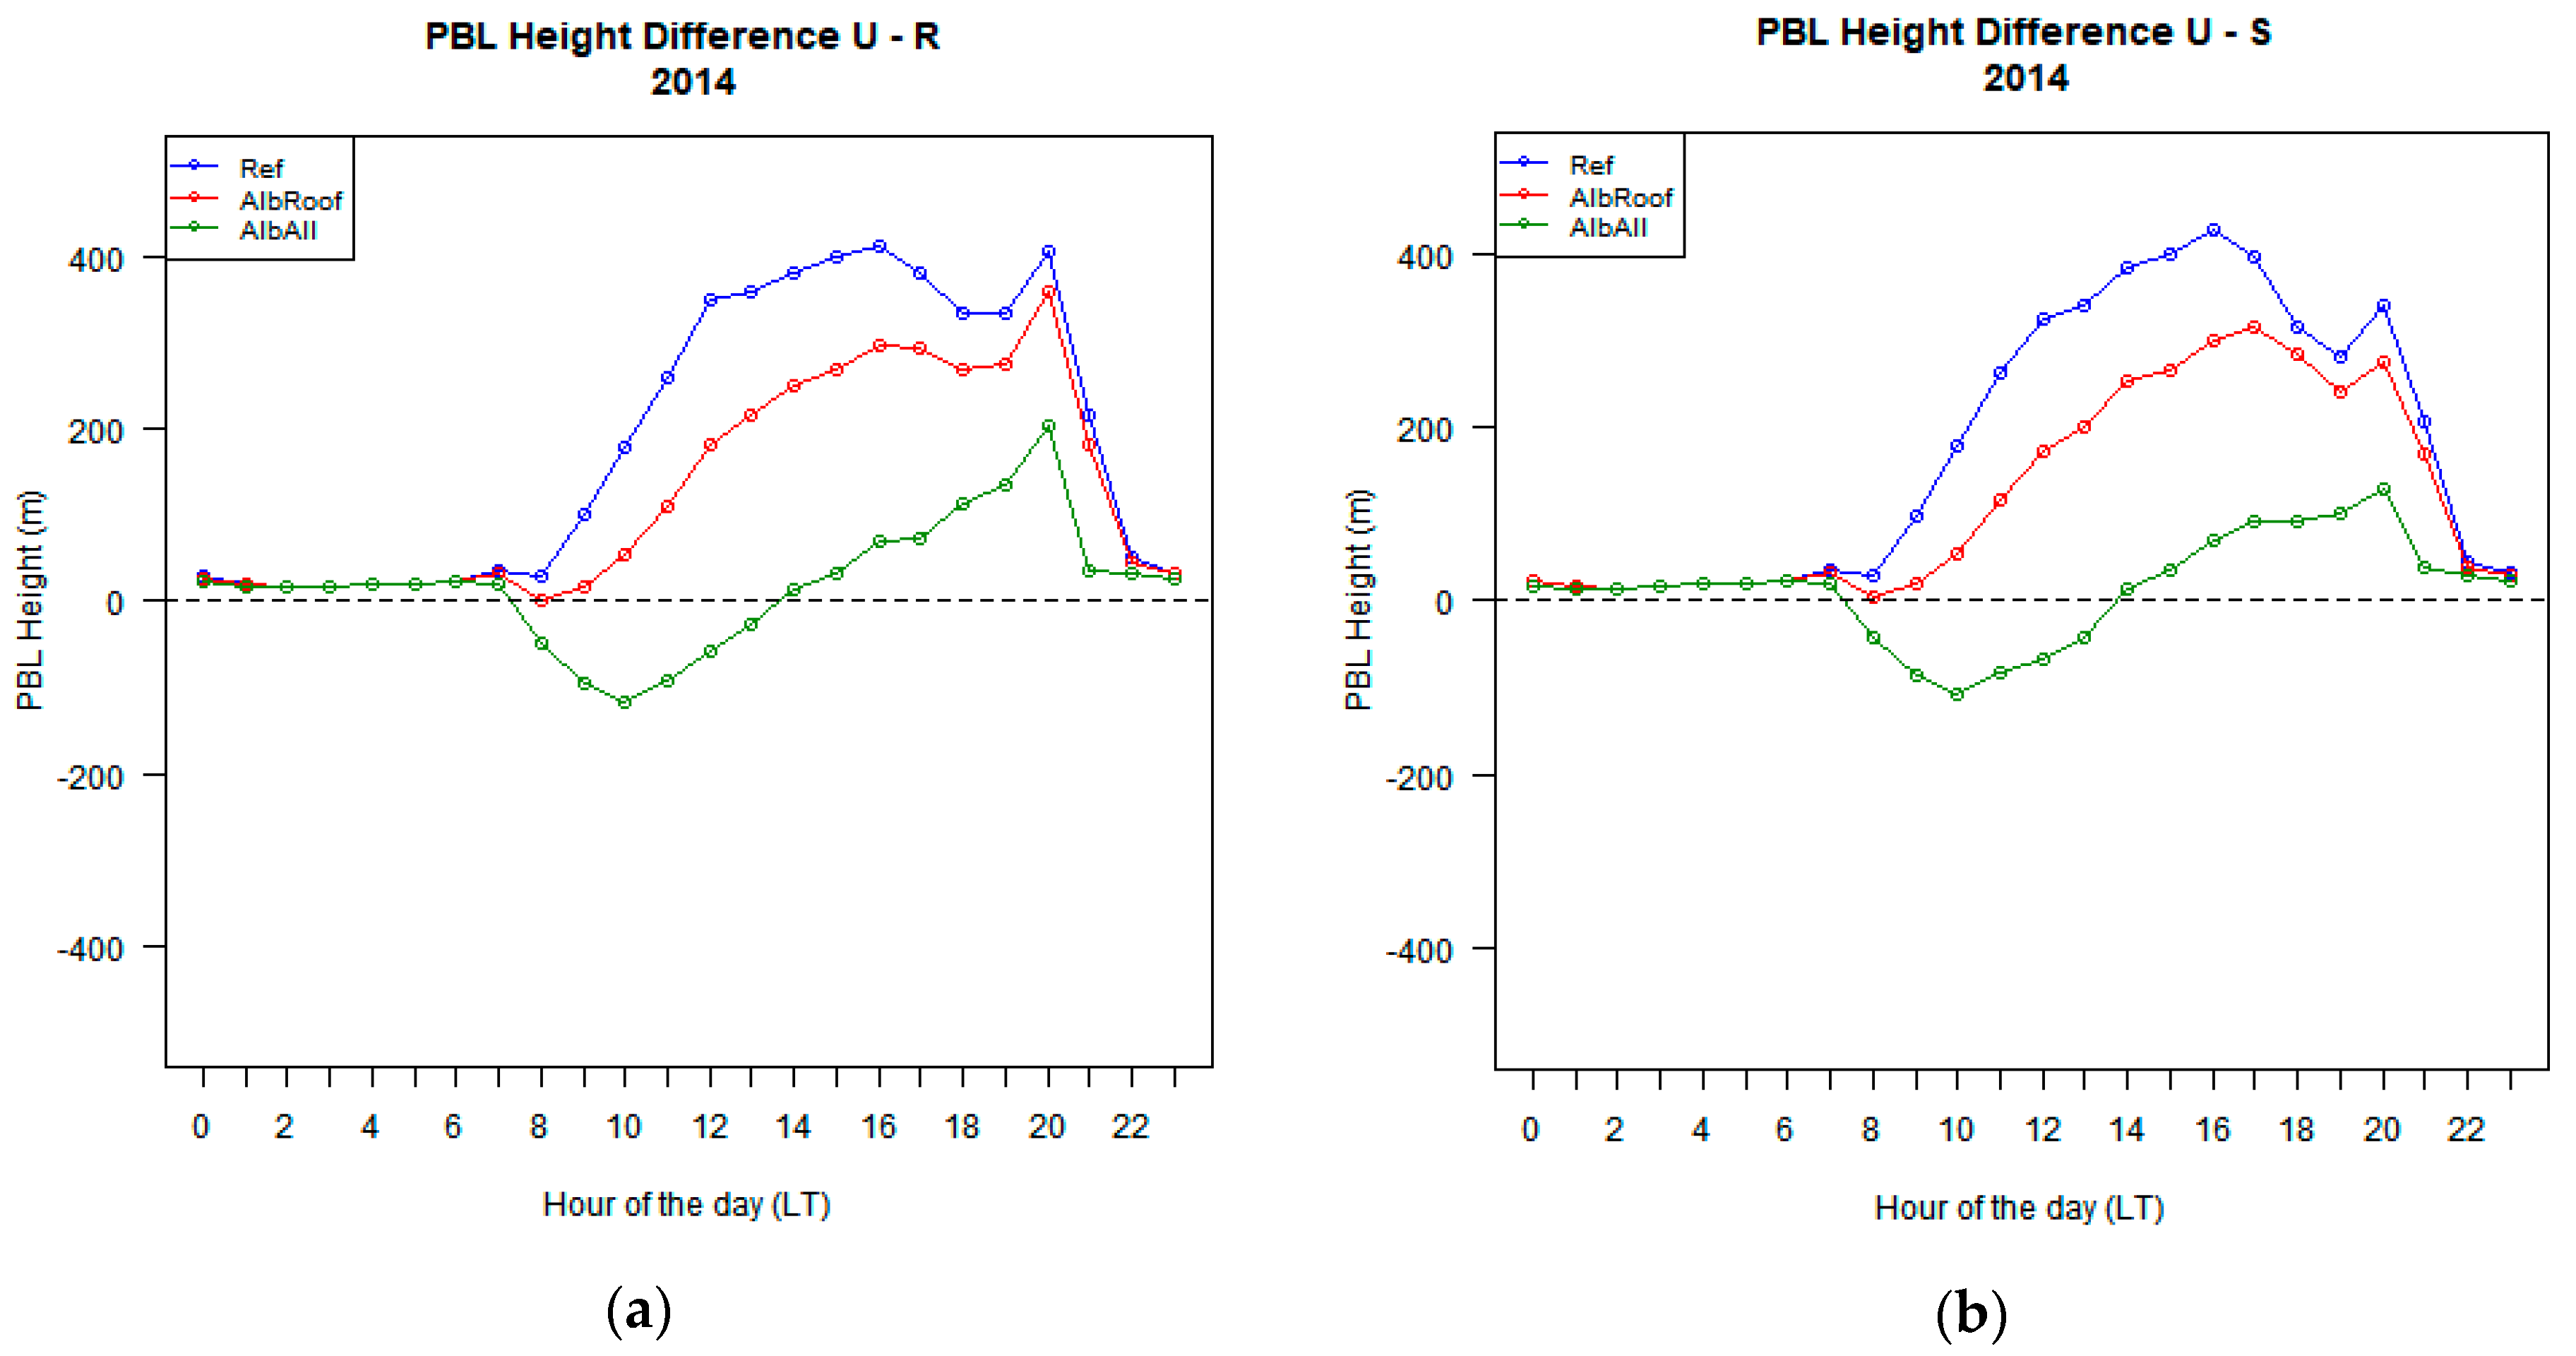
Figure 5 shows that the difference of PBLH between Refand AlbRoofcan reached 200 m in the central hours of the day for both the rural and the suburban areas. The difference between Refand AlbAll shows non-positive values between 07:00 and 14:00 LT, even reaching values around −150 m at 10:00 LT.
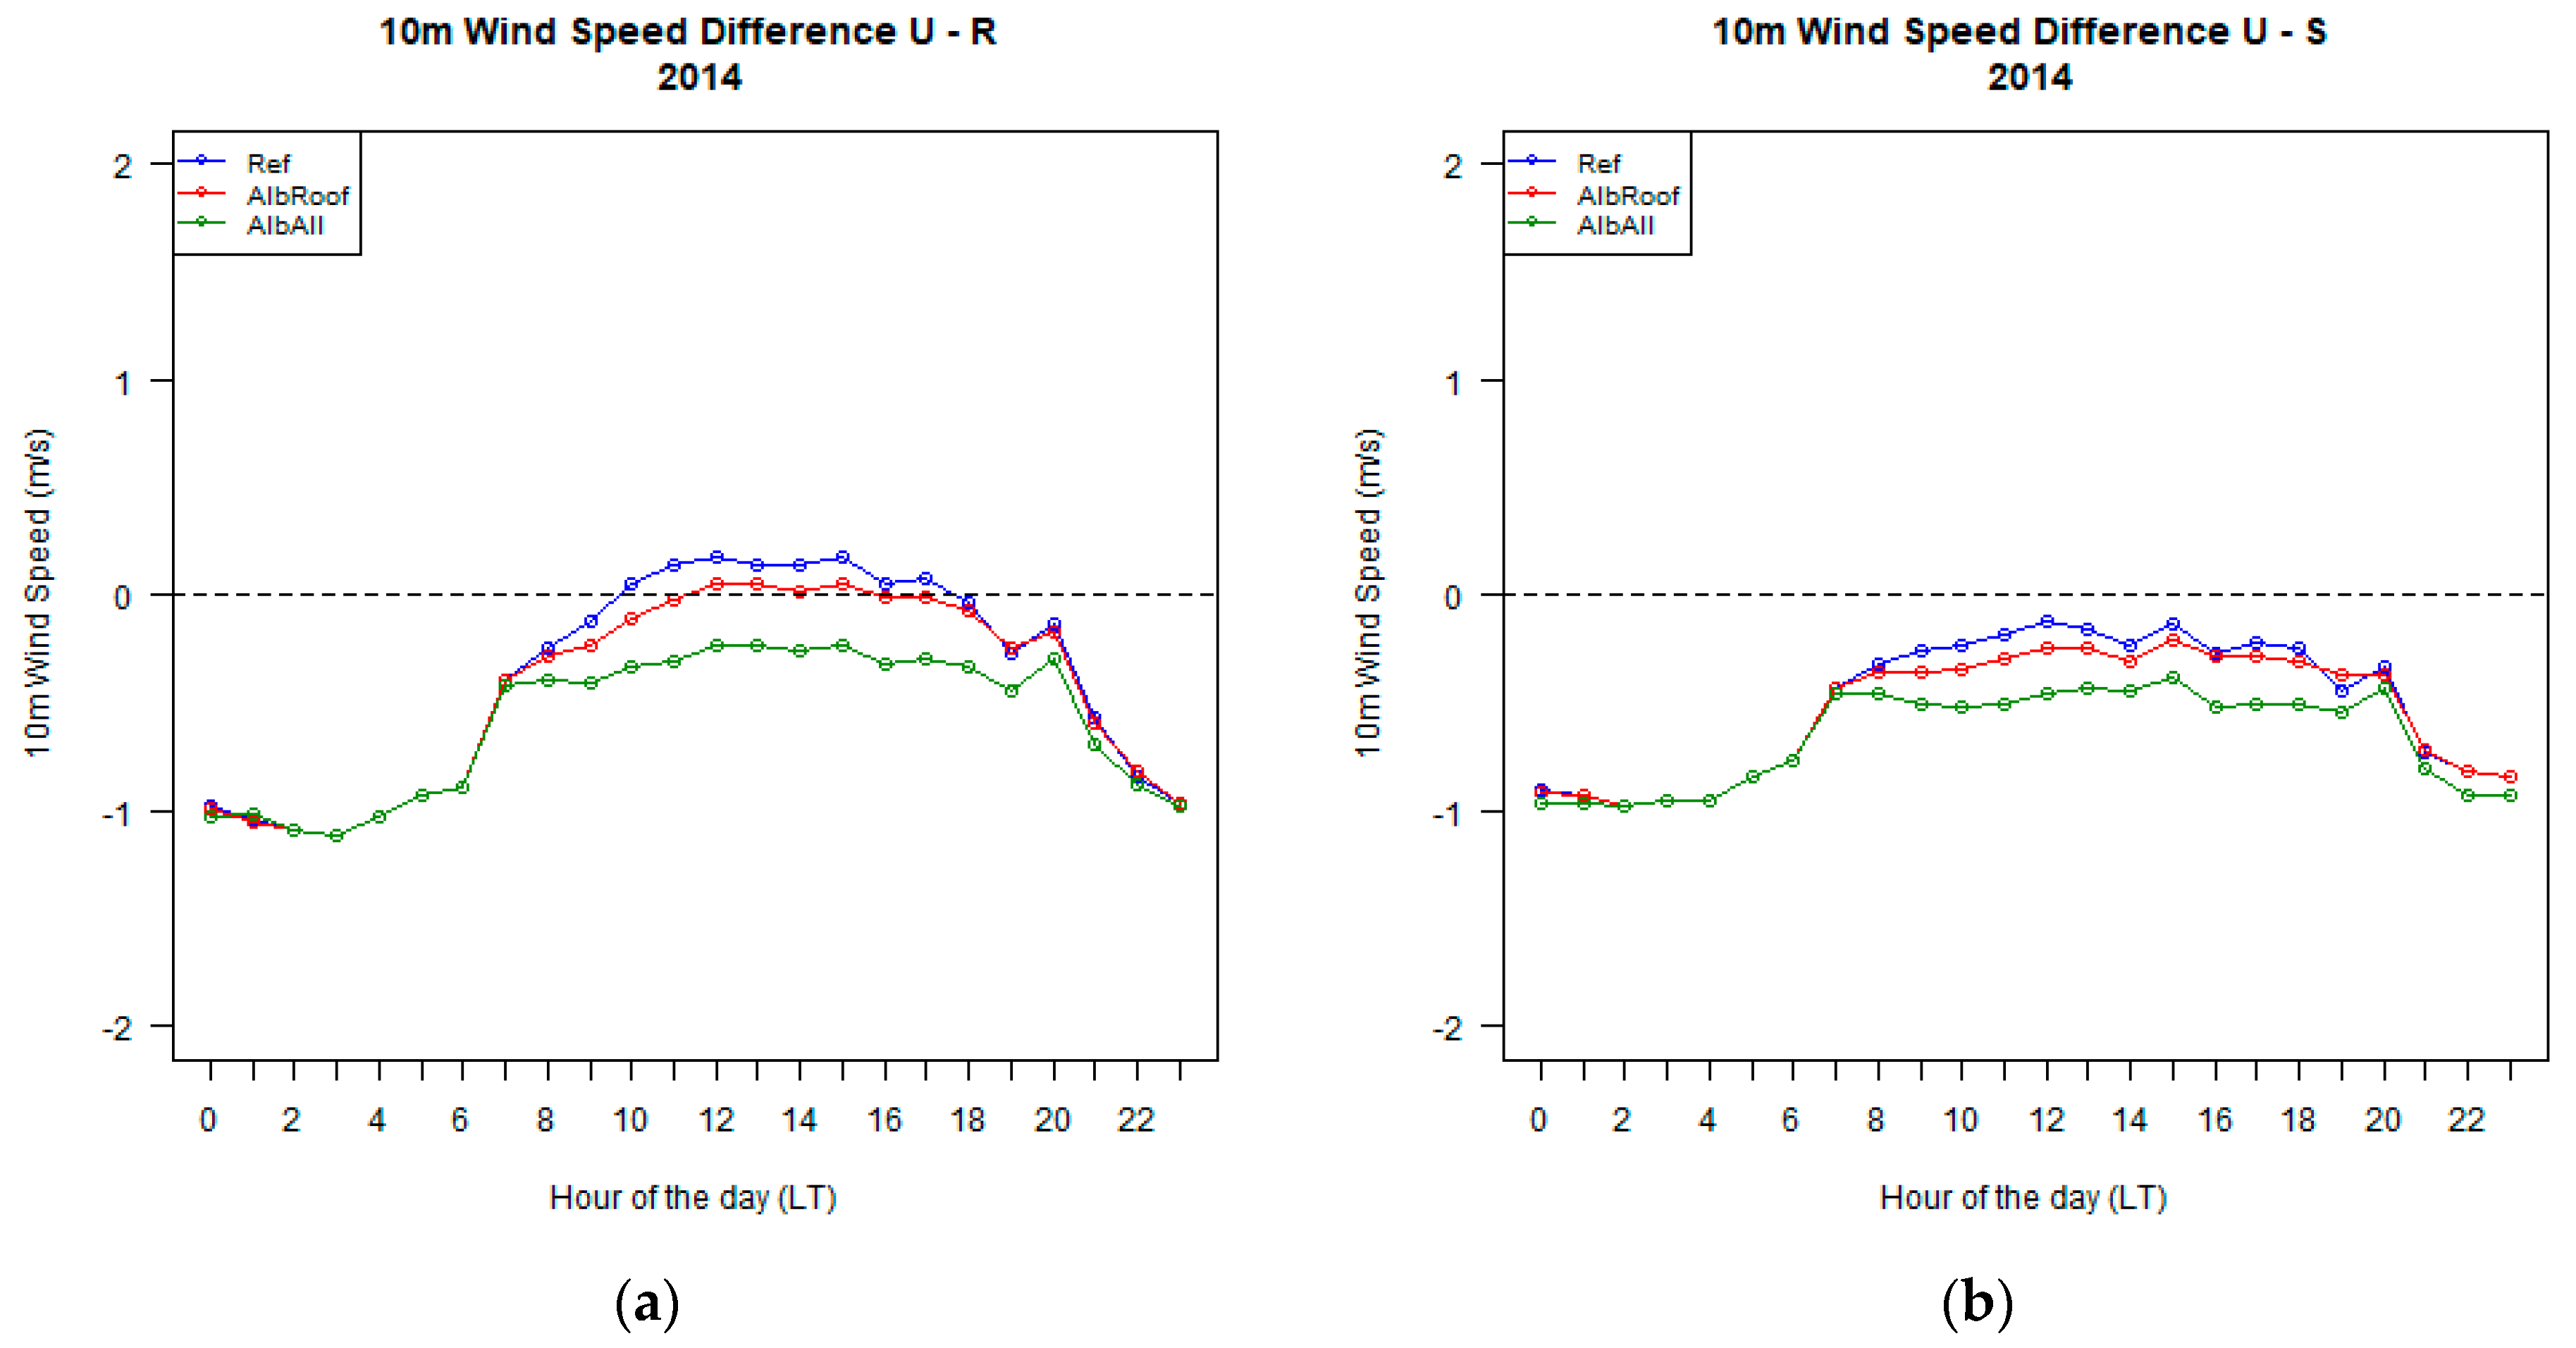
In addition to reducing the PBLH, the application of highly reflective materials negatively influences other parameters that contribute to the transport and dispersion of pollutants. Regarding wind speed, in
Figure 6 both the rural–urban and suburban–urban differences decrease for highly reflective materials; in the Ref and AlbRoof cases, the difference with the rural area is positive only in the central hours of the day and in the AlbAll case the difference is negative throughout the daily cycle; the urban–suburban difference is negative throughout the daily cycle for all cases. This means that wind speed in the urban area is always lower than in the area characterized by the croplands land use and tends to be lower than in the mixed forests, certainly due to the superficial roughness that characterizes the built areas with respect to the forests and even more with respect to the croplands.
Also, TKE decreases in urban cells as can be seen in
Figure S1 in the Supplementary Materials, where we compare vertical cross sections of the average TKE at a latitude equal to 45.50 and at 12:00 UTC for the three numerical experiments: Ref, AlbRoof, AlbAll.
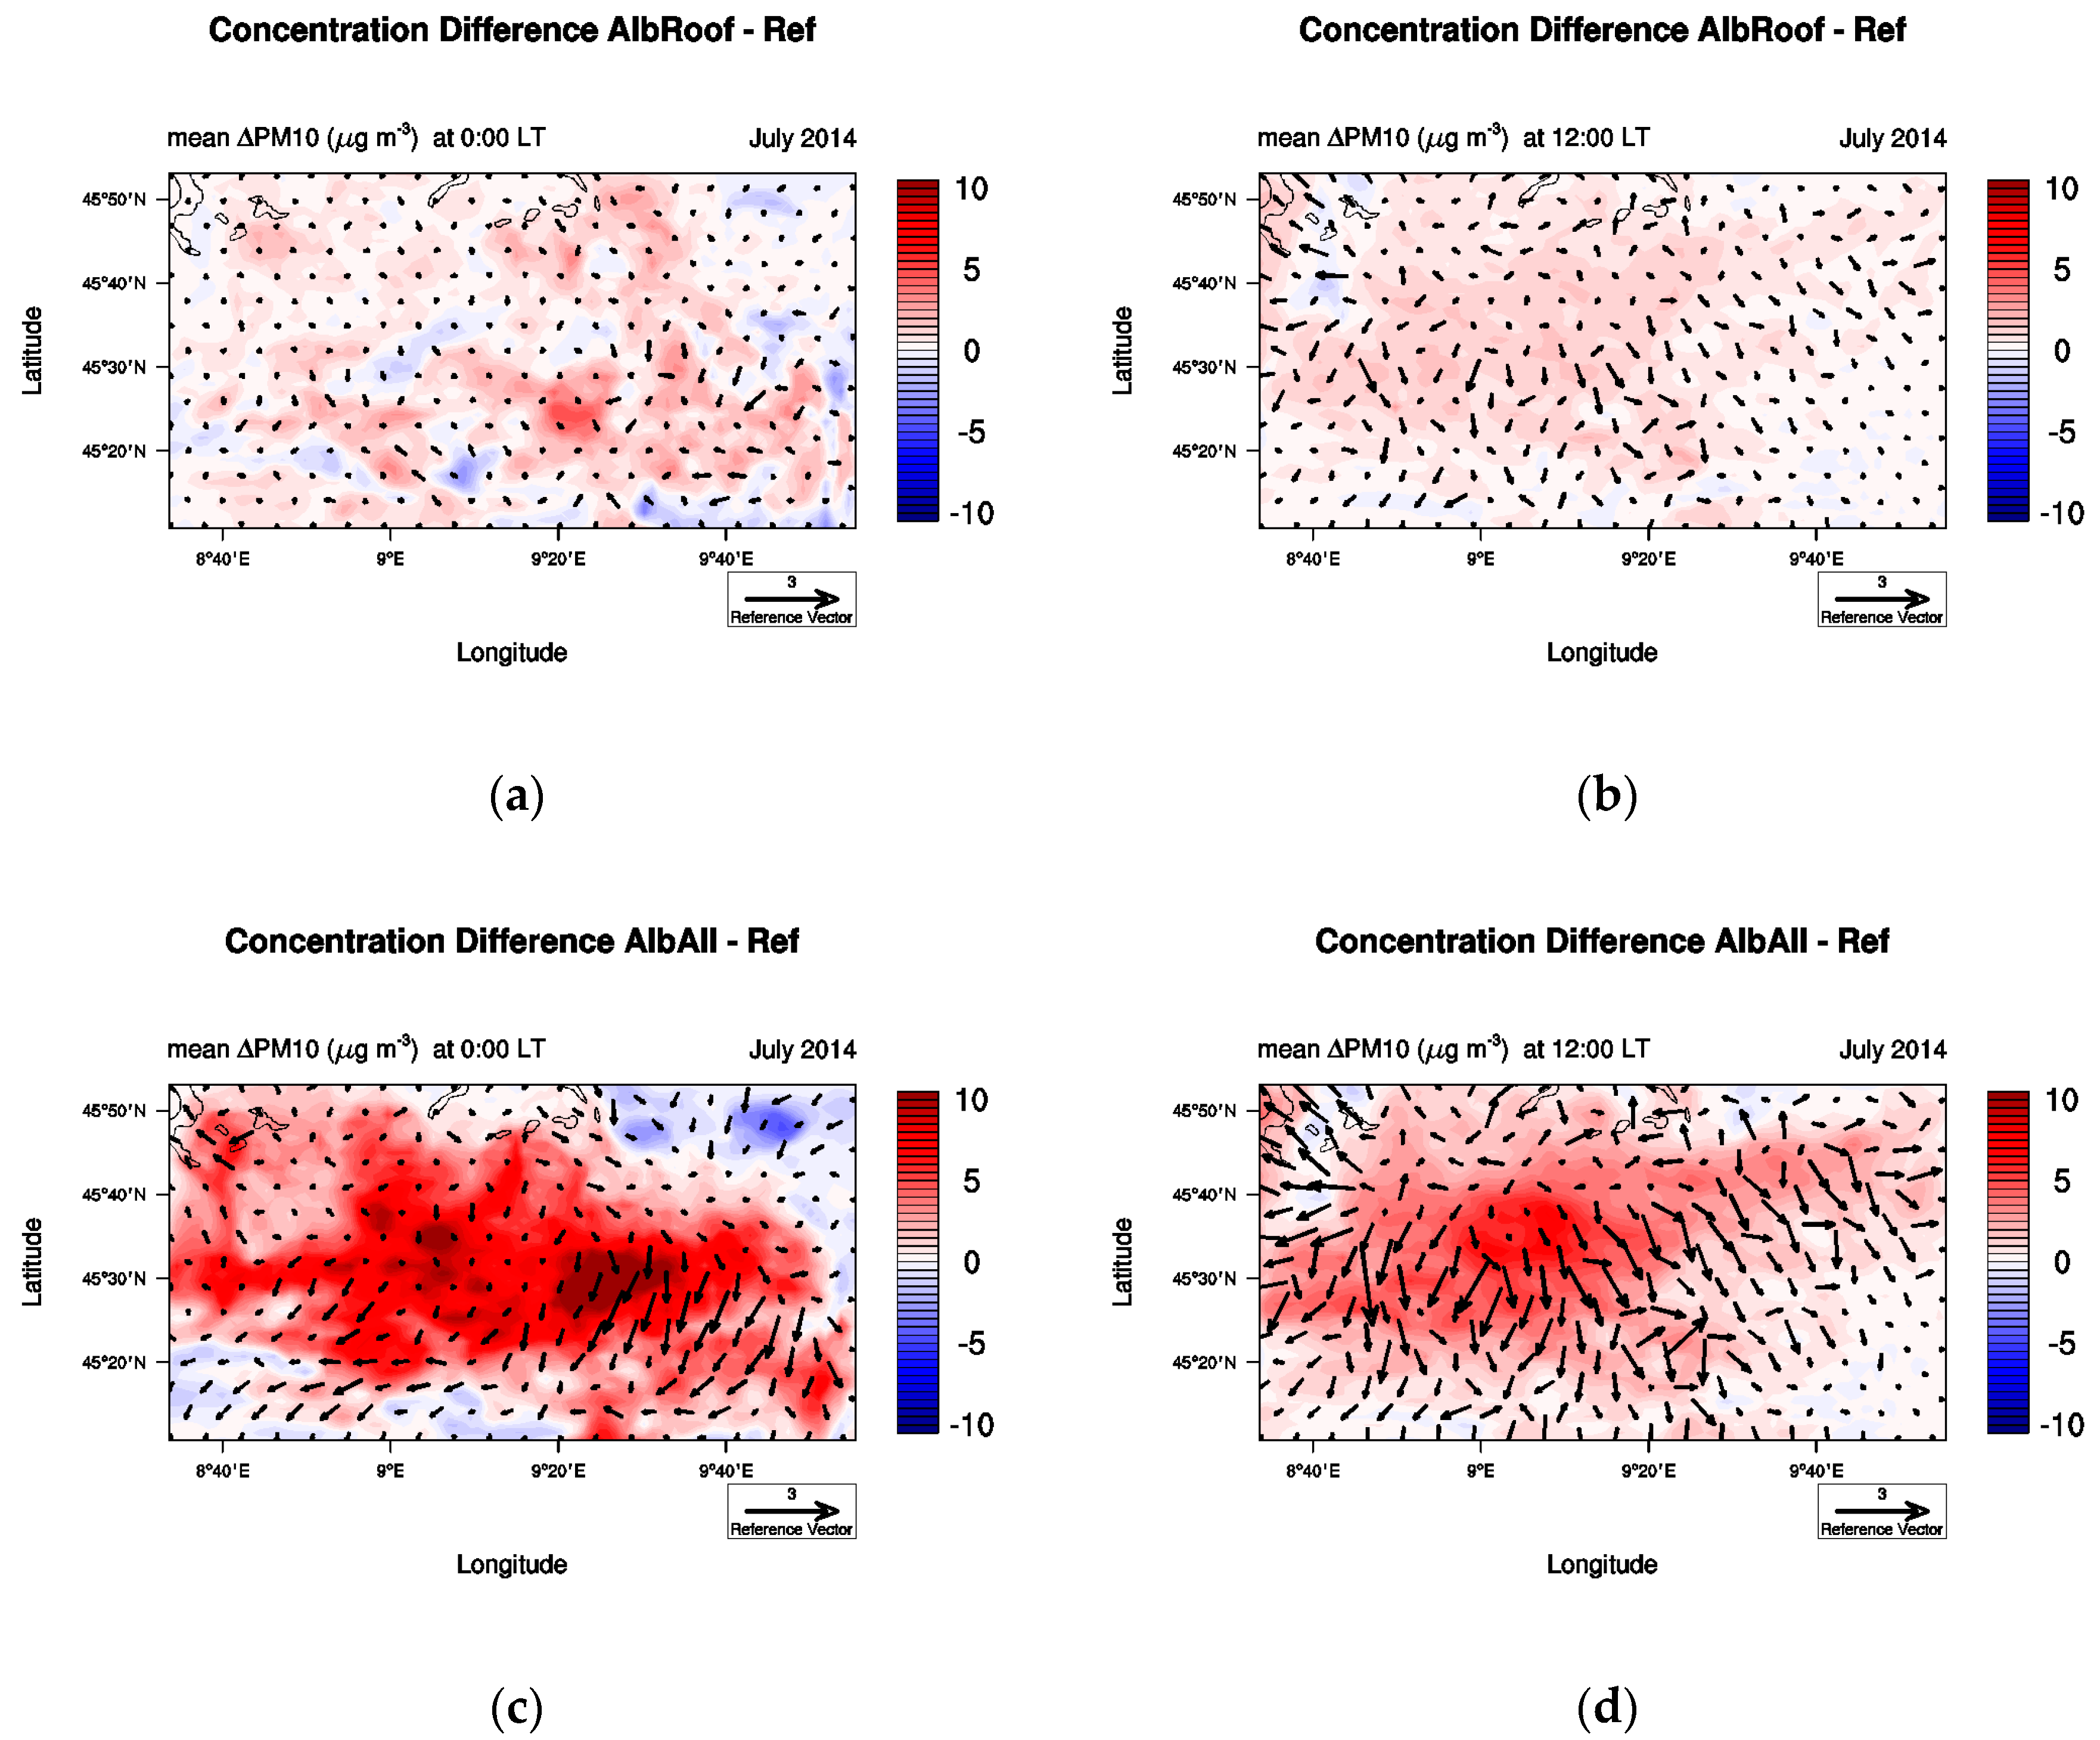
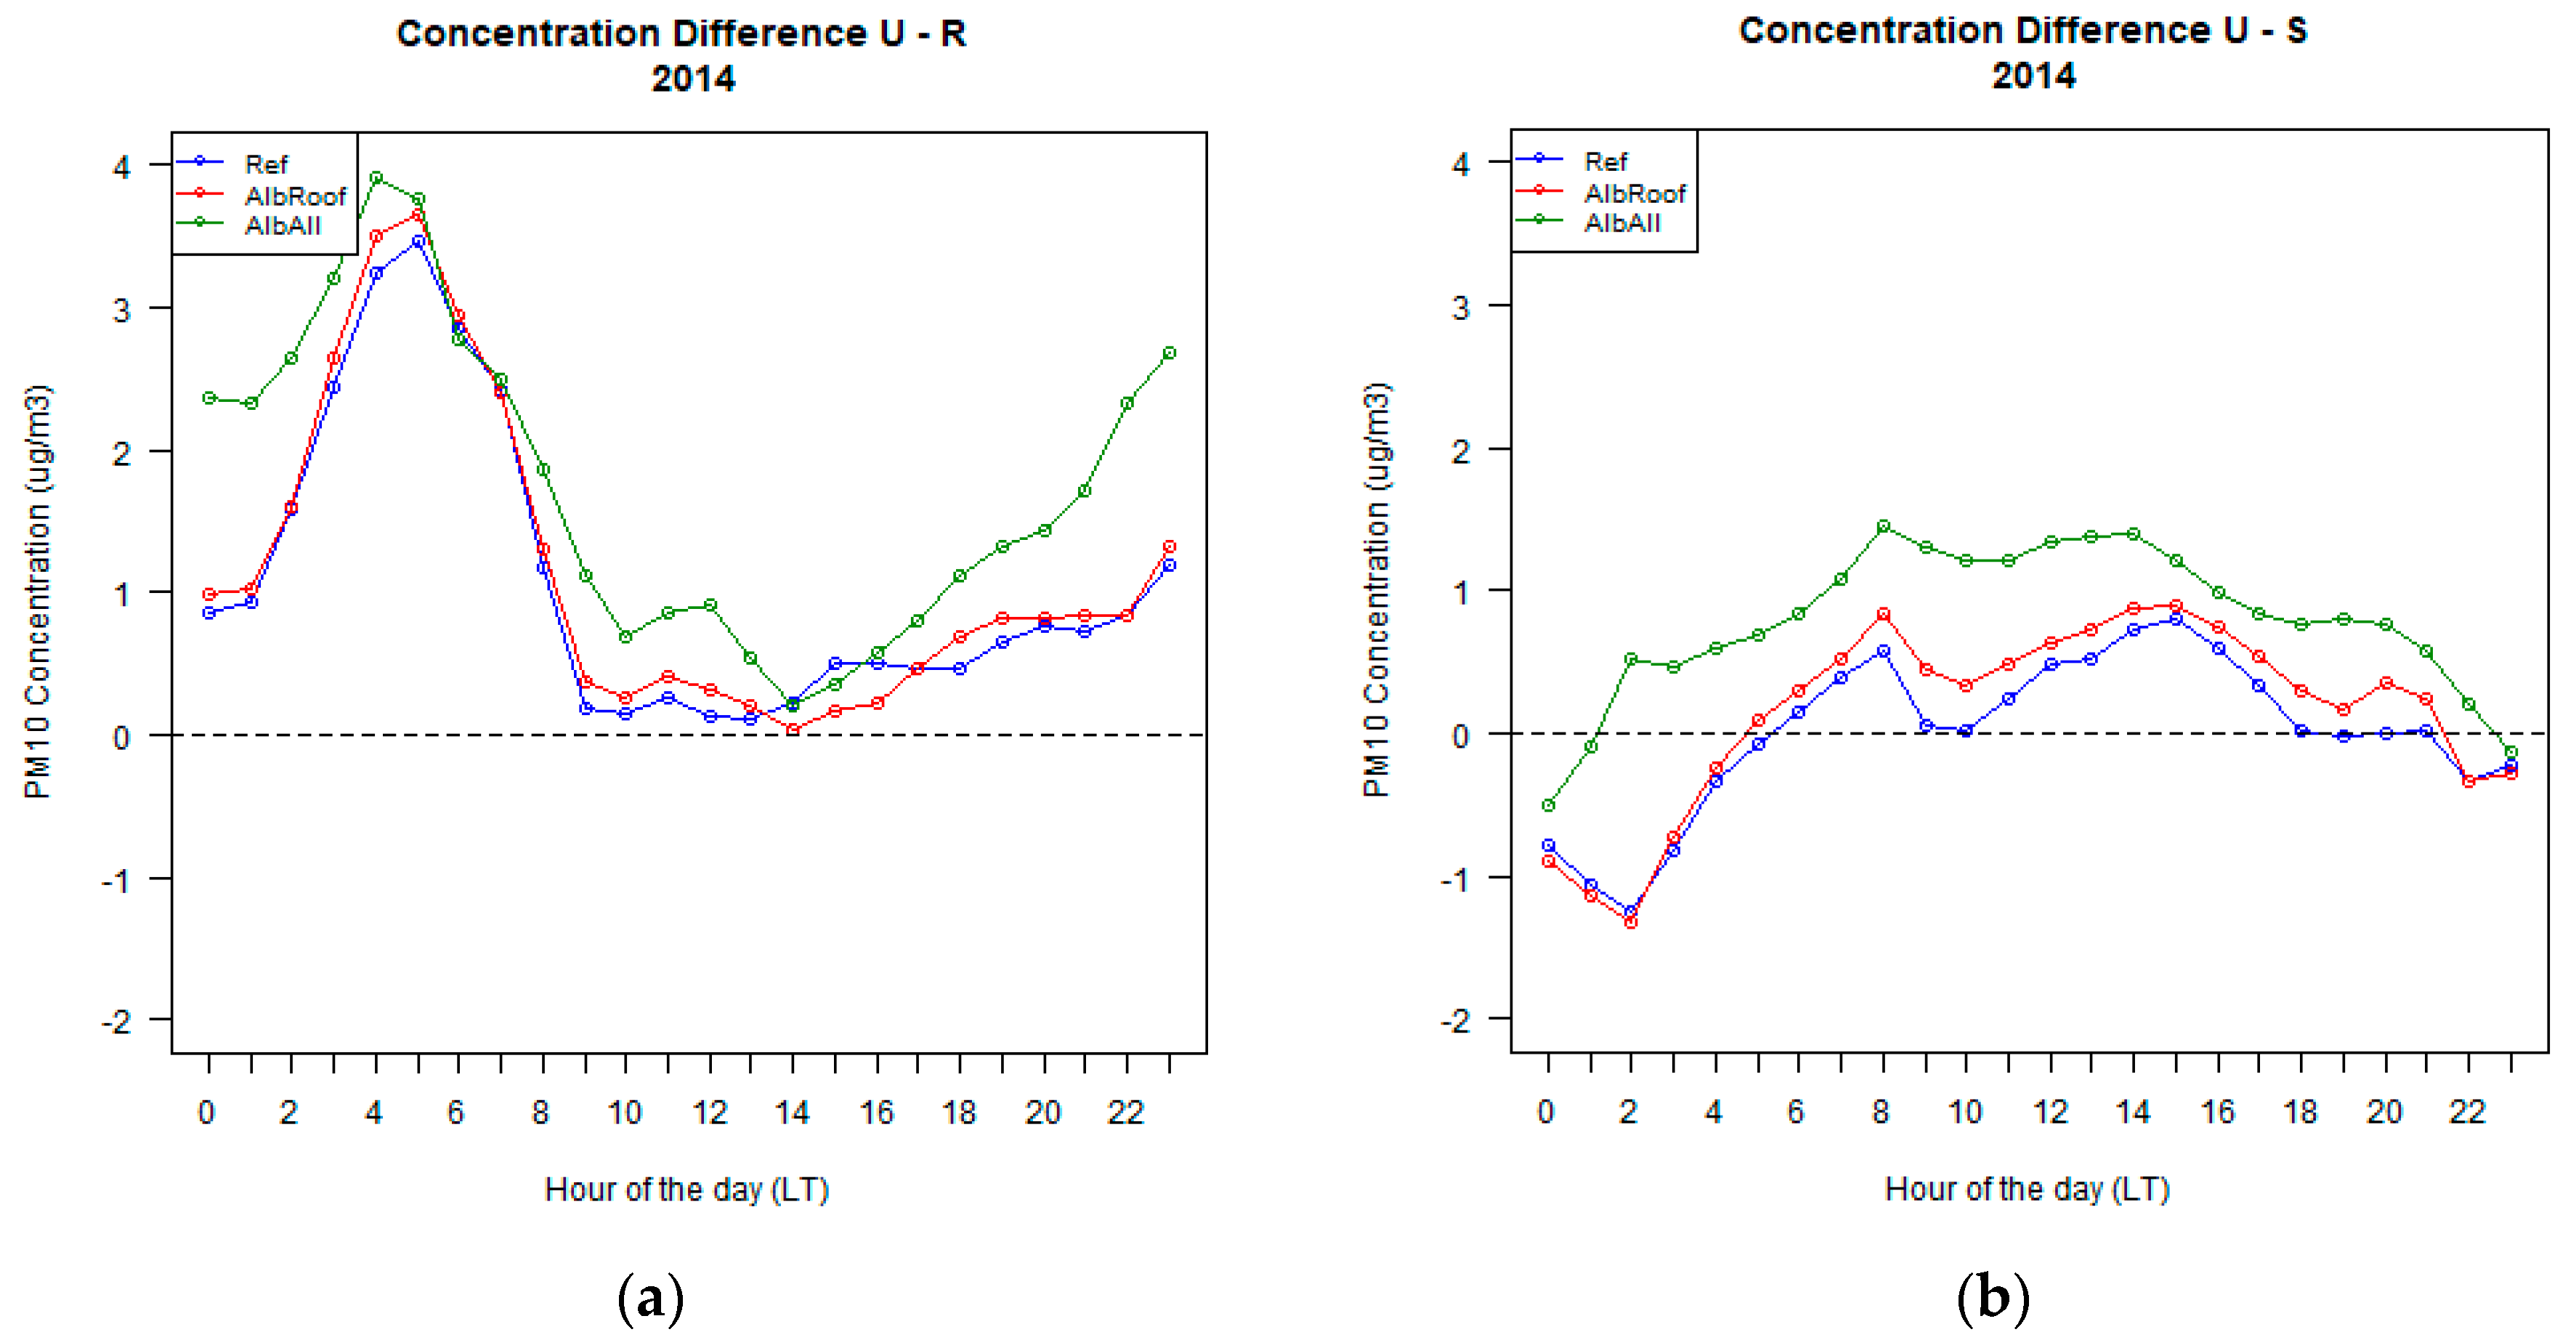
As a consequence of changes in meteorological factors, there is an increase in the levels of average PM10 throughout the day. As observed for wind speed in
Figure 6, the effect of the highly reflective materials is particularly notable for the AlbAll case, for which we calculated an increase in the PM10 concentration difference up to a factor of more than 2 in
Figure 7a during the nighttime. In the AlbRoof case, the difference with the Ref case is practically negligible during the whole daily cycle and on the whole domain (
Figure 8). The daily cycle of the concentration difference always has positive values for the rural area, while the suburban one has negative values in the time range 22:00 LT–05:00 LT for Ref and AlbRoof cases and in the time range 23:00 LT–01:00 LT for the AllRoof case. The cycle of the urban–rural (U–R) difference is characterized by the lowest values in the central hours of the day (11:00 LT–15:00 LT) probably due to the increase in the height of the PBL and because of the mountain breeze that blows to the north bringing the pollution of the city to the rural areas at the foot of the Alps (
Figure 1b). For the same reason, the urban–suburban (U–S) concentration difference in this time range increased because the wind carries PM10 from the suburban area in the south-east of the domain towards the city. Also,
Figure 8 shows that the difference with the reference case is particularly evident for the AlbAll case, for which the area characterized by a higher concentration of PM10 is more extensive, especially at 00:00 LT and in the rural area to the north in the domain.
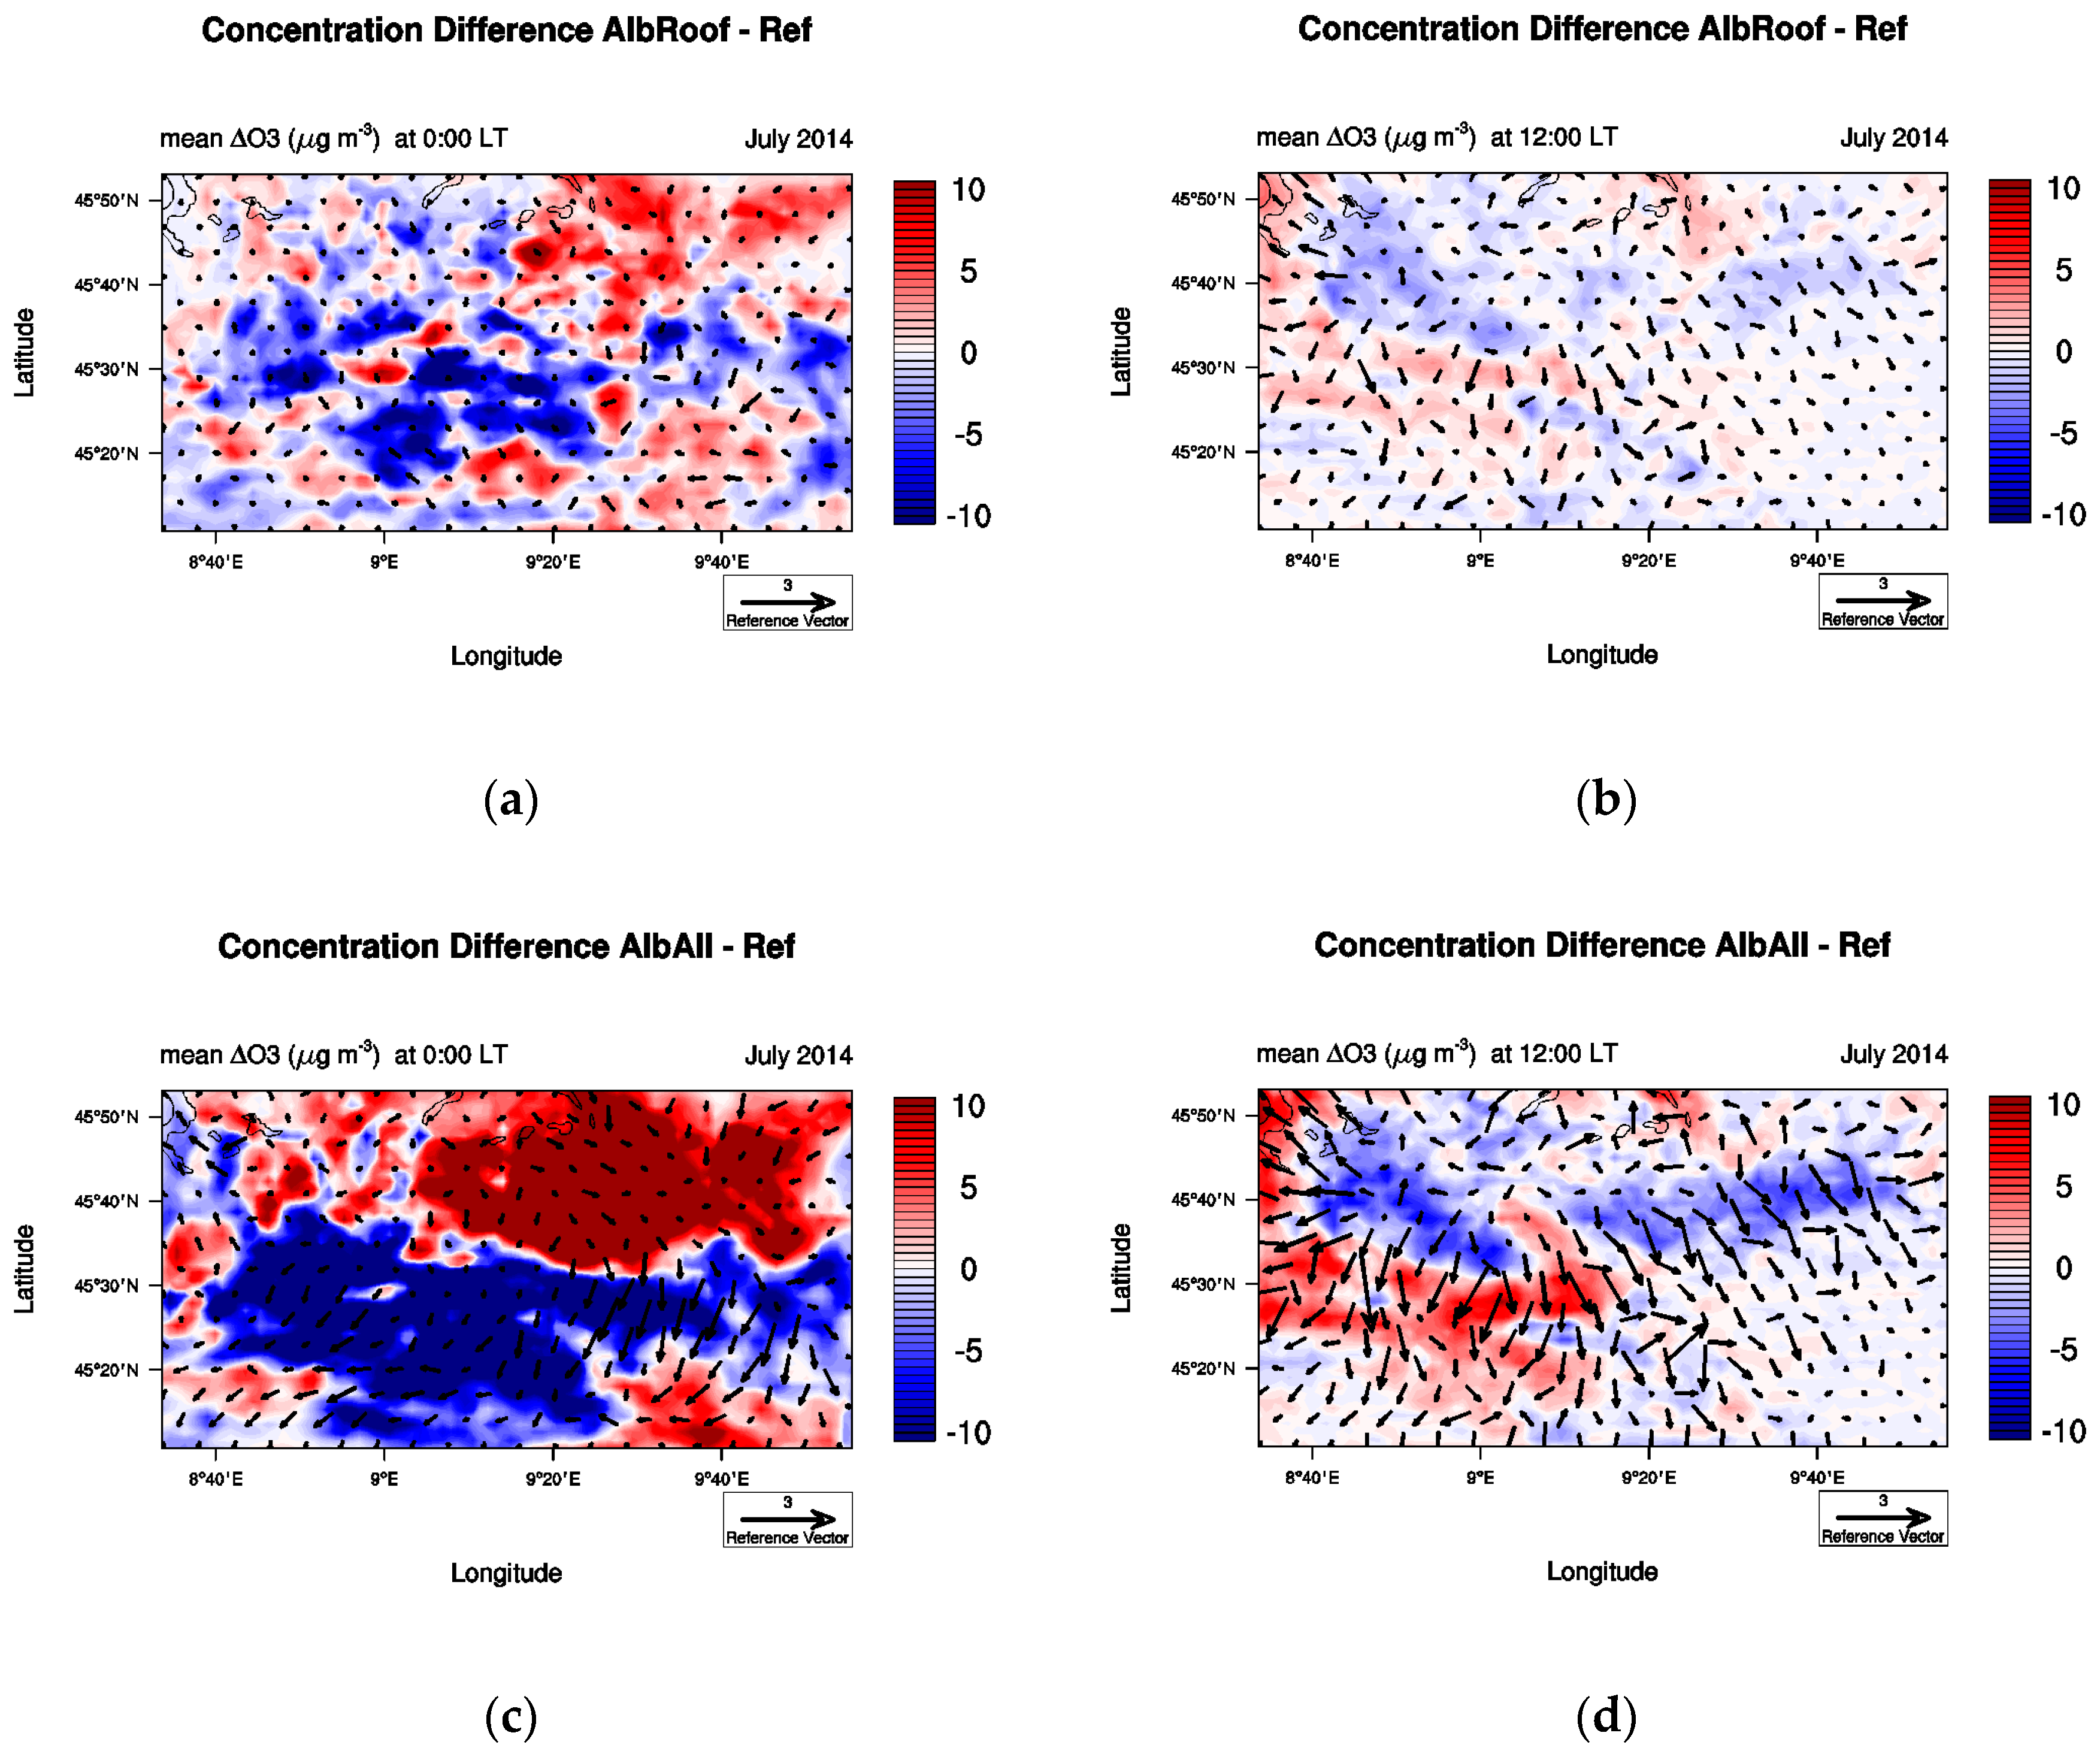
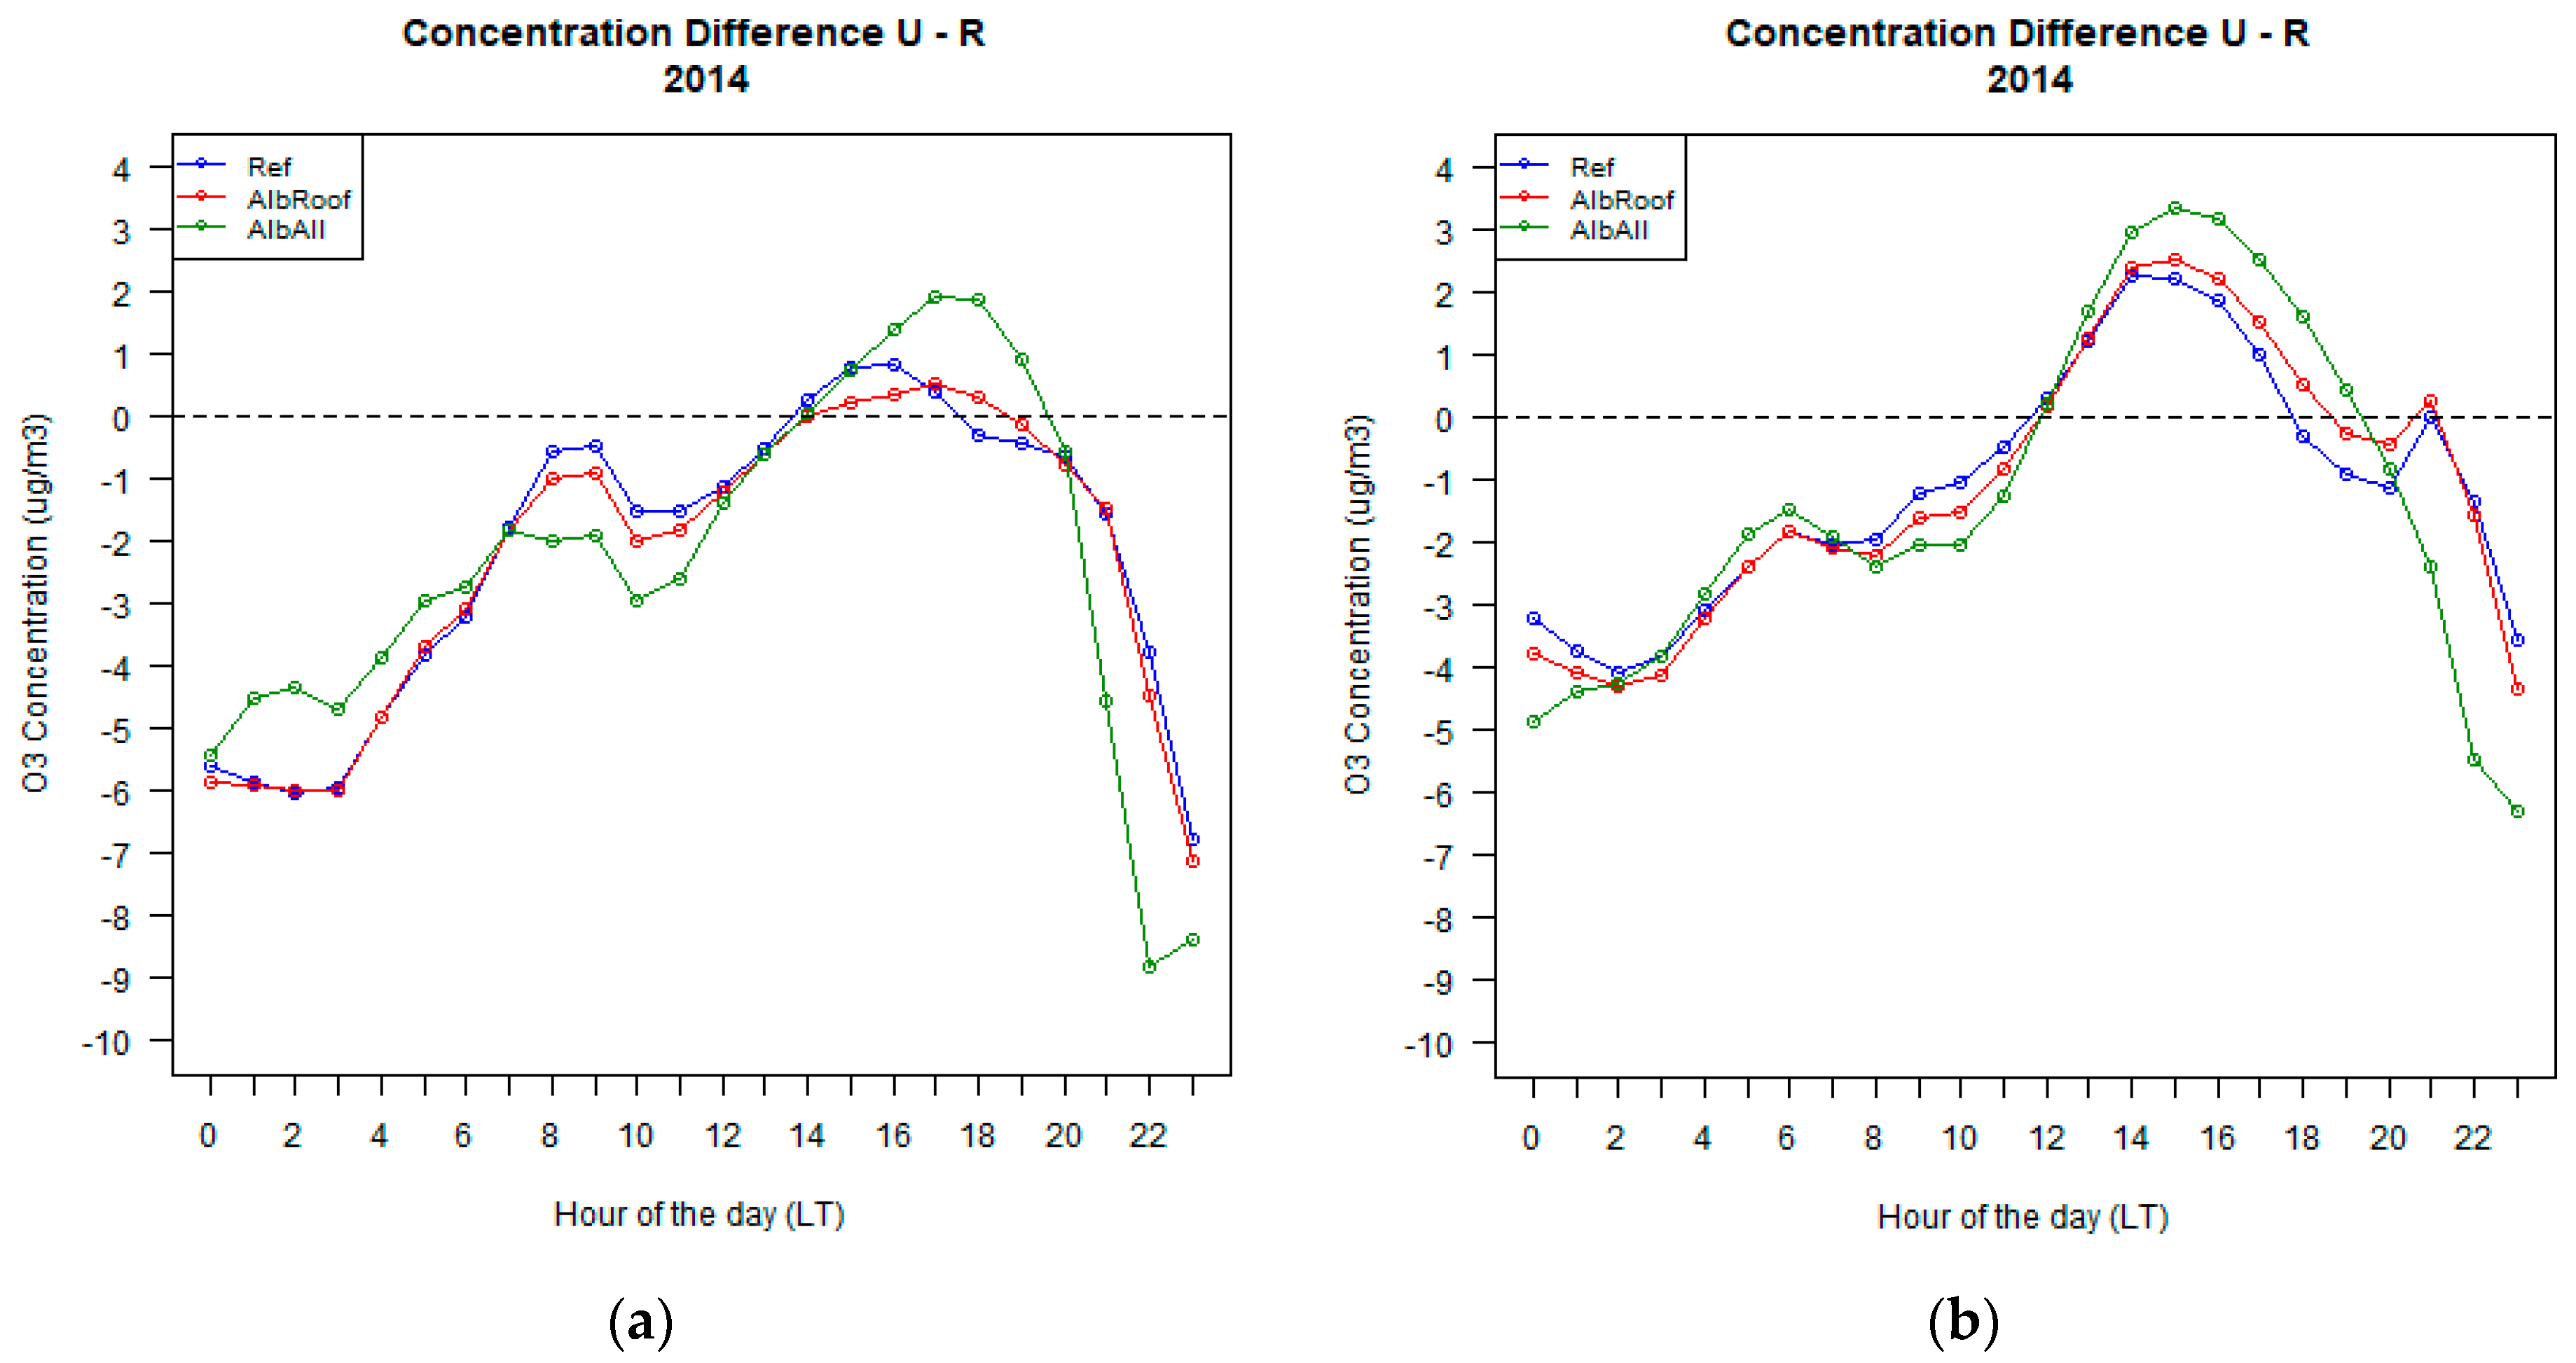
In the case of ozone, the effects of the use of highly reflective materials are not related only to the alteration of the PBL structure (i.e., lowering of the PBLH, reduction of the TKE). In fact, the increase in albedo of the urban surfaces causes a rise in the reflected short wave radiation which is one of the main driving agents in the production of tropospheric ozone.
Figure 9 shows a clear increase in the ozone concentration difference between urban and non-urban areas for the AlbRoof and AlbAlltest cases compared to the reference case in the central hours of the day. This concentration difference is positive from 12:00 LT to 19:00 LT for both the rural and the suburban areas, while in the rest of the day the concentration difference is negative because of the ozone depletion caused by NOx occurring in the absence of solar radiation in the urban area which brings ozone levels to lower values than the surrounding areas. The effect of ozone titration in the urban area during the nighttime is evident in
Figure 10a and particularly in
Figure 10c for the AlbAll case which is characterized by the highest concentration of NO
2 during the nighttime (shown in
Supplementary Material).
As observed for PM10 and PM25, the wind velocity field (valley- and urban-breeze circulations) plays an important role for the advection of the O
3 precursors (NO
2 in
Figures S4 and S5 in the Supplementary Material and for the transport of O
3-rich air masses, as highlighted by [
9].
4. Conclusions
This study provides a first evaluation of strategic choices for a healthier city of Milan in the context of climate change adaptation and mitigation. Here, we investigated the effect of the use of highly reflective materials covering urban surfaces on meteorology and air quality (especially on ozone and PM10) in the metropolitan area of Milan, an important Italian city located in the Po Valley which is considered a “hot spot” for pollution in Europe. The results of the numerical experiments, carried out with the numerical WRF-CHIMERE tool, showed the benefit that the use of these materials leads to a reduction in UHI intensity, that is, the ambient temperature in the urban area. As expected, changes with respect to the Ref case are more evident in the test case characterized by increased albedo values on all urban surfaces (roofs, walls, streets) (label AlbAll), compared to the test case in which albedo is changed only for roofs (label AlbRoof).
With the introduction of highly reflective materials, we observed a reduction in UHI intensity up to 1.5 °C for the AlbAll case both in the rural and suburban areas. UHI intensity even becomes negative during some hours of the morning in the AlbAllcase. Also, PBL height demonstrated a progressive reduction from AlbRoof to AlbAll test cases and, like UHI intensity, it has negative values in the AlbAll case. The wind speed is always lower in the urban area than the rural and suburban areas and, due to the increase in albedo, wind speed values further decrease in the urban area. The surface roughness, different for the three land use categories (mixed forests for rural, croplands for suburban and urban), plays a significant role.
Results showed negative effects of the use of high albedo materials covering urban surfaces on the concentration of pollutants such as ozone and PM10, due to the modification of the PBL structure; in fact, the reduction of the PBL height, of wind speed and of the turbulent kinetic energy, affects the transport and dispersion of pollutants. For PM10, we observed an increase in the urban–rural concentration difference up to a factor of more than 2 during nighttime. In the case of ozone, the use of high albedo materials causes the reflection of a greater amount of short wave radiation that contributes to the photochemical formation of ozone.
In the Po valley, wind speed is influenced by both valley- and urban-breeze circulations as highlighted in this work. Here, we did not specifically investigate the interaction between the circulation associated to the UHI and that associated with the mountain-valley. Given the crucial role that the wind has on air quality in this geographical area, a future study aimed at analyzing such a local dynamic would be appropriate.
We did not take into account the reduction of emissions that can be noted as a consequence of the reduction of the temperature in the urban environment (e.g., for a lower use of air conditioners). Therefore, a possible future development of this work could take into account the reduction in emissions due to the lowering of the ambient temperature.
Furthermore, since we considered a relatively cool year (2014) (as specified in
Section 2), we plan to develop this study by examining a year characterized by an urban heat wave (e.g., 2015). Moreover, a subsequent analysis may focus on a winter period.


