1. Introduction
Speeding—i.e., driving at a speed above the posted speed limit—is considered to be one of the most important risk factors in road safety [
1,
2]. Numerous research studies show that excessive speed increases the risk of getting involved in a crash as well as the severity of the crash outcome [
3,
4,
5]. The National Highway Traffic Safety Administration (NHTSA) [
6] found that speeding was a contributing factor in 30% of fatal crashes in the United States in 2012, resulting in 10,219 lives lost in speed-related crashes. As in other European countries, in Belgium speeding is the most common road traffic violation. Given the negative impact of speeding on road safety, e.g. [
5], reducing the number of speed violations is an important priority. Speed enforcement is one measure that contributes to reaching this goal.
Overall, current studies on the effectiveness of speed enforcement reveal the positive effects of speed enforcement in terms of speeding behaviour as well as road safety outcomes e.g., [
5,
7], and more specifically of the use of mobile radars in stationary controls [
8,
9]. Based on a review of several studies, Thomas et al. [
10] conclude that the effects of covert, mobile speed enforcement programs varies from a 20% to 25% reduction in the number of daytime casualty crashes. Furthermore, several studies show the effect of enforcement activities on vehicle speed. For example, Champness et al. [
11] report a reduction of 6 km/h in the average speed during the time that mobile overt speed cameras were operational on 100 km/h highways. A review conducted by Elliot and Broughton [
12] shows, for studies examining the effect of stationary and visible enforcement, a general reduction of 4.8 km/h in the mean speed. For stationary and hidden enforcement, the reduction in the average speed varies between 1 and 2.4 km/h. With regard to more preventative methods used by police, several studies report the positive effects of digital signs alongside the road in terms of a reduction in the travelled speed [
13,
14,
15]. For example Walter & Broughton [
14] report a decrease in the average speed of 2.25 km/h (or 1.4 mph) when speed indicator devices were in place (on a 30 mph road section).
In this study, we aim to develop greater insight into the effect of a temporary combination of both methods, namely a speed control combined with different types of signage alongside the road. Studies that examine certain combinations are limited [
16] and only few studies provide a well-documented overview of the study design which can influence the presented results, e.g., [
9,
17]. In a study by Woo et al. [
18], speed-monitoring displays coupled with enforcement cameras downstream were found to be an effective approach. However the study design in this research differs as we test a more temporary combination of methods. Generally, a combination of a repressive enforcement method (which includes deterring and fining drivers for speeding, e.g., speed control) with the usage of signs alongside the road has been found to be more effective given the fact that (digital) signage raises the visibility of the enforcement activities [
8,
16]. Furthermore, the use of (digital) signage creates a more generalized deterrent effect, as it informs all passing drivers and therefore influences drivers’ perceived risk of being caught for speeding. Research in Queensland, Australia, found that more visible enforcement raises self-compliance and creates longer-lasting effects on behavior [
19].
Speeding is also in Belgium an important problem and therefore three territorial police units that participated in this research spent a lot of effort and resources on tackling this problem in their area in order to improve the road safety level. Given the fact that currently a scientific evaluation of the effect of frequently used speed enforcement methods is missing, the regional police units are interested in learning more about this in order to improve their strategy.
3. Results
In this section we present the measured effects of the three tested field set-ups (or strategies), each tested by one regional police unit. For each evaluated set-up we first present the overall effect during and after the intervention period in terms of the described indicators. Secondly, we show for each field setup the results of analyzing possible differences in effect between tested variations (e.g., speed control with or without the use of signage).
3.1. Regional Police Unit 1
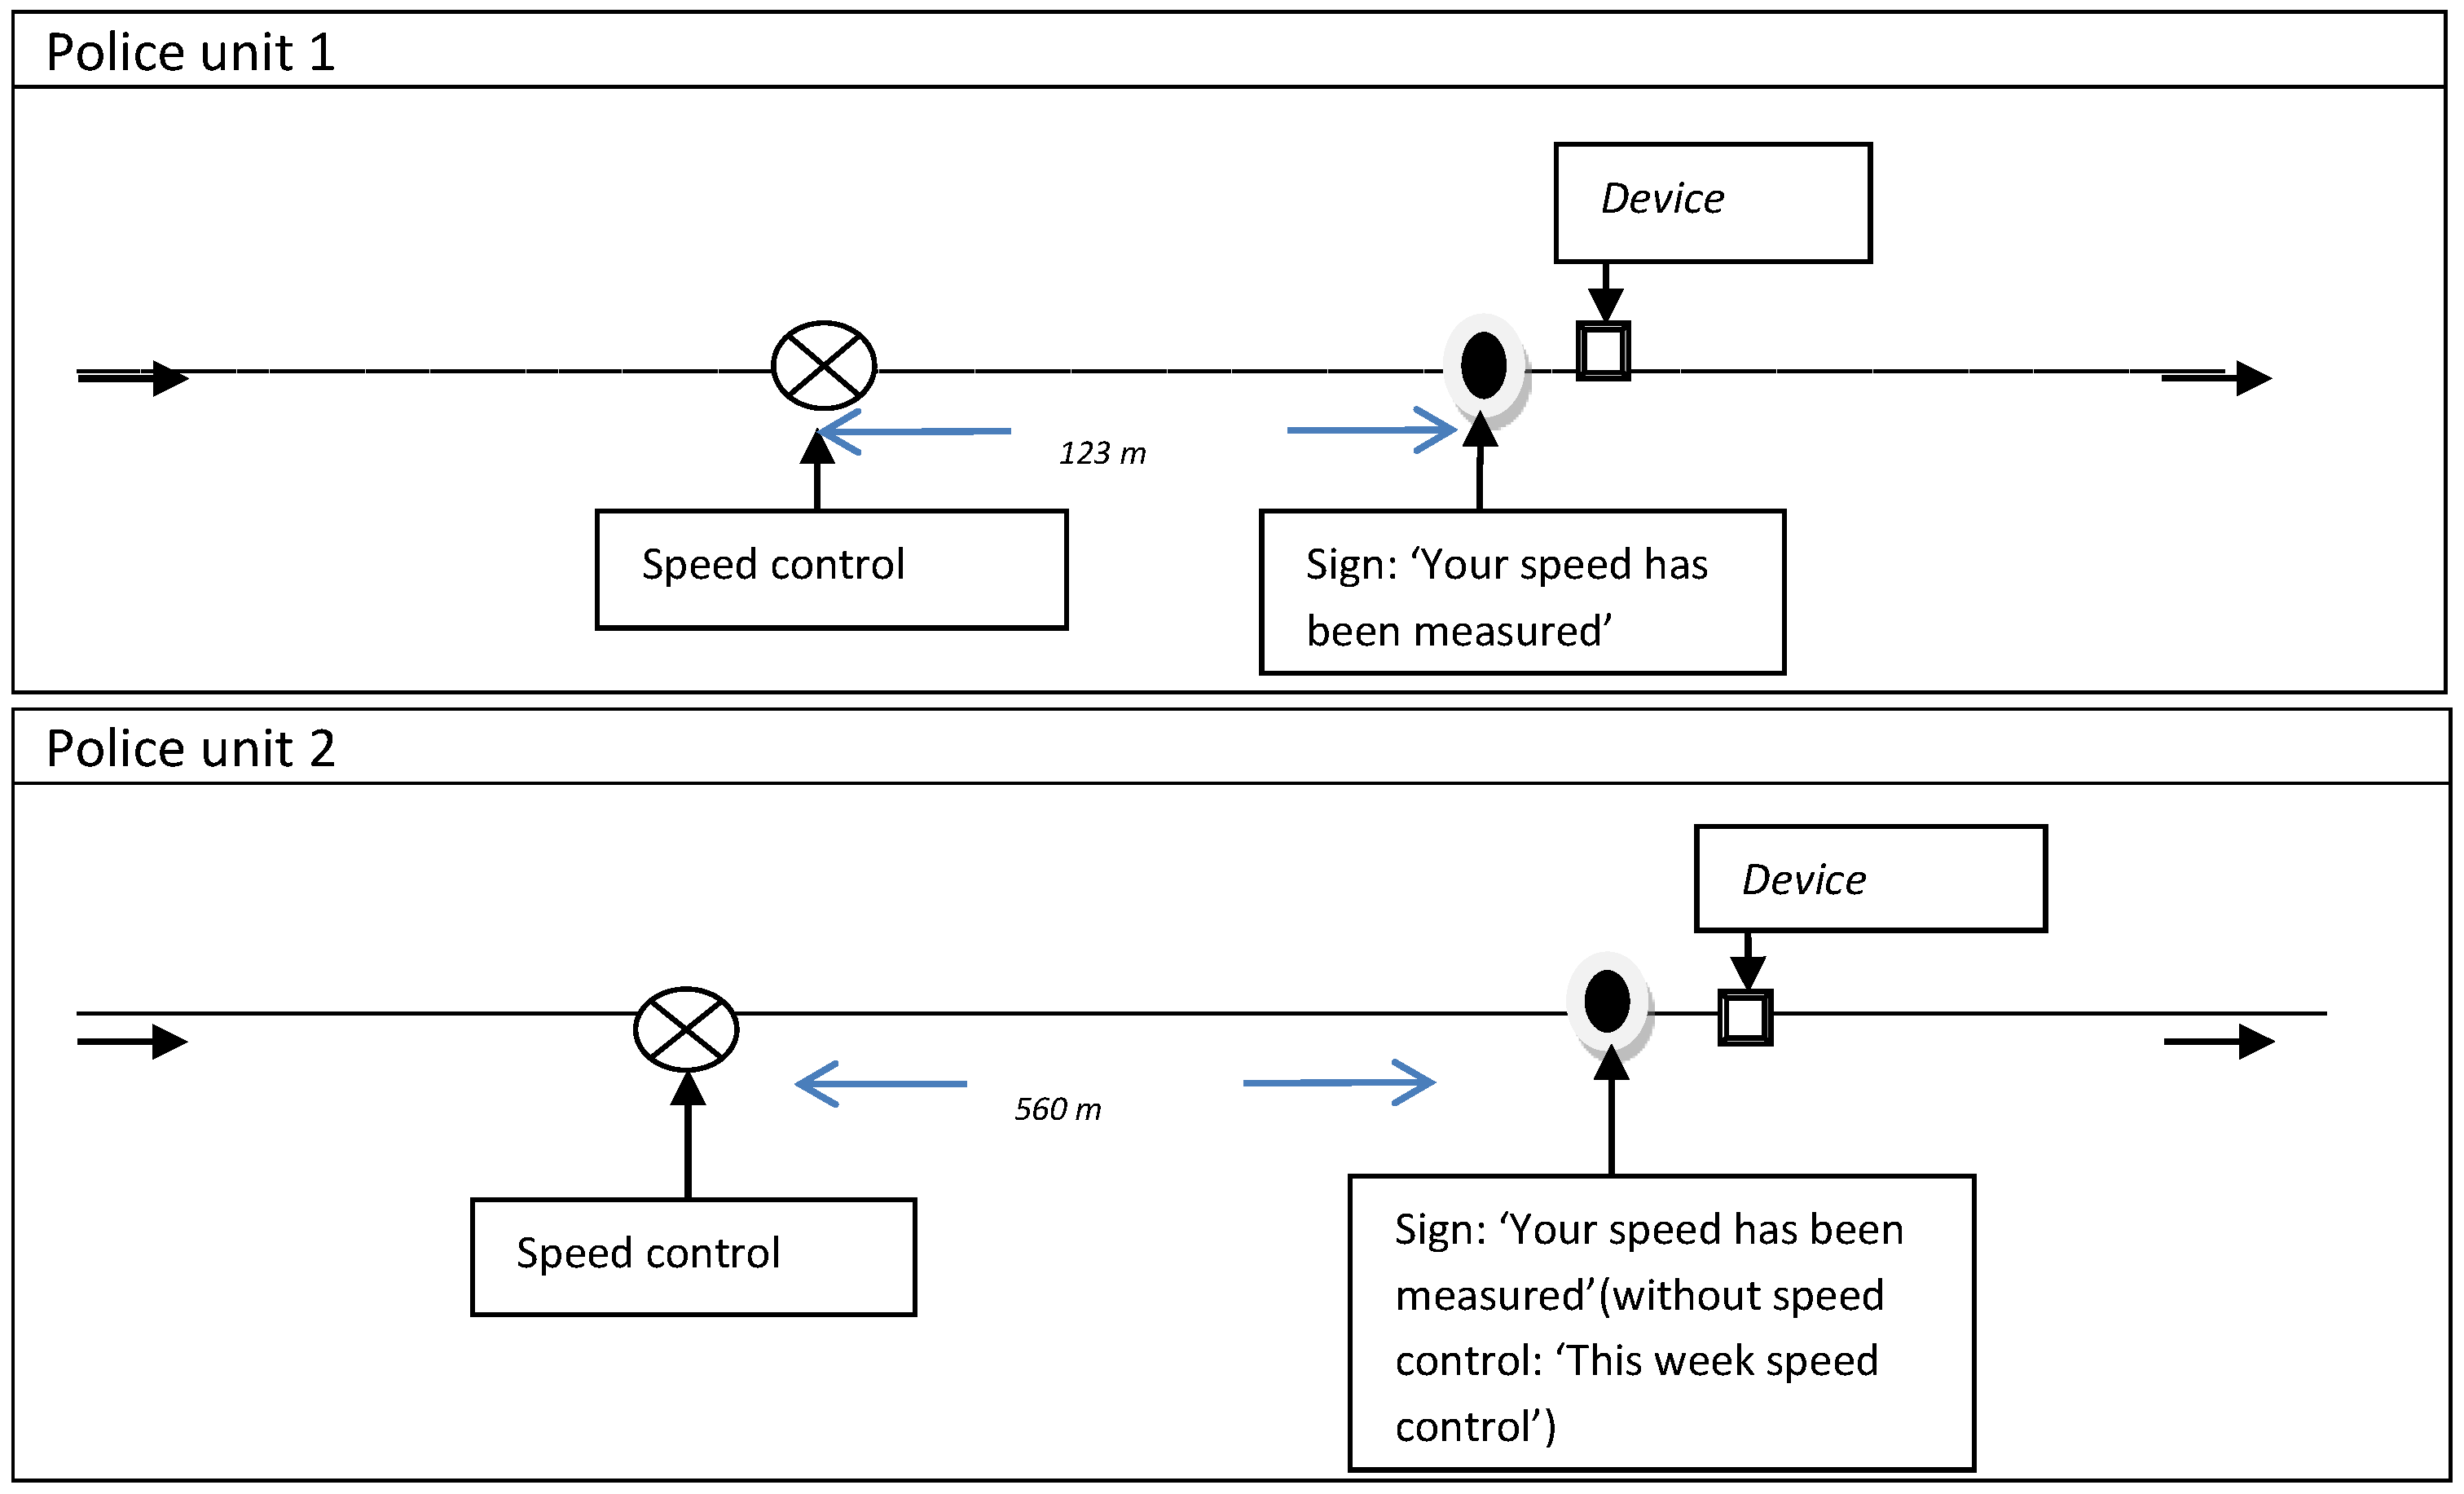
Police unit 1 tested a speed control that was combined with a simple, static display that was placed after the control during some of the scheduled time frames (see
Figure 1). The overall effect of the intervention is presented in
Table 3. Statistically significant effects were noted with the asterisk * (95% confidence interval).
The above table shows significantly lower values for all outcome indicators during the intervention (all significant at the 0.05 level). For example, the average speed drops by 5.85 km/h and the speed level at which 85% of drivers travel declines by 7 km/h. The ratio of the probability that drivers exceed the speed limit and the probability that drivers do not exceed the speed limit (odds) decreased (by 67%) during the enforcement activities. One week after the intervention had ceased, speed indicator values again reached their initial level and are even slightly higher (compared to before) for which no real explanation could be found. Two and three weeks after enforcement we do see lower speed levels compared to the before period, but it is unlikely that this is related to the previous enforcement activities.
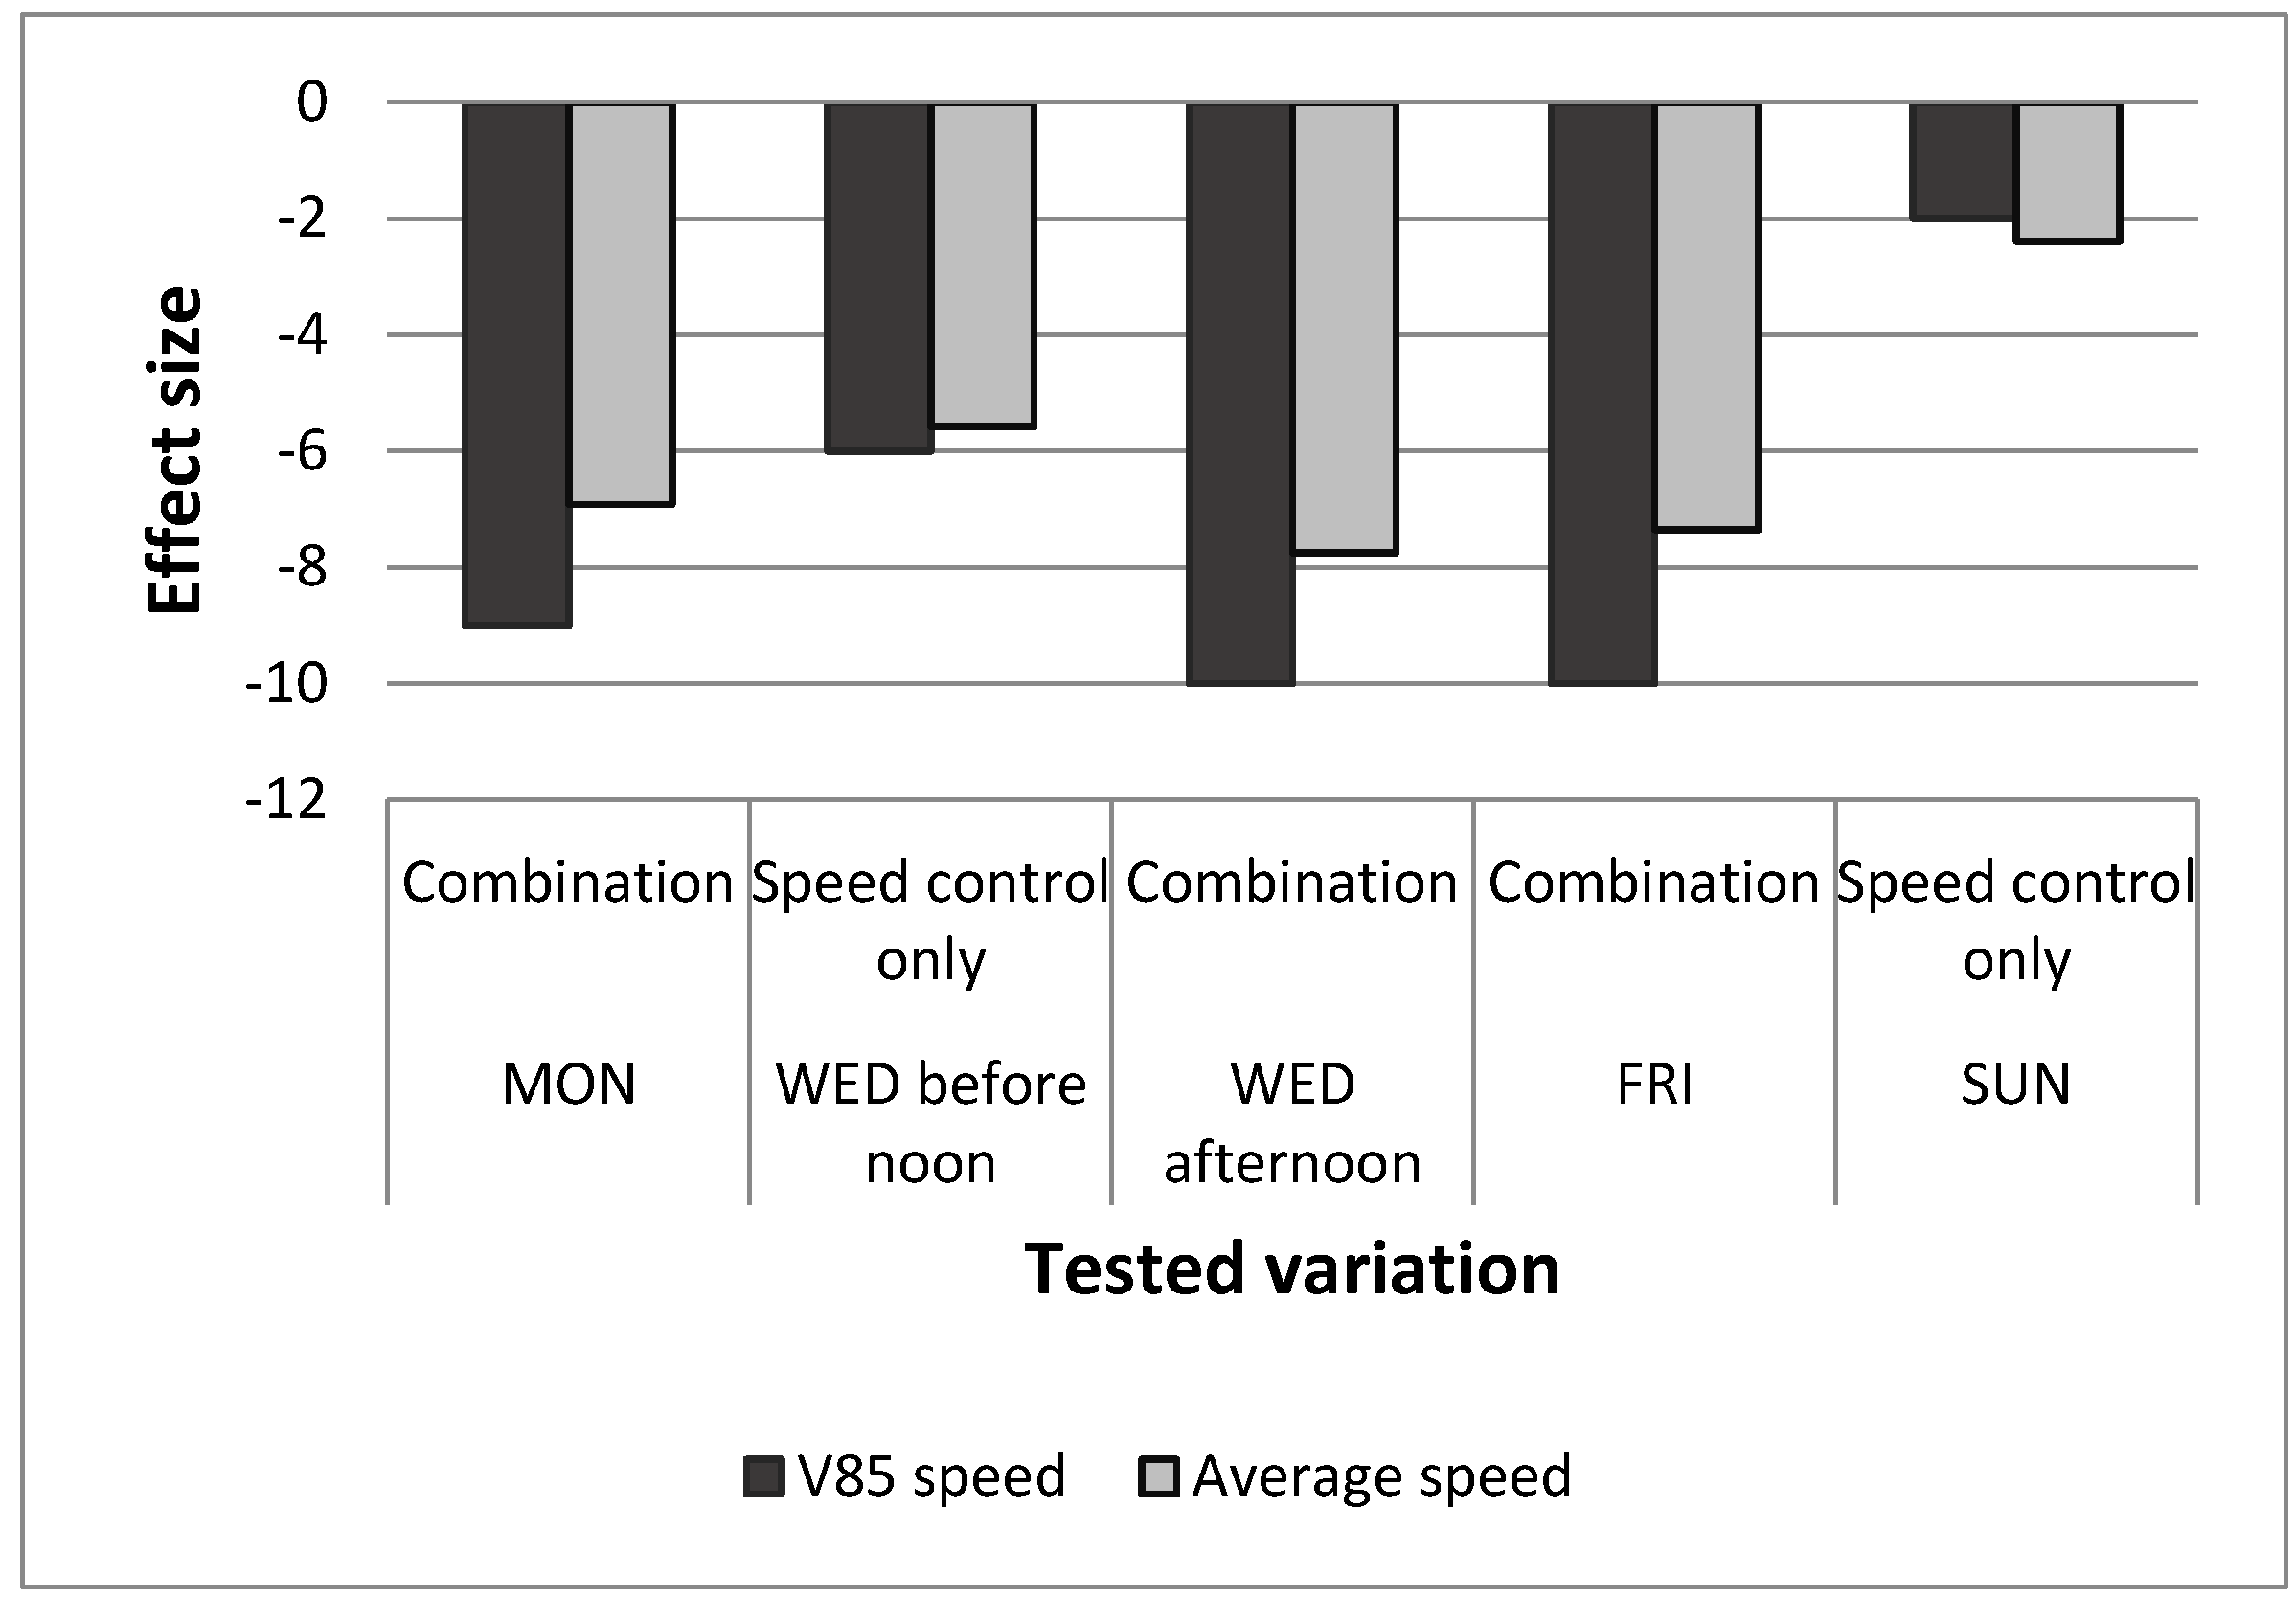
Figure 3 shows for both tested variations (speed control with or without the static display) the absolute effect on the V85 speed and average speed (during vs. before).
Statistical analysis shows that for both variations the reductions in average speed (−3.65 km/h for the speed control only and −7.34 km/h for the combination) are statistically significant. Based on the regression model (GLM) we conclude that the effect of the combination is significantly higher than the effect of the speed control only.
3.2. Regional Police Unit 2
In regional police area 2, the effects of a speed control, a digital sign (message ‘this week speed control’) and a combination of the speed control followed by the digital sign (message ‘your speed was measured’) were tested (
Figure 1).
Table 4 shows a high speeding problem on the selected road segment. This might to some extent be affected by a small descending slope in the road.
Overall, all indicator values decrease significantly during the tested field set-up (noted with the asterisk *) but the values for the average speed and 85th percentile of speed are still above the legal speed limit. The share of drivers exceeding the speed limit is (roughly) halved and the proportion of serious offences dropped to approximately 3%. The ratio of the probability that drivers exceed the speed limit and the probability that drivers do not exceed the speed limit (odds) decreased by 74% during the intervention period. Three weeks after the activities had been withdrawn, speed levels gradually increase but are still slightly lower than initially. This indicates the existence of a “time halo effect”. Given the high speed levels, these effects found in time are however small and the statistically significant relationship found is mainly due to the large number of observations (making the analysis more sensitive) [
25] (e.g., the Cohen’s d values vary between 0.1 and 0.2 when comparing the after period with the before period).
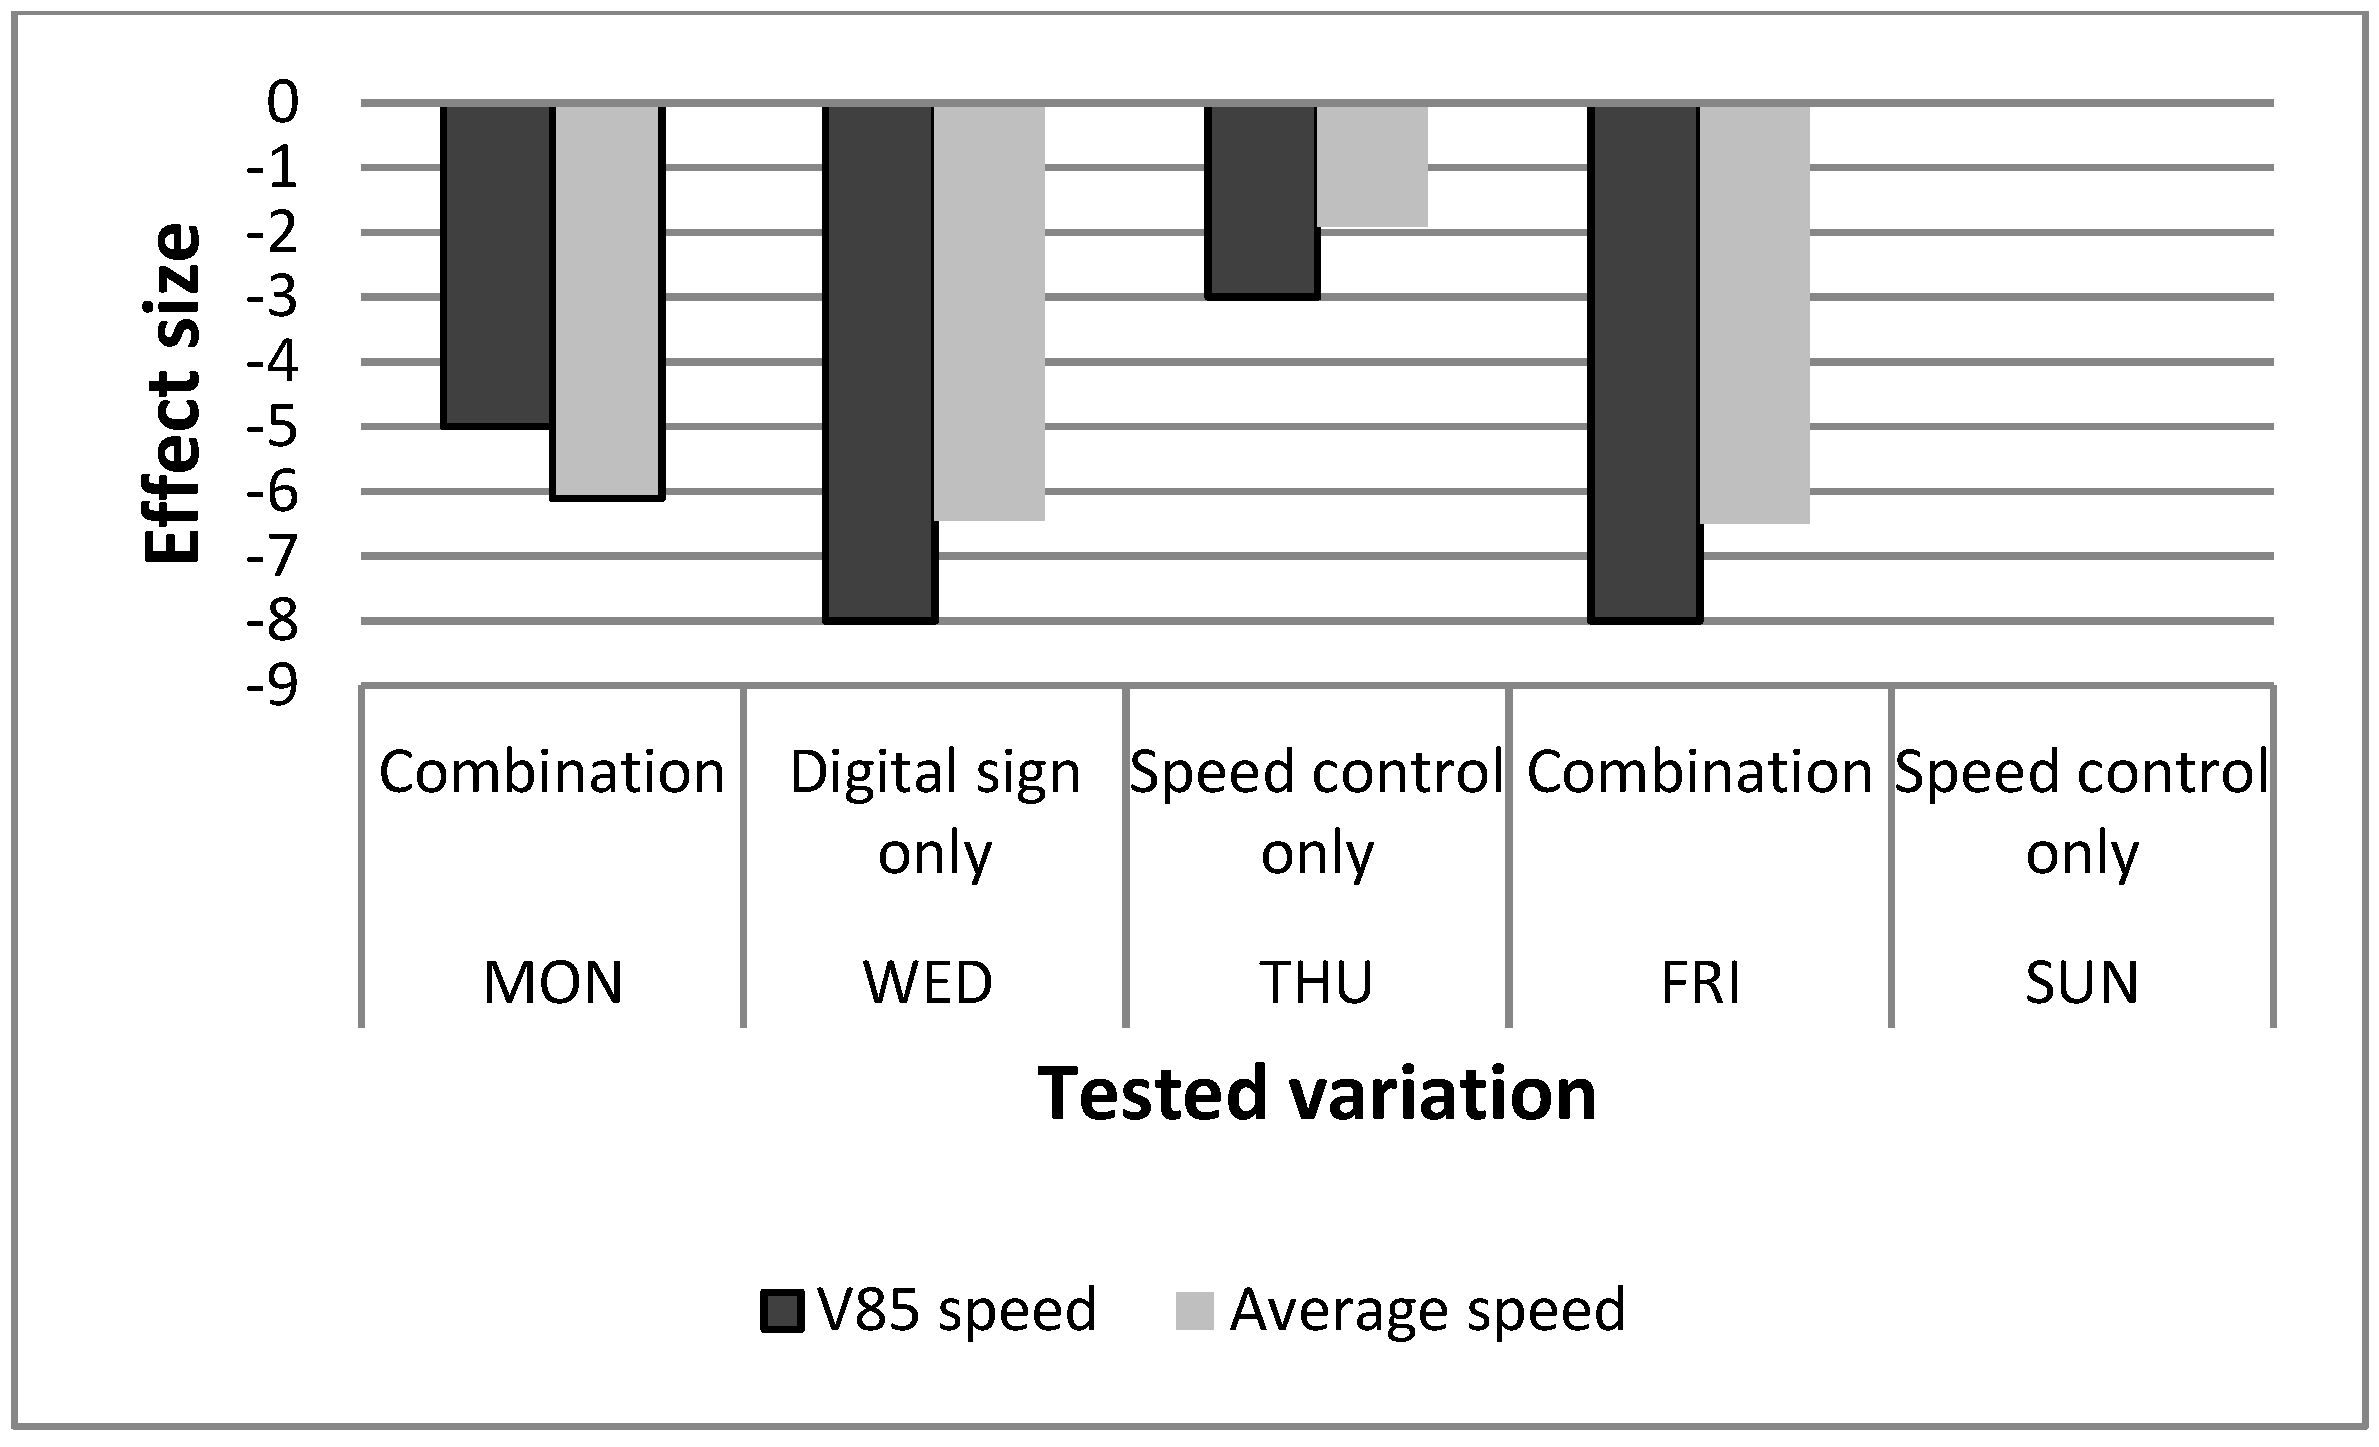
Figure 4 shows differences in the effect found for the tested variations (speed control only, digital sign only and combination of both) (during vs. before).
The size of the effect on average speed was larger for the combination (−6.27 km/h) as well as for the digital sign only (−6.45 km/h). The small difference measured in terms of the effect on the average speed for these variations was not significant (by interpreting the interaction effect β3 in the GLM). There was also a significant effect of the speed control only that was significantly lower compared to the other variations.
3.3. Regional Police Unit 3
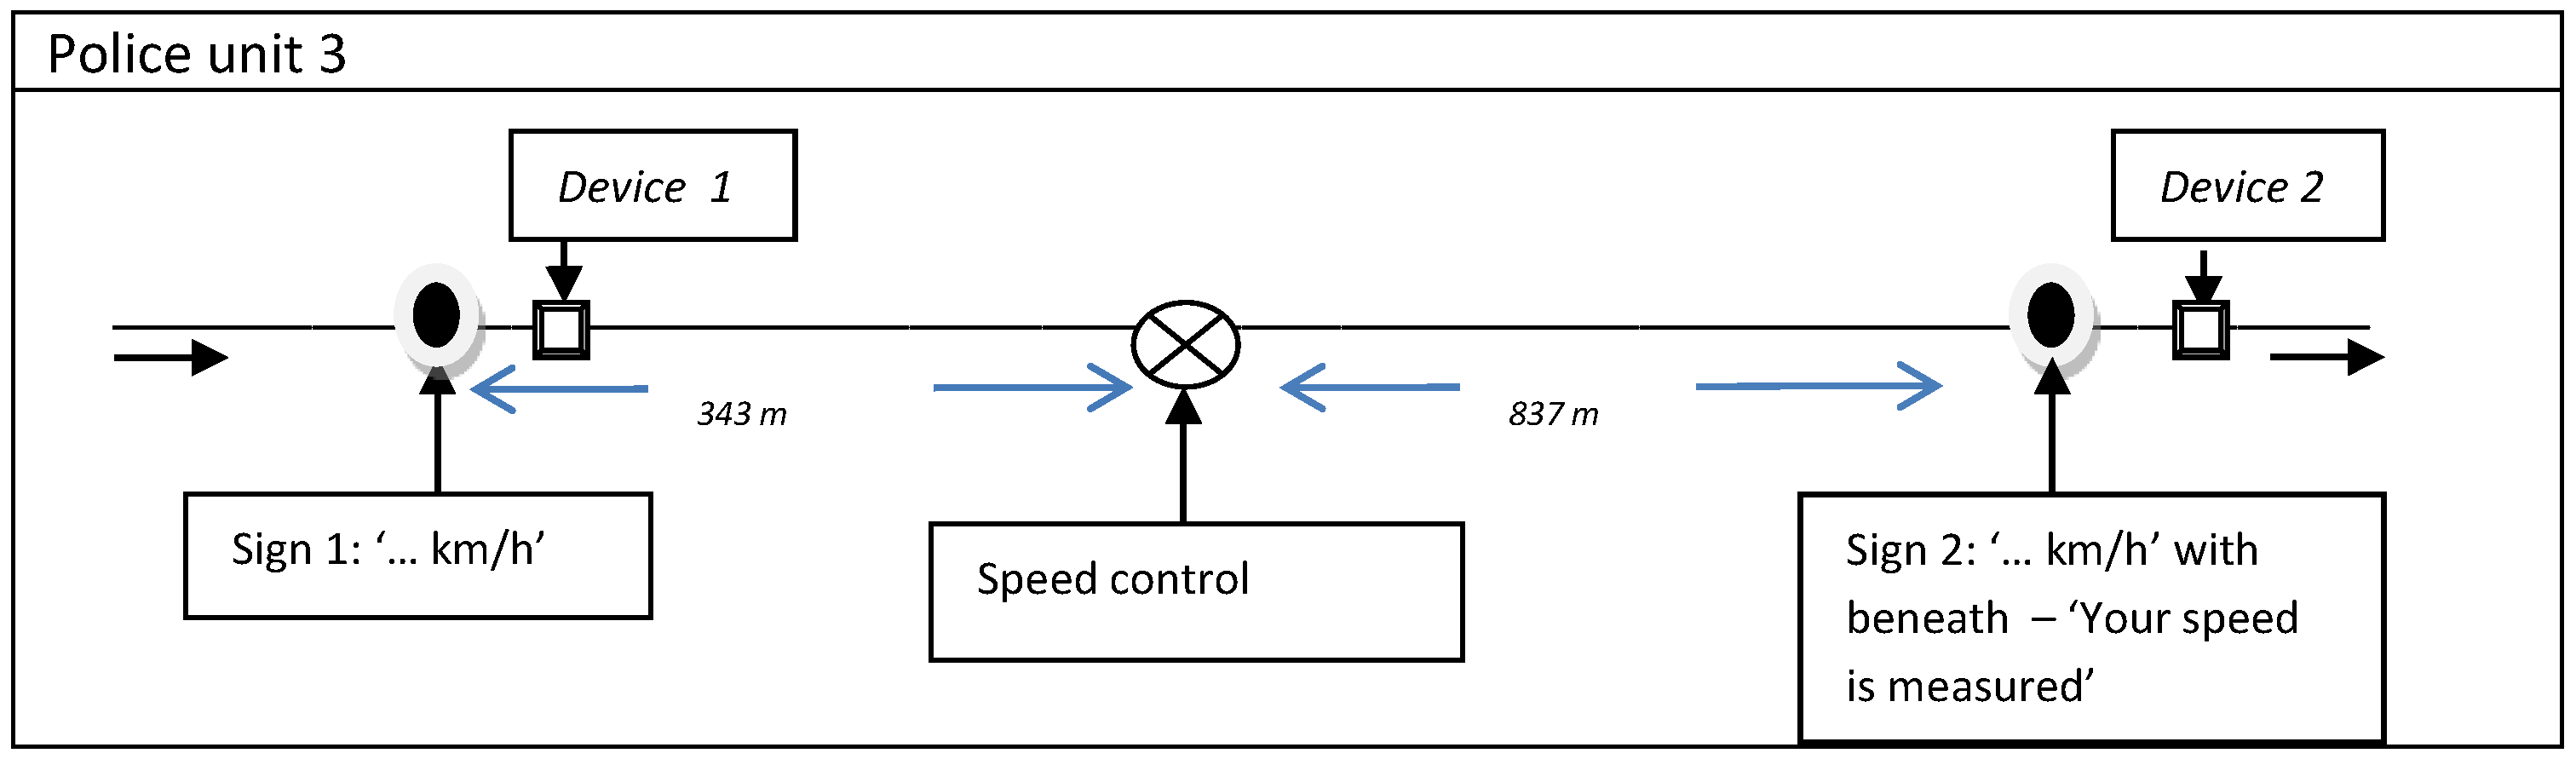
As shown in
Figure 1 on the experimental road section in police area 3 the use of two digital signs, with speed control taking place in between the two signs during two time frames, was tested. The first speed display sign displayed the travelled speed and was active during the entire intervention week. The second speed display sign (“...km/h and below “Your speed was measured”) was activated later that week and placed further along the road section (see
Table 2).
Table 5 shows the effect found at the first measurement point. The asterisk * implies the statistical significance of the effect.
During the week that the speed display was active, it can be observed that the average speed reached a level below the legal speed limit of 70 km/h and the proportion of drivers exceeding the speed limit decreased by 9.8%. Furthermore, the proportion of serious offences was halved and the odds of drivers exceeding the speed limit declined by 48%. After the digital sign was removed, speed indicators again reached their initial values.
In contrast to the signage used in the other police areas, the speed displays in police unit 3 were active during day and night. Despite a significant larger effect during the night—e.g., the percentage of speed offenders was significantly reduced from 38.57% to 26.28% (−12.29%) compared to a significant reduction from 17.70% to 8.04% (−9.66%) during the day—the speeding problem remains higher during the nighttime. With regard to the day of the week, we see a slightly lower effect in speed reduction on Friday and during the weekend. This might imply that some drivers were surprised by the digital sign at the beginning of the week but were getting used to the sign being there and did not pay any more attention to it towards the end of the week (‘novelty effect’). On the other hand, it is possible that the composition of the driver population is different during the weekend and these drivers are less attentive or reactive towards these signage.
In
Table 6 the effects measured at the second measurement point can be observed for the time period during which the second sign was active (Thursday–Sunday, see
Table 2).
The table above shows a significant reduction in all considered speed outcome indicators during the period the second digital sign was active. This even with a speeding problem that is limited (compared to the first measurement point). Looking at the table it can be observed that the proportion of serious offences declined by 3.08%. In accordance with the findings for measurement point one, no clear evidence of a ‘time halo effect’ could be derived from the data. When considering the speed at the second measurement point earlier in the intervention week (Monday–Wednesday, not displayed in the table above), a small reduction was found in the average speed by 0.98 km/h and in the percentage of speed offenders by 1.30% (both significant at the 95% confidence level). Given the fact that the second sign was not yet active, this small effect could be explained by the fact that a large number of drivers passed the first sign and consequently still lowered their speed levels over a distance away from that first speed display (‘distance halo effect’). Another explanation could be the influence of the physical presence of the sign even though it was not active.
Also for the second digital sign, the size of the effect during nighttime was significantly larger than during the day but the speeding problem remained higher during the night. For the proportion of speed offenders we see for example a reduction from 17.07% to 12.03% during the night and from 3.32% to only 0.38% during the day (both statistically significant). No difference in effect size was found according to day of the week (Thursday–Sunday).
Finally, we also examined the specific time frames during which speed control took place in between both measurement points. Based on
Table 7, we conclude that the effects measured at both measurement points were larger when the speed control was in place (during vs. before).
For measurement point one, the difference on Wednesday (−4.26 km/h) is remarkable given the fact that drivers did not yet pass the speed control. Possibly drivers were alerted by vehicles coming from the other direction (e.g., by flashing one’s lights). For measurement point two, the effect found on Wednesday could be a distance halo effect given the fact that the second sign was not active at the time. We do note that these time frames are too limited to draw general conclusions.
4. Discussion
4.1. Synthesis of Findings
This study examined the speed reduction effects of three field set-ups, which all included the testing of several variations of a speed control with the use of signage alongside a pre-examined road section with a speed limit of 70 km/h. In accordance to previous studies e.g., [
7,
8], the tested speed interventions show positive effects in terms of speeding behavior. Examining the global effect shows that all tested set-ups reach the goal of significantly reducing the speed level during the intervention period. Reductions in terms of the average speed and the V85 speed were similar in police area 1 and 2, where both set-ups included a speed control followed by signage. The tested field set-up in regional police area 3—involving the use of two signs and speed control between both signs—also showed decreases of these outcome indicators. The registered reductions were however lower compared to the other police areas. Even though significant reductions were reached during the intervention period, the speed level remains high on the experimental road in the second police area. We do see a large decline in the proportion of heavy speed offences, which is valuable given the fact that the crash risk increases exponentially as speed increases [
26] and the severity of the crash outcome is larger [
4]. Comparison of these established effects with related studies should be carried out with care, given the fact that few studies examine combinations of a repressive and preventative method, e.g., [
16] and studies differ in terms of study design, characteristics of the enforcement location, etc.
The goal of this study was also to determine if a certain ‘time halo effect’ could be found. A small continuing effect after enforcement activities had been withdrawn can be found for the tested set-up in regional police area 2. Besides the high speeding problem—which could make it more likely to find a small effect in time—the large size of the digital sign could have an influence (given the increased visibility). Repetition of the experiment could give more insight into this assumption.
In this study we also examined for each field setup possible differences in effect between the variations of interventions tested. In all cases results point out a higher effect for the speed control combined with signage alongside the road. Consequently we can conclude that in general the hypothesis based on previous research [
8,
16] is confirmed, showing a larger effect and clear added value of additionally using signage as supporting communication activity on the field. The fact that we do find a smaller, yet significant effect during the speed control only (in police area 1 and 2), implies that some drivers slow down when noticing a parked car alongside the road or possibly recognize the anonymous, unmarked car as a police vehicle. The current field set-ups did not allow the estimation of the effect for each separate intervention used in a particular field set-up, given the fact the multiple variations (e.g., speed control vs. combination) took place within the same intervention period. In other words, the current study design did not allow to test the hypothesis that the use of a preventive method will result in longer lasting effects after activities have been withdrawn [
8,
19].
4.2. Practical Implications
Based on this field experiment we listed following practical implications (to the police units):
- -
This study demonstrates the added value of combining a repressive speed method with a preventative method.
- -
There is a clear added value of using signage alongside the road in terms of speed reduction.
- -
To compare the effects across field set-ups we recommend repetition of the field experiment (see future research). When we look at the established effects in terms of extra costs of buying signage and cost and efforts to exploit it, we note that the static signage used in police unit 1 performs well in terms of effect vs. costs and efforts. The signage is simple to use given the fact that a police officer can set it up himself/herself, while the other tested signs were installed and checked (battery) by the logistics department of the police unit.
- -
Unfortunately, the lasting effects of the field set-ups were limited. Only in police area 2 was an effect in time found, which was possibly related to the large visibility of the signage. As mentioned, further research is needed to support this assumption.
- -
Given the fact that the speed level on the experimental road section in police area 2 remains high (even during police activities), tackling the speeding problem at that road section might require additional measures.
- -
Though a comparison according to the time of the day (day vs. night) was not the main purpose of this study, the tested field set-up in police unit 3 showed that speed displays also have positive effects during nighttime. During the night these speed displays possibly stand out more. The speed level, however, remains higher during the night as a) drivers generally estimate the risk of getting caught to be lower and b) traffic volumes are low.
The collaboration with the regional police revealed that they are in great need of this kind of information to shape their enforcement policy (in terms of planning and prioritizing speed enforcement activities). Combining scientific knowledge and practical knowledge was valuable. Police units were able to learn more about the effect of frequently used speed enforcement methods by means of an experimental set-up designed by researchers. Since they already apply these methods, limited additional efforts were necessary. For us as researchers, this collaboration was important as it allowed us to conduct an experiment in the real world taking into account the practical possibilities and limitations that come with it (e.g., limited space at the field to place large signage, the need to regularly check or replace the battery of the measurement equipment, etc.). Regular meetings were held to discuss and agree upon the design and the set-up and to interpret the results. Good communication between the researchers and police officers was essential to make sure that the experiment was carried out as planned.
4.3. Study Limitations
Looking at the study design and setup at the field, following limitations should be noted with regard to the findings of this study:
Due to a limited amount of measurement equipment, no speed measurements took place on a comparison road. This is a shortcoming of this study, given the fact that a control group can be useful to correct for general trends and influences such as other speed measures taken in the research period. Given the fact that all measurement periods are short (one week) and adjacent (see
Table 1), we do however expect a limited influence of such factors.
On each location a particular field set-up is tested. To compare the effect of the different field set-ups and enhance the generalizability of these results, replication of the field experiment is recommended. In a first phase, the selected field set-ups could be tested on the other experimental road sections. Also testing on a larger scale would contribute to the generalization of the research results.
The time frames during which variations were tested within a particular field set-up are limited. Testing these variations over a larger intervention period would be beneficial to exclude that these effects are purely a coincidence. Furthermore, measurement data do not provide insight into the observation and perception of drivers about the presence of speed interventions.
In each field set-up the measurement device was located right after the signage; for example, in police area 3 a measurement device was situated after each sign. The availability of an extra device in each police area would have been useful. For example, in police area 2, this could have given a better insight in the separate effect of the speed control.
Given these limitations, this experiment was mainly presented to the police units as a pilot which needs repetition to further explore these preliminary findings. Further cooperation between knowledge institutions and field practitioners is therefore advisable.
4.4. Future Research
Despite the fact that road sections with a speed limit of 70 km/h and similar infrastructural features were selected, comparison of the effect of each tested field set-up with different interventions remains limited (e.g., ‘which type of signage has more effect?’). As mentioned, repetition of this field experiment on a regular basis and larger scale is therefore recommended.
Furthermore, we identified the following research opportunities based on this study:
The use of automatic registration plate recognition could give some insight into traffic patterns and could also reveal whether or not frequently passing drivers become less attentive to the enforcement measure over time (‘novelty effect’). This assumes that the passing vehicles have one main driver.
To further examine the effect of signage, it would be interesting to stop drivers after passing the signage and question them with regard to the visibility of the sign, their recognition of the message displayed on the sign and their reaction to the message. That way, the effect of different messages using the same signage could be tested. The practicability of such a procedure conducted by police officers on the field should, however, be further investigated. Another methodology is the use of a driving simulation study.


