1. Introduction
Collisions between bicycles have not received much attention in the literature as compared to accidents that also involve motorised vehicles. However, due to under-reporting of bicycle accidents, they are likely to be underestimated in official statistics [
1]. Furthermore, as cycling becomes more popular and more bicycle path infrastructure is offered, safety on bicycle paths is expected to become increasingly important [
2].
From a methodological perspective, bicycle accident risk models—just as any other accident risk model—aim to explain the occurrence of accidents, usually with the help of explanatory variables. The variable with the most explanatory power therefore is traffic volume [
3]. The more traffic there is, the more accidents can be expected. However, this is a non-linear relationship [
3,
4,
5]. For example, Martin [
6] showed that for car accidents in which two or more vehicles are involved, the rate of accidents per road user increases with the number of road users. Jacobsen [
7], in contrast, describes the safety in numbers phenomenon, where the individual accident risk of a cyclist with a motorized vehicle declines with the number of bicyclists around. It is under debate whether this non-linear correlation is due to the adaptive behaviour of motorists or to differences in the infrastructure design of the compared locations [
8]. Greibe [
3] reports that the flow in accident risk models needs to be raised to a power, with power values typically ranging between 0.8 and 1.0 for urban roads. In accordance with the ‘safety in numbers’ phenomenon this results in a decreasing accident rate for increasing traffic volumes. Eenink, Reurings, Elvik, Cardoso, Wichert and Stefan [
4] report an even smaller power value of 0.32 for urban roads in the Netherlands. Usually, the models are calibrated with data by means of probabilistic methods such as logistic regression, Bayesian modelling, Markov chains or neural networks [
9,
10,
11]. Given that enough adequate calibration data for explanatory variables are available, accident prediction models can be highly accurate and can explain up to 60% of accidents [
3].
Analysis of the risk of bicycle-bicycle accidents is likely to be limited by data scarcity. In most cities, bicycle traffic flow data are incomplete or virtually non-existent [
12]. Other data sources such as voluntarily collected bicycle accident data exist, but are mostly restricted to sportive leisure cycling [
13]. Also, bicycle accidents statistics are characterised by severe under-reporting. Only a fraction of bicycle accidents that result in hospitalisation are reported to the police [
1,
14]. Minor accidents are even less likely to be included in official statistics [
15,
16]. Online platforms to collect voluntary reports on bicycle accidents or near misses have been developed recently [
17], but to date contain only few reports. In the case of such data scarcity, explanatory models on bicycle accidents are hard to calibrate and their predictive power is poor, especially for bicycle-bicycle accidents.
Scarcity of bicycle data is also true for the city of Salzburg, which serves as the test bed for the present study. The city administration provides data from six bicycle count stations, but there is no empirical data on the city-wide distribution of bicycle flows [
18]. Therefore, the prediction of bicycle accidents is expected to benefit from alternative modelling approaches that are less data-driven, although a caveat remains regarding potential biases in the police accident reports, which serve as validation data [
19].
Generally, agent-based modelling has gained popularity as an alternative approach in transport modelling [
20,
21,
22,
23,
24]. A major difference between agent-based models (ABM) and equation-based models is their bottom-up approach: bottom-up transport models are based on individual road participants that move and interact in a highly disaggregated representation of the road network. ABMs are rooted in complexity theory, which suggests that system-level patterns emerge from the rule-based interaction of individual entities [
25]. Traffic flows are not modelled by mathematical equations, but they emerge from the stepwise simulation of dynamic behaviour of individual road participants interacting on a spatially heterogeneous road network [
26]. Due to the fine spatial and temporal resolution of the simulation, ABMs cannot only simulate flows, but also individual encounters of two vehicles on a road network. For traffic safety research this is important, as an accident can only occur if the trajectories of two road participants cross. Each crossing trajectory is tagged as an encounter (passing, overtaking, or crossing). The relation between encounters and accidents has been used to study road safety based on interactions at the local scale [
27], e.g., at specific intersections [
28], roundabouts [
29], or in abstract traffic environments [
30]. However, to the best of our knowledge, simulated encounters have not been explored for their adequacy as exposure variables compared to conventionally used traffic flows for large networks on the scale of an entire city.
In this paper, we use an agent-based modelling approach to simulate two alternative spatio-temporal datasets to represent the populations at risk for bicycle-bicycle accidents: (1) bicycle traffic flows and (2) bicycle-bicycle encounters. We then compare the two simulated populations with accidents reported by the police. We hypothesise first that the number of bicycle-bicycle encounters is the true statistical population for accidents between bicyclists, which thus have a linear relationship with observed accidents; and second that flow volumes have a non-linear relationship with encounters and thus also have a non-linear relationship with observed accidents. The general idea is exemplified with an agent-based model that is first implemented in an abstract network graph and then applied to the city of Salzburg, Austria. A dataset of all bicycle accidents in the city of Salzburg that were reported to the police between the years 2002 and 2011 was available to test the hypotheses.
2. Methods
2.1. Overall Approach
Bicycle traffic flows and respective encounter points were simulated by means of the Agent-based Bicycle Traffic Model that has been successfully applied to the city of Salzburg [
18]. For this research, the existing model was extended to not only compute cyclist counts per time (flows), but also to record points at which cyclists meet (encounters).
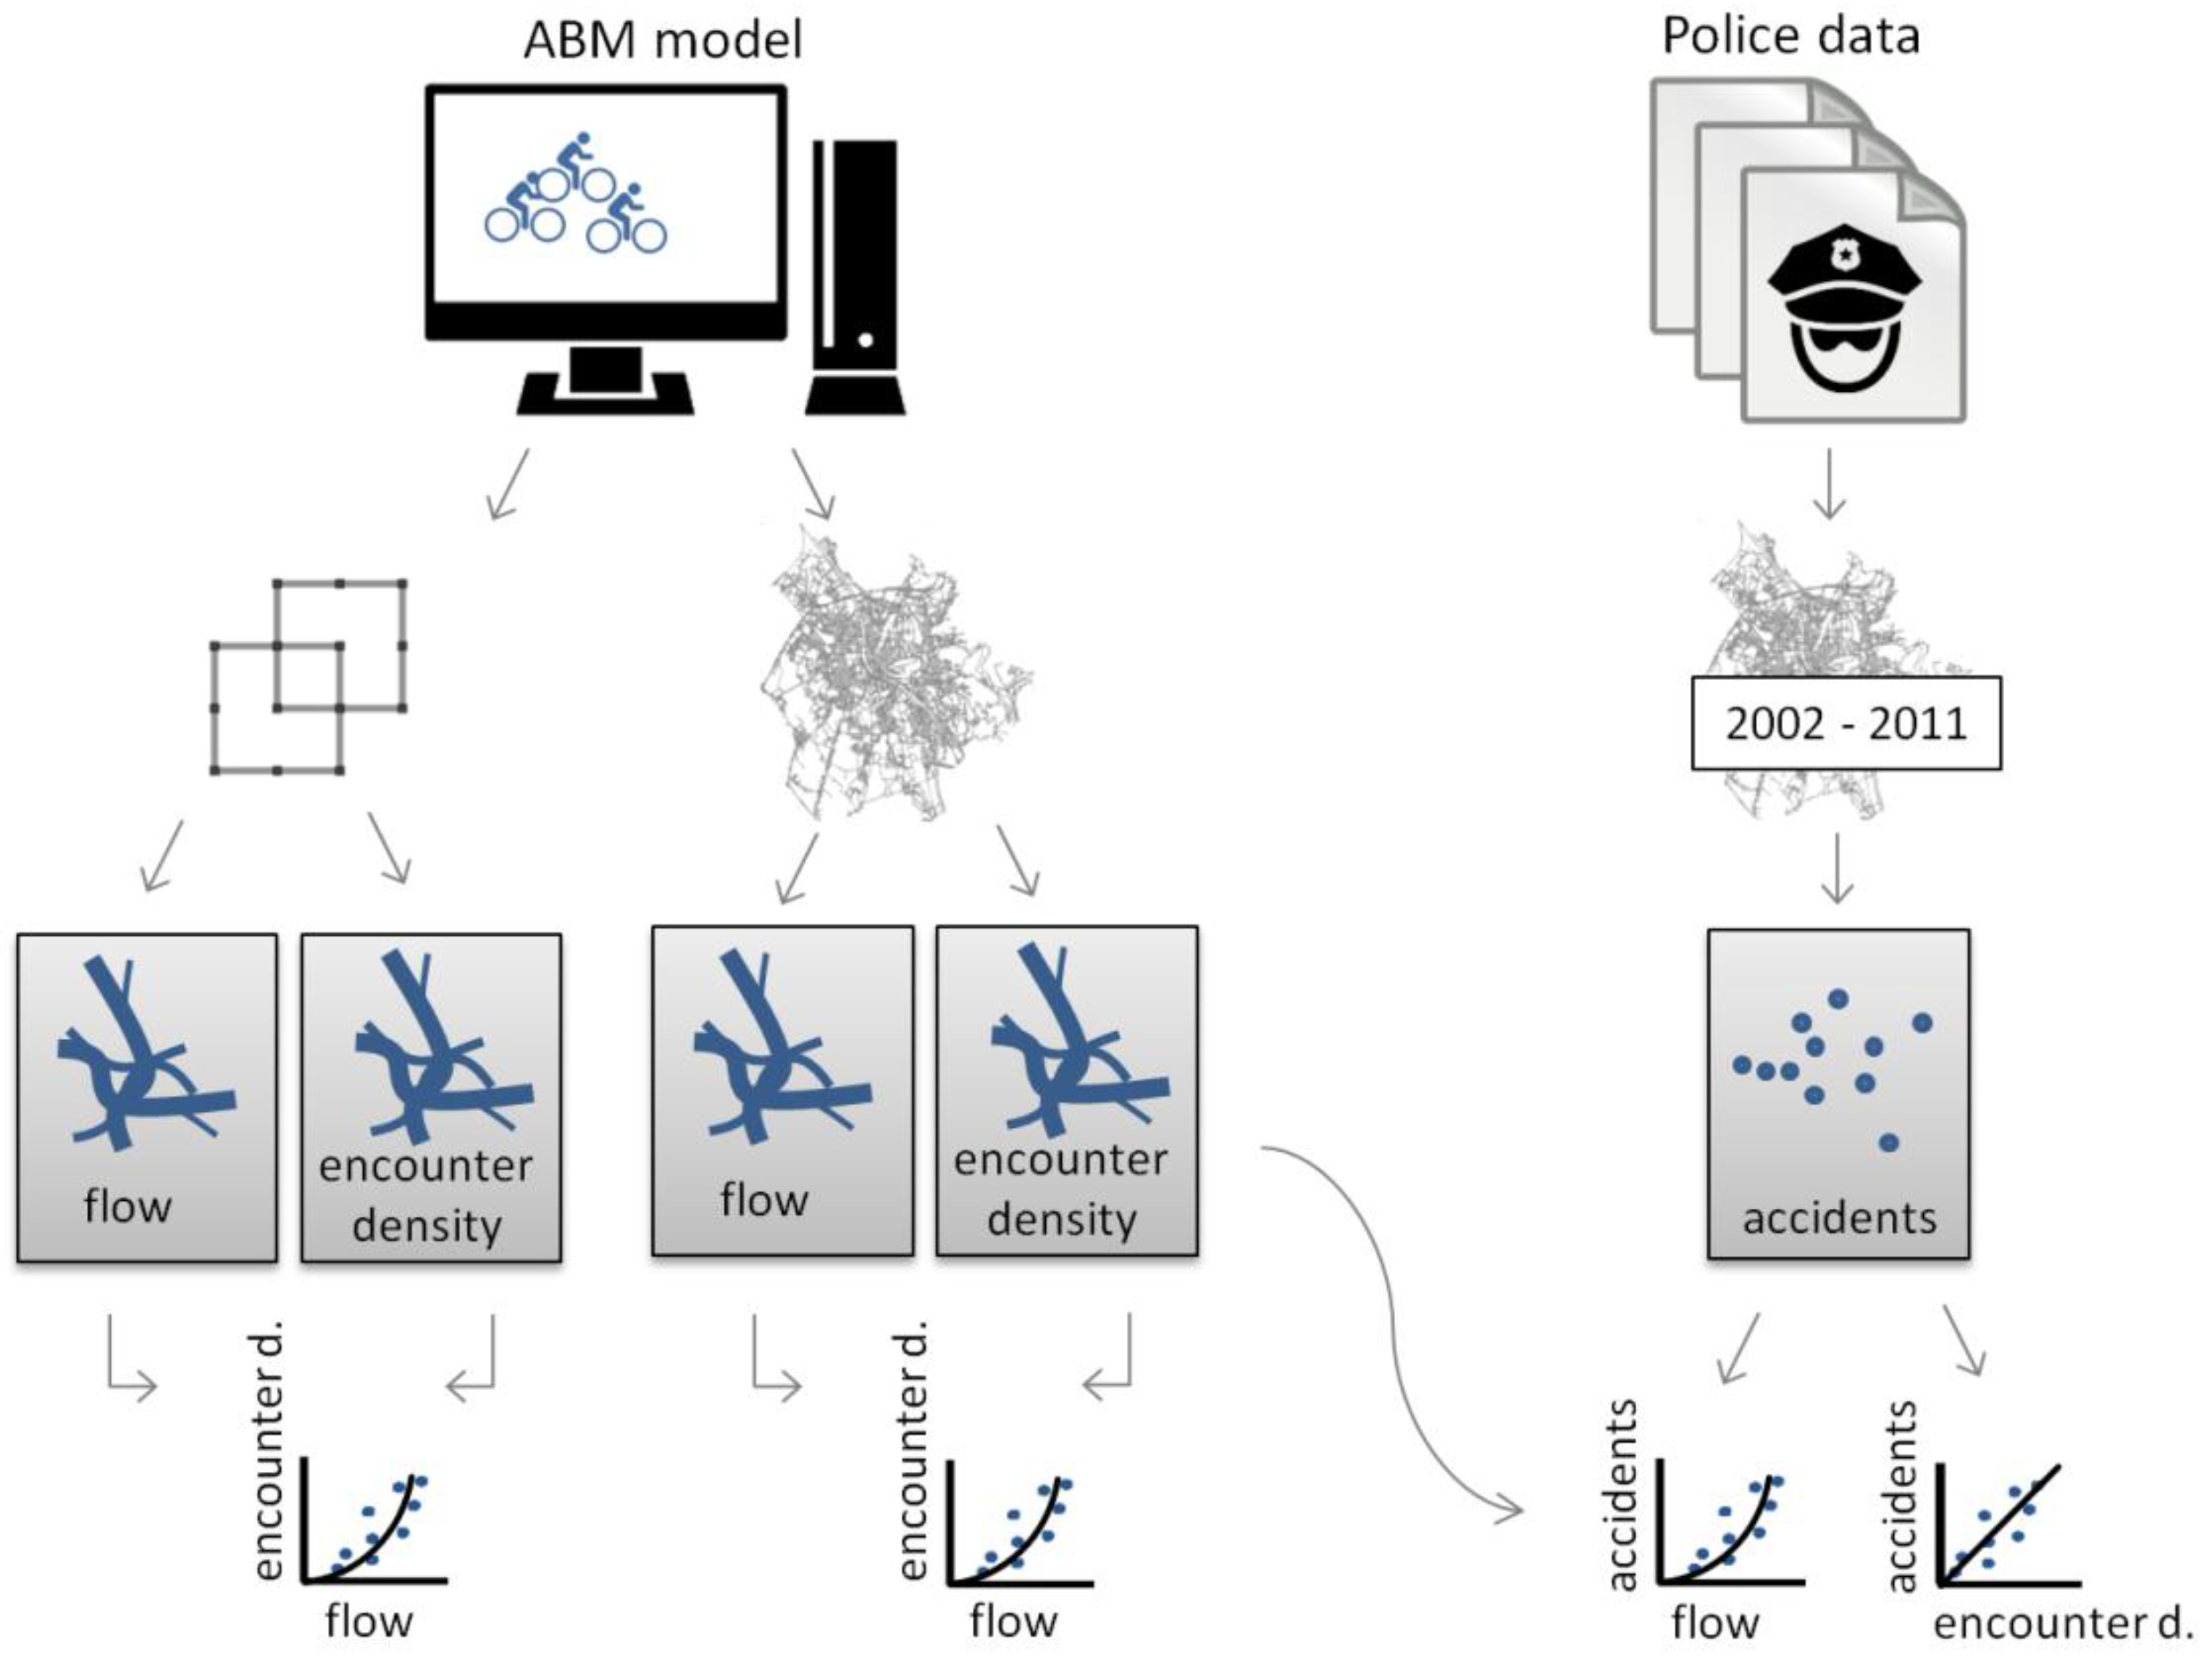
The overall workflow is visualised in
Figure 1. First, the Agent-based Bicycle Traffic Model was implemented on a simple, abstract network to explore the general relation between flows and encounters. The network is represented by a graph, which consists of nodes (junctions in a real-world context) and edges (representing road segments). Second, the model was used to simulate encounters of cyclists on the road network graph of the city of Salzburg. Both models were implemented in the NetLogo modelling framework [
31]. The simulated results for the city of Salzburg were then plotted against police reported accident data. Assuming that the population at risk explains a large part of accidents, we expected to gain insights on the true nature of the population at risk from contrasting flows
versus encounters in relation to accidents. Accident data in the present study exclusively referred to police-reported bicycle-bicycle accidents between the years 2002 and 2011. This dataset comprised 14% of all police-reported bicycle accidents. In the 10-year study period we assumed stable conditions and we did not account for any variations in, e.g., weather, infrastructure or cycling preferences.
2.2. Flows and Encounters in an Abstract Network
Conceptually, if all road users meet each other once, the relation of encounters can be described as the sum of natural numbers: Two cyclists can have only one encounter (C1 with C2). Three cyclists have three encounters (C1 with C2 and C3 + C2 with C3). Four cyclists have six encounters,
etc.; n cyclists therefore encounter n × (n − 1)/2 times. This relation between cyclists and encounters can be described mathematically in the form of a second-order polynomial function:
where n is the number of cyclists.
In a network of many nodes, one cyclist meets only a fraction of other cyclists, depending on the number of nodes and the connectivity in the network. We would therefore expect the relation between flows and encounters to be of the general form of a × n + b × n2, where the coefficients a and b are related to the complexity of the network.
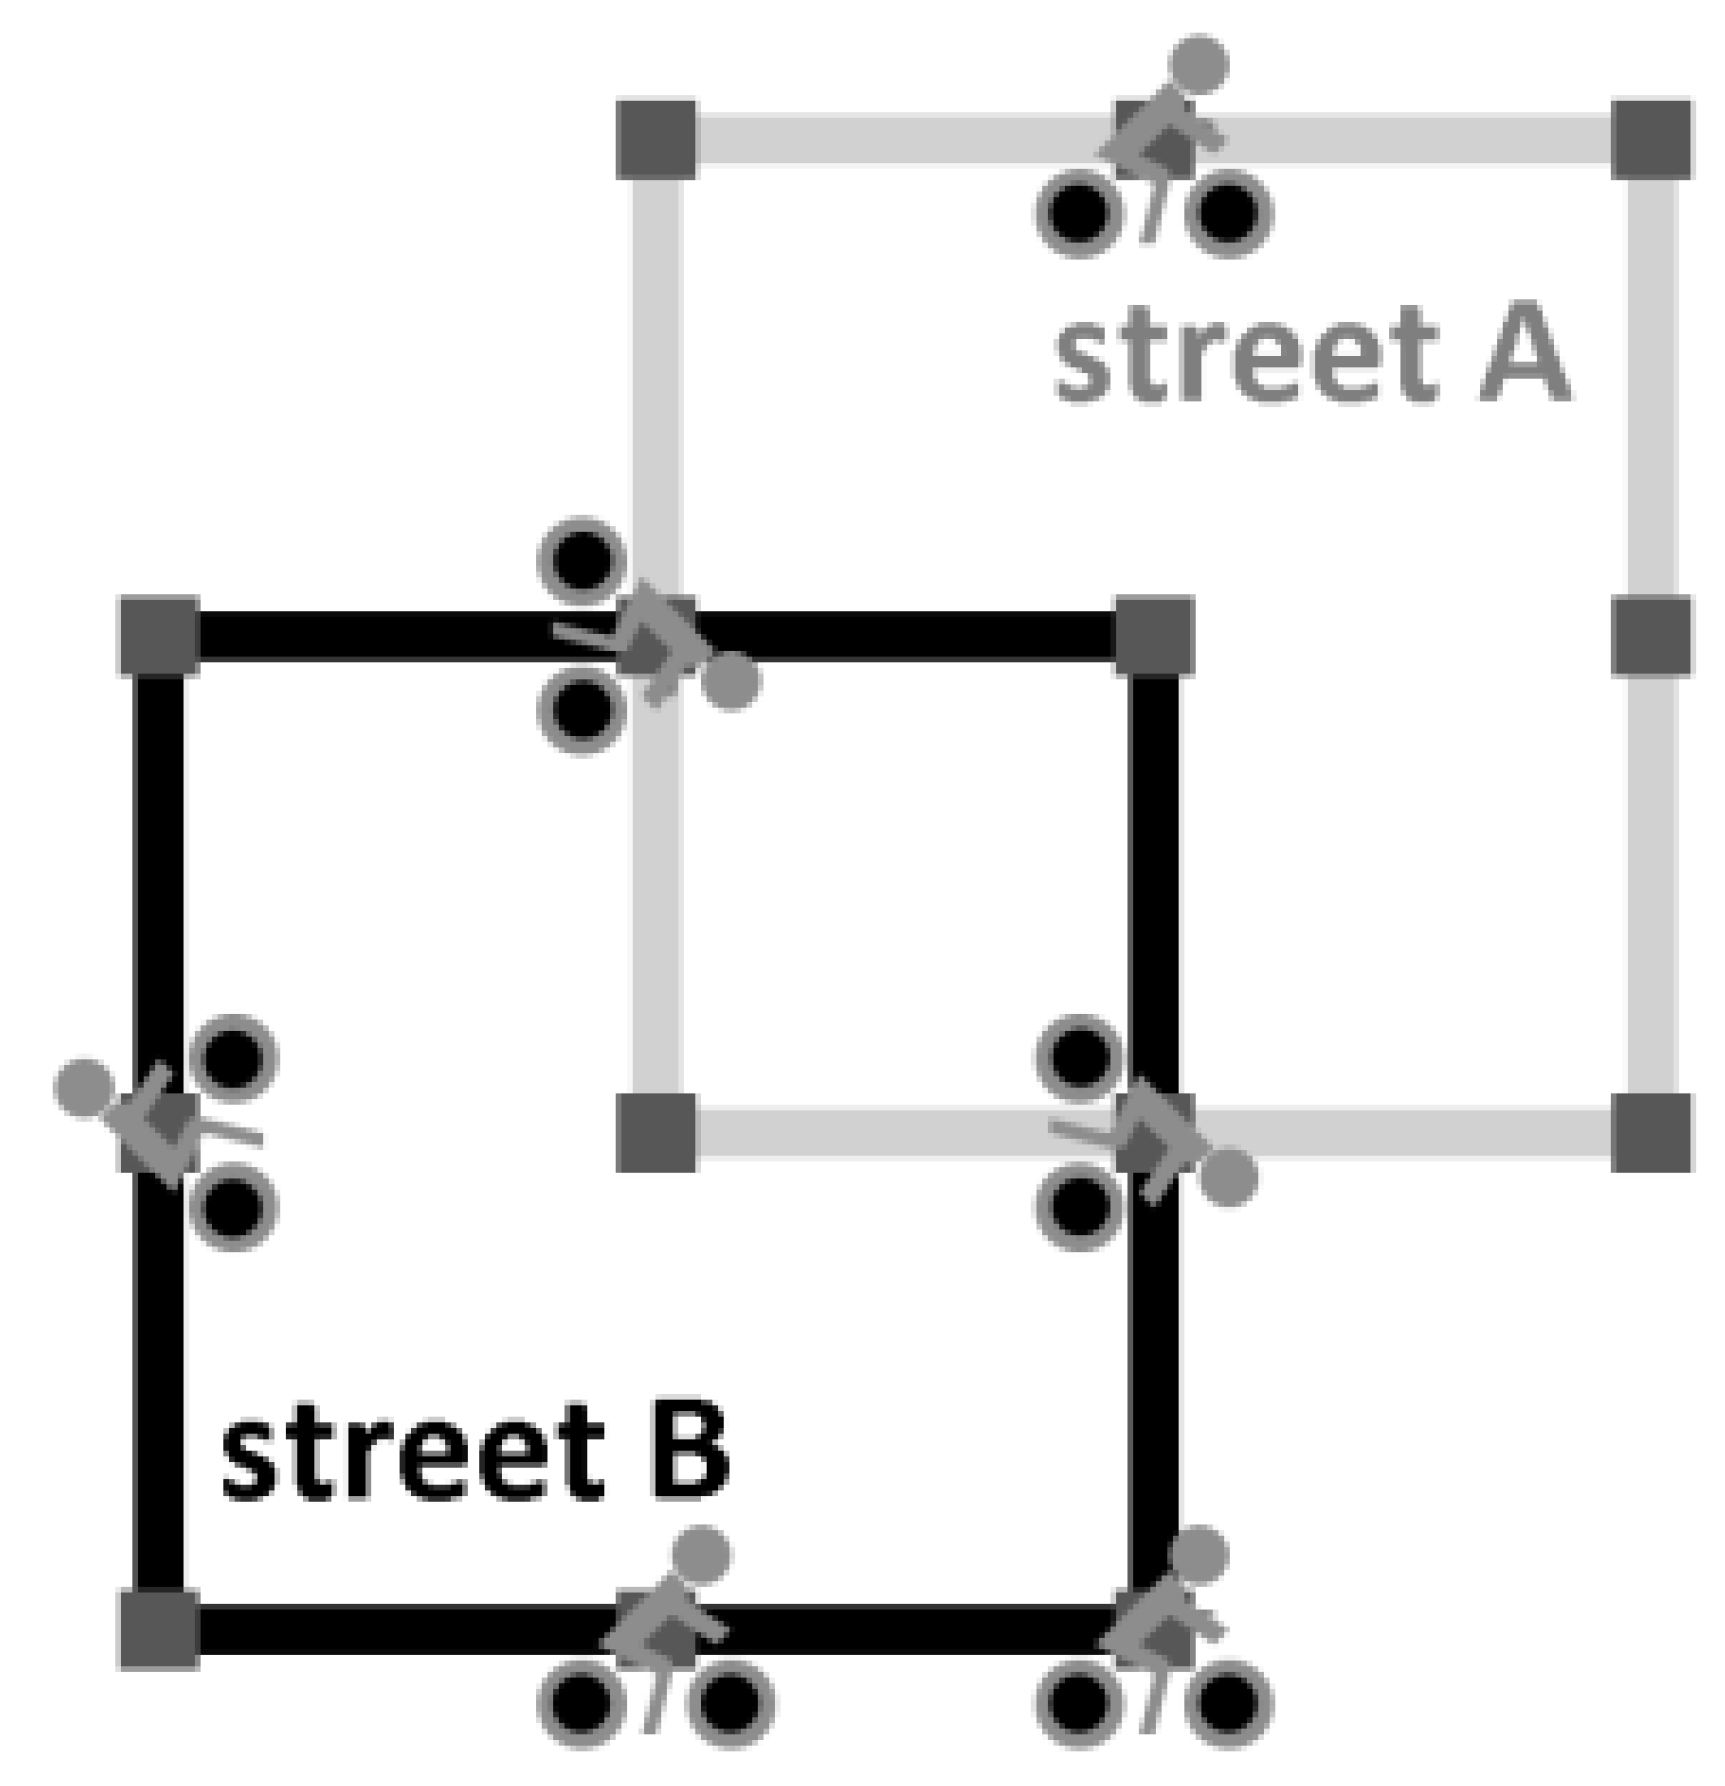
To illustrate the relation between flows and encounters with a simple simulation model, the bicycle model was implemented on an abstract network graph (
Figure 2). This graph consisted of two intersecting square streets, each of which consisted of eight regular segments of equal length. Street B is well suited for cycling, whereas street A is less suited. In the simulation, a user-defined number of cyclists travelled along these streets over 10,000 time steps. Each time step, a cyclist travelled from one node to another through one street segment. Cyclists could change direction at crossings, but could not make a U-turn to return to where they came from. At a crossing, a cyclist decided in 80% of the cases to travel street B instead of street A. All cyclists travelled at the same speed, therefore encounters occurred, if cyclists passed, crossed or travelled together.
After 10,000 time steps, the following state variables were recorded for further analysis: number of encounters, proportion of encounters on street A to street B, and proportion of travelled segments along street A to street B. This simulation was repeated for 10 different numbers of cyclists, ranging between n = 1 and n = 20.
2.3. Agent-Based Bicycle Encounter Model for the City of Salzburg
The extended Agent-based Bicycle Traffic Model was then applied to the city of Salzburg. Each agent cycled from home to its destination (e.g., work or study place) and back again. The resolution of time steps was reduced to one second in order to record all encounters. The spatial resolution of the road graph was continuous. Simulations were computed with multiple numbers of cyclist agents per day ranging between 50 and 10,000. The number of simulated trips thus ranged between 100 and 20,000 trips per simulation. Each simulation was run twice, so that in total 24 simulation runs were computed.
After each simulation, the following data were recorded for further analysis: (1) a geospatial point dataset of the encounter locations with the attributes ‘time’, and ‘encounter angle’; (2) a geospatial dataset of the road network graph with the attribute ‘number of times traversed’ for each segment; and (3) the spatially aggregated number of actively cycling agents and encounter events with a resolution of 15 min. In a post-processing step, encounter angles were coded as one of the following types: overtaking (0° to 45°), crossing (45° to 135°), and oncoming (135° to 180°). The probability that two cyclists from opposite directions crash on an ordinary road is negligible. Therefore, encounter points between oncoming cyclists were excluded, except for bicycle-only infrastructures. As we exclusively focused on the population at risk we did not consider any further risk factors such as road design, trip purpose, or weather condition.
The simulation outcomes were further analysed to identify a potential relation between the number of cyclists and the number of encounters. Therefore, the number of cycling agents per time (flow) was plotted against the simulated number of agents that met (encounters). These flow-encounter pairs were calculated at three spatial and temporal granularities:
First, the number of cyclists and the number of encounters were aggregated over the entire day for each of the 24 simulation runs. For each simulation, the total number of cyclist agents was plotted against the total number of generated encounter points.
Second, the simulated results were discretised temporally into 15 min time bins. For each time bin the number of actively cycling agents was plotted against the respective number of encounters.
Third, simulation results were discretised spatially into individual street segments. For each street segment the number of cyclists that traversed the segment was plotted against the respective number of encounters per metre street length. For this purpose encounters had to be further processed from points to line-based densities. The density was computed as a network-based kernel density using the SANET toolbox [
32] with a 10 m search radius and 10 m output segment length. To identify potential relations between the number of cyclists and the amount of encounters, trend lines were fitted through the flow-encounters plots.
2.4. Comparison with Police Record Data
Finally, simulated flows and encounters were compared with observed bicycle counts and police reported accidents. To explore the temporal match, diurnal traffic dynamics of the simulation were juxtaposed to observed dynamics. To explore the spatial match, maps of simulated flows and simulated encounters were visualised in comparison to a map of the reported accident locations. Finally, simulated flows and encounters were plotted against the reported accidents in one-hour time bins. Trend lines with 68% confidence intervals were fitted through the data and the number of data points within the confidence intervals was counted to get an indication how well the regression model fits. Further, the residuals were evaluated and the adjusted R2 was computed.
3. Results
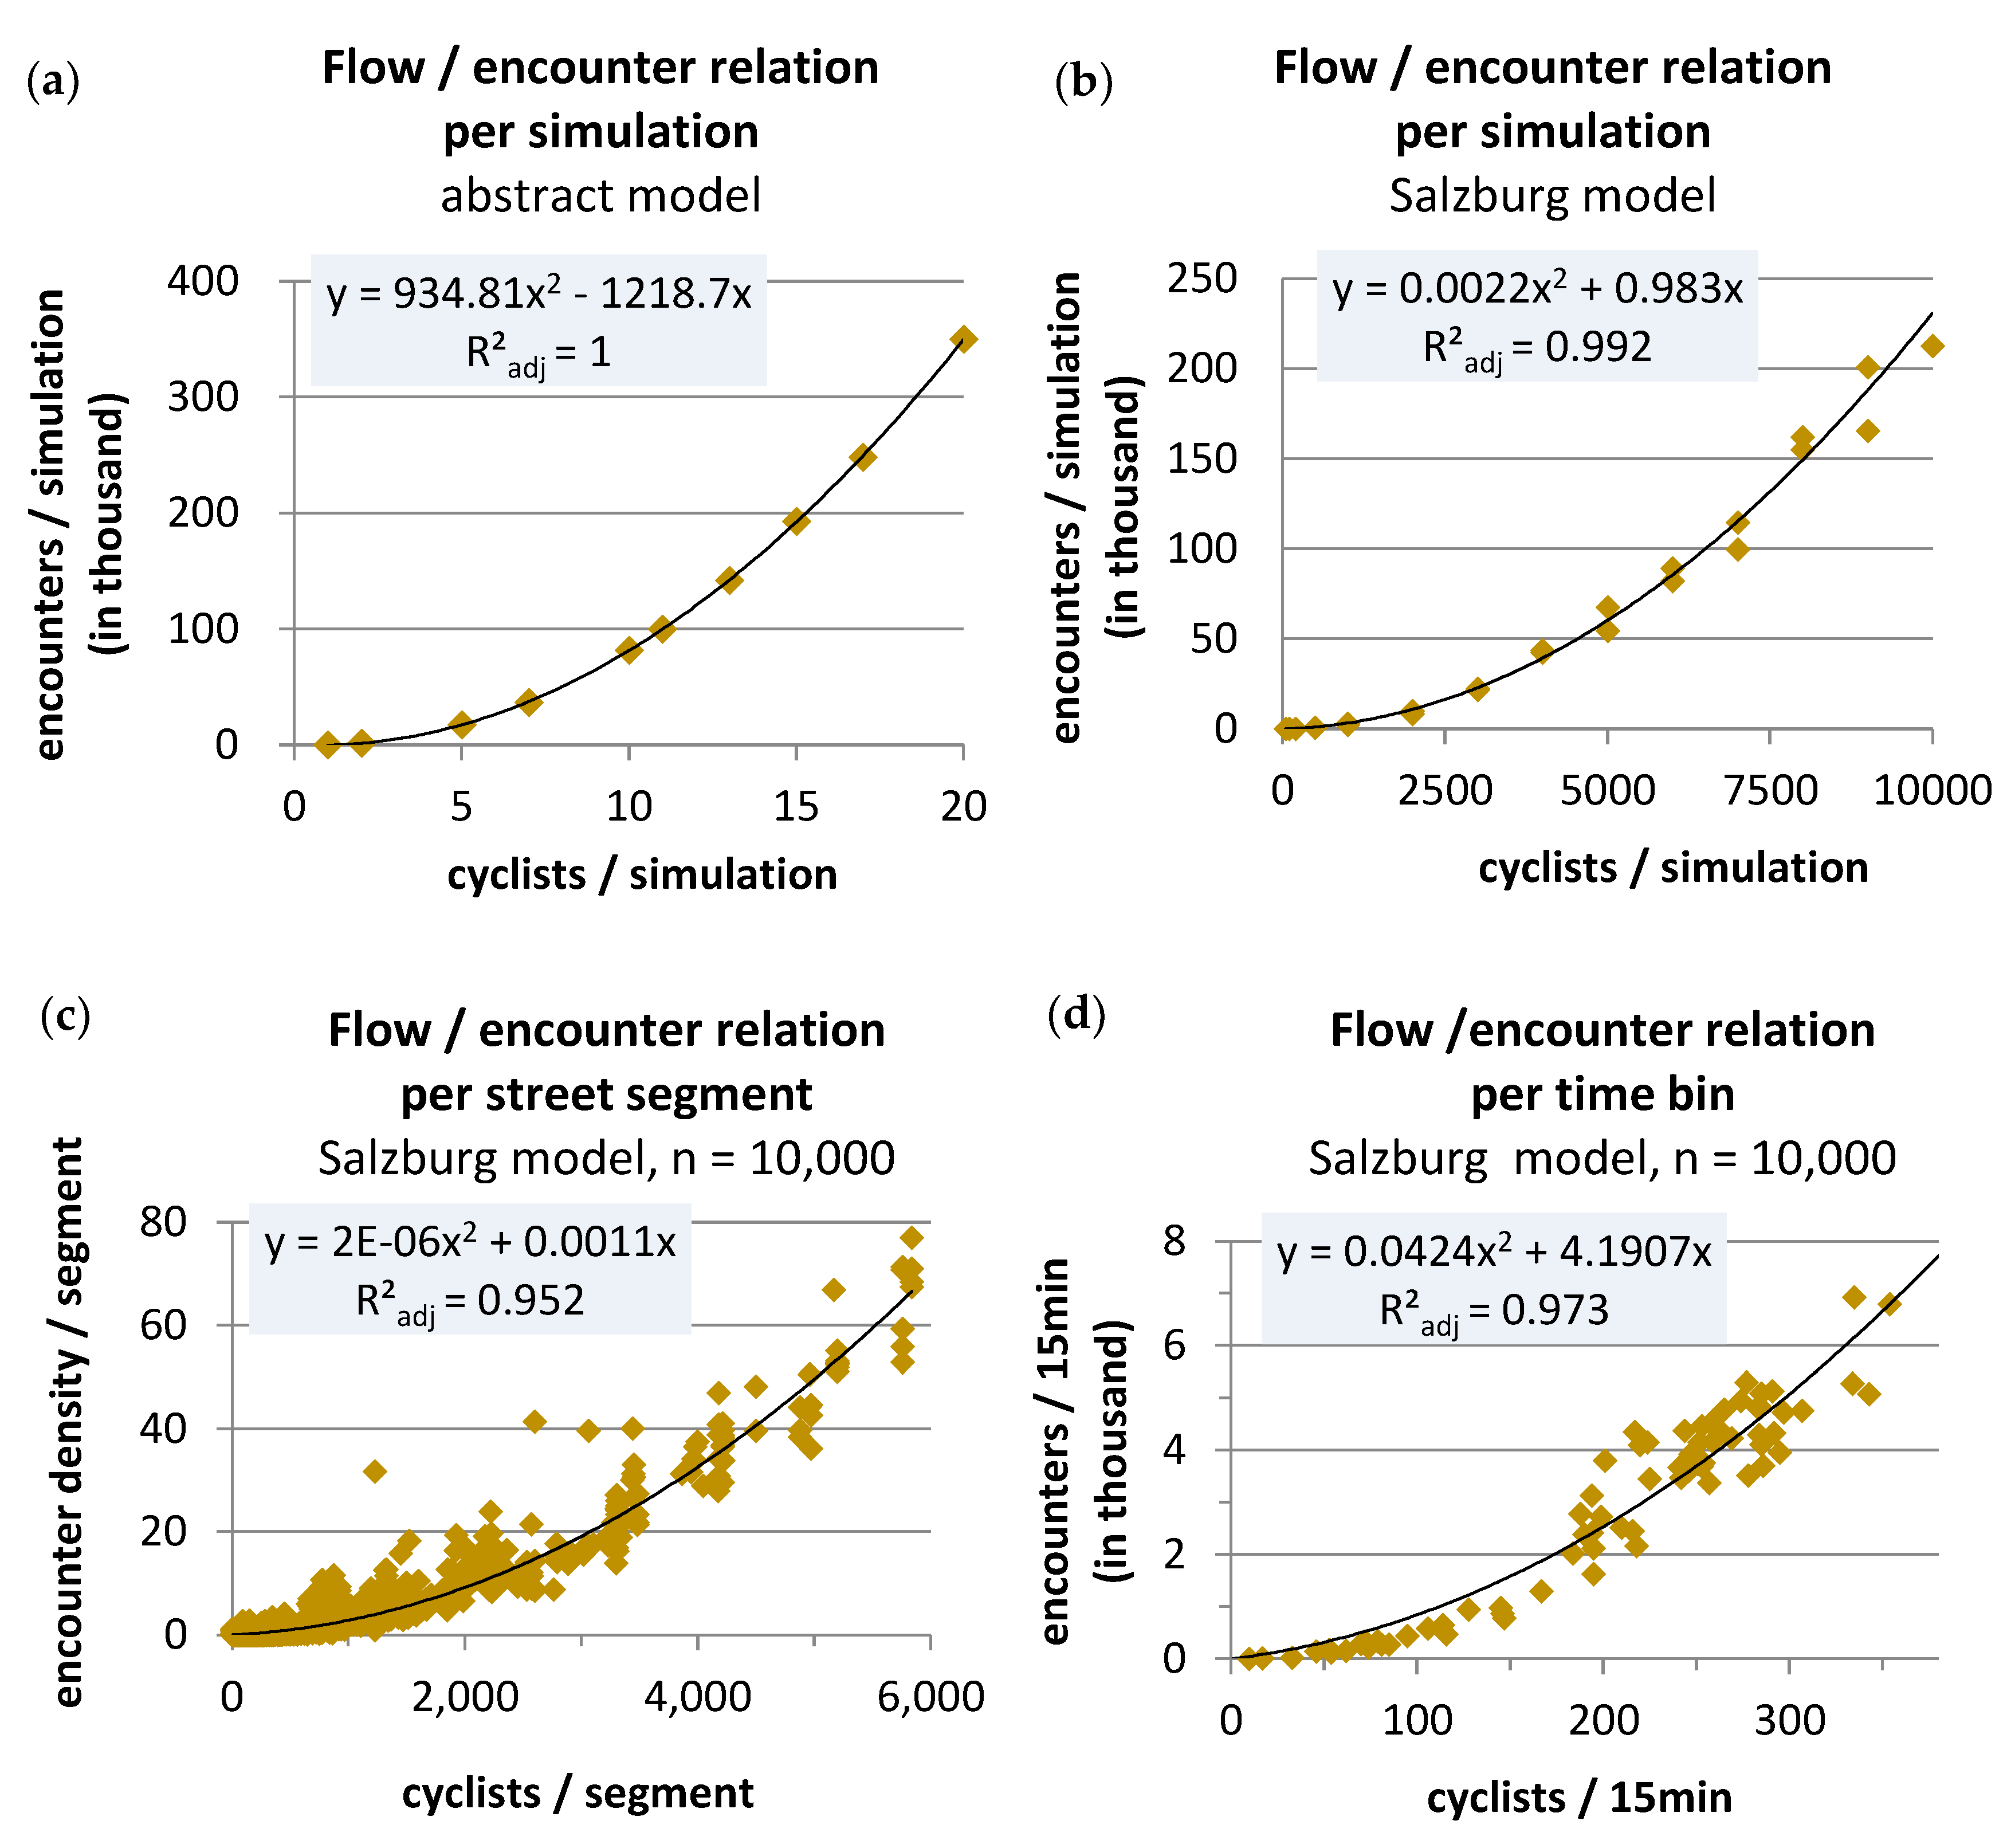
In the abstract street graph model, the number of simulated encounters took the form of a second-order polynomial function with respect to the number of modelled cyclists (
Figure 3a). The form of the function resembles our conceptual considerations on encounters in a network (Equation (1)). The goodness of fit expressed by the adjusted
R2 is equal to one, indicating a perfect fit. However, the parameters are different from Equation (1) as expected, because agents do not encounter each of the other agents in the network at every time step.
Next, the Salzburg cyclist model was used to simulate flows and encounters over one day for various numbers of cyclist agents. The model outcomes were analysed analogously to the abstract street graph,
i.e., the number of encounters was plotted against the number of simulated cyclist agents. Three further plots resulted from this analysis: The first plot (
Figure 3b) shows the relation between the total number of simulated encounters and the respective number of simulated cyclist agents, for the 24 simulation runs. The second plot (
Figure 3c) disaggregates the results spatially. The outcomes of a simulation run with the maximum of simulated cyclists (
n = 10,000) was taken to plot the number of encounters on one metre of street length against the number of simulated cyclists that passed the respective street segment. The third plot (
Figure 3d) shows the results in a temporally disaggregated view. It plots the encounter-cyclist pairs for 24 h at 15 min time intervals. Through all plots a trend line of the type of a second-order polynomial function was fitted. The trend line exhibited high goodness of fit (adjusted
R2 = 0.992, 0.952, 0.973, respectively).
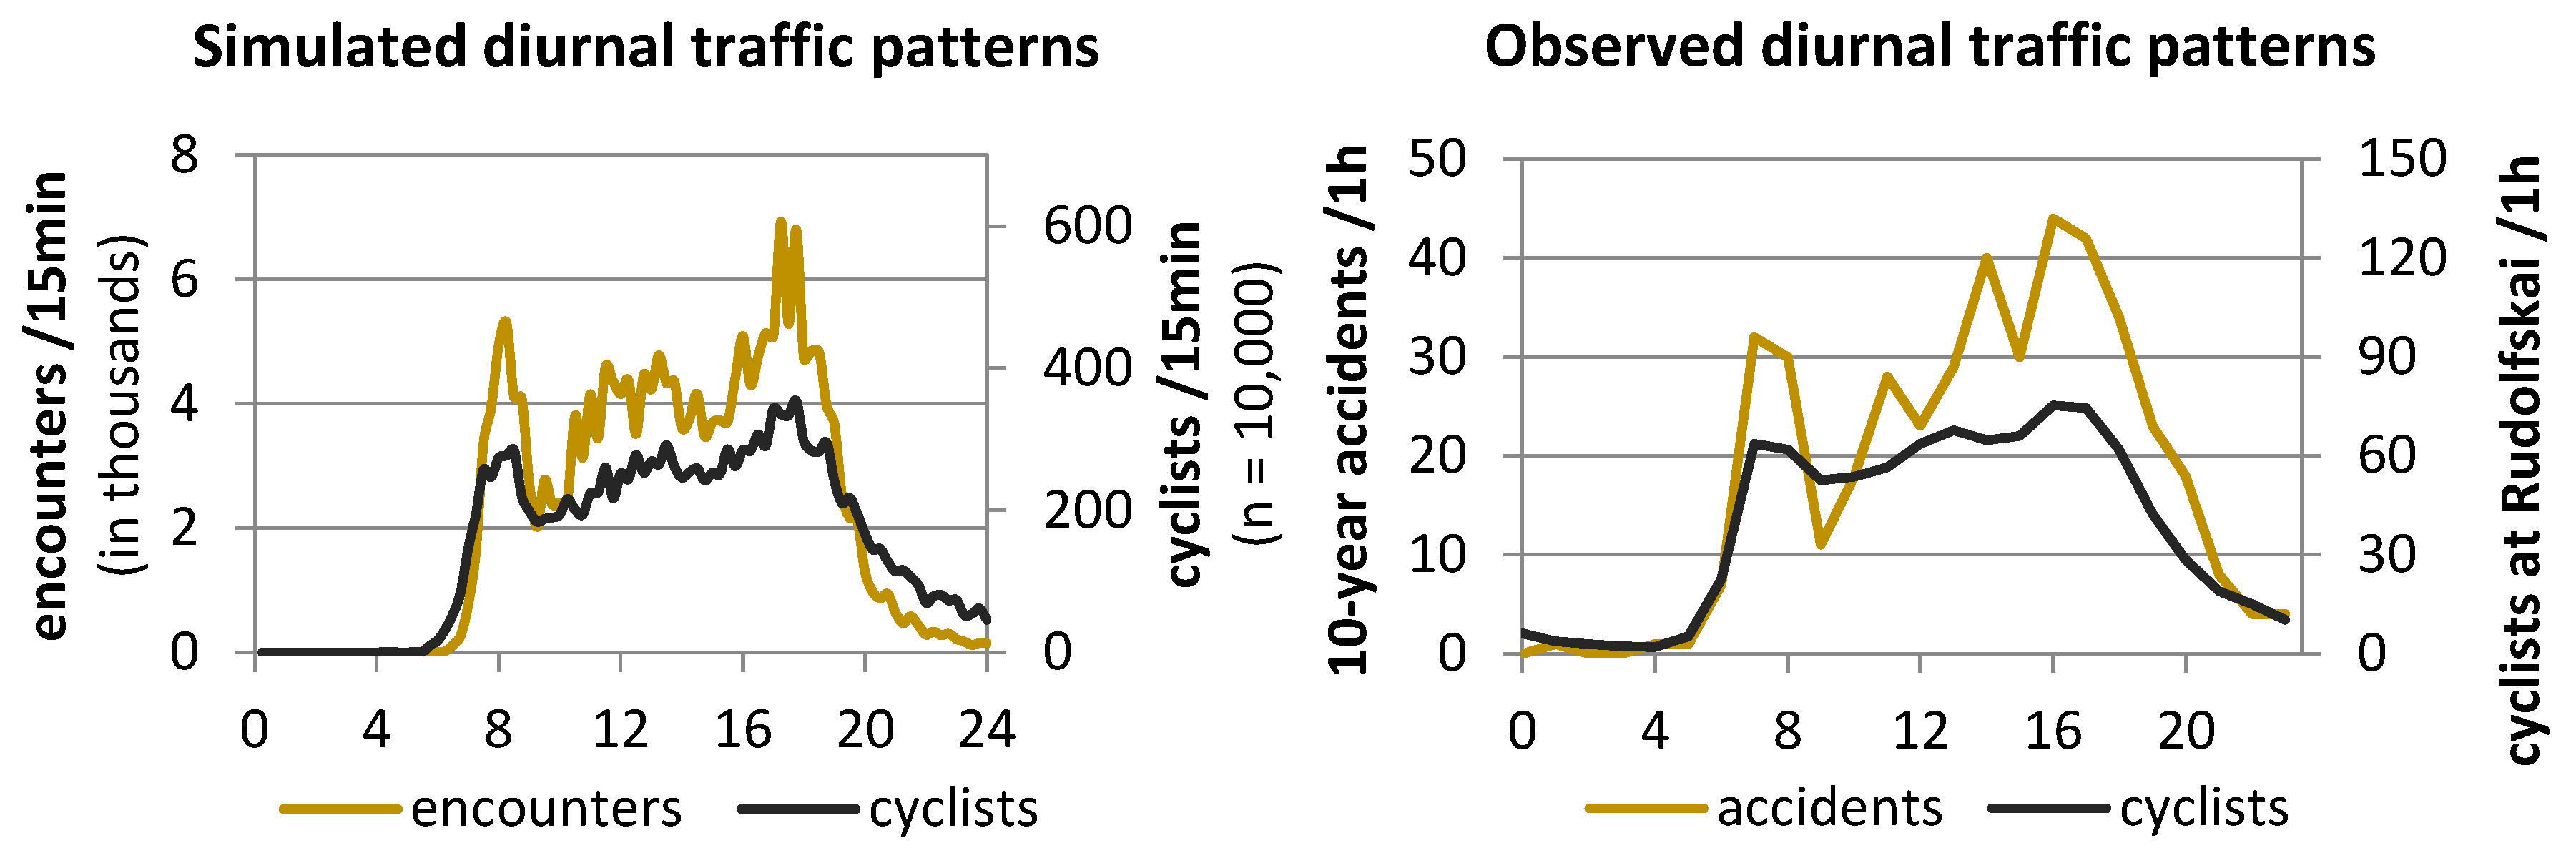
The non-linear relationship between the number of cyclists and encounters also became apparent when the number of cyclists in the model was juxtaposed with the number of encounters over the course of one day (
Figure 4, left). During late-night hours, when there are only a few cyclists on their way, the number of encounters was low, whereas encounters increased disproportionally during rush hours. Analysis of the police records unveiled a similar pattern for the observed accidents (
Figure 4, right).
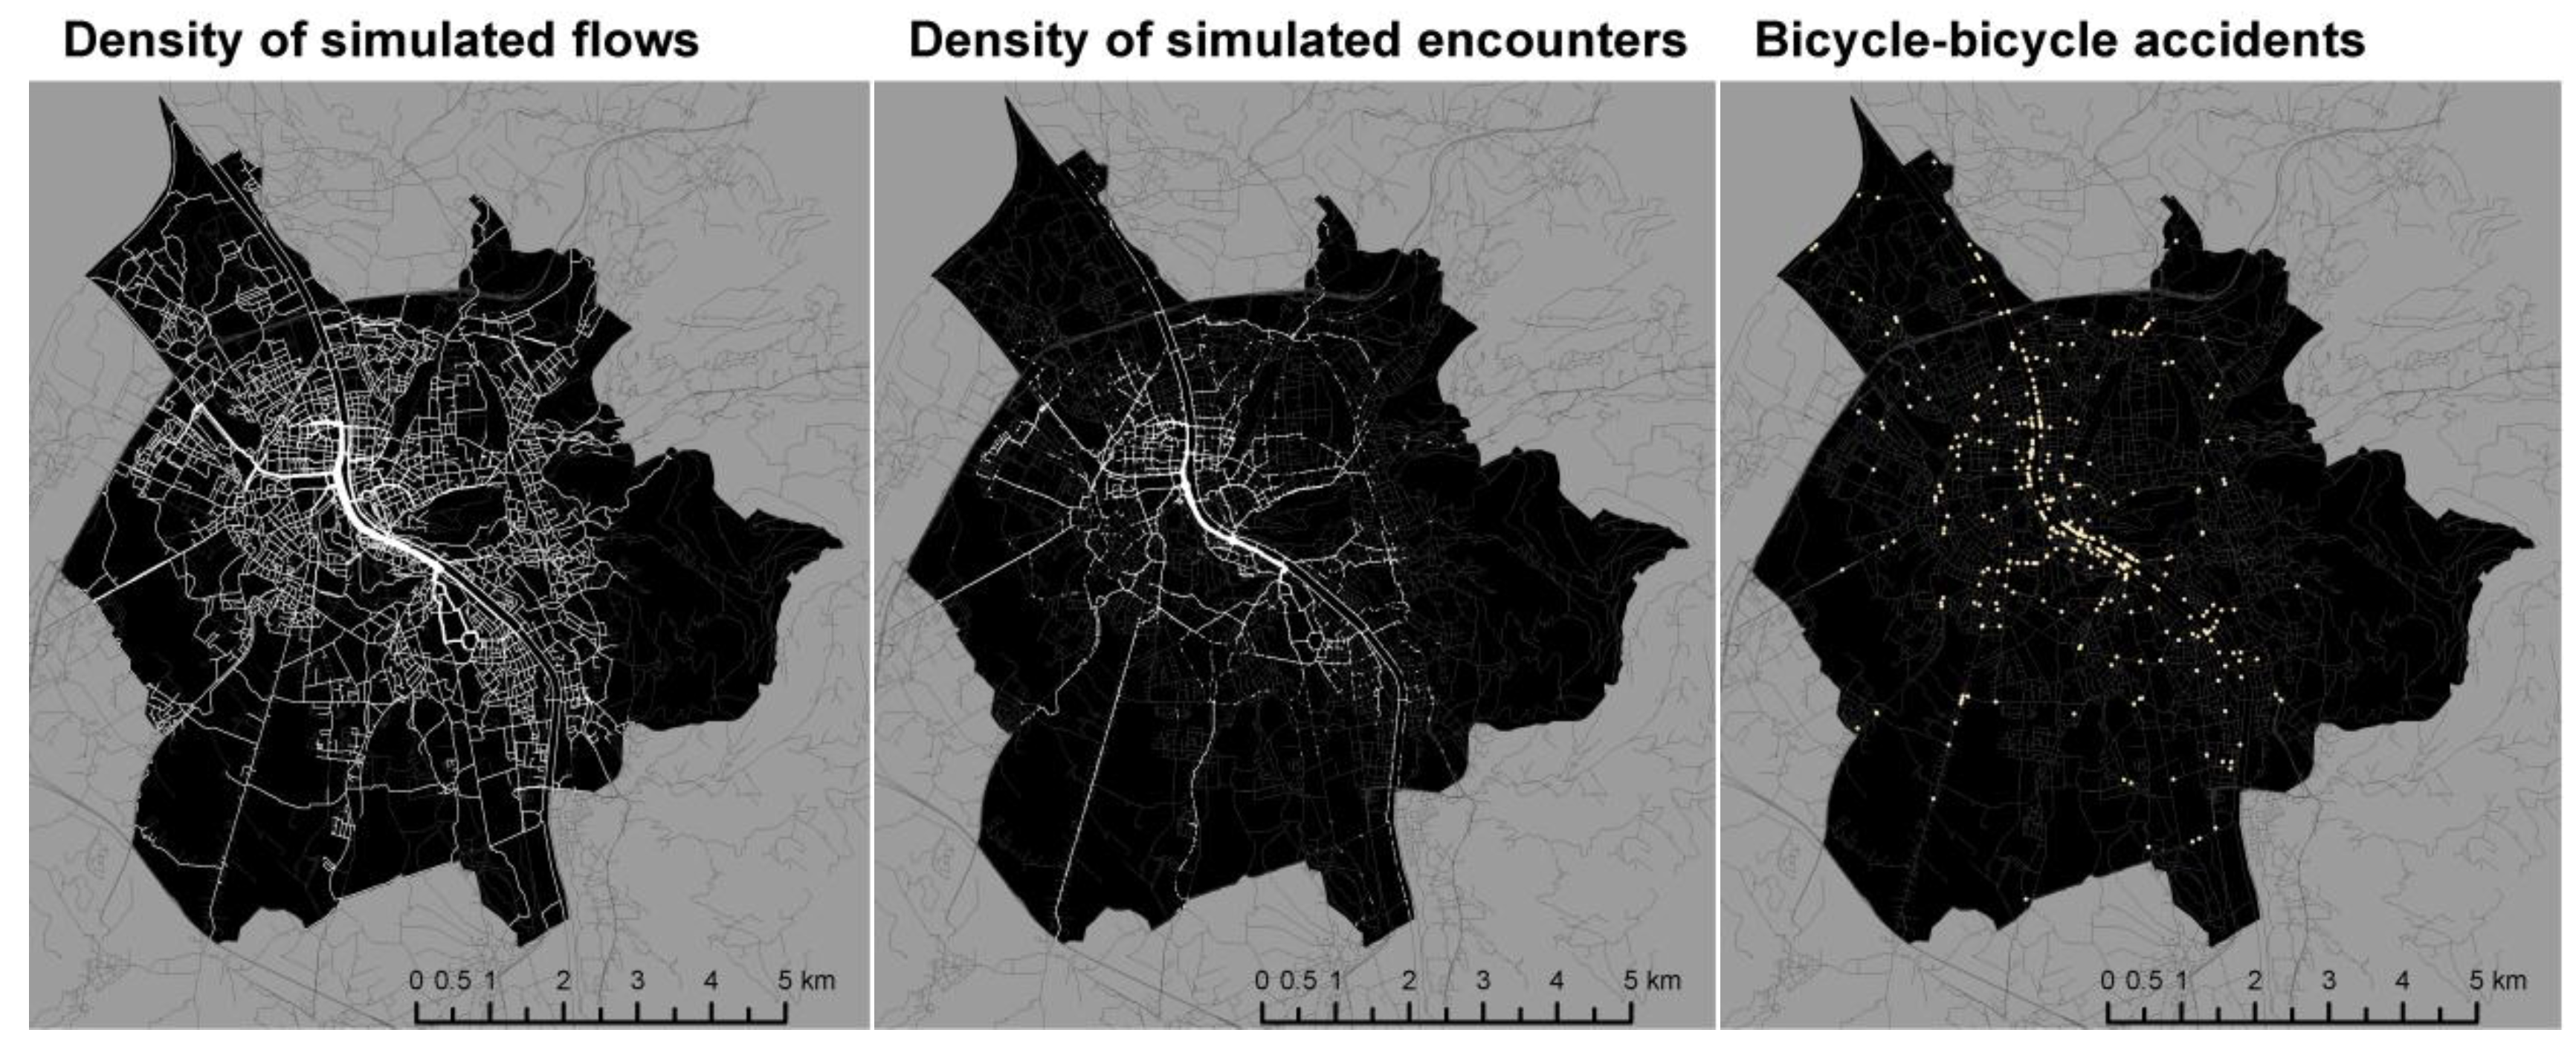
The maps in
Figure 5 visualise the spatial distribution of simulated flows (left) and encounter densities (centre). The third map on the right shows the actual location of reported accidents.
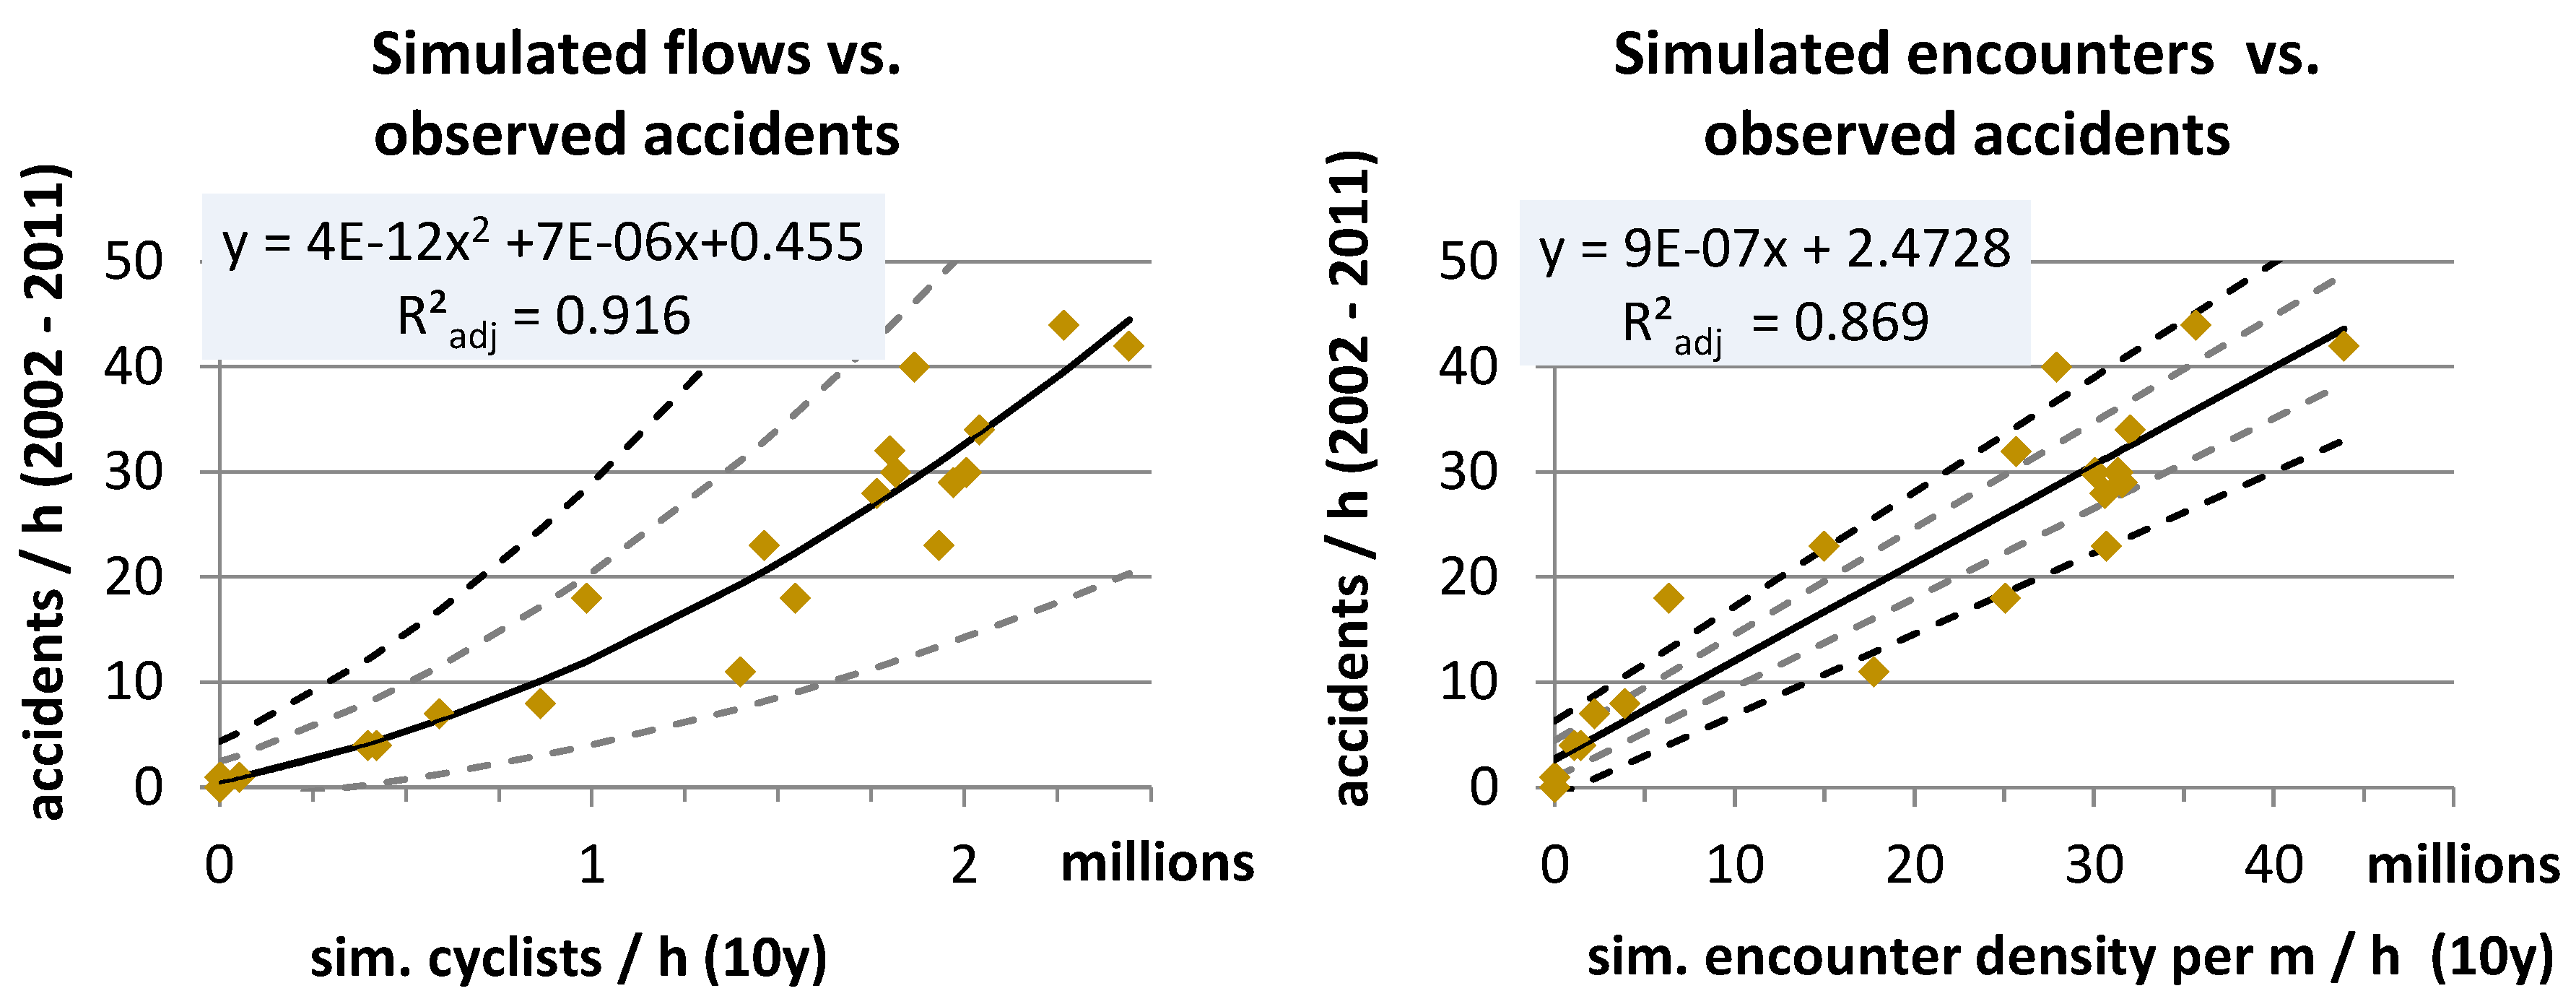
Figure 6 shows the goodness of fit for simulated flows and encounter densities against accident events. In order to provide simulation data for the same 10-year duration as the observed accidents, the one-day simulation results were upscaled to 10 years. The reference for upscaling was the mean number of cyclists of two long-term counting stations at the day for which the simulation was calibrated (6 June 2013) in relation to the total bicycle count at these stations over one year. The conversion factor calculated this way amounted to a value of 185 for one year and 1850 for 10 years, respectively. Both datasets, the simulated flows and the simulated encounters, were therefore multiplied by a factor of 1850. A second-order polynomial function fitted the flows to the observed accident data with a high goodness of fit (adjusted
R2 = 0.91). All values were in the limits of the 68% confidence interval. Simulated encounters exhibited a linear relationship with the reported accidents, also with a high goodness of fit (adjusted
R2 = 0.87). Only half of the data points (12 of 24) fell into the 68% confidence interval of the regression line and only 80% of the data was within the 95% confidence interval, which suggested that the regression model may not be correct and additional factors should be considered to predict accidents. However, the residuals were dispersed randomly, which supported the linear relationship between encounters and accidents.
4. Discussion and Conclusions
Validation of flows and encounters that were simulated with the Salzburg bicycle model showed a reasonably good fit with the observed accident data. The main implications of this good fit are threefold:
Firstly, the results affirm the quality of the simulation data and thus the validity of the Salzburg bicycle model for the purpose of simulating bicycle traffic flows of a city. Validity thereby has to be stated in reference to its specific purpose for which it was designed [
33]. Unlike fine-scaled ABMs that are designed to study the interaction of traffic participants at intersections or other specific spatial contexts, the purpose of the Salzburg bicycle model is to simulate traffic flow patterns of the road network of an entire city. It therefore trades off behavioural realism at the local scale, e.g., giving way or adapting speed, with behaviour on the regional scale, e.g., finding a safe route. In the absence of observed city-wide bicycle traffic data, ABM has proven to be an approach that is well suited to estimating traffic patterns. Agent-based simulation modelling thus can be used as a means to overcome a lack of adequate bicycle traffic data, which is one of the main challenges in estimating bicycle accident risks [
34].
Secondly, the results show a linear relation between simulated encounters and observed accidents, but a quadratic relation between simulated flows and accidents. This backs the first hypothesis of this paper that bicycle-bicycle accidents emerge from the population that is defined by encounters rather than by traffic flow. Exposure data usually refer to distance travelled, cycling travel time, number of bicycles at a certain location or the number of trips made [
29,
34]. All these data relate to traffic flows rather than encounters. However, our results suggest that the use of traffic flow as an exposure variable is actually a surrogate for encounters. A good reason for using traffic flow data in equation-based accident prediction models is that it can be acquired more easily than encounter data. This is especially true for the scale of a region or an entire city. Whereas traffic flow data are usually collected by means of a set of spatially distributed in-situ count stations [
35], encounter data need a more elaborate collection technique, such as video analysis of a specific location [
27]. Our results show that disaggregate agent-based models are of particular importance in this context, as they can simulate not only realistic city-wide flows but also city-wide encounters from traffic count data.
Thirdly, the excellent fit of simulated flows with accidents by a second-order polynomial function backs the theoretical considerations that led to the second hypothesis,
i.e., that flows and encounters exhibit a non-linear relationship. The results of this research imply that increasing bicycle volumes leads to a disproportional increase in encounters and hence potential accidents. This finding at the first sight is not backed by the literature, as increasing traffic volume is usually accompanied with decreasing accident rates. Elvik
et al. [
36] explain this relation with better road standards and increased attention from drivers. Also the ‘safety in numbers’ phenomenon describes decreasing bicycle accident rates with increasing traffic volumes. Possible explanations relate to safer infrastructure for highly frequented bicycle routes [
8,
37] and increased attention of car drivers in response to high numbers of cyclists [
7,
30]. However, Bhatia and Wier [
38] argue that any causal interpretation of aggregate statistics on the macroscale may be incorrect and needs to be closely examined at the local scale. Agent-based modelling has contributed to illuminate how the safety in numbers phenomenon can emerge from the behaviour of car drivers at the local scale [
30]. A distinct feature of the agent-based model presented here is the focus on bicycle-bicycle encounters only, which is fundamentally different from the interaction between non-motorised and motorised vehicles [
39]. In this respect our research compares well with Martin’s [
6] study on car-car accidents in relation to car traffic volumes. In line with the presented results, Martin found increasing accident rates for increased traffic volumes on a highway. The question thus remains how encounters are related to accidents between bicycles and whether bicycle-bicycle accidents differ from single bicycle or bicycle-car accidents. Schepers
et al. [
40] suggest a linear relation of single-bicycle accidents with bicycle flows, which further supports the use of encounters as a base for bicycle-bicycle accidents. Accidents between non-motorised and motorised vehicles also develop from encounters and thus also draw from the statistical population of encounters. Reasons for the contrary trend in accident numbers with respect to traffic flows may lie in the different mechanisms that turn an encounter into an accident.
Regardless of the question of whether flows or encounters are more adequate as exposure variables, the results are encouraging in terms of applying ABMs to estimating traffic patterns for an entire city. However, data scarcity limits rigorous model validation, especially in the city periphery, where only a few bicycle count stations are located. Whilst acknowledging this limitation, ABMs have the major benefit of capturing the spatial distribution of accident risks, where encounter densities are even more spatially accurate than flows. The simulation of data can be specifically valuable in the case of scarcity of adequate empirical data. In addition to that, ABMs are particularly well suited to integrating local context and behavioural information of individual road users [
41]. The next step ahead in predicting accidents with ABM is thus to systematically analyse context-specific risk factors that are associated with an encounter, such as encounter angle, road type, traffic mode, weather, time of the day, or certain road user characteristics [
2], and integrate these into ABM models.


