Review of Parameter Determination for Thermal Modeling of Lithium Ion Batteries


Department of Energy Technology, Aalborg University, DK-9220 Aalborg, Denmark
*
Author to whom correspondence should be addressed.
Batteries 2018, 4(2), 20; https://doi.org/10.3390/batteries4020020
Submission received: 22 February 2018
/
Revised: 5 April 2018
/
Accepted: 9 April 2018
/
Published: 20 April 2018
(This article belongs to the Special Issue Battery Integration and Operation in Electro-Mobile Applications)
Abstract
:This paper reviews different methods for determination of thermal parameters of lithium ion batteries. Lithium ion batteries are extensively employed for various applications owing to their low memory effect, high specific energy, and power density. One of the problems in the expansion of hybrid and electric vehicle technology is the management and control of operation temperatures and heat generation. Successful battery thermal management designs can lead to better reliability and performance of hybrid and electric vehicles. Thermal cycling and temperature gradients could have a considerable impact on the lifetime of lithium ion battery cells. Thermal management is critical in electric vehicles (EVs) and good thermal battery models are necessary to design proper heating and cooling systems. Consequently, it is necessary to determine thermal parameters of a single cell, such as internal resistance, specific heat capacity, entropic heat coefficient, and thermal conductivity in order to design suitable thermal management system.
1. Introduction
The use of electric vehicles (EVs) is increasing rapidly because of many reasons such as the pollution of internal combustion engines and stricter environmental standards. Problems related to fossil fuels have pushed manufacturers to pursue alternative energy sources for their products.
Reliability of batteries is an indispensable factor to attain economic and technical success in stationary energy storage systems or EV applications. The existence of the battery affordability and low energy density are among the major problems in the mass production of EVs. Although lithium-ion batteries have employed more because of lower cost, higher life expectancy, and greater energy density, thermal problems pertaining to these batteries is still an issue.
Utilization of lithium-ion batteries for high-energy consumption is encountered with some restrictions. High functioning temperature leads to shortening of life, capacity reduction or even in the more severe cases will cause a battery fire or increases the risk of thermal runaway.
Increase in cell temperature strongly affects the performance of the battery pack. Therefore, the corresponding heat problems should be eliminated. Non-uniform temperature distribution of the cells decreases the output voltage and available capacity of the entire pack.
Because of the problems mentioned, use of a suitable thermal management system is essential to control the operating temperature and to provide uniform temperature distribution. Determination of thermal parameters for lithium-ion batteries is one of the most important tasks to comprehend their thermal behavior over a wide range of operating conditions and design accurate thermal management system.
Electrochemical characteristics of lithium ion batteries such as surface, bulk behavior and thermal properties for layered transition metal oxide cathode materials has been investigated [1]. NMCs (LiNixCoyMnzO2), which are a family of outstanding lithium ion battery cathode materials, are able to raise energy densities and life span, decrease expenses, and improve safety for grid storage and electric vehicles applications. They concluded that electrochemical properties of NMC cathode materials dependent on composition such as: Ni, Co, Mn, Al, Fe, or Ti [1].
Thermal properties of gel polymer electrolyte membrane for lithium ion battery has been investigated [2]. Mettler-Toledo DSC 822e was employed to accomplish the differential scanning calorimetry in nitrogen atmosphere. Thermo gravimetric (TG) measurements of the cases were accomplished by a Perkin-Elmer SDTA851 thermo gravimetry/differential thermal analyzer (TG-DTA). It was concluded from the TG outcomes that PMMA (polymethyl methacrylate) has lower thermal stability in comparison with the gel polymer electrolyte films as a consequence of the incorporation of the ion liquids [2]. LiPF6 solutions including nonflammable FAP (fluorinated alkyl phosphates) solvents were investigated [3]. The thermal and electrochemical properties, which were dependent on the solvent composition, were taken into consideration. The research purpose was to construct safer lithium ion batteries electrolyte systems. It was concluded that the thermal behavior of the electrolyte solution including TFEP (2, 2, 2-trifluoroethyl phosphate) was considerably subordinate to the co-solvent, particularly with attendance of a charged LiCoO2 positive electrode. EC (ethylene carbonate) as a co-solvent demonstrated a high exothermic feedback at beginning temperature under 200 °C. The thermal analysis results suggested that the LiPF6/FEC (fluoro ethylene carbonate) + TFEP combination could work as a safer electrolyte system in LIB under severe conditions [3]. A least-square parameter identification procedure was applied to a battery cell with the intention of the parameters determination for thermal modeling [4]. Experimental outcomes demonstrated that the simple model with the characterized parameters fits very precisely to the measurements (lower than 1% deviation) and the dynamic temperature discrepancy was lower than 5%.
Reference [5] analyzed a procedure to determine the thermal parameters of a cylindrical lithium ion battery by employing heat flux measurements. The uncertainty analysis demonstrated that uncertainty for heat capacity was 3.0% to employ heat flux measurements procedure. Notwithstanding, the uncertainty for the determination of the though-plane thermal conductivity was considerably higher [5]. A reduced wide-temperature-range electro-thermal model (RWET) under different temperatures and frequencies has been presented [6]. The model was based on the frequency-dependent equation. Unlike the other electro-thermal models, this model does not need costly thermal equipment. It was concluded that the maximum relative temperature error and voltage error were lower than 0.89 °C and 2.31%, correspondingly [6].
A combined computational and experimental method was presented [7] to approximate multiple thermal parameters of large-format laminated lithium-ion batteries. The performance of the procedure was confirmed by small difference between the approximated values of the specific heat capacity measured by heat-flow calorimeter (HFC) and accelerating rate calorimeter (ARC). The advantageous of this method over traditional methods was because of in situ and simultaneous approximation of multiple thermal parameters [7].
A mathematical method for the construction of a 3-D thermal model of a lithium titanate pouch cell has been presented [8]. The model parameters were determined experimentally. A battery equivalent electrical circuit with the constant phase element (CPE) was used to include the temperature dependency. Verification of the model was performed by experimental data for a 60 Ah LiTi pouch cell. The model demonstrated well agreement with the experimental data. It was concluded that the procedure could be used for the assessment of the heat distribution in a pouch cell for hybrid mobile applications [8].
2. Equivalent Circuit Model
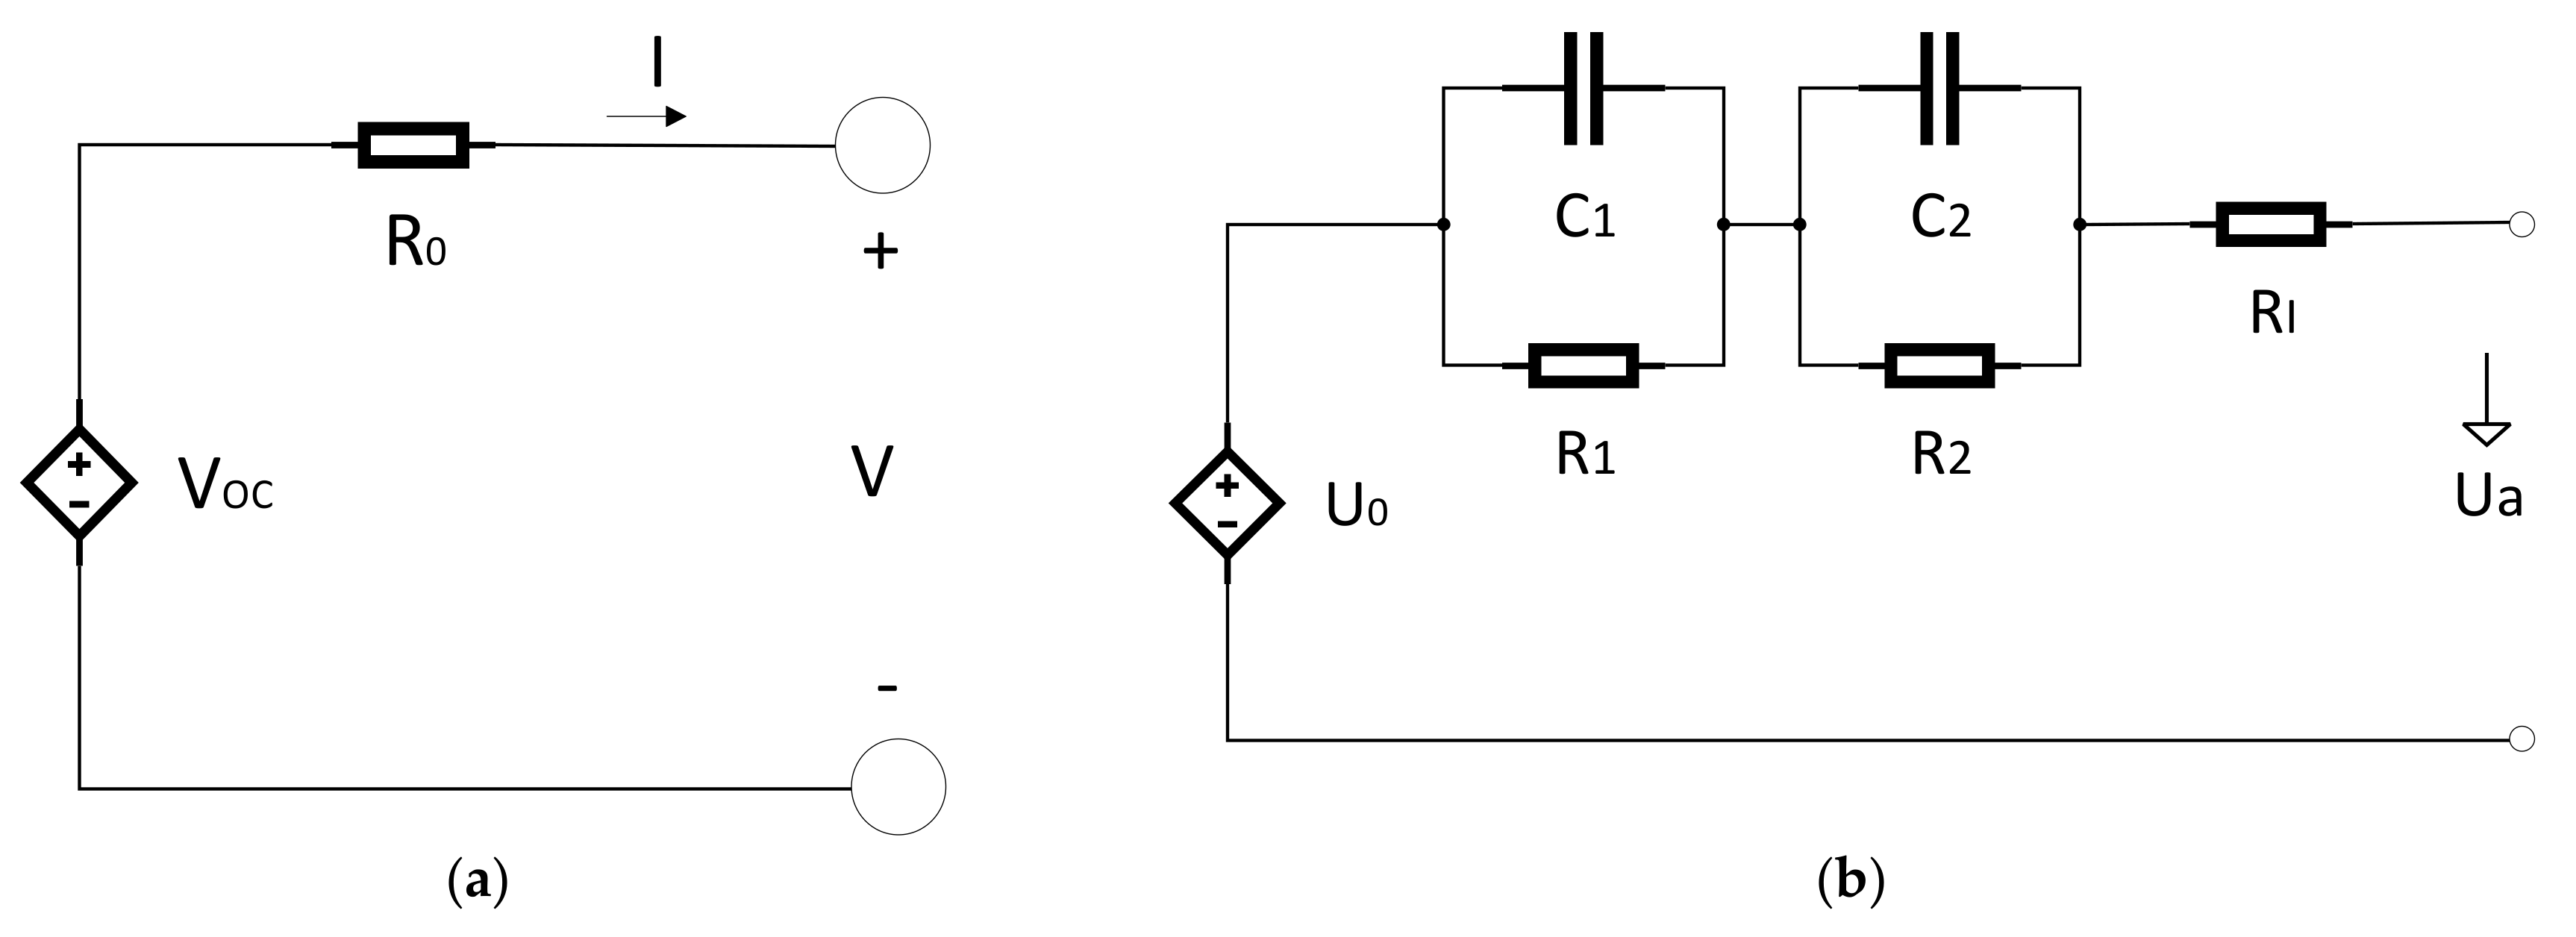
Internal resistance model is shown in Figure 1. Battery terminal voltage can be calculated by the equation:
where V: Battery voltage; VOC: Open-circuit voltage; R0: Internal resistance; I: Battery output current.
By employing electrochemical impedance spectroscopy (EIS), equivalent electric circuit model parameters could be extracted. Equivalent circuit model of a battery is illustrated in Figure 1, which consists of the following parts [9,10]:
- (1)
- R1, R2: Charge-transfer resistances
- (2)
- C1, C2: Interfacial capacitances
- (3)
- RI: Ohmic resistance
The internal resistance is a very important parameter for battery electrical and thermal modeling. In the following part several ways for internal resistance determination is introduced.
3. Internal Resistance
Internal resistance is one of the most important parameters, which characterize the performance of lithium ion batteries in automotive utilizations. Precise knowledge of internal resistance is essential for the determination of energy efficiency, power, and lost heat of a lithium ion cell. The battery’s internal resistance is needed for energy efficiency calculation, dimensioning the battery system, power estimation, and for dimensioning the cooling system of the battery [10].
It is not simple to measure the internal resistance of a battery or single cell because it is a time dependent and nonlinear system and depends on SOC (state of charge) and temperature. In addition, its performance is also greatly dependent on the amplitude and measurement frequency [10]. The internal resistance of the battery is also a function of the procedure of determination and experimental situations and state of charge and battery temperature [10].
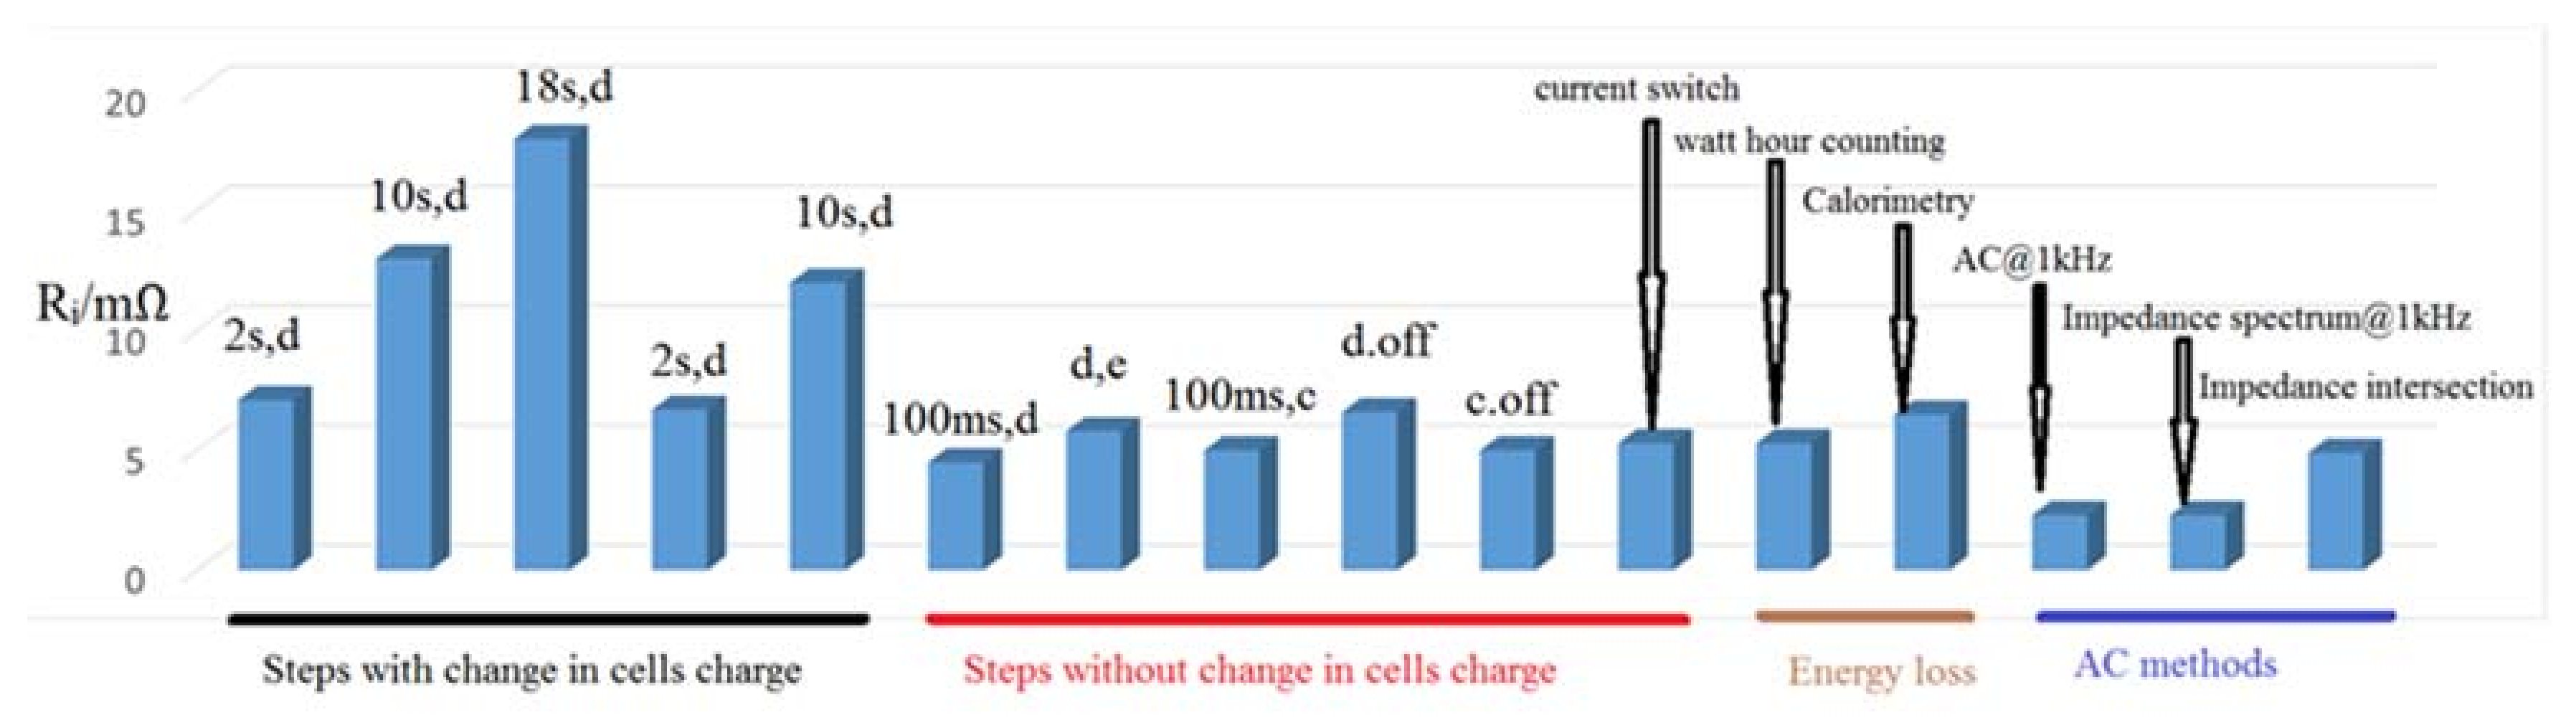
Hans-Georg Schweiger et al. [10] compared different methods for determining the internal resistance (Ri/mΩ) of lithium ion cells.
By employing VDA (Verband der Automobilindustrie) current step method [10] the calculated internal resistance (IR) is in direct proportion with pulse duration and current. This method is described in Table 1.The error of the internal resistance rises considerably with the reduction of pulse current [10]:
The measurement is 100 ms after the beginning of the current pulse and change of charge of the battery could be ignored in Optimized VDA Step Method [10].
Reducing Time, Advanced Method was used [10]. In this method by considering the gradient of the voltage during the pulse approximately linear, the internal resistance could be computed by extrapolating the voltage gradient to the start of the discharge pulse. A least square fitting of a linear curve is employed for this extrapolation. By employing this method, the effects of discharge or charge are efficaciously cancelled out [10].
Current-off method [10] was another method to cancel the effect of charge change. The internal resistance is measured by the voltage variation, which results from the switch off of the current and not measured at the chosen SOC of the cell. This might be a main disadvantage of this method if the internal resistance of the cell and SOC are considerably interdependent [10].
By employing current switch method [10] a discharge is instantaneously switched to charge. The principal advantage is the raised voltage, which is generated by the switch.
A constant current charge and discharge profile was selected for energy loss method [10] with the intention of the internal resistance measurement. The pulse duration was 5 s and current amplitude was selected 36 A. This profile was applied for 40 min. The accuracy of this method, was the same as the current step methods.
AC internal resistance is a quick method [10] with no degradation of the battery. A small damping current is generally employed for this kind of measurement, which limits the precision of the measurement method. The AC impedance of the cell and frequency are considerably interdependent.
Impedance spectroscopy was used [10]. In this method a frequency span between a few millihertz (mHz) to a few kilohertz (kHz) is frequently covered. This method demonstrates complete information about the behavior of the battery. There is no deformation by the measurement, which is a big benefit of this method. In addition, impedance spectroscopy needs costly equipment and the measurement takes a long time. Accordingly, this method is not appropriate for analyzing so many cells. It can be concluded that the internal resistances is in the span from 5 to 6 mΩ for step procedures without change of charge, intersection of the impedance spectrum, and energy loss methods. Therefore, these procedures are appropriate for the forecasting of the power ability and the losses of a lithium ultra-high power cells [10]. The result of internal resistance measurement with various procedures on the ENAX (ENAX Inc., Tokyo, Japan) “High Power Cell” type NX2P0M is illustrated in Figure 2. All measurements were performed at 25 °C and 60% SOC [10].
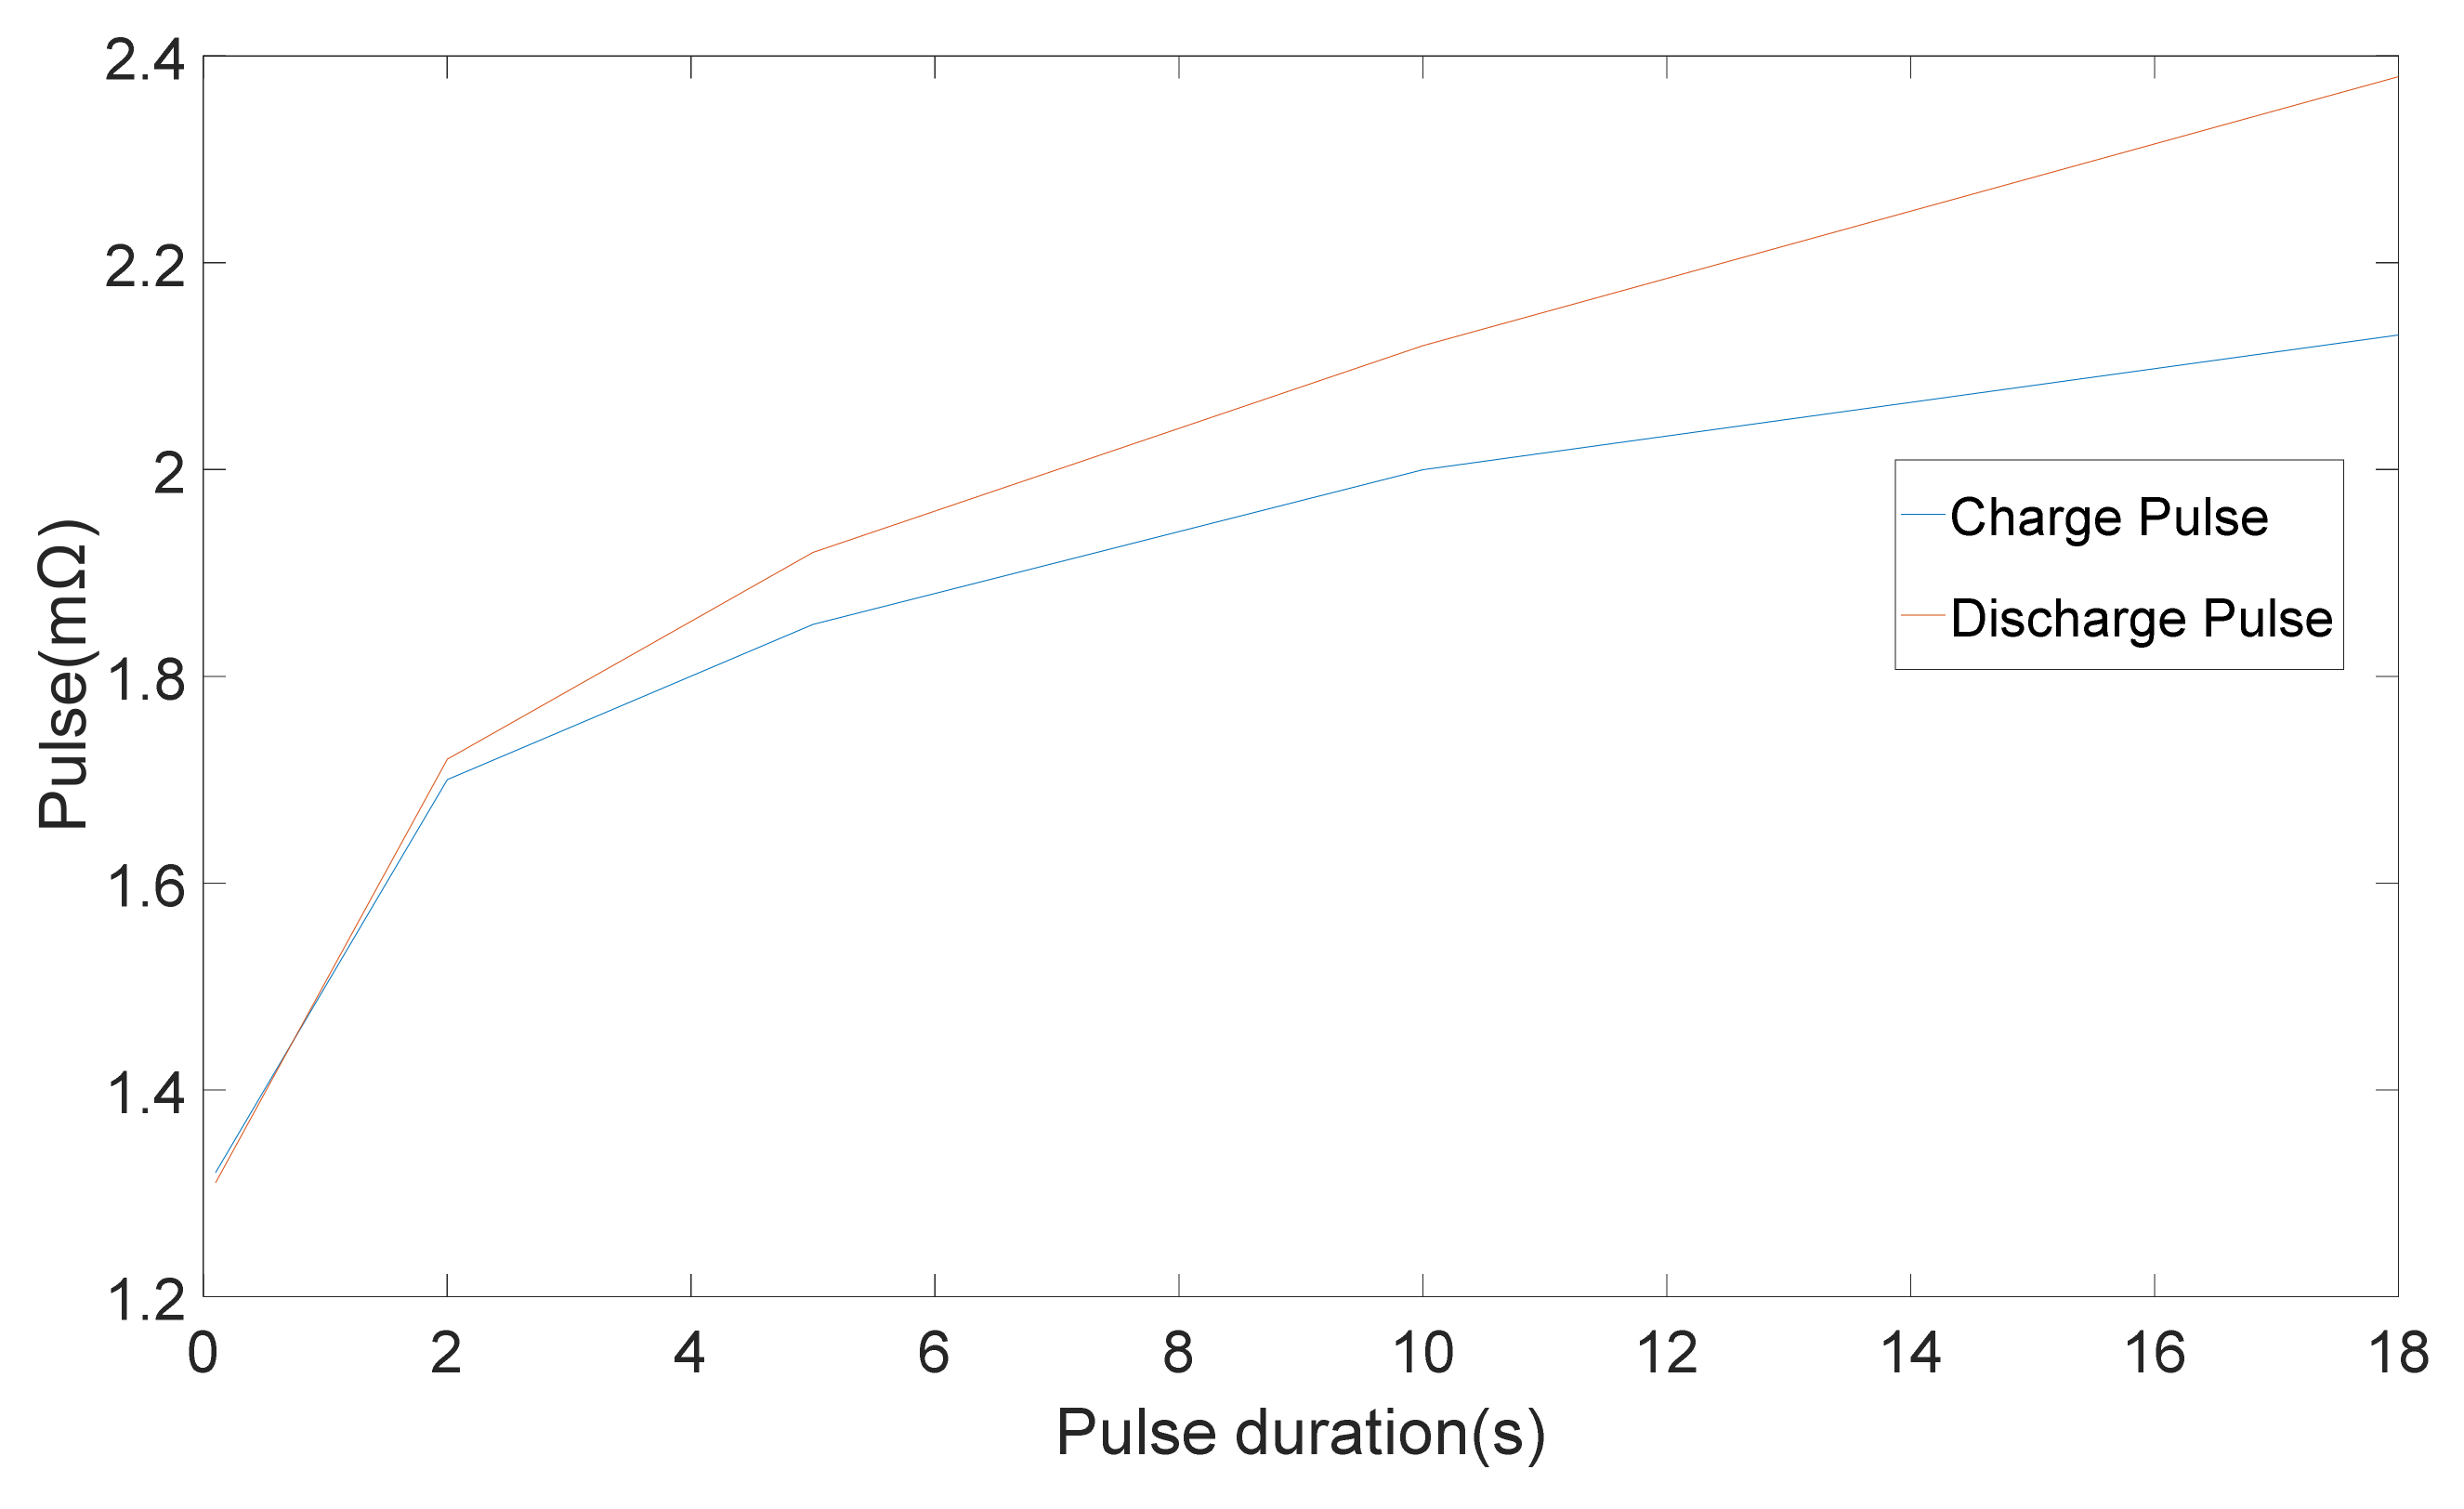
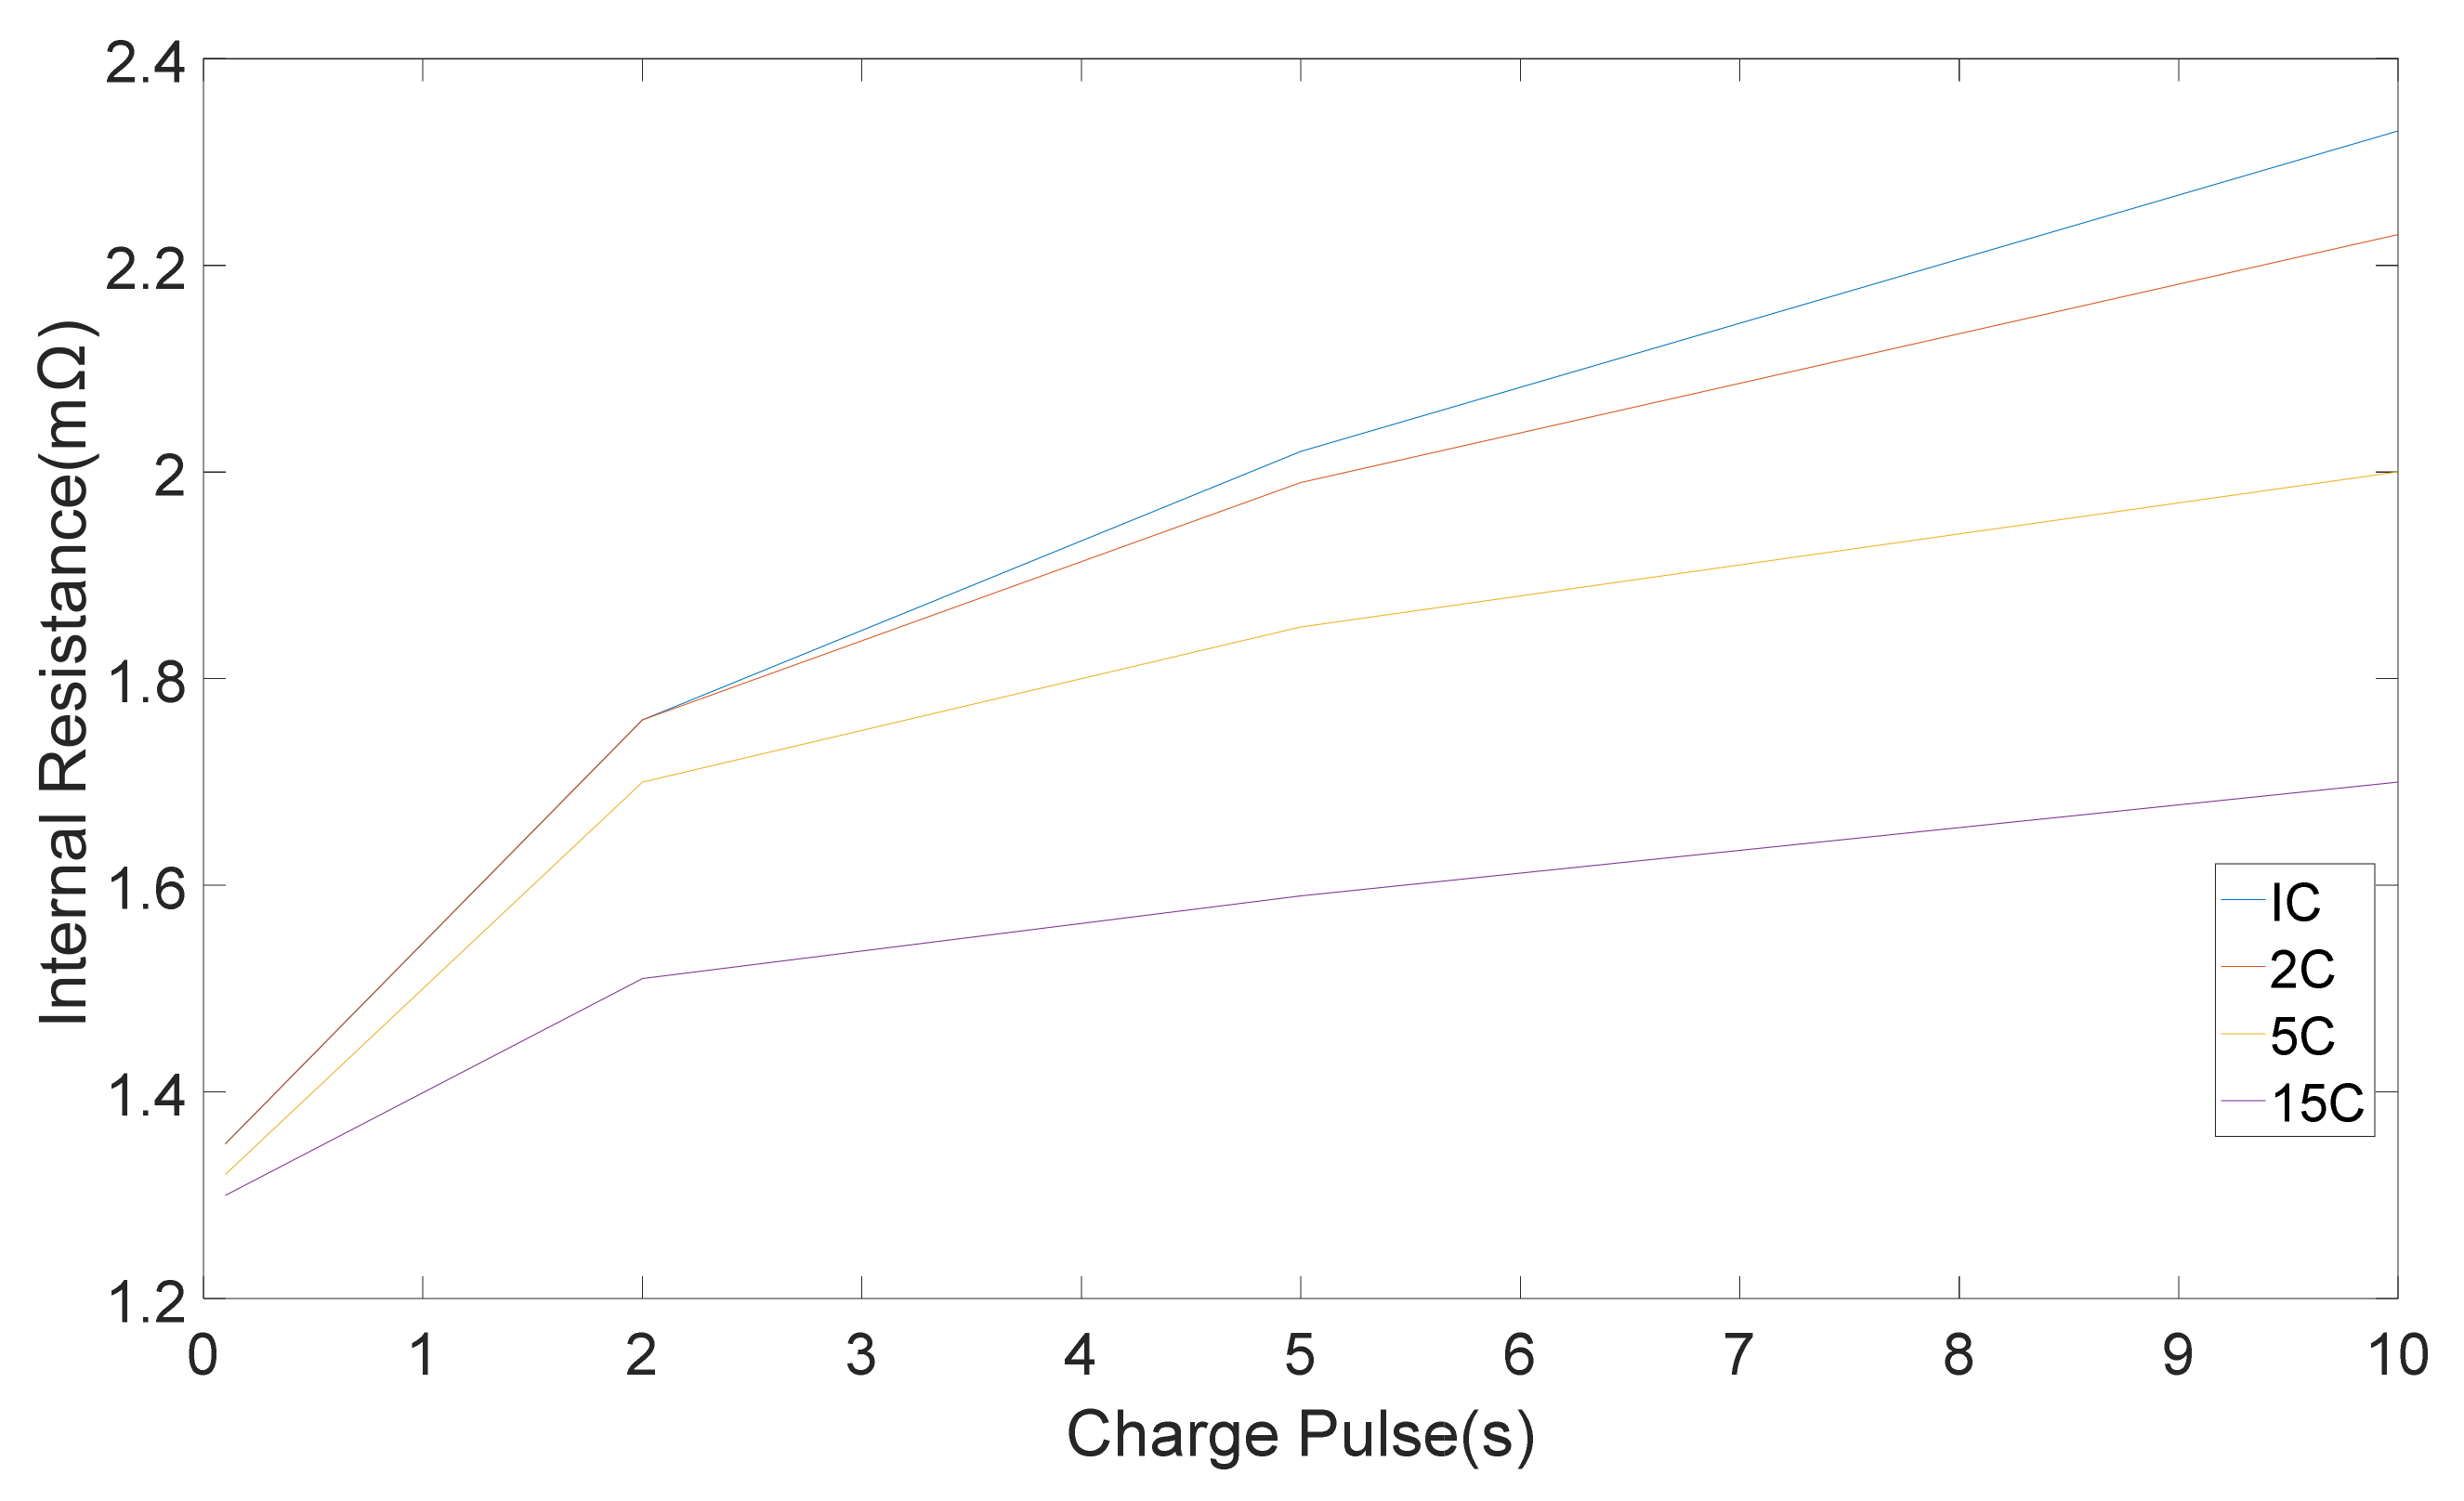
Different techniques were applied to 20 Ah LiFePO4/C6 pouch cells and the results were used to compare the techniques [11]. The outcomes demonstrated that the calculated resistance is greatly dependent on the timescales of the technique, which were employed [11]. Variation of internal resistance with pulse period is illustrated in Figure 3.
The internal resistances, which were computed from five discharge-charge pulses with different amplitudes is shown in Figure 4 and Figure 5 correspondingly. Standard deviation were 0.05, 0.03, 0.02, 0.01 mΩ for 1 C, 2 C, 5 C, 15 C correspondingly [11]. It can be seen that the pure ohmic resistance, which was computed from the 0.1 s voltage drop was same for all pulse amplitudes. Notwithstanding, the discrepancy in resistance amount which was computed at the end of 2, 5 and 10 s changes with discharge-charge rates [11]. The differences in the rate of resistance owing to pulse amplitudes are appertaining to the different electrochemical processes and the heat generation, which is accompanied with pulse currents [11].
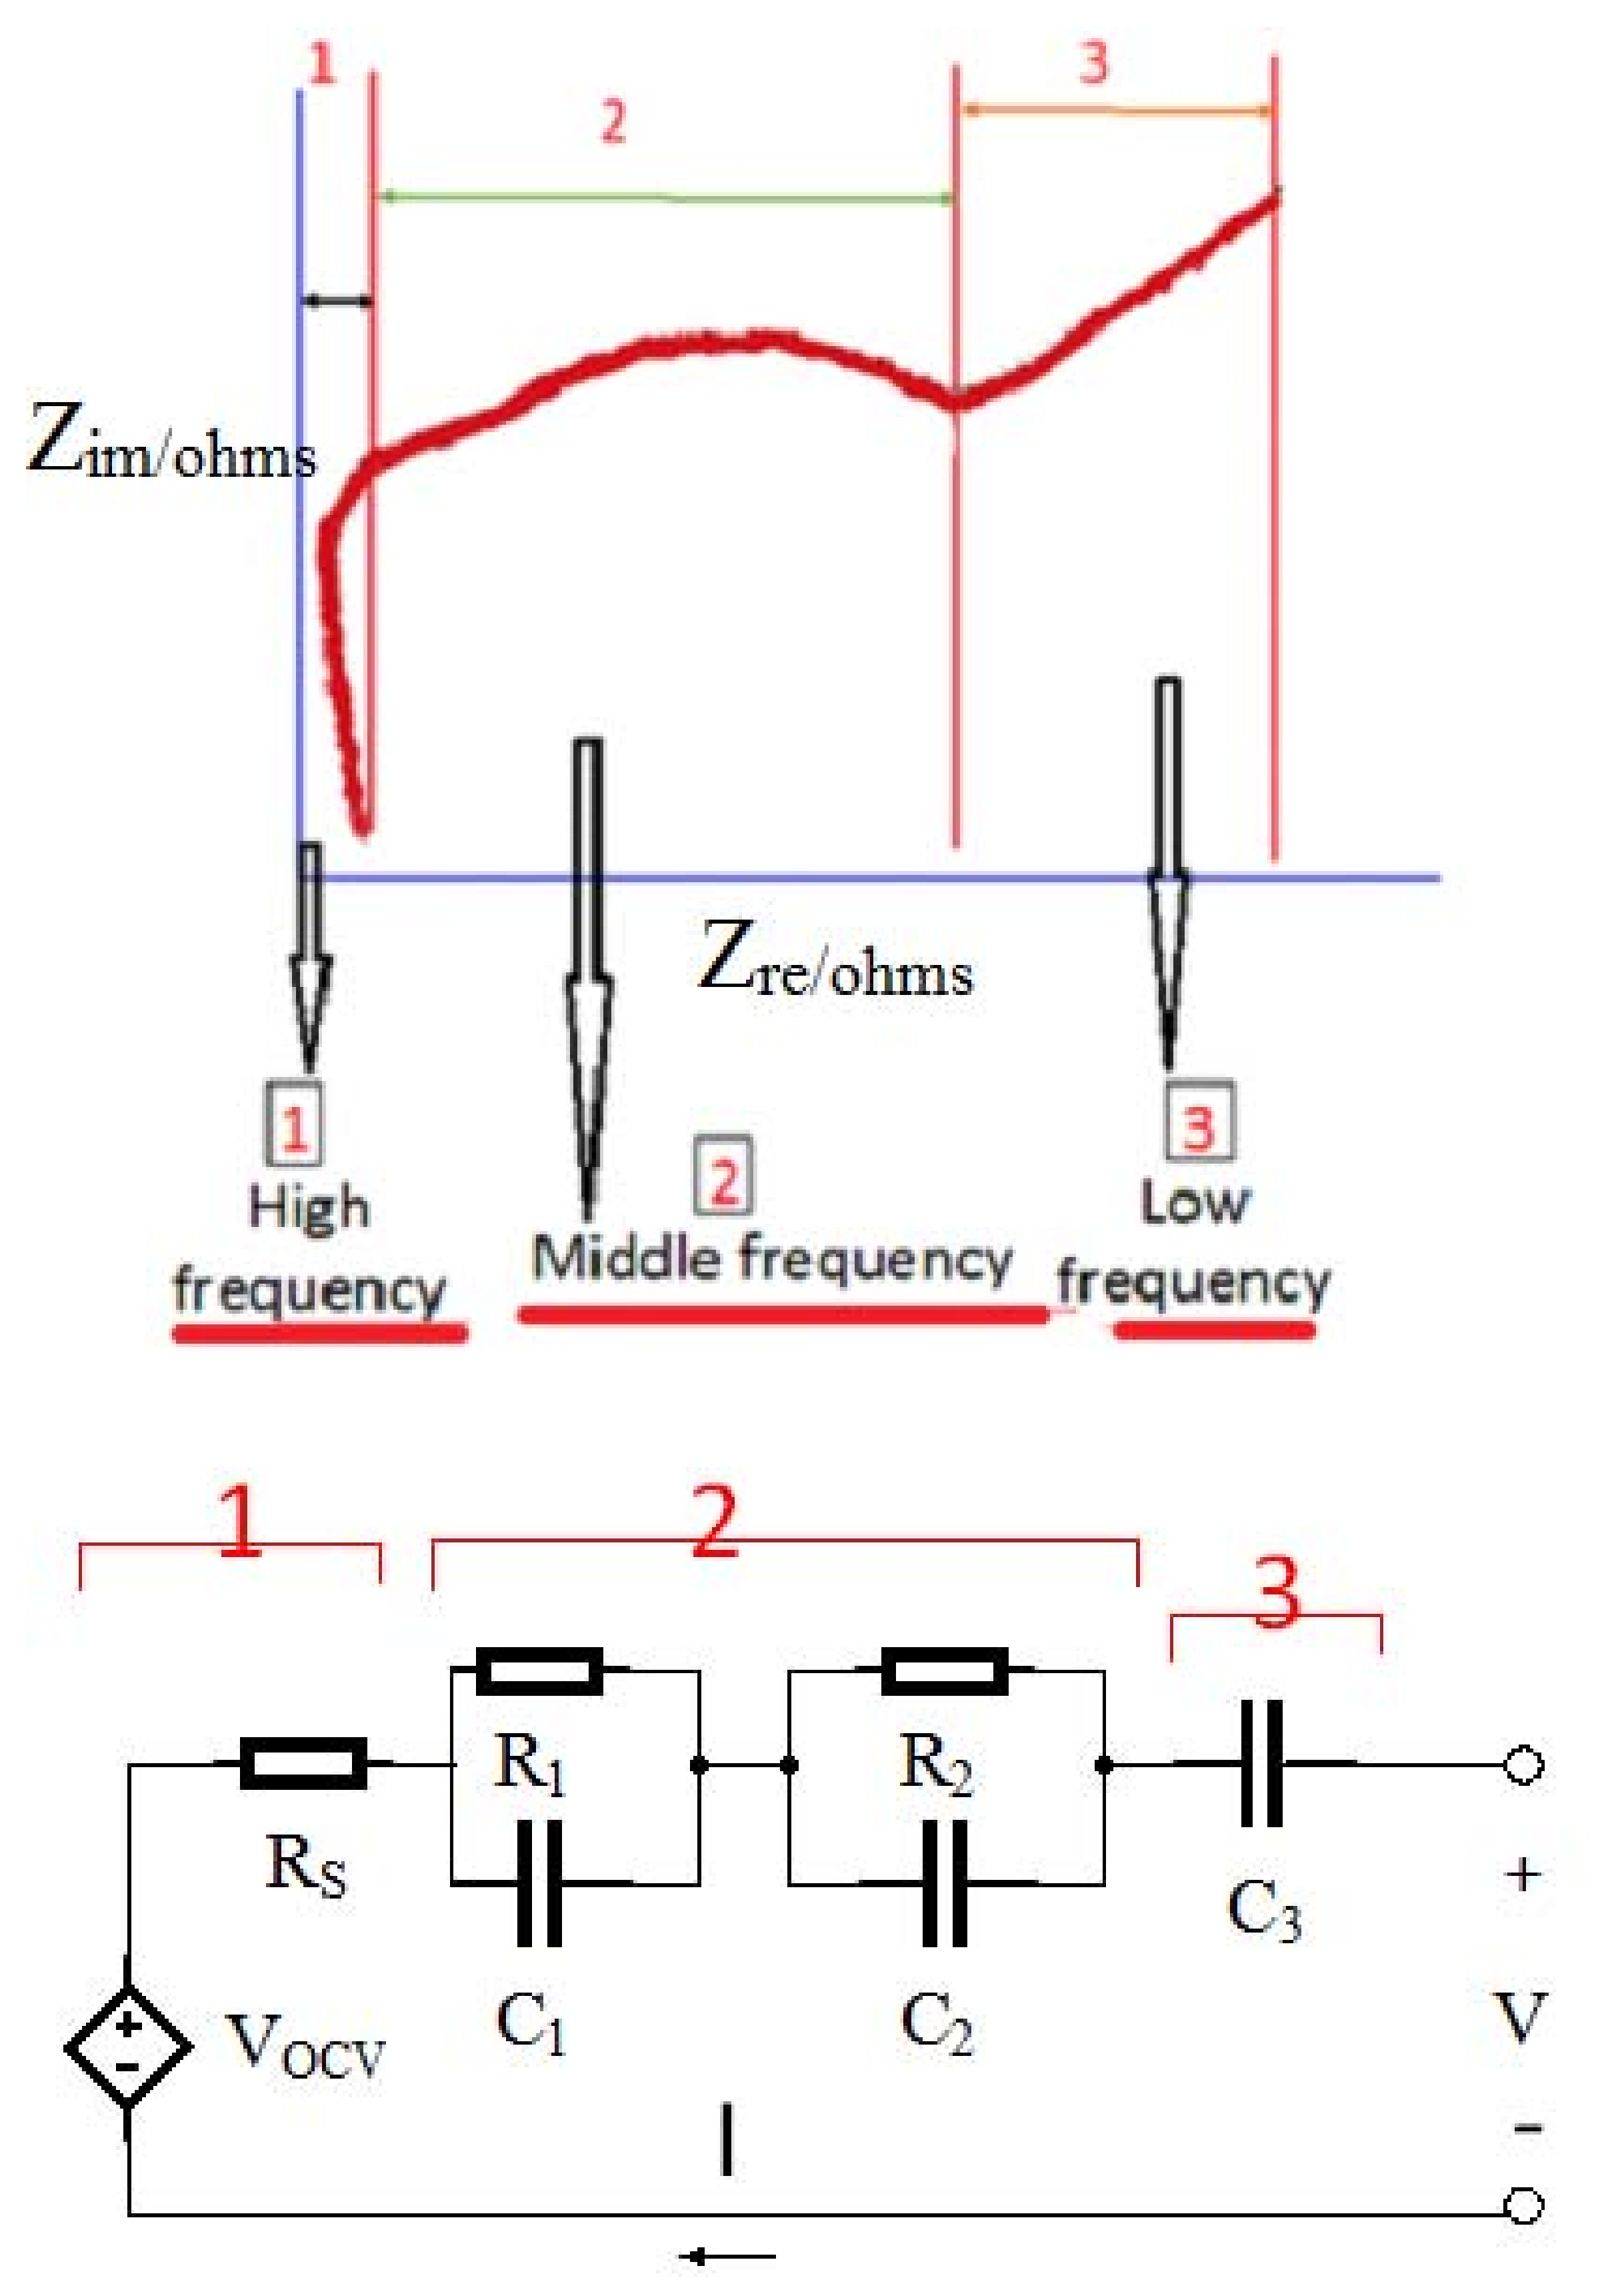
Electrochemical impedance spectroscopy (EIS) is one of the outstanding procedures to explain the dynamic characteristics of batteries [12]. In the EIS experiment, the sinusoidal AC signals with various amplitudes and frequencies were exerted to electrochemical systems, and the feedback signal in the frequency domain was achieved [13]. The ECM based on the EIS feedback of the Panasonic NCR18650 lithium-ion batteries (Kadoma, Japan) with a capacity of 2855 mAh and 60% SOC was measured in the frequency range between 5 mHz and 5 KHz. The results are shown in Figure 6. The graph consists of the following sections [13]:
- (1)
- High-frequency
- (2)
- Mid-frequency
- (3)
- Low-frequency section
where; Rs: Ohmic polarization; R1, C1: Concentration polarization of constant phase element; R2, C2: Activation polarization of constant phase element.
Several researchers defined the alteration of the battery voltage, which some parameters have been neglected in some studies [14]. There are also several other investigations for the determination of Ri for lithium ion batteries such as separated pulses, direct current resistance, area specific impedance, thermal behavior of a cell, and fast Fourier transformation technique [14]. Onda et al. accomplished a comparison of several measurement procedures. Various resistance measurement methods were compared which showed identical outcomes for mostly all of them [14].
4. Thermal Modeling
In the calculation of the energy balance, the temperature of the battery was presumed to be homogeneous all over. It was assumed that heat transfer with the surroundings, electrical work, mixing, phase changes, reactions, and changes in the heat capacity of the system determined the temperature changes over time. The heat source could be calculated from the simplified energy balance, which is formulated in the equation [15]
where I: Cell current; V: Cell potential; Uavg: Open circuit potential; : Absolute temperature; : Cell overpotential; : Polarization heat; : Reversible entropic heat.
5. Entropic Heat Coefficient
In order to understand the thermal behavior of a lithium-ion battery the heat generation within the cell should be determined. On the other side, the entropic heat coefficient (EHC) is needed to be determined for heat generation calculation. The EHC is one of the most important factors, which affects the magnitude of the reversible heat, notwithstanding; entropic heat can be the same as irreversible heat in order of magnitude [15].
Entropic heat coefficient or temperature coefficient is the potential derivative with respect to temperature [15]
EHC is a function of temperature and SOC levels, which can be either negative or positive. The effect of entropic heat, which can be exothermic or endothermic during charge and discharge processes, is shown in Table 2.
Different methods are employed to estimate EHC. However, potentiometry is the most common method. In this method, open circuit potential (OCP) experiments are carried out with the intention of determining the EHC as a function of SOC. The cell is discharged or charged to a specific SOC level and then is allowed to relax. The relaxation is accompanied by a thermal cycle [15].
Open circuit potential (OCP) method were employed for the determination of the entropic heat coefficient as a function of SOC [15].
The heat generation measurements were assumed to be in adiabatic conditions. Therefore, heat losses by radiation and convection could be disregarded. It was assumed that the surroundings and cell surface temperature were almost the same. Furthermore, it was assumed the heat conduction from surface and cell tabs to the connection wires and holder was ignorable [15]. The following expressions were used [15] for the determination of energy balance in the lithium-ion cell
where M: Cell mass; T: Absolute temperature; I: Cell current; : Average heat capacity; : Entropic heat coefficient; : Internal resistance.
Open circuit potential (OCP) experimentations were accomplished with the intention of determination of the entropic heat coefficient as a function of SOC [15]. The cell was discharged or charged to a specific SOC and then was allowed to relax. The relaxation was accompanied by a thermal cycle. In order to corroborate the independence of the outcomes with the thermal cycle, experimentations were done by employing another thermal cycle, which is shown in Table 3.
Observations about previous investigations demonstrate that entropic heat was exerted to the thermal models [15,16], some of which are illustrated in Table 4.
In some studies, EHC was not considered in the thermal modeling. Reference [17] used a mathematical model was used to anticipate the temperature of a lithium-ion cell (LixC6/LiyNiO2) during high-rate and medium discharge situations. The anticipated results demonstrated that the particle dimension in the negative electrode (petroleum coke) is a significant parameter for anticipating the temperature of the cell. Reference [18] presented a model for the lithium/polymer/insertion cell (LilPEO15-LiCF3SO3ITiS2). It was concluded that the heat-generation rate of the cell reduces with raising temperature. Reference [19] used a 1D electrochemical, lumped thermal model to analyses thermal behavior and pulse power restrictions of a lithium ion hybrid-electric vehicle (HEV) battery pack. It was concluded that solid-state diffusion was the restricting mechanism.
In some research, EHC was considered constant in the thermal modeling. Reference [20] presented a mathematical model of transport and heat generation in lithium/polymer-electrolyte batteries for EV applications. The outcomes showed that thermal management might not be a critical issue for batteries under low discharge rates conditions. Notwithstanding, under big discharge rates conditions, the battery temperature might increase extraordinarily on the occasion that the thickness of a cell exceeds a specified amount. Reference [21] developed a mathematical model to analysis thermal management and heat transfer of lithium polymer batteries. The simulated result, which was accomplished by using the electrochemical–thermal model, demonstrated an appropriate agreement with the experimental measurement. Reference [22] used a mathematical model to investigate thermal behavior of lithium-ion batteries during thermal runaway and discharge/charge. The modeling outcomes demonstrated that during normal battery functioning, temperatures of the battery are farfetched to attain the beginning temperature for thermal runaway. Reference [23] developed a two-dimensional thermal model to construct a standard for the simulation of spirally wound cells. It was concluded that constructing an airflow parallel to the cylinder axis was efficient to overcome the surface temperature. Nevertheless, the warmest temperature within a battery remains high on the occasion that a battery has a big radius. Reference [24] performed thermal analysis of lithium solid polymer electrolyte batteries with the intention of holding functioning temperature by sketching an appropriate battery structure, selecting a proper insulating, and cooling scheme. It was concluded that under high discharge rate condition, in order to minimize temperature gradients and to barricade battery temperature from climbing remarkably, cell stacks, which have small thickness, might be preferred. Notwithstanding, under low discharge rate condition, the thermal management issue is to selecting conventional insulating materials. Reference [25] simulated a three-dimensional model of the thermal behavior of a lithium polymer electrolyte battery. The simulation was performed under simplified federal urban driving schedule (SFUDS) power profile and constant-current discharge conditions. It was concluded that steep temperature distributions among a cell stack might occur on the assumption that the two ends of a cell stack is exposed to forced air convection [25].
In some research, EHC was not reported in the thermal modeling. Reference [26] studied the effect of the electrode arrangement on the thermal behavior of a lithium-polymer battery by using a thermal modeling. The modeling methodology, which was introduced in this research, produced a comparatively simpler modeling method as compared to the formerly research papers, which might contribute to improving the scheme of the electrode arrangement. Reference [27] developed a mathematical procedure for the scale-up of a lithium-ion polymer battery by using the finite element method. The modeling methodology, which was presented in this research, produced a comparably simpler modeling approach than in former investigations, which might contribute to the scale-up of the lithium-ion polymer battery and improvement of the electrode arrangement. Reference [28] presented a review of mathematical models of nickel and lithium battery systems, which were developed at the University of South Carolina. Reference [29] proposed a method for determining partial differential equations. This model is able to model a battery system, which includes a large number of cells. In addition, it can concurrently treat the current and temperature distributions.
In some research, EHC was linear between two SOC measurements in the thermal modeling. Reference [30] used a simplified one-dimensional thermal mathematical model with lumped parameters for the purpose of simulating temperature profiles within lithium-ion cells. Outcomes demonstrated an intense effect of the cooling rate on the temperature of cell for all discharge rates. Notwithstanding, at higher cooling rates a considerable temperature gradient was seen inside the cell.
In some research, EHC was nonlinear function of SOC in the thermal modeling. Reference [31] presented a 2D, coupled, thermal-electrochemical modeling for a manganese oxide spinel/carbon cell. The modeling was based on the local heat generation procedure. It was seen that at higher rates, the non-uniform reaction distribution in the porous electrode was considerable. Reference [32] presented a thermal model for a lithium-ion cell to anticipate discharge efficiency at various operating temperatures. The outcomes from the simulations were compared to experimental data. Reference [33] performed isothermal calorimetry on LiLiPF6 in ethylene dimethyl carbonate cells. Heat generation simulations were compared to the calorimetry measurements. Comparison showed that the entropic heat accounts for much of the heat generation rate. It was concluded that while the open-circuit potential changed abruptly with lithium concentration the rate of irreversible heat generation was bigger. Reference [34] measured heat transfer coefficient, heat capacity, overpotential resistance, and entropy change by using small lithium-ion batteries. It was concluded that the resistance which was measured by AC impedance was different with the other methods such as V–I characteristics, intermittent charge/discharge, and the resistance by difference between open-circuit voltage and cell voltage.
6. Specific Heat Capacity
Specific heat capacity is one of the most significant thermophysical properties of lithium ion batteries. It is indispensable for the appropriate modeling of a thermal management design. Therefore, accurate measurement of lithium ion batteries heat capacity is very important. Layered internal structure is one of the characteristics of lithium ion batteries and therefore it is challenging to measure its heat capacity precisely. Because electrochemical reactions occur in battery, variations in the battery temperature during experimenting could lead to incorrect heat generation characterization [35].
Both experimental and computational methods have been utilized to specify the specific heat capacity of a battery [35]. Between two methods, computational methods [35] are the most straightforward procedure. Different experimental and computational methods which were used by some researchers are shown in Table 5. The influence of bulk temperature and SOC on the specific heat capacity of lithium cells are shown in Table 6.
Different methods which were used for thermal conductivity measurement are shown in Table 7.
Thermal conductivity plays an important role in battery performance. A detailed experimental procedure and analysis is needed to measure the value of these parameters and to study how it varies with the cell operating conditions [35].
Several researchers [36] employed thermal impedance spectroscopy (TIS) which is a procedure to find thermophysical properties of a battery. In this method, in response to current pulses at different frequencies the specific heat capacity is approximated from a Nyquist plot of the cell’s surface temperature. M. Swierczynski [36] introduced primary measurements of the multipoint electrothermal impedance spectroscopy (ETIS) method, which is a generalization of the single point method. The outcomes of this method can be employed for characterizing heat conductivities and local thermal capacities in the 2D ETC-based battery thermal model. Frequency-based ETIS measurement was performed on the LiMO2/Li4Ti5O12 battery. Outcomes from the frequency-based ETIS procedure is illustrated in Figure 7. To measure the battery surface sinusoidal temperature feedback a small frequency sinusoidal shaped heat excitation signal was exerted on the battery [36].
Hossein Maleki and his colleagues [37] measured thermal property data of the Sony US-18650 lithium-ion battery (Tokyo, Japan) experimentally. They employed cooling transient and adiabatic calorimetry methods and concluded that the heat capacity of this battery is dependent on its state of charge and rises by 8% as OCV varies from 2.75 to 3.75 V. All experimentations are carried out by employing (hot bath/room-temperature cell) method. They concluded that heat capacity of the battery (Cp) increases with increase in OCV.
7. Thermal Conductivity
Thermal conductivity is a thermophysical parameter which affects the thermal performance of a lithium ion battery. Thermal conductivity, k, is the intrinsic property of a material to conduct heat. The ability to do so depends on the availability of free electrons within the material and the degree to which it possesses a crystalline structure. Due to the layered construction of a pouch cell, the thermal conductivity is highly orthotropic.
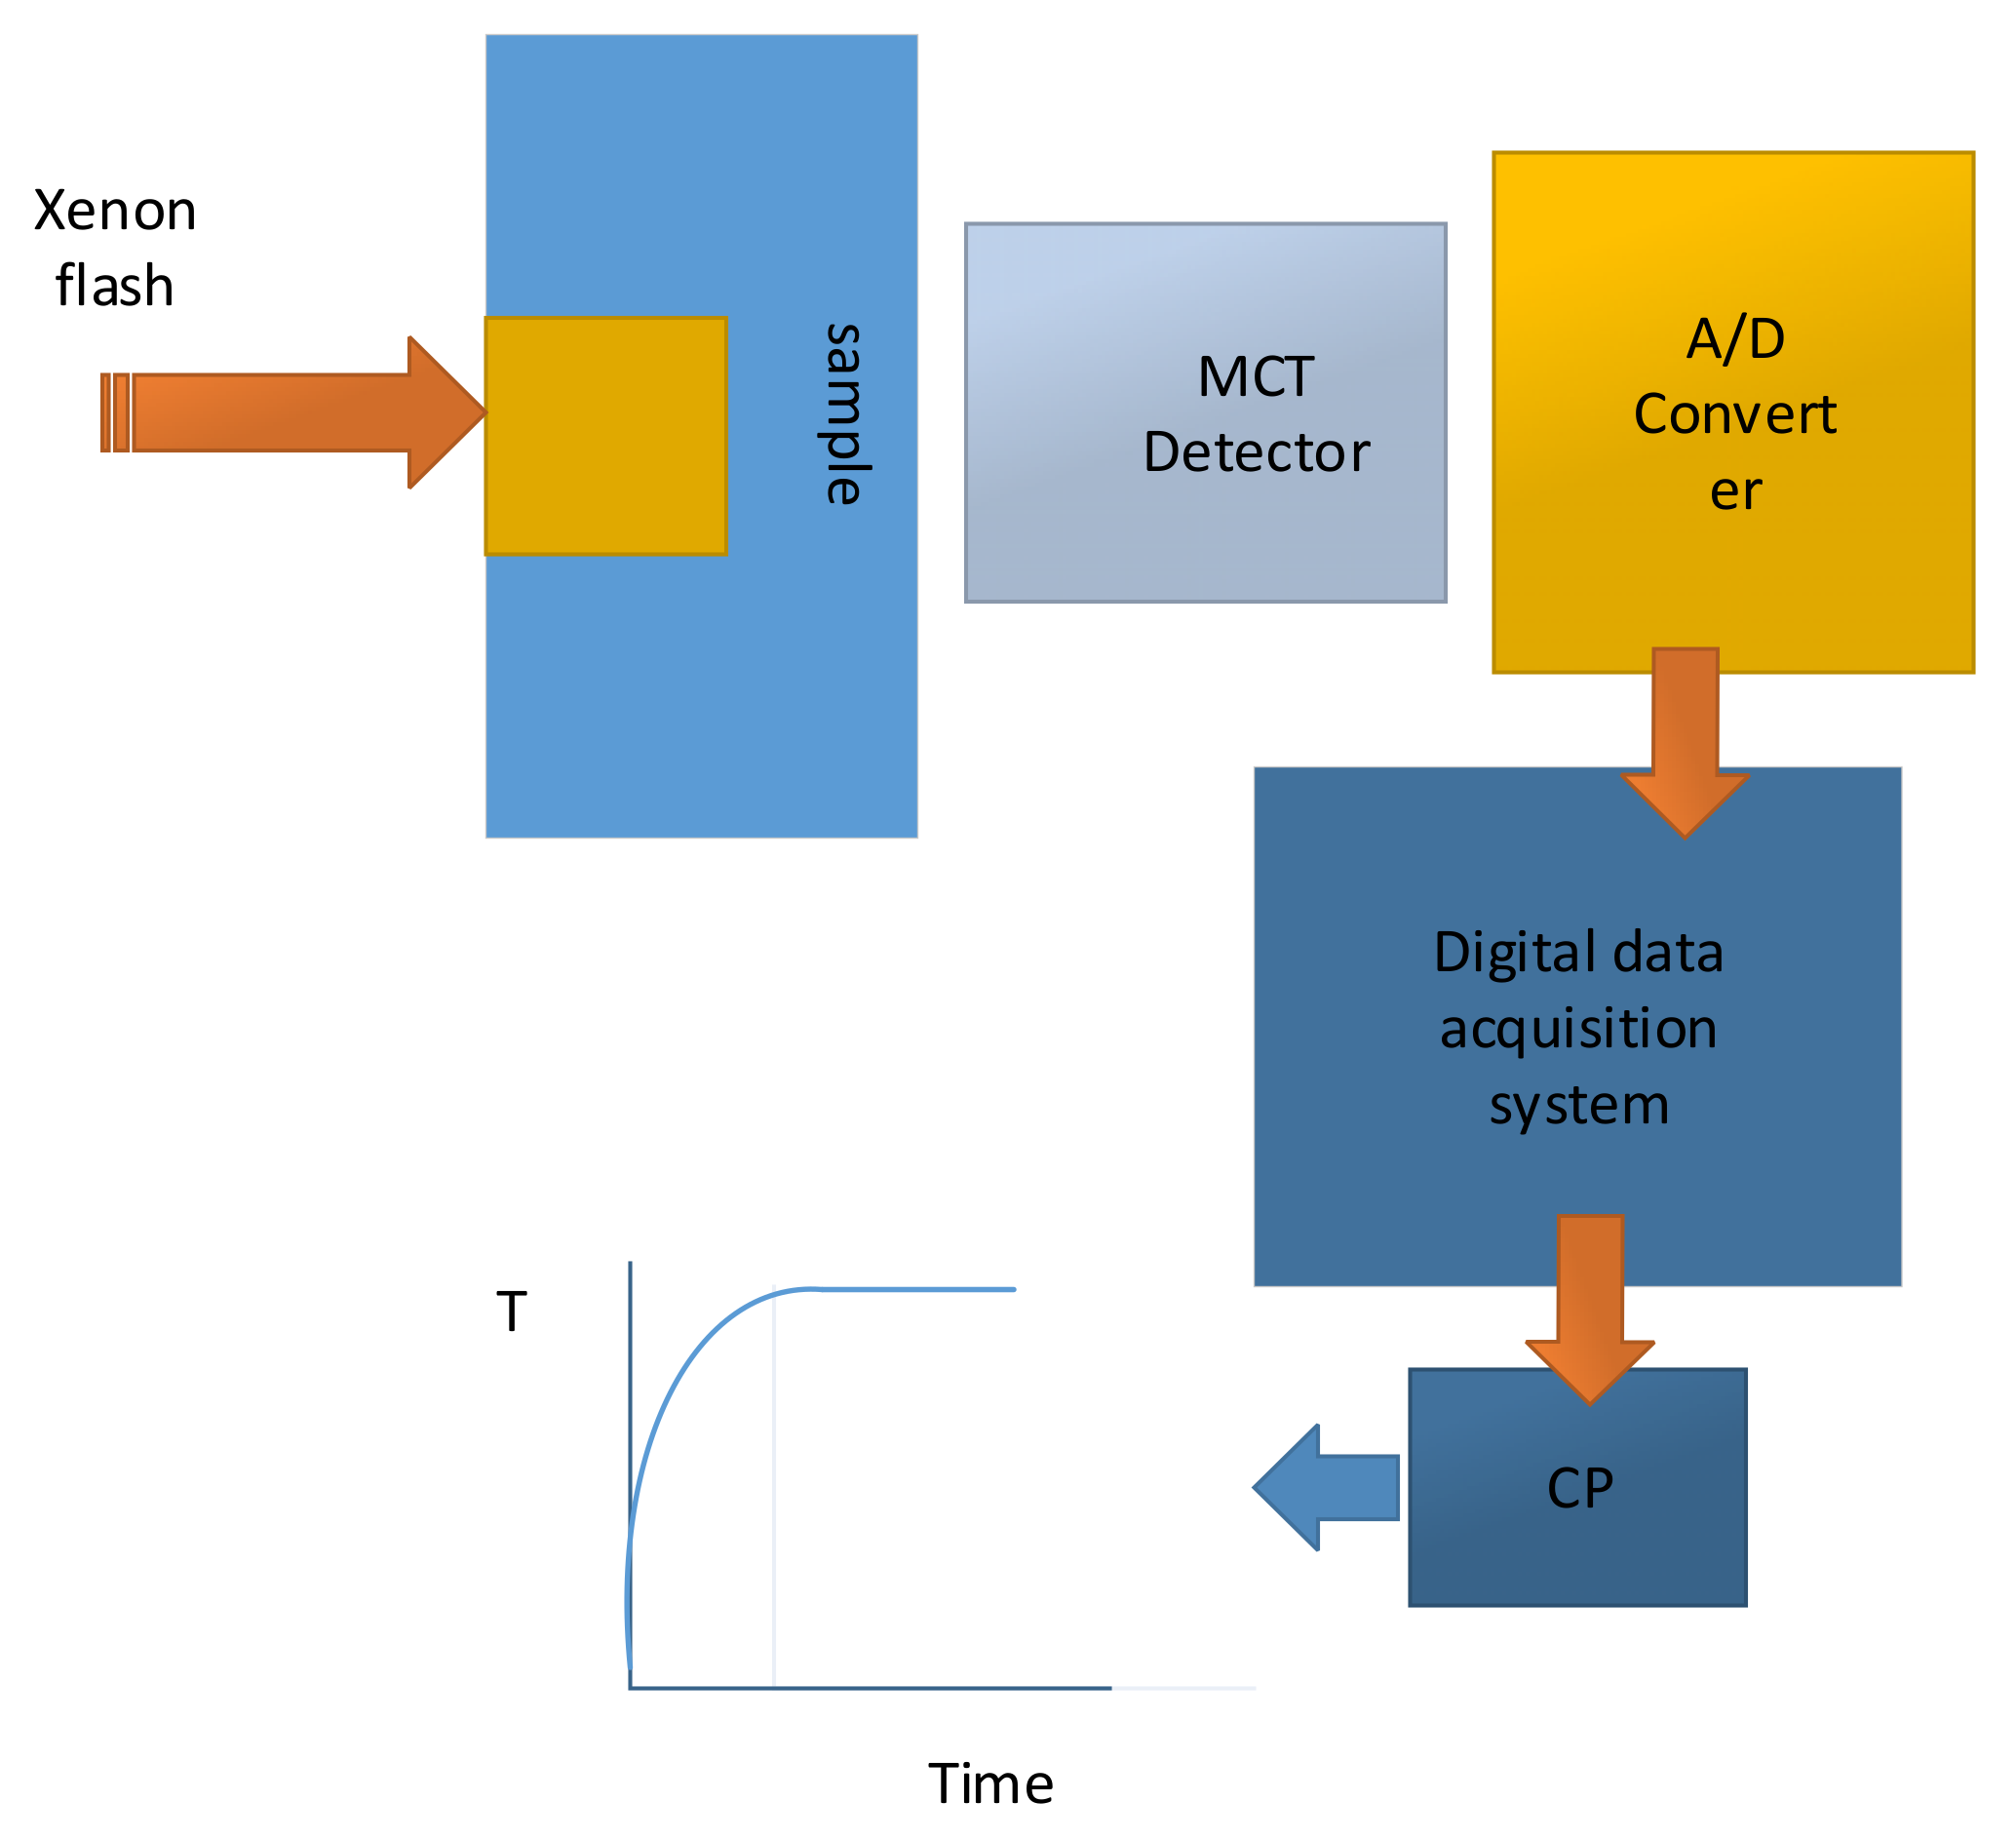
Hossein Maleki and his colleagues [37] employed direct steady-state measurement and thermal diffusivity measurement. The thermal conductivity, k, was calculated from k = αρCp where α was measured by a xenon-flash technique.
Figure 10 illustrates the experimental assembly, which were used to directly measure the thermal conductivity of composite stacked layers of the different components of the battery layers by employing a heat flux, which is perpendicular to the plane of the layers [37].
Figure 11 illustrates thermal conductivity measurement setup, which shows schematic drawing of xenon flash experimental arrangement [37].
Thermal diffusivity of a stack of cell components were measured by using the xenon flash facilities. In the xenon flash technique (XFT) method, the frontal surface of disk-shaped cases is exposed to a small pulse of a xenon flash lamp. The temperature increase at the back surface of the case is measured as a subordinate of time by a photopyrometer. Thermal diffusivity is calculated from the equation [37]
where L: Sample thickness; : Thermal diffusivity; : Half-time of the maximum temperature increase at the back surface of the case.
They concluded that the dependency of the NE material on the state of charge is more than that of the PE material. The attendance of electrolyte rises the thermal conductivity of the stacked layers of PE/Sp/NE by approximately 55–70% and omits the OCV dependency. The in-plane thermal conductivity of stacked layers of battery ingredients is higher than the cross-plane conductivity by approximately a factor of 10 [37].
A new procedure to determine the thermal parameters of a pouch cell has been introduced [38]. Gradient heat flux sensors was used for the determination of the specific heat capacity and through-plane thermal conductivity. Local heat flux measurement was able to determine thermal parameters in various surface points of the cell [38]. The conventional thermal characterization procedure was compared with the experimental results. It was concluded that errors for the thermal conductivity and the specific heat capacity were 0.58% and 3.8% correspondingly, which are satisfactorily low errors [38].
Murashko et al. [38] proposed a method with local heat flux measurements, which was utilized to characterize the specific heat capacity and thermal conductivity of a pouch cell. Correspondingly, the method presented by Christen [39] is comprised of the contemporaneous acquisition of local heat flux density and temperature. Furthermore, this procedure allows both quantities to be controlled, which enables the reproduction of different packaging conditions.
Frank Richter and his colleagues [40] reported thermal conductivity and internal temperature profiles for commercial battery components. They concluded that by inserting the electrolyte solvent the thermal conductivity of electrode materials was increased by at least a factor of 2.
In another study by Frank Richter and his colleagues [41], they measured thermal conductivity and ageing in a secondary NMC-hard carbon lithium ion battery and the influence on internal temperature profiles. Their model demonstrated that the internal temperature could increase by a factor about 2.5 throughout ageing from the state of health at 100–58% capacity.
8. Conclusions
Different procedures for the measurement of internal resistance of lithium ion batteries were introduced with the intention of determination of the internal resistance. Outcomes demonstrated that decreasing the pulse amplitude results in unacceptable big measurement inconclusiveness. Notwithstanding, this inconclusiveness could be in an allowable scope by employing high current pulses and employing the voltage after the beginning of the current pulse which is used for determining the internal resistance. The result of internal resistance measurement is not dependent on the sign of the current. Furthermore, it is not dependent on which voltage difference is used, which is at the beginning or ending of the current pulse. It was concluded that both current step and energy loss procedures give the same outcomes for internal resistance. The fast step and the energy loss procedures offer the same results, these methods are appropriate for the measurement of internal resistance for several applications such as constructing the battery system, comparing and choosing cells, energy efficiency, designing the batteries’ cooling systems. The result and procedure of quasi-adiabatic battery calorimeter measurement was the same as the electric energy loss method. Heat capacity and dissipated energy were two important parameters in this method. Because the potentiometric method was the simplest method, it was used for the calculation of entropic heat coefficient. Different thermal cycles were applied to the battery and the close results were achieved. Consequently, the independence of the outcomes from the thermal cycle was corroborated. Thermal properties measurement of the Sony US-18650 lithium-ion battery was introduced. The dependency of the thermal conductivity of the NE material on the state of charge is more than the PE material which is due to phonon and electronic contributions to heat capacity and thermal conductivity. The cross-plane conductivity of the battery stacked layers components is less than the in-plane thermal conductivity. This discrepancy may be because of the presence of the metallic current collectors.
Author Contributions
Seyed Saeed Madani proposed the idea of the paper; Seyed Saeed Madani wrote the paper; Erik Schaltz provided suggestions on the content and structure of the paper; Søren Knudsen Kær and Erik Schaltz has been reviewing the draft manuscripts.
Conflicts of Interest
The authors declare no conflict of interest.
References
- Tian, C.; Lin, F.; Doeff, M.M. Electrochemical Characteristics of Layered Transition Metal Oxide Cathode Materials for Lithium Ion Batteries: Surface, Bulk Behavior, and Thermal Properties. Acc. Chem. Res. 2018, 51, 89–96. [Google Scholar] [CrossRef] [PubMed]
- Li, L.; Ma, Y.; Wang, W.; Xu, Y.; You, J.; Zhang, Y. A thermal and electrochemical properties research on gel polymer electrolyte membrane of lithium ion battery. J. Phys. Chem. Solids 2016, 99, 159–166. [Google Scholar] [CrossRef]
- Todorov, Y.M.; Aoki, M.; Mimura, H.; Fujii, K.; Yoshimoto, N.; Morita, M. Thermal and electrochemical properties of nonflammable electrolyte solutions containing fluorinated alkylphosphates for lithium-ion batteries. J. Power Sources 2016, 332, 322–329. [Google Scholar] [CrossRef]
- Nissing, D.; Mahanta, A.; van Sterkenburg, S. Thermal Model Parameter Identification of a Lithium Battery. J. Control Sci. Eng. 2017, 2017, 9543781. [Google Scholar] [CrossRef]
- Murashko, K.A.; Mityakov, A.V.; Mityakov, V.Y.; Sapozhnikov, S.Z.; Pyrhonen, J. Heat flux based method for determination of thermal parameters of the cylindrical Li-ion battery: Uncertainty analysis. In Proceedings of the 2017 19th European Conference on Power Electronics and Applications (EPE’17 ECCE Europe), Warsaw, Poland, 11–14 September 2017. [Google Scholar]
- Ruan, H.; Jiang, J.; Ju, Q.; Sun, B.; Cheng, G. A reduced wide-temperature-range electro-thermal model and thermal parameters determination for lithium-ion batteries. Energy Proc. 2017, 105, 805–810. [Google Scholar] [CrossRef]
- Zhang, J.; Wu, B.; Li, Z.; Huang, J. Simultaneous estimation of thermal parameters for large-format laminated lithium-ion batteries. J. Power Sources 2014, 259, 106–116. [Google Scholar] [CrossRef]
- Murashko, K.; Pyrhonen, J.; Laurila, L. Three-dimensional thermal model of a lithium ion battery for hybrid mobile working machines: Determination of the model parameters in a pouch cell. IEEE Trans. Energy Convers. 2013, 28, 335–343. [Google Scholar] [CrossRef]
- Rahmoun, A.; Biechl, H. Modeling of Li-ion batteries using equivalent circuit diagrams. Prz. Elektrotechniczny 2012, 2, 152–156. [Google Scholar]
- Schweiger, H.G.; Obeidi, O.; Komesker, O.; Raschke, A.; Schiemann, M.; Zehner, C.; Gehnen, M.; Keller, M.; Birke, P. Comparison of several methods for determining the internal resistance of lithium ion cells. Sensors 2010, 10, 5604–5625. [Google Scholar] [CrossRef] [PubMed]
- Barai, A.; Uddin, K.; Widanage, W.D.; McGordon, A.; Jennings, P. A study of the influence of measurement timescale on internal resistance characterisation methodologies for lithium-ion cells. Sci. Rep. 2018, 8, 1–13. [Google Scholar] [CrossRef] [PubMed]
- Buller, S.; Thele, M.; de Doncker, R.W.; Karden, E. Impedance-Based Simulation Models of Supercapacitors and Lithium-ion Batteries for Power Electronic Applications. IEEE Ind. Appl. Mag. 2005, 11, 742–747. [Google Scholar] [CrossRef]
- Yang, Q.; Xu, J.; Cao, B.; Li, X. A simplified fractional order impedance model and parameter identification method for lithium-ion batteries. PLoS ONE 2017, 12, 1–13. [Google Scholar] [CrossRef] [PubMed]
- Pi, G.; Marongiu, A.; Drillkens, J.; Sinhuber, P.; Uwe, D. Review article A critical overview of definitions and determination techniques of the internal resistance using lithium-ion, lead-acid, nickel metal-hydride batteries and electrochemical double-layer capacitors as examples. J. Power Sources 2015, 296, 365–376. [Google Scholar]
- Nieto, N.; Díaz, L.; Gastelurrutia, J.; Alava, I.; Blanco, F.; Ramos, J.C.; Rivas, A. Thermal Modeling of Large Format Lithium-Ion Cells. J. Electrochem. Soc. 2012, 160, A212–A217. [Google Scholar] [CrossRef]
- Bazinski, S.J.; Wang, X. The Influence of Cell Temperature on the Entropic Coefficient of a Lithium Iron Phosphate (LFP) Pouch Cell. J. Electrochem. Soc. 2013, 161, A168–A175. [Google Scholar] [CrossRef]
- Botte, G.G. Influence of Some Design Variables on the Thermal Behavior of a Lithium-Ion Cell. J. Electrochem. Soc. 1999, 146, 914. [Google Scholar] [CrossRef]
- Pals, C.R.; Newman, J. Thermal Modeling of the Lithium/Polymer Battery—I. Discharge behaviour of a Single Cell. J. Electrochem. Soc. 1995, 142, 3274–3281. [Google Scholar] [CrossRef]
- Smith, K.; Wang, C.Y. Power and thermal characterization of a lithium-ion battery pack for hybrid-electric vehicles. J. Power Sources 2006, 160, 662–673. [Google Scholar] [CrossRef]
- Chen, Y.; Evans, J.W. Heat Transfer Phenomena in Lithium/Polymer-Electrolyte Batteries for Electric Vehicle Application. J. Electrochem. Soc. 1993, 140, 1833–1838. [Google Scholar] [CrossRef]
- Song, L.; Evans, J.W. Electrochemical-Thermal Model of Lithium Polymer Batteries. J. Electrochem. Soc. 2000, 147, 2086. [Google Scholar] [CrossRef]
- Chen, S.C.; Wan, C.C.; Wang, Y.Y. Thermal analysis of lithium-ion batteries. J. Power Sources 2005, 140, 111–124. [Google Scholar] [CrossRef]
- Chen, S.-C.; Wang, Y.-Y.; Wan, C.-C. Thermal Analysis of Spirally Wound Lithium Batteries. J. Electrochem. Soc. 2006, 153, A637. [Google Scholar] [CrossRef]
- Chen, Y.; Evans, J.W. Thermal analysis of lithium polymer electrolyte batteries by a two dimensional model-thermal behaviour and design optimization. Electrochim. Acta 1994, 39, 517–526. [Google Scholar] [CrossRef]
- Chen, Y. Three-Dimensional Thermal Modeling of Lithium-Polymer Batteries under Galvanostatic Discharge and Dynamic Power Profile. J. Electrochem. Soc. 1994, 141, 2947. [Google Scholar] [CrossRef]
- Kim, U.S.; Shin, C.B.; Kim, C.S. Effect of electrode configuration on the thermal behavior of a lithium-polymer battery. J. Power Sources 2008, 180, 909–916. [Google Scholar] [CrossRef]
- Kim, U.S.; Shin, C.B.; Kim, C.S. Modeling for the scale-up of a lithium-ion polymer battery. J. Power Sources 2009, 189, 841–846. [Google Scholar] [CrossRef]
- Gomadam, P.M.; Weidner, J.W.; Dougal, R.A.; White, R.E. Mathematical modeling of lithium-ion and nickel battery systems. J. Power Sources 2002, 110, 267–284. [Google Scholar] [CrossRef]
- Verbrugge, M.W. Three dimensionai temperature and current distribution in a battery module. AIChE J. 1995, 41, 1550–1562. [Google Scholar] [CrossRef]
- Al Hallaj, S.; Maleki, H.; Hong, J.S.; Selman, J.R. Thermal modeling and design considerations of lithium-ion batteries. J. Power Sources 1999, 83, 1–8. [Google Scholar] [CrossRef]
- Srinivasan, V.; Wang, C.Y. Analysis of Electrochemical and Thermal Behavior of Li-Ion Cells. J. Electrochem. Soc. 2003, 150, A98. [Google Scholar] [CrossRef]
- Kumaresan, K.; Sikha, G.; White, R.E. Thermal Model for a Li-Ion Cell. J. Electrochem. Soc. 2008, 155, A164. [Google Scholar] [CrossRef]
- Thomas, K.E.; Newman, J. Thermal Modeling of Porous Insertion Electrodes. J. Electrochem. Soc. 2003, 150, A176. [Google Scholar] [CrossRef]
- Ohshima, T.; Nakayama, M.; Fukuda, K.; Araki, T.; Onda, K. Thermal behavior of small lithium-ion secondary battery during rapid charge and discharge cycles. Electr. Eng. Jpn. 2006, 157, 17–25. [Google Scholar] [CrossRef]
- Bazinski, S.J.; Wang, X. Experimental study on the influence of temperature and state-of-charge on the thermophysical properties of an LFP pouch cell. J. Power Sources 2015, 293, 283–291. [Google Scholar] [CrossRef]
- Swierczynski, M.; Stroe, D.I.; Knap, V.; Kaer, S.K.; Teodorescu, R. Two-Dimensional Thermal Modeling of Lithium-Ion Battery Cell Based on Electrothermal Impedance Spectroscopy. ECS Trans. 2016, 72, 33–38. [Google Scholar] [CrossRef]
- Maleki, H. Thermal Properties of Lithium-Ion Battery and Components. J. Electrochem. Soc. 1999, 146, 947. [Google Scholar] [CrossRef]
- Murashko, K.A.; Mityakov, A.V.; Pyrhonen, J.; Mityakov, V.Y.; Sapozhnikov, S.S. Thermal parameters determination of battery cells by local heat flux measurements. J. Power Sources 2014, 271, 48–54. [Google Scholar] [CrossRef] [Green Version]
- Christen, R.; Rizzo, G.; Gadola, A.; Stöck, M. Test Method for Thermal Characterization of Li-Ion Cells and Verification of Cooling Concepts. Batteries 2017, 3, 3. [Google Scholar] [CrossRef]
- Richter, F.; Kjelstrup, S.; Vie, P.J.S.; Burheim, O.S. Thermal conductivity and internal temperature pro fi les of Li-ion secondary batteries. J. Power Sources 2017, 359, 592–600. [Google Scholar] [CrossRef]
- Richter, F.; Vie, P.J.S.; Kjelstrup, S.; Burheim, O.S. Measurements of ageing and thermal conductivity in a secondary NMC-hard carbon Li-ion battery and the impact on internal temperature profiles. Electrochim. Acta 2017, 250, 228–237. [Google Scholar] [CrossRef]
Figure 1.
(a) Internal resistance model (b) Equivalent circuit model.

Figure 2.
Internal resistance measurement with various procedures(s: seconds, d: discharge, c: charge, e: extrapolated) [10].
Figure 2.
Internal resistance measurement with various procedures(s: seconds, d: discharge, c: charge, e: extrapolated) [10].

Figure 3.
Variation of internal resistance with pulse period [11].
Figure 3.
Variation of internal resistance with pulse period [11].

Figure 4.
Internal resistance (mΩ) computed from various amplitude discharge pulses [11].
Figure 4.
Internal resistance (mΩ) computed from various amplitude discharge pulses [11].
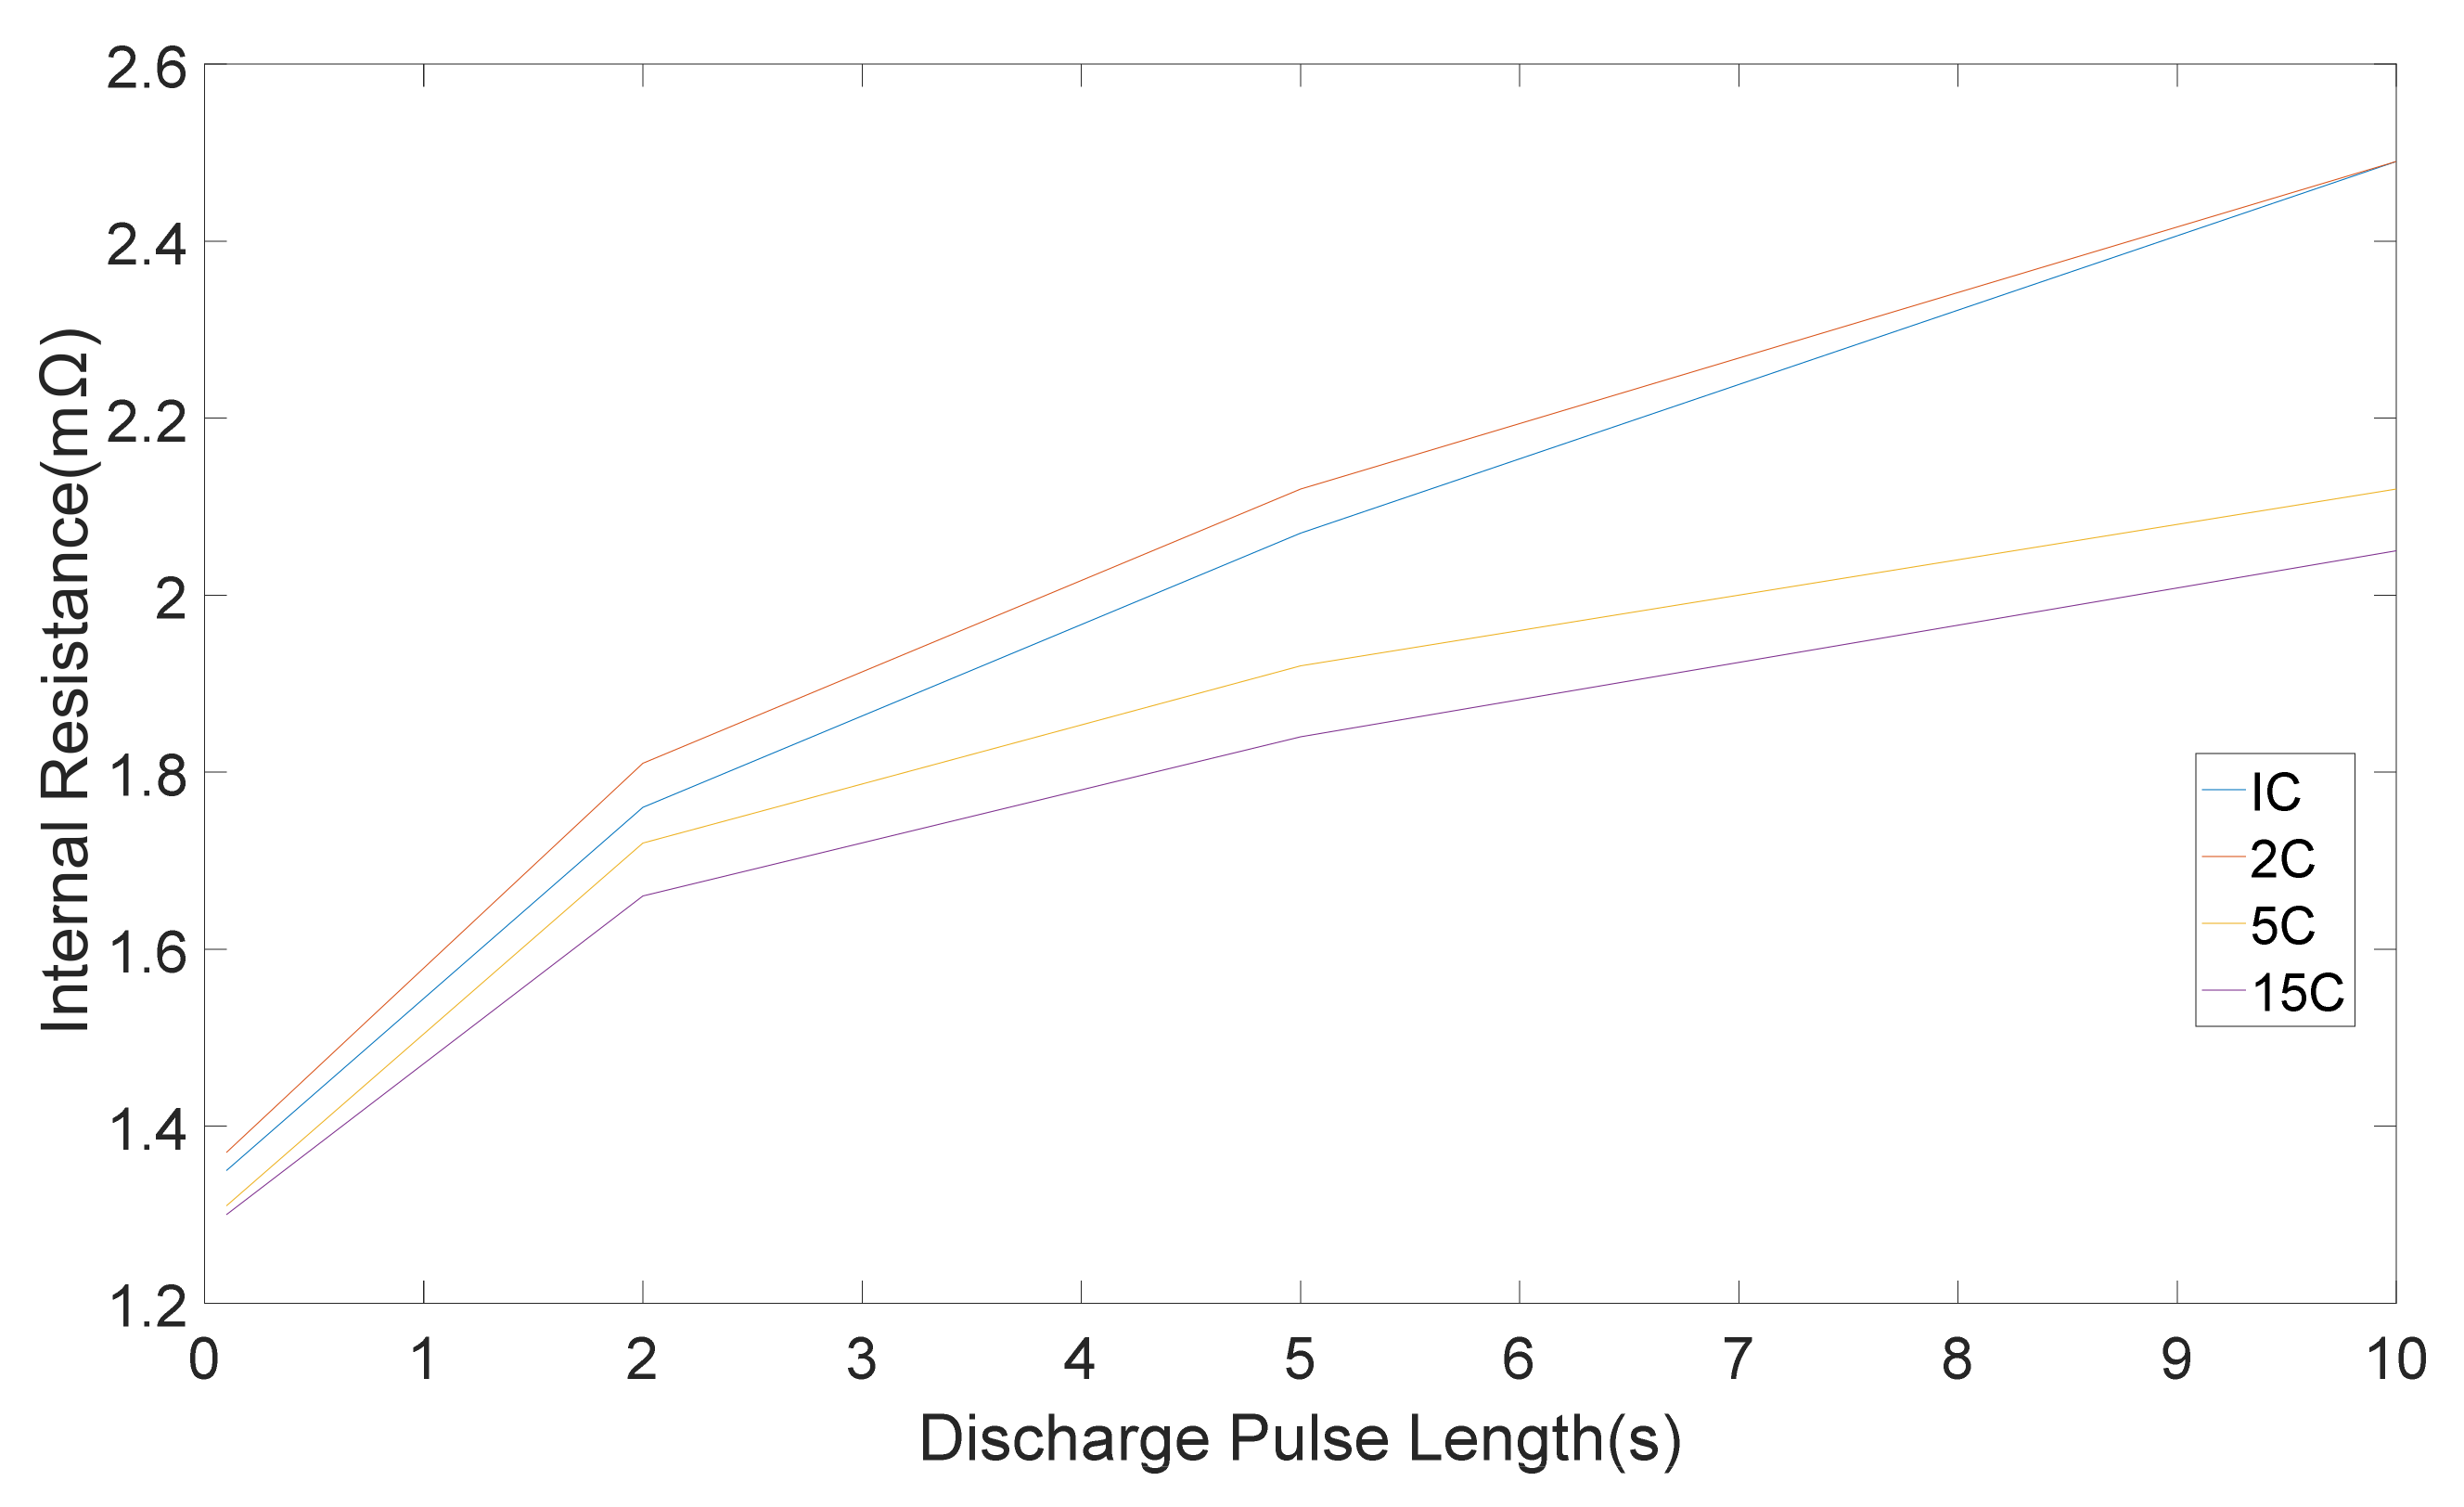
Figure 5.
Internal resistance (mΩ) computed from various amplitude charge pulses [11].
Figure 5.
Internal resistance (mΩ) computed from various amplitude charge pulses [11].

Figure 6.
ECM based on the EIS feedback of the lithium-ion battery [13].
Figure 6.
ECM based on the EIS feedback of the lithium-ion battery [13].

Figure 7.
Outcomes from the frequency-based ETIS procedure [36].
Figure 7.
Outcomes from the frequency-based ETIS procedure [36].

Figure 8.
The heating setup which was employed to measure specific heat capacity (method one—cooling transient) [37].
Figure 8.
The heating setup which was employed to measure specific heat capacity (method one—cooling transient) [37].
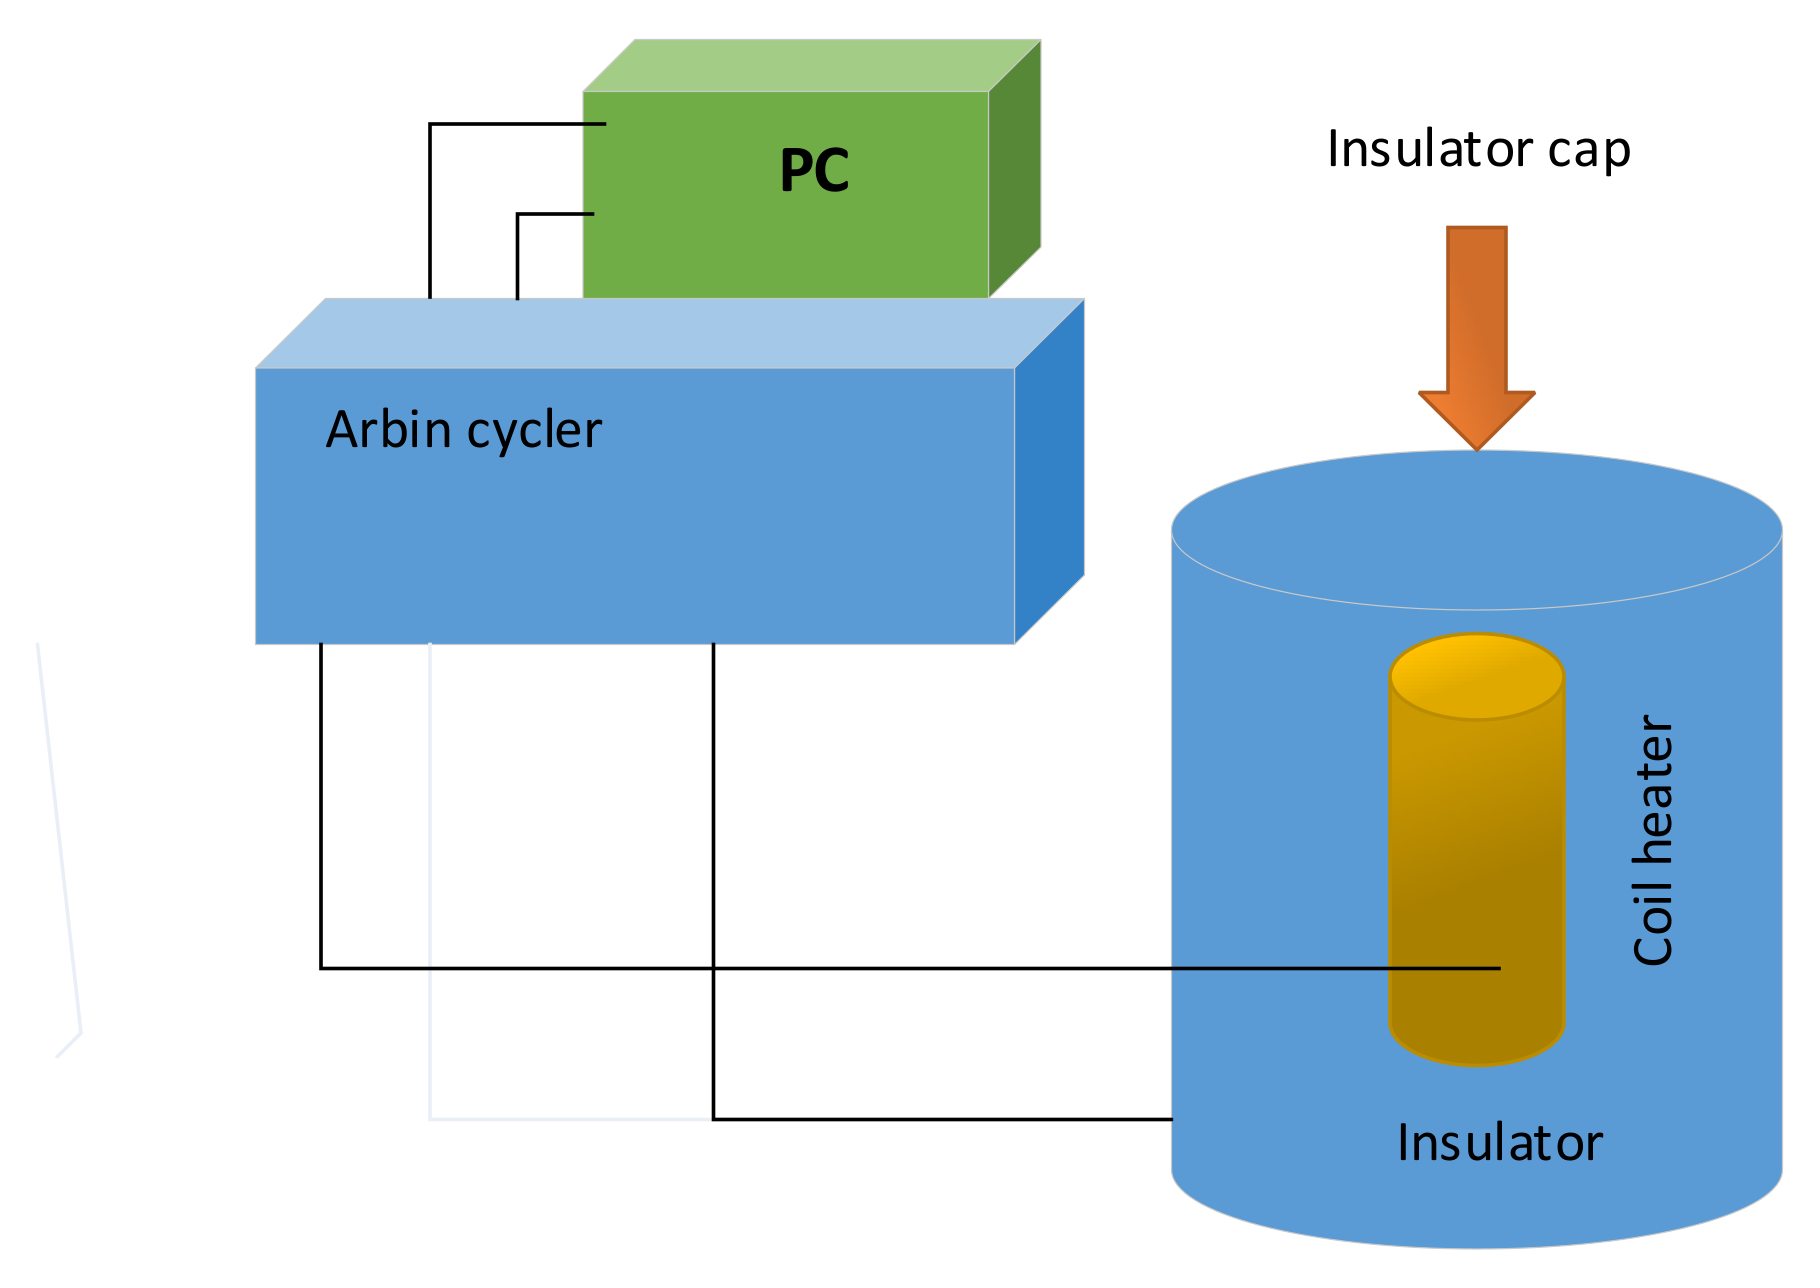
Figure 9.
Specific heat capacity setup (method two—adiabatic calorimetry) [37].
Figure 9.
Specific heat capacity setup (method two—adiabatic calorimetry) [37].
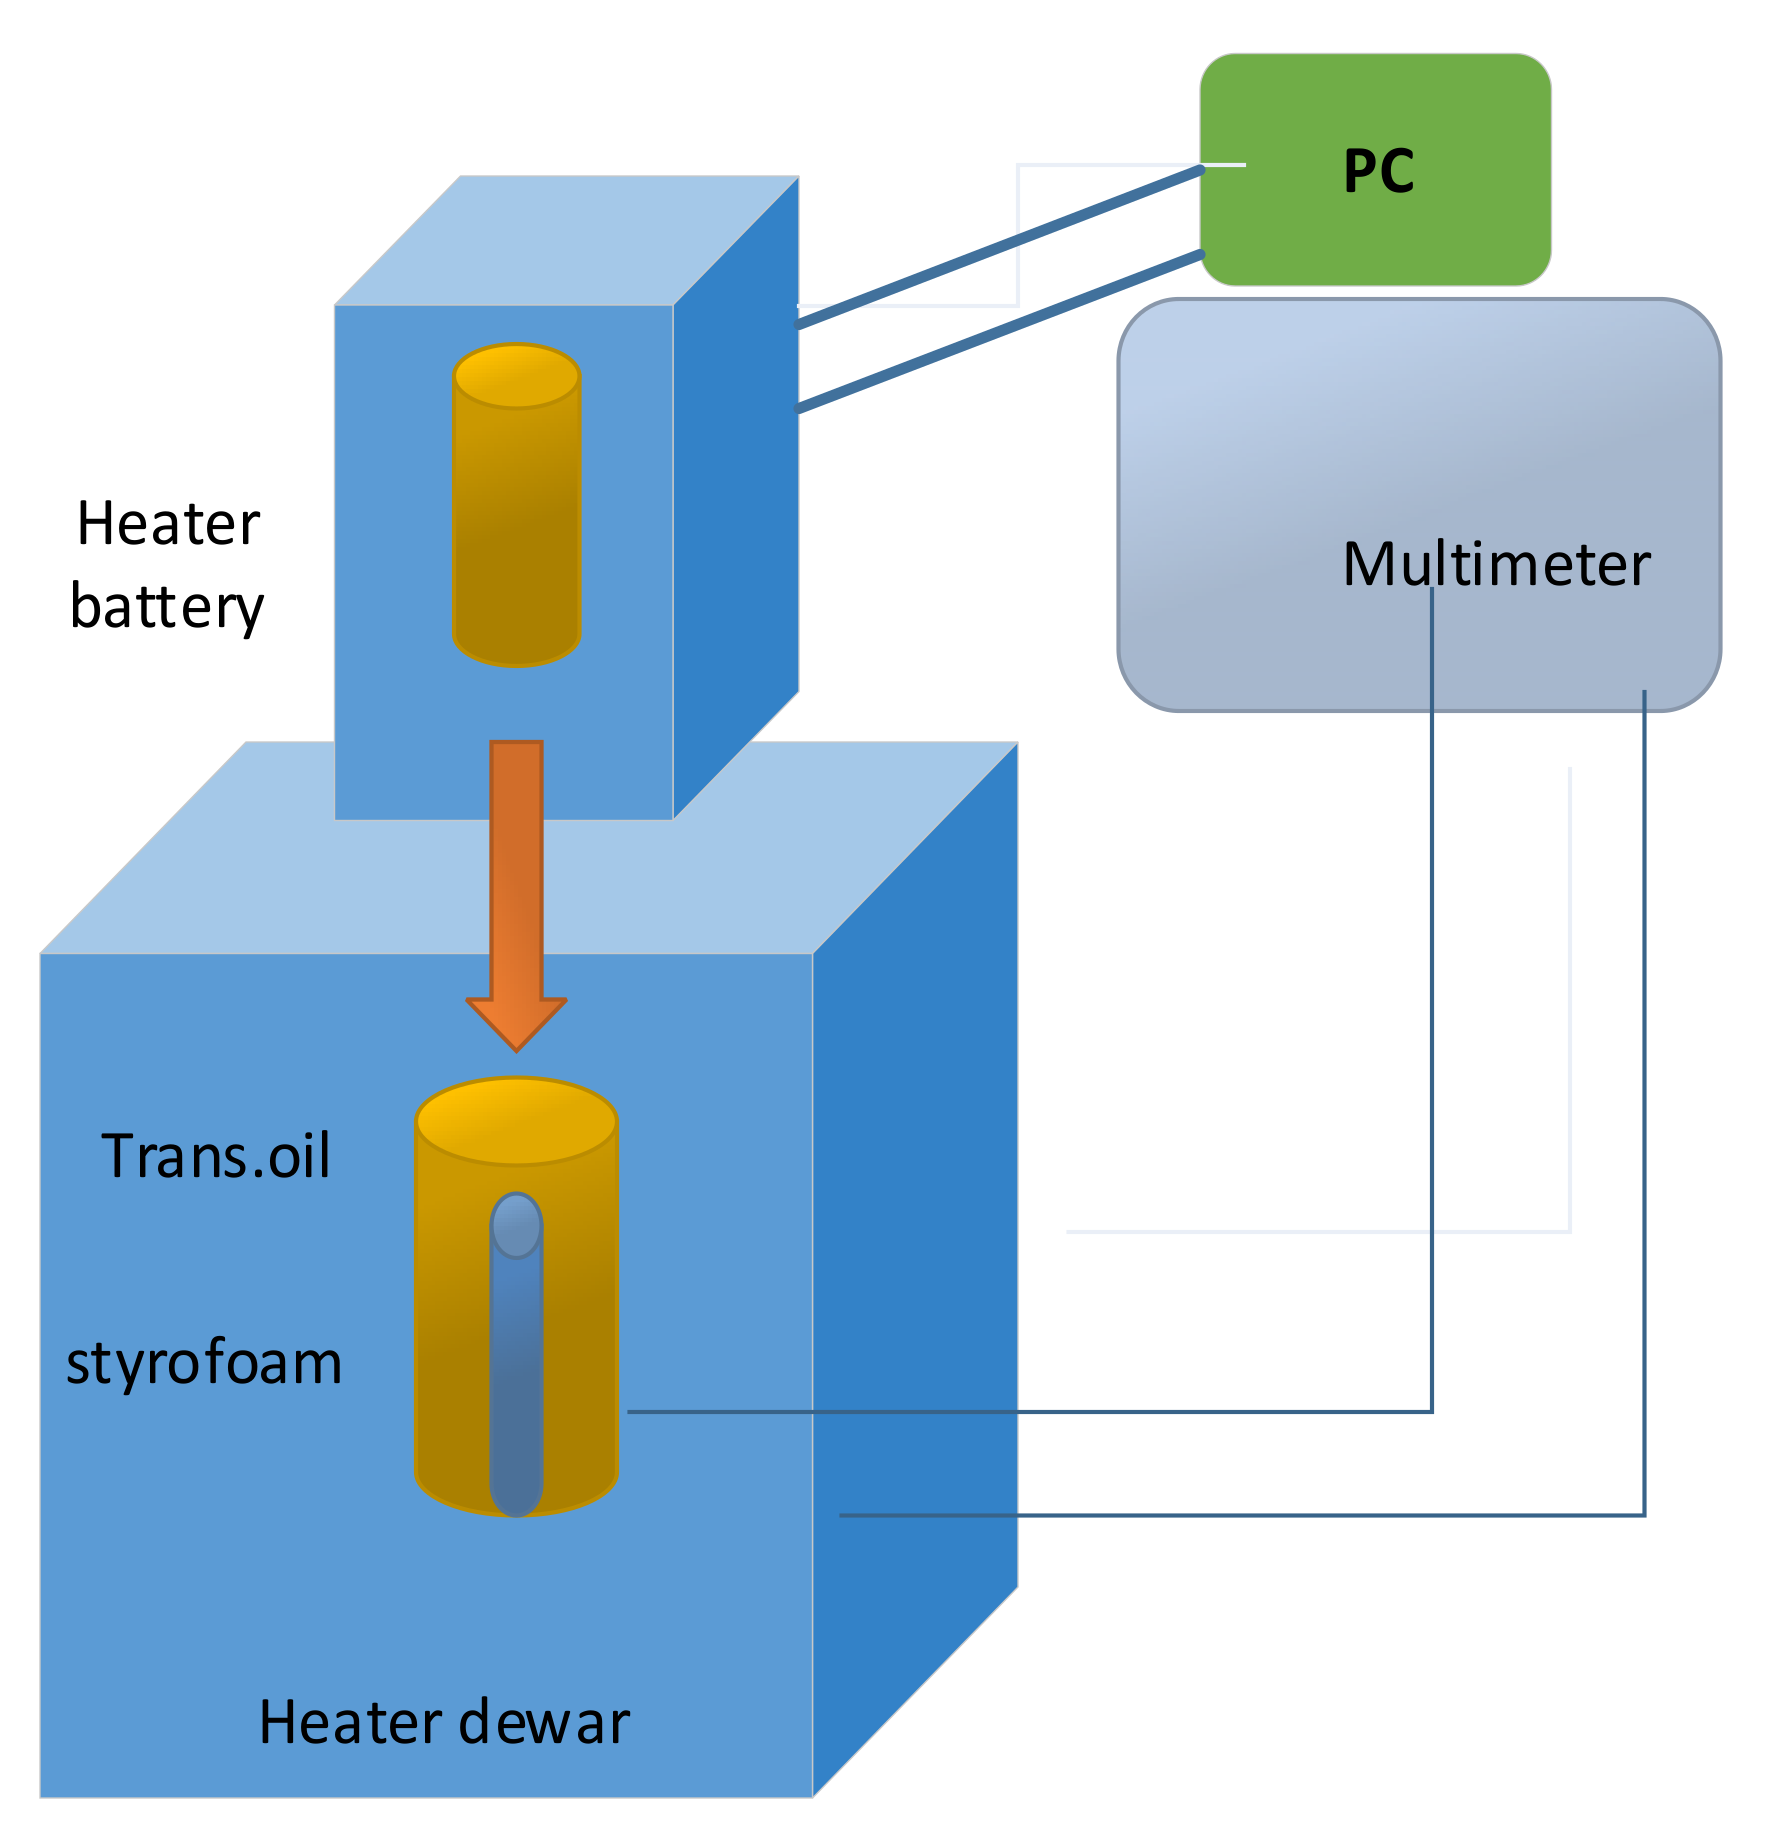
Figure 10.
Thermal conductivity measurement setup (method one-direct steady state measurement) [36].
Figure 10.
Thermal conductivity measurement setup (method one-direct steady state measurement) [36].
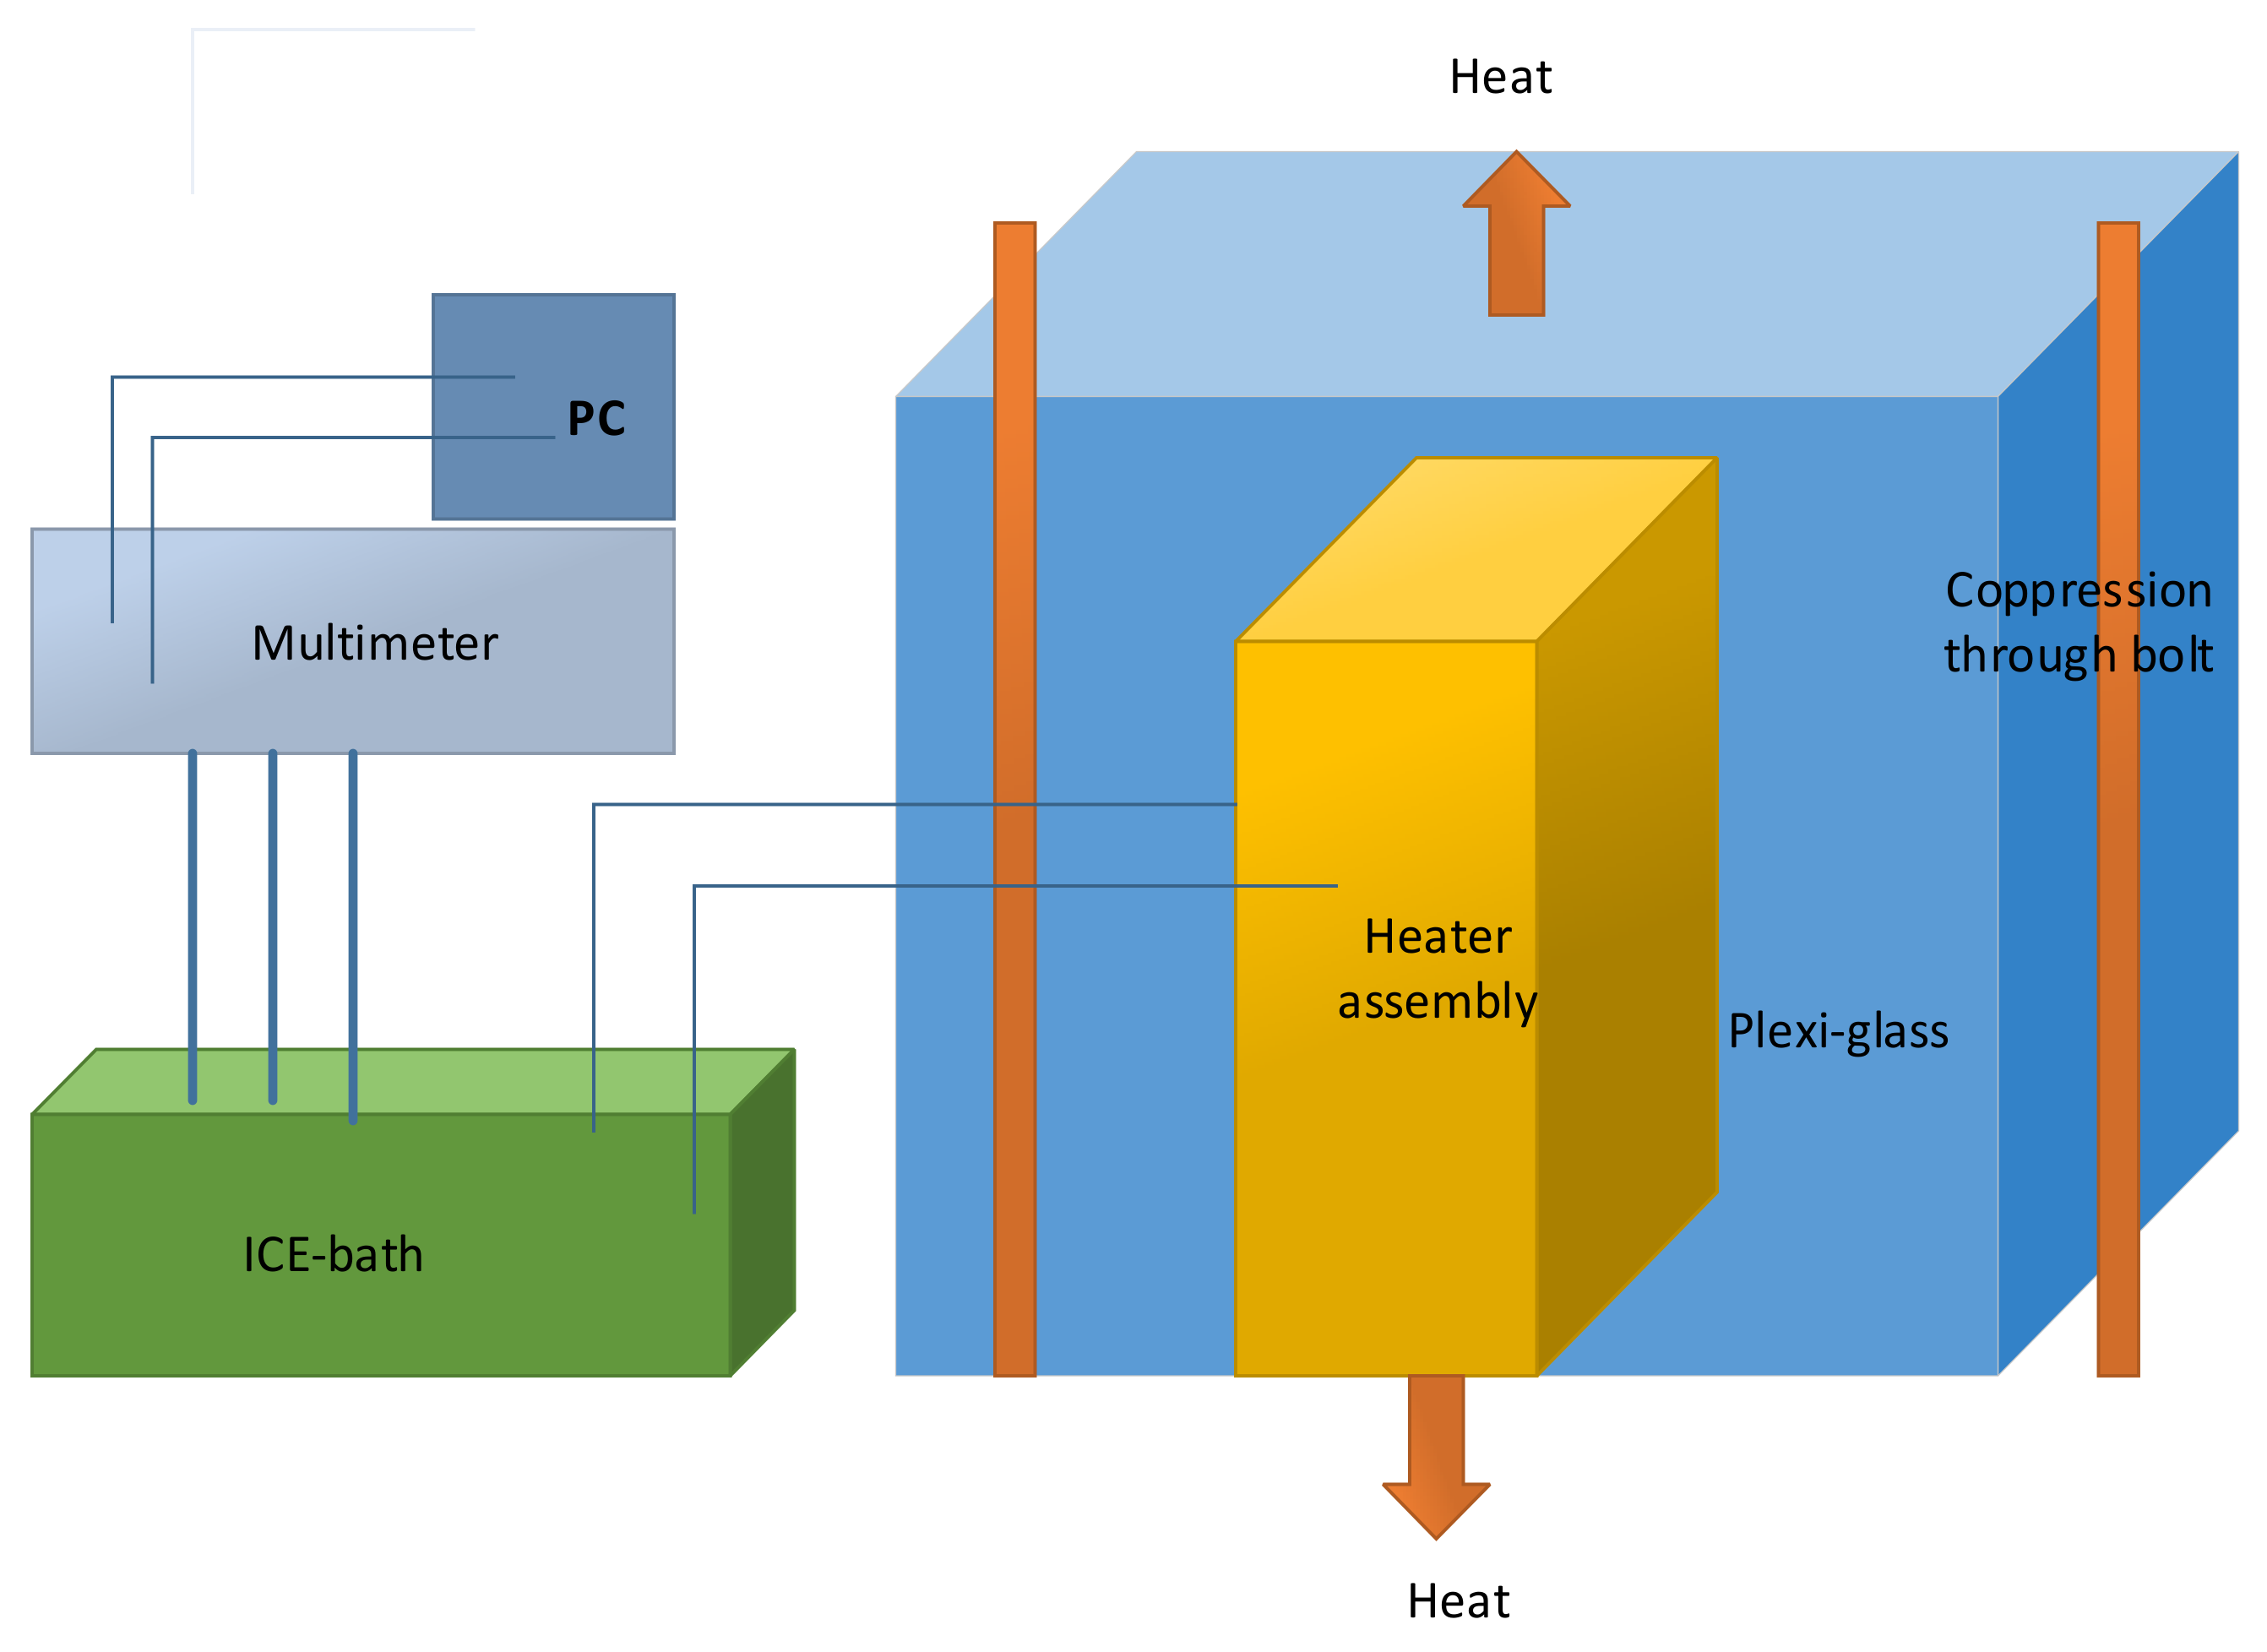
Figure 11.
Thermal conductivity measurement setup (method 2-thermal diffusivity measurement) [37].
Figure 11.
Thermal conductivity measurement setup (method 2-thermal diffusivity measurement) [37].

Table 1.
VDA (Verband der Automobilindustrie) current step method [10].
Table 1.
VDA (Verband der Automobilindustrie) current step method [10].
| Procedure | Measurement/Calculation | Important Parameters |
|---|---|---|
| 2, 10, and 18 s after the start of the current pulse | Pulse duration Pulse amplitude |
Table 2.
Effect of entropic heat [15].
Table 2.
Effect of entropic heat [15].
| EHC | During Discharge | During Charge |
|---|---|---|
| Negative | Exothermic | Endothermic |
| Positive | Endothermic | Exothermic |
Table 3.
Thermal cycles [15].
Table 3.
Thermal cycles [15].
| Time (h) | Thermal Cycle 1 | Thermal Cycle 2 |
|---|---|---|
| 3 | 25 °C | 26 °C |
| 3 | 5 °C | 16 °C |
| 3 | 15 °C | 6 °C |
| 3 | 40 °C | 21 °C |
| 3 | 55 °C | 36 °C |
| 3 | 25 °C | 26 °C |
Table 4.
Investigations of which entropic heat was exerted to the thermal models.
| Subject | EHC | Battery | Ref. |
|---|---|---|---|
| Influence of different design variables on the thermal behavior | Disregarded | Lithium-ion cell (LixC6/LiyNiO2) | [16] |
| Thermal modeling (discharge behavior) | Disregarded | Lithium/polymer (LilPEO15-LiCF3SO3ITiS2) | [17] |
| Power and thermal characterization | Disregarded | Lithium-ion battery pack | [18] |
| Heat transfer phenomena | Constant | Lithium/polymer-electrolyte | [19] |
| Electrochemical–thermal model | Constant | Lithium polymer | [20] |
| Thermal analysis | Constant | Lithium-ion batteries | [21] |
| Thermal analysis | Constant | Spirally wound lithium batteries | [22] |
| Thermal analysis | Constant | Lithium/polymer-electrolyte | [23] |
| Three-dimensional thermal modeling | Constant | Lithium-polymer | [24] |
| Effect of electrode configuration on the thermal behavior | Unreported | Lithium-polymer battery | [25] |
| Scale-up modeling | Unreported | Lithium-ion polymer battery | [26] |
| Mathematical modeling | Unreported | Lithium-ion and nickel battery systems | [27] |
| Three-dimensional temperature and current distribution | Unreported | Battery module | [28] |
| Thermal modeling and design considerations | Linear between two SOC measurements | Lithium-ion batteries | [29] |
| Analysis of electrochemical and thermal Behavior | Nonlinear function of SOC | Lithium-ion batteries | [30] |
| Thermal model | Nonlinear function of SOC | Lithium-ion battery | [31] |
| Thermal modeling | Nonlinear function of SOC | Porous insertion electrodes | [32] |
| Thermal behavior during rapid charge and discharge cycles | Nonlinear function of SOC | Small lithium-ion secondary battery | [33] |
Table 5.
Determination of the specific heat capacity of batteries using different approaches [35].
Table 5.
Determination of the specific heat capacity of batteries using different approaches [35].
| Method | Device | Determination Method |
|---|---|---|
| Cooling of a heated cell | Insulated chamber filled with a mass of dielectric oil | Experimental approaches |
| Adiabatic calorimetry | Insulated chamber/generally not filled with any liquid | Experimental approaches |
| Kapton® film heaters | Thermal-vacuum chamber/circulating liquid nitrogen | Experimental approaches |
| Calorimetry | A differential scan calorimeter (DSC) | Experimental approaches |
| Analyses the test cell data/data from the manufacturer | Analyses the test cell data/data from the manufacturer | Computational approaches |
| Data cited in publications and references | Data cited in publications and references | Computational approaches |
Table 6.
The influence of bulk temperature and SOC on the specific heat capacity of lithium cells [35].
Table 6.
The influence of bulk temperature and SOC on the specific heat capacity of lithium cells [35].
| Specific Heat Capacity Dependency | Battery Type |
|---|---|
| Weakly dependent on its temperature and SOC | Lithium cells |
| A cell temperature dependency at 100% SOC but a poor dependency at 0% SOC | Li/BCX and Li/SOCl2 cylindrical cells |
| Increase with open circuit voltage (OCV) | 18,650 LiCoO2 cell |
| Statistically independent of SOC | A large format pouch cell—lithium titanate anode |
Table 7.
Methods used in thermal conductivity measurement [35].
Table 7.
Methods used in thermal conductivity measurement [35].
| Method | Representation | Reference |
|---|---|---|
| Guarded hot plate technique (GHPT) | ASTM C177-04 | 69 |
| GHPT | ISO 8302:1991 | 70 |
| Heat flow meter | ASTM C518-10 | 71 |
| Heat flow meter | ISO 8301:1991 | 72 |
© 2018 by the authors. Licensee MDPI, Basel, Switzerland. This article is an open access article distributed under the terms and conditions of the Creative Commons Attribution (CC BY) license (http://creativecommons.org/licenses/by/4.0/).
Share and Cite
MDPI and ACS Style
Madani, S.S.; Schaltz, E.; Knudsen Kær, S. Review of Parameter Determination for Thermal Modeling of Lithium Ion Batteries. Batteries 2018, 4, 20. https://doi.org/10.3390/batteries4020020
AMA Style
Madani SS, Schaltz E, Knudsen Kær S. Review of Parameter Determination for Thermal Modeling of Lithium Ion Batteries. Batteries. 2018; 4(2):20. https://doi.org/10.3390/batteries4020020
Chicago/Turabian StyleMadani, Seyed Saeed, Erik Schaltz, and Søren Knudsen Kær. 2018. "Review of Parameter Determination for Thermal Modeling of Lithium Ion Batteries" Batteries 4, no. 2: 20. https://doi.org/10.3390/batteries4020020
Note that from the first issue of 2016, this journal uses article numbers instead of page numbers. See further details here.