
MdSGR2 Negatively Regulates Chlorophyll Degradation in Apple
by
Shiyi Xue
1,
Pei Yao
1,
Jiwei Kang
1,
Xiong Zheng
1,
Chang Liu
1,
Yan Gao
1,2,
Dehui Zhang
1,2,
Xiaojun Zhang
1,2,* and
Yanyan Hao
1,2,* 1
College of Horticulture, Shanxi Agricultural University, Jinzhong 030801, China
2
Shanxi Provincial Key Laboratory of Fruit Tree Germplasm Creation and Utilization, Taiyuan 030031, China
*
Authors to whom correspondence should be addressed.
Horticulturae 2024, 10(5), 439; https://doi.org/10.3390/horticulturae10050439
Submission received: 2 April 2024
/
Revised: 17 April 2024
/
Accepted: 21 April 2024
/
Published: 25 April 2024
Abstract
:The color of an apple is an important index of its appearance quality, which affects the fruit’s marketability and value. The green variety “Granny Smith” remains green when ripe, and the pigment in the peel is mainly chlorophyll. The chlorophyll in the peel of the yellow variety “Golden Delicious” degrades as the fruit ripens. To explore the different mechanisms of chlorophyll degradation in the “Golden Delicious” and “Granny Smith” varieties, transcriptomic analysis was performed on the mature peels of both cultivars. High-quality sequences totaling 48,206,940 and 48,796,646 raw bases, as well as 9632 differentially expressed genes (DEGs), were identified. A total of 1206 DEGs were classified in 118 KEGG metabolic pathways. Additionally, 3258 transcription factors from 428 gene families were predicted, and DEGs associated with chlorophyll degradation, including MdSGR2, MdNYC1 and MdHCAR, were identified. Subsequently, the MdSGR2 gene was isolated from the mature peel of “Granny Smith” apples. Subsequent subcellular localization analysis confirmed that MdSGR2 specifically targets chloroplasts. The transient overexpression of MdSGR2 was found to negatively regulate chlorophyll degradation, leading to the inhibition or deceleration of chlorophyll breakdown, thereby maintaining green coloration in the leaves and peel. Conversely, silencing MdSGR2 positively regulated chlorophyll degradation, resulting in chlorosis in the leaves and peel. These findings offer valuable insights into the regulatory mechanism governing apple fruit coloration and lays a solid foundation for further investigation in this field.
1. Introduction
Apples (Malus domestica Borkh.) are a crucial horticultural crop. Fruit color serves as a significant metric for assessing apple fruit quality, directly impacting fruit characteristics and market value [1]. Apple skin color results from the interplay of chlorophyll, carotenoid, anthocyanin, and flavonoid distribution in specific proportions [2]. However, fruit color is not solely dictated by the presence of these substances alone [3,4,5]. As “Golden Delicious” apples ripen, the chlorophyll in their peel degrades, leading to their yellow color, whereas “Granny Smith” apples, known for their green color, retain this color due to the gradual degradation of chlorophyll [1].
The degree of coloration during fruit ripening is one of the important factors determining the marketability of fruit [6]. In general, red apples are favored more by consumers, who are largely reluctant to buy green apples. Stagnant green refers to the phenomenon caused by the non-degradation or non-obvious degradation of chlorophyll in the aging process of plants, and its most significant feature is that the leaves or fruits of the plant remain green for a long time when aging, or even retain some green when not fully mature. Increasing the degree of fruit coloring is a common goal of breeders and growers. Therefore, methods for controlling color regulation and chlorophyll degradation in fruits have become a research hotspot.
The degradation products of chlorophyll exhibit antioxidant properties and can preserve cellular activity. Chlorophyll absorbs light energy and provides energy for plant development through photosynthesis, but the presence of excessive chloroplasts produces a large number of free radicals, thus accelerating plant cell death [7]. The chlorophyll degradation product PAO is only found in the aging process and has antioxidant effects, which can maintain or alleviate cell activity [7]. In addition, the degradation of chlorophyll is not only a signal of fruit ripening, but it is also conducive to plant growth and development and the response to environmental changes [8,9,10]. For example, promoting the reuse of chlorophyll-binding proteins and chlorophyll alcohols, and the timely removal of free chlorophyll and its metabolic intermediates can prevent cells from being damaged by light [11]. Therefore, moderate degradation of chlorophyll has important biological significance [12].
The decomposition of chlorophyll in fruits and vegetables primarily occurs through the PAO pathway [13]. Within the chlorophyll degradation pathway, chlorophyll b is converted to chlorophyll a with the assistance of chlorophyll b reductase (CBR) and 7-hydroxymethyl chlorophyll a reductase (HCAR) [14]. Plants possess two CBR subtypes, namely non-yellow coloring1 (NYC1) and NYC1-like (NOL), which, under the influence of the retarded green gene, facilitate the formation of chlorophyll a [15,16]. Pheophytinase (PPH) is subsequently utilized to produce pheophytin [16]. Following this, pheophorbide a is transformed into red chlorophyll metabolites through the action of pheophorbide a oxygenase (PAO) [16]. Primary fluorescent chlorophyll metabolites are then generated by red chlorophyll catabolite reductase (RCCR). Ultimately, non-fluorescent chlorophyll metabolites are produced through modification under acidic pH conditions [17].
SGR is a key gene in chlorophyll degradation [18,19,20,21,22]. Armstead et al. [23] first identified the SGR gene as a key regulator of chlorophyll degradation in Pisum sativum. Since then, SGR genes have been cloned from and identified in many plants, such as rice, Arabidopsis and tomatoes [24,25,26]. In higher plants, the SGR gene family is categorized into two subfamilies—the SGR and SGR-like (SGRL) subfamilies, present in both monocotyledonous and dicotyledonous plants [27,28,29]. Armstead et al. first identified the SGR gene as a pivotal regulator of chlorophyll degradation in Pisum sativum [30,31,32]. Among them, SGR1 has been the most extensively studied. Mutants of SGR1-1 display a green stagnation phenomenon during natural aging and dark induction, while plants with overexpressed SGR1 exhibit premature leaf yellowing [33]. SGRL also plays a role in chlorophyll degradation, functioning solely during the normal vegetative stage but inducing leaf yellowing under stress [34]. Despite the high sequence similarity between SGR2 and SGR1, they exhibit contrasting functions. Plants overexpressing SGR2 exhibit sustained greenness, whereas sgr2 mutant leaves yellow prematurely [20], indicating that SGR2 negatively modulates chlorophyll degradation during leaf senescence [35]. Further research has revealed that the functional disparities among SGR homologous proteins may stem from varying binding affinities with Chl catabolic enzymes (CCEs). SGR1 and SGRL can interact with six CCEs and LHC II to participate in the chlorophyll metabolism pathway [20]. Notably, the interaction between SGR1 and CCEs is exclusive to plant senescent tissue. In contrast, SGR2 has limited binding capacity with CCEs and, although it can interact with LHC II, it impedes the binding of SGR1-CCE and SGR-CCE with LHC II [34,35,36]. Although there has been some progress in the study of SGR, there are few reports on the SGR gene in apples.
To investigate the regulatory mechanism of chlorophyll degradation in apple peel, we utilized ripe peel samples from the green cultivar “Granny Smith” and the yellow cultivar “Golden Delicious” as the experimental material. Through RNA sequencing, we identified differentially expressed genes associated with chlorophyll degradation in apple peel. Additionally, we cloned MdSGR2 e and transiently transformed it into both tobacco leaves and apple peel for investigating the biological role of MdSGR2 in chlorophyll degradation.
2. Materials and Methods
2.1. Plant Material
Mature fruits from “Golden Delicious” and “Granny Smith” apple trees, which were 10 years old with consistent growth, were collected from the Shanxi Academy of Agricultural Sciences Pomology Institute. Fifteen fruits from the outer canopy of each tree were promptly transported to the laboratory post-harvest. Fruits of equivalent size and overall quality were selected for experimentation. The peel’s color parameters were assessed using a colorimeter. Subsequently, approximately 1 mm thick sections of the peel were excised, wrapped in foil, flash-frozen with liquid nitrogen, and stored in an ultra-low-temperature refrigerator at −80 °C.
2.2. Fruit Color Determination
The brightness (L*), red–green degree (a*), yellow–blue degree (b*), and hue angle (ho) values at five different points on the equatorial plane of the fruit were measured using a colorimeter (CR400). Among them, L* represents the brightness of the fruit color, a* represents the red–green degree, b* represents the yellow–blue degree, and ho represents the hue angle.
2.3. Determination of the Chlorophyll Content in the Peel
The chlorophyll content was determined using spectrophotometry [37]. One gram of the peel from the “Granny Smith” and “Golden Delicious” apples was used for each sample, with three biological replicates. The samples were individually placed in a mortar and mixed with CaCO3, silica sand, and ethanol, then ground into a white homogenate. Subsequently, filter paper was placed in a funnel, the extract was poured into the funnel, strained into a 10 mL volumetric bottle, and topped up with ethanol to reach a final volume of 10 mL. The extraction solution was transferred to a colorimetric dish, and the absorbance was measured at 665 and 649 nm using an ultraviolet spectrophotometer (SPECORD210). The concentrations of chlorophyll a, chlorophyll b, and total chlorophyll were calculated using the formulas below:
Ca (Chla) = 13.95A665 − 6.88A649;
Cb (Chlb) = 24.96A649 − 7.32A665
Ct = Ca + Cb = 18.08A649 + 6.63A665
2.4. Transcriptome Sequencing Analysis
Total RNA was extracted from the peel of both the “Granny Smith” and “Golden Delicious” apples. Six libraries were constructed for the ripened peel of each apple variety using the NEBNext® Ultra™ RNA Library Prep Kit for Illumina®. Subsequently, reads and low-quality reads with sequencing adapters were removed from the raw data, and the remaining sequences were aligned to the reference genome using HISAT2 software (Version: HISAT2 2.1.0). Differential gene expression analysis was conducted using DESeq2 to potentially identify differentially expressed genes (DEGs) based on the following criteria: |log2 (fold-change)| > 1 and padj < 0.05.
2.5. Real-Time Fluorescence Quantitative qRT-PCR
In order to validate the reliability of the transcriptome data, a total of 9 DEGs associated with the chlorophyll metabolism were selected for real-time fluorescence quantitative qRT-PCR analysis. The MdActin gene served as the internal reference gene, and specific primers for the target genes were designed using Primer 5.0 software (Supplementary Table S1) and synthesized by Beijing Qingke Biotechnology Co., Ltd. (Beijing, China). Using the RNA provided by the sequencing company as a template, the cDNA was synthesized with a HiScript II 1st Strand cDNA Synthesis Kit (+gDNA wiper), followed by real-time fluorescence quantitative qRT-PCR. The transcript levels of each gene were determined using the 2−ΔΔ Ct method.
2.6. Subcellular Localization of MdSGR2
MdSGR2 was cloned into the 35S:GFP vector, resulting in the 35S:GFP-MdSGR2 plasmid. The recombinant plasmid was transformed into agrobacterium GV3101 by the freeze–thaw method. Positive single colonies were picked and cultured in an LB medium containing antibiotics at 28 °C until the OD600 was 0.8. After centrifugation, it was re-suspended in an equal volume in the re-suspended solution containing 10 mM MES, 10 mM MgCl2, and 200 M AS. The suspension was injected into the lower epidermis of the mature leaves of 5-week-old tobacco using a syringe, and the tobacco leaves infected with Agrobacterium transformed with empty plasmid were used as control. After two days of normal culturing, the leaves were observed using a laser confocal microscope and photographed.
2.7. Transient Transformation of MdSGR2 in Tobacco
MdSGR2 was cloned into the pCAMBIA2301 vector, resulting in the pCAMBIA2301-MdSGR2 plasmid. MdSGR2 was also cloned into the pTRV2 vector, resulting in the pTRV2-MdSGR2 plasmid. After successful construction of the silent expression vector pTRV2-MdSGR2, it and the pTRV1 vector were transferred into Agrobacterium at a ratio of 1:1. The Agrobacterium solution of the control and experimental groups was inoculated with 10 μL of each plasmid in an LB liquid medium, shaken at 28 °C until the OD600 was 0.5, and centrifuged at 5000 r/min at 4 °C for 5 min. Then, the excess bacteria were discarded, and the bacteria were collected. After centrifugation, it was re-suspended in an equal volume in the re-suspended solution containing 10 mM MES, 10 mM MgCl2, and 200 µM of AS, before being placed at room temperature away from light for 3–5 h. The treated bacterial solution was injected with a syringe 1 mm below the leaf of tobacco. The test material was cultured in a light incubator.
2.8. Silencing of MdSGR2 in Apple Peel
The test treatment method was the same as above. pTRV1:pTRV2-MdSGR2 and pCAMBIA2301-MdSGR2 were collected and re-suspended with buffer solution until reaching an OD600 of 0.5 and placed at room temperature away from light for 3–5 h. A syringe was used to inject the bacterial solution 1 mm below the pericarp. The injected apple fruit was placed in a light incubator.
3. Results
3.1. Difference Analysis of the Fruit Color Parameters and Chlorophyll in the Peel
Fruit color serves as a crucial parameter for evaluating the visual quality of fruit, with peel color evolving during fruit ripening. As fruits mature, the peel of “Golden Delicious” apples transitions to a yellow color, while that of “Granny Smith” apples retains its green color (refer to Figure 1A). This variation is attributed to the chlorophyll content within the peel. The peel color is intricately linked to metrics such as L*, a*, b*, and ho. In the case of “Golden Delicious” apples, the L*, a*, and b* values in the peel were notably higher compared to those of the “Granny Smith” apples, while the ho value in the “Golden Delicious” apples was significantly lower than that in the “Granny Smith” apples (p < 0.05) (refer to Figure 1B–E). Additionally, the chlorophyll levels (including chlorophyll a, chlorophyll b, and total chlorophyll a + b) in the peel of the “Granny Smith” apples were markedly higher than those in the “Golden Delicious” apples (p < 0.05) (refer to Figure 1F–H). Consequently, a subsequent investigation was conducted based on the observed differences in peel color between the “Granny Smith” and “Golden Delicious” apples.
3.2. Transcriptome Sequencing and Quality Assessment Analysis
To identify genes associated with chlorophyll degradation, Y and G libraries were established from the ripening peels of “Golden Delicious” and “Granny Smith” apples. Following Illumina sequencing, the raw read data were processed to calculate raw bases by multiplying the number of raw reads with the total read length. In the sequencing of the Y and G libraries, a total of 48,206,940 and 48,796,646 raw bases were, respectively obtained. Subsequent to data filtration, over 97% of the total sequencing data (clean bases) was generated, resulting in 47,098,553 and 47,753,114 clean bases for the Y and G libraries, respectively, with Q30 values exceeding 93.18%. Overall, the proportion of low-quality bases (quality < 30) was minimal, indicating that a high sequencing quality was obtained.
To identify transcribed genes from the sequencing fragments, HISAT2 software (Version: HISAT2 2.1.0) was employed to efficiently align high-quality reads with the reference genome, enabling the determination of the reads’ positions on the genome [38]. Comparison analysis revealed that 44,066,232 reads (92.94%) were successfully aligned to the genome. Among these, 42,883,836 reads (90.44%) were mapped to unique positions on the genome, while 1,182,396 reads (2.50%) were aligned to multiple locations within the genome (Supplementary Table S2).
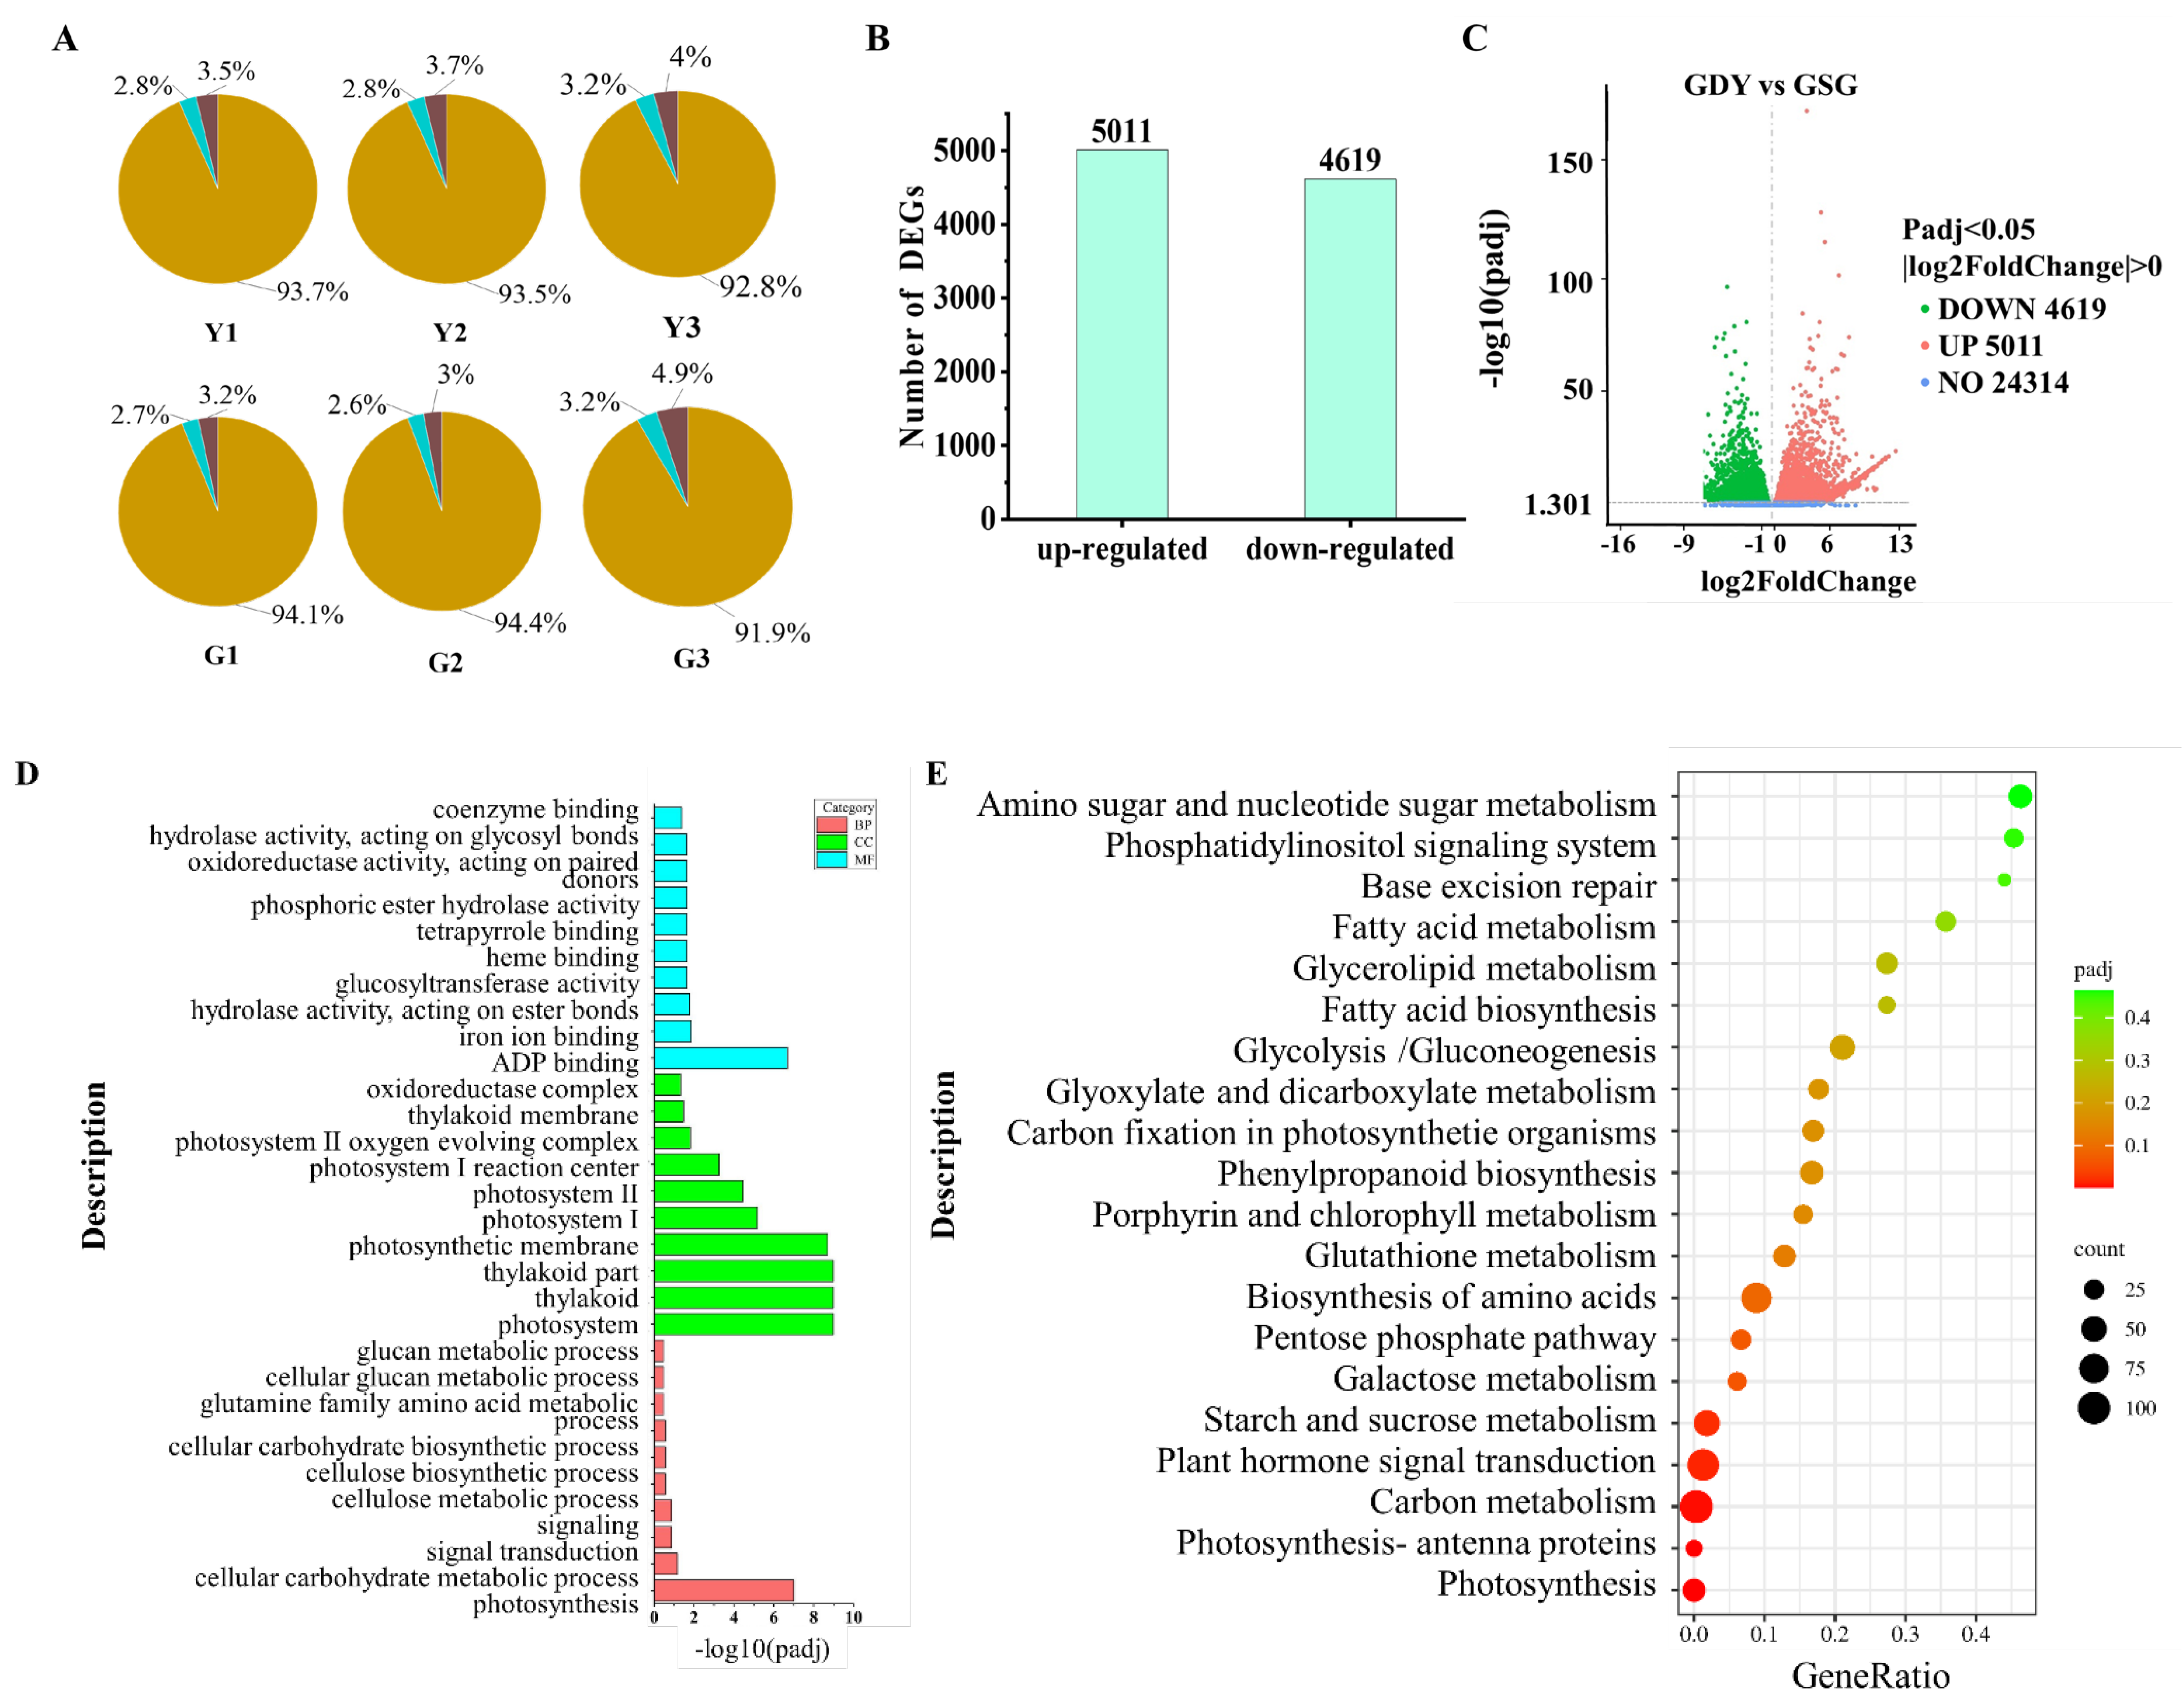
Based on the distribution analysis of the respective genomic regions, the percentages of reads mapped to the exon, intron, and intergenic regions were calculated. The comparison outcomes (Figure 2A) revealed that approximately 93%, 3%, and 4% of the reads were allocated to the exon, intron, and intergenic regions, respectively. The reads aligned to the intron regions could represent precursor mRNA or introns with retained variable splicing. Meanwhile, the reads matched to the intergenic regions might stem from minor DNA fragment contamination or incomplete gene annotation.
3.3. DGEs Analysis and Identification of Transcription Factors
During the process of detecting differentially expressed genes (DEGs), the FPKM values of unigenes were compared to the transcriptome data of Y and G. DESeq2 padj ≤ 0.05 and |log2FoldChange| ≥ 0.05 were established as the threshold criteria for identifying DEGs. By comparing the G and Y libraries (Figure 2B), a total of 9630 DEGs were pinpointed, consisting of 5011 upregulated and 4619 downregulated genes. The volcano plot graphically illustrates the distribution of these DEGs, where red dots signify upregulated genes and green dots indicate downregulated genes (Figure 2C). Furthermore, the transcriptome data predicted 3258 transcription factors, which were categorized into 428 transcription factor gene families. These include 224 Pkinase, 151 Pkinase_Tyr, 86 TIR, 82 NB-ARC, 79 p450, 75 Myb_DNA-binding, and other transcription factor families.
3.4. GO Annotation and KEGG Pathway Enrichment Analysis
Following the identification of DEGs, we proceeded to delve deeper into the functional roles of the proteins encoded by each gene within the overall cellular activities. To achieve this, we conducted gene function annotation analysis of the predicted apple peel differential genes using the GO database (refer to Figure 2D). Approximately 7711 DEGs were categorized into three major classifications: biological process (BP), cellular component (CC), and molecular function (MF). These annotations shed light on the molecular functions of the encoded proteins, the cellular locations of the genes, and the biological processes in which the genes are involved. Notably, the biological processes were predominantly enriched in photosynthesis, while the cellular components were primarily associated with photosystem, thylakoid, and thylakoid parts. Molecular functions were chiefly enriched in ADP binding.
Among the DEGs, a total of 1306 genes were mapped to 118 metabolic pathways, with the top 20 pathways displayed in Figure 2E. Notably, six pathways exhibited significant enrichment: photosynthesis (mdm00195), photosynthetic antenna protein (mdm00196), carbon metabolism (mdm01200), plant hormone signaling (mdm04075), and starch and sucrose metabolism (mdm00500). These pathways involved 37, 17, 105, 93, and 52 DEGs, accounting for 2.83%, 1.30%, 8.04%, 7.12%, and 3.98%, respectively.
3.5. Verification Analysis of Representative Genes
To validate the accuracy of the RNA-seq findings, nine DEGs associated with chlorophyll degradation were chosen from the transcriptomic data for qRT-PCR verification. Each gene underwent three biological replicates, and the correlation between the qRT-PCR and RNA-seq outcomes was scrutinized. The analysis revealed that the expression profiles observed through qRT-PCR in the mature peels of the “Granny Smith” and “Golden Delicious” apples aligned well with those identified in the transcriptome sequencing, as illustrated in Figure 3. This concordance indicates the reliability of the obtained transcriptome data.
3.6. Mining and Analysis of the DEGs in Chlorophyll Metabolic Pathways
Upon scrutinizing the KEGG metabolic pathway and differential gene expression related to porphyrin and chlorophyll based on transcriptomic sequencing data, it was observed that the porphyrin and chlorophyll metabolism pathway (mdm00860) encompassed 23 DEGs. Specifically, this pathway comprised 20 DEGs involved in chlorophyll synthesis and three DEGs associated with chlorophyll degradation (refer to Supplementary Table S3).
Among the DEGs within the chlorophyll degradation pathway, notable differences were identified between the “Golden Delicious” and “Granny Smith” apples. Specifically, the expression level of NYC1 in the ripe fruit peel of the “Golden Delicious” apples surpassed that in the “Granny Smith” apples. Conversely, the expression levels of HCAR and SGR2 exhibited an inverse relationship between the two cultivars. Notably, the expression level of SGR2 in the ripe fruit peel of the “Golden Delicious” apples was 2.13 times higher than that in the “Granny Smith” apples. This discrepancy underscores the significance of further investigating the SGR2 gene for a more comprehensive understanding.
3.7. Subcellular Location of MdSGR2
Transient expression of 35S:GFP-MdSGR2 in tobacco was observed by laser confocal microscopy (Figure 4). The results showed that the green fluorescence signal of 35S:GFP-MdSGR2 only existed in chloroplasts, while the fluorescence signal of 35S:GFP under excitation light was distributed in the whole tobacco cells. The results showed that MdSGR2 was localized in chloroplasts.
3.8. Transient Overexpression of MdSGR2 in Tobacco Leaf and Apple Peel Analysis
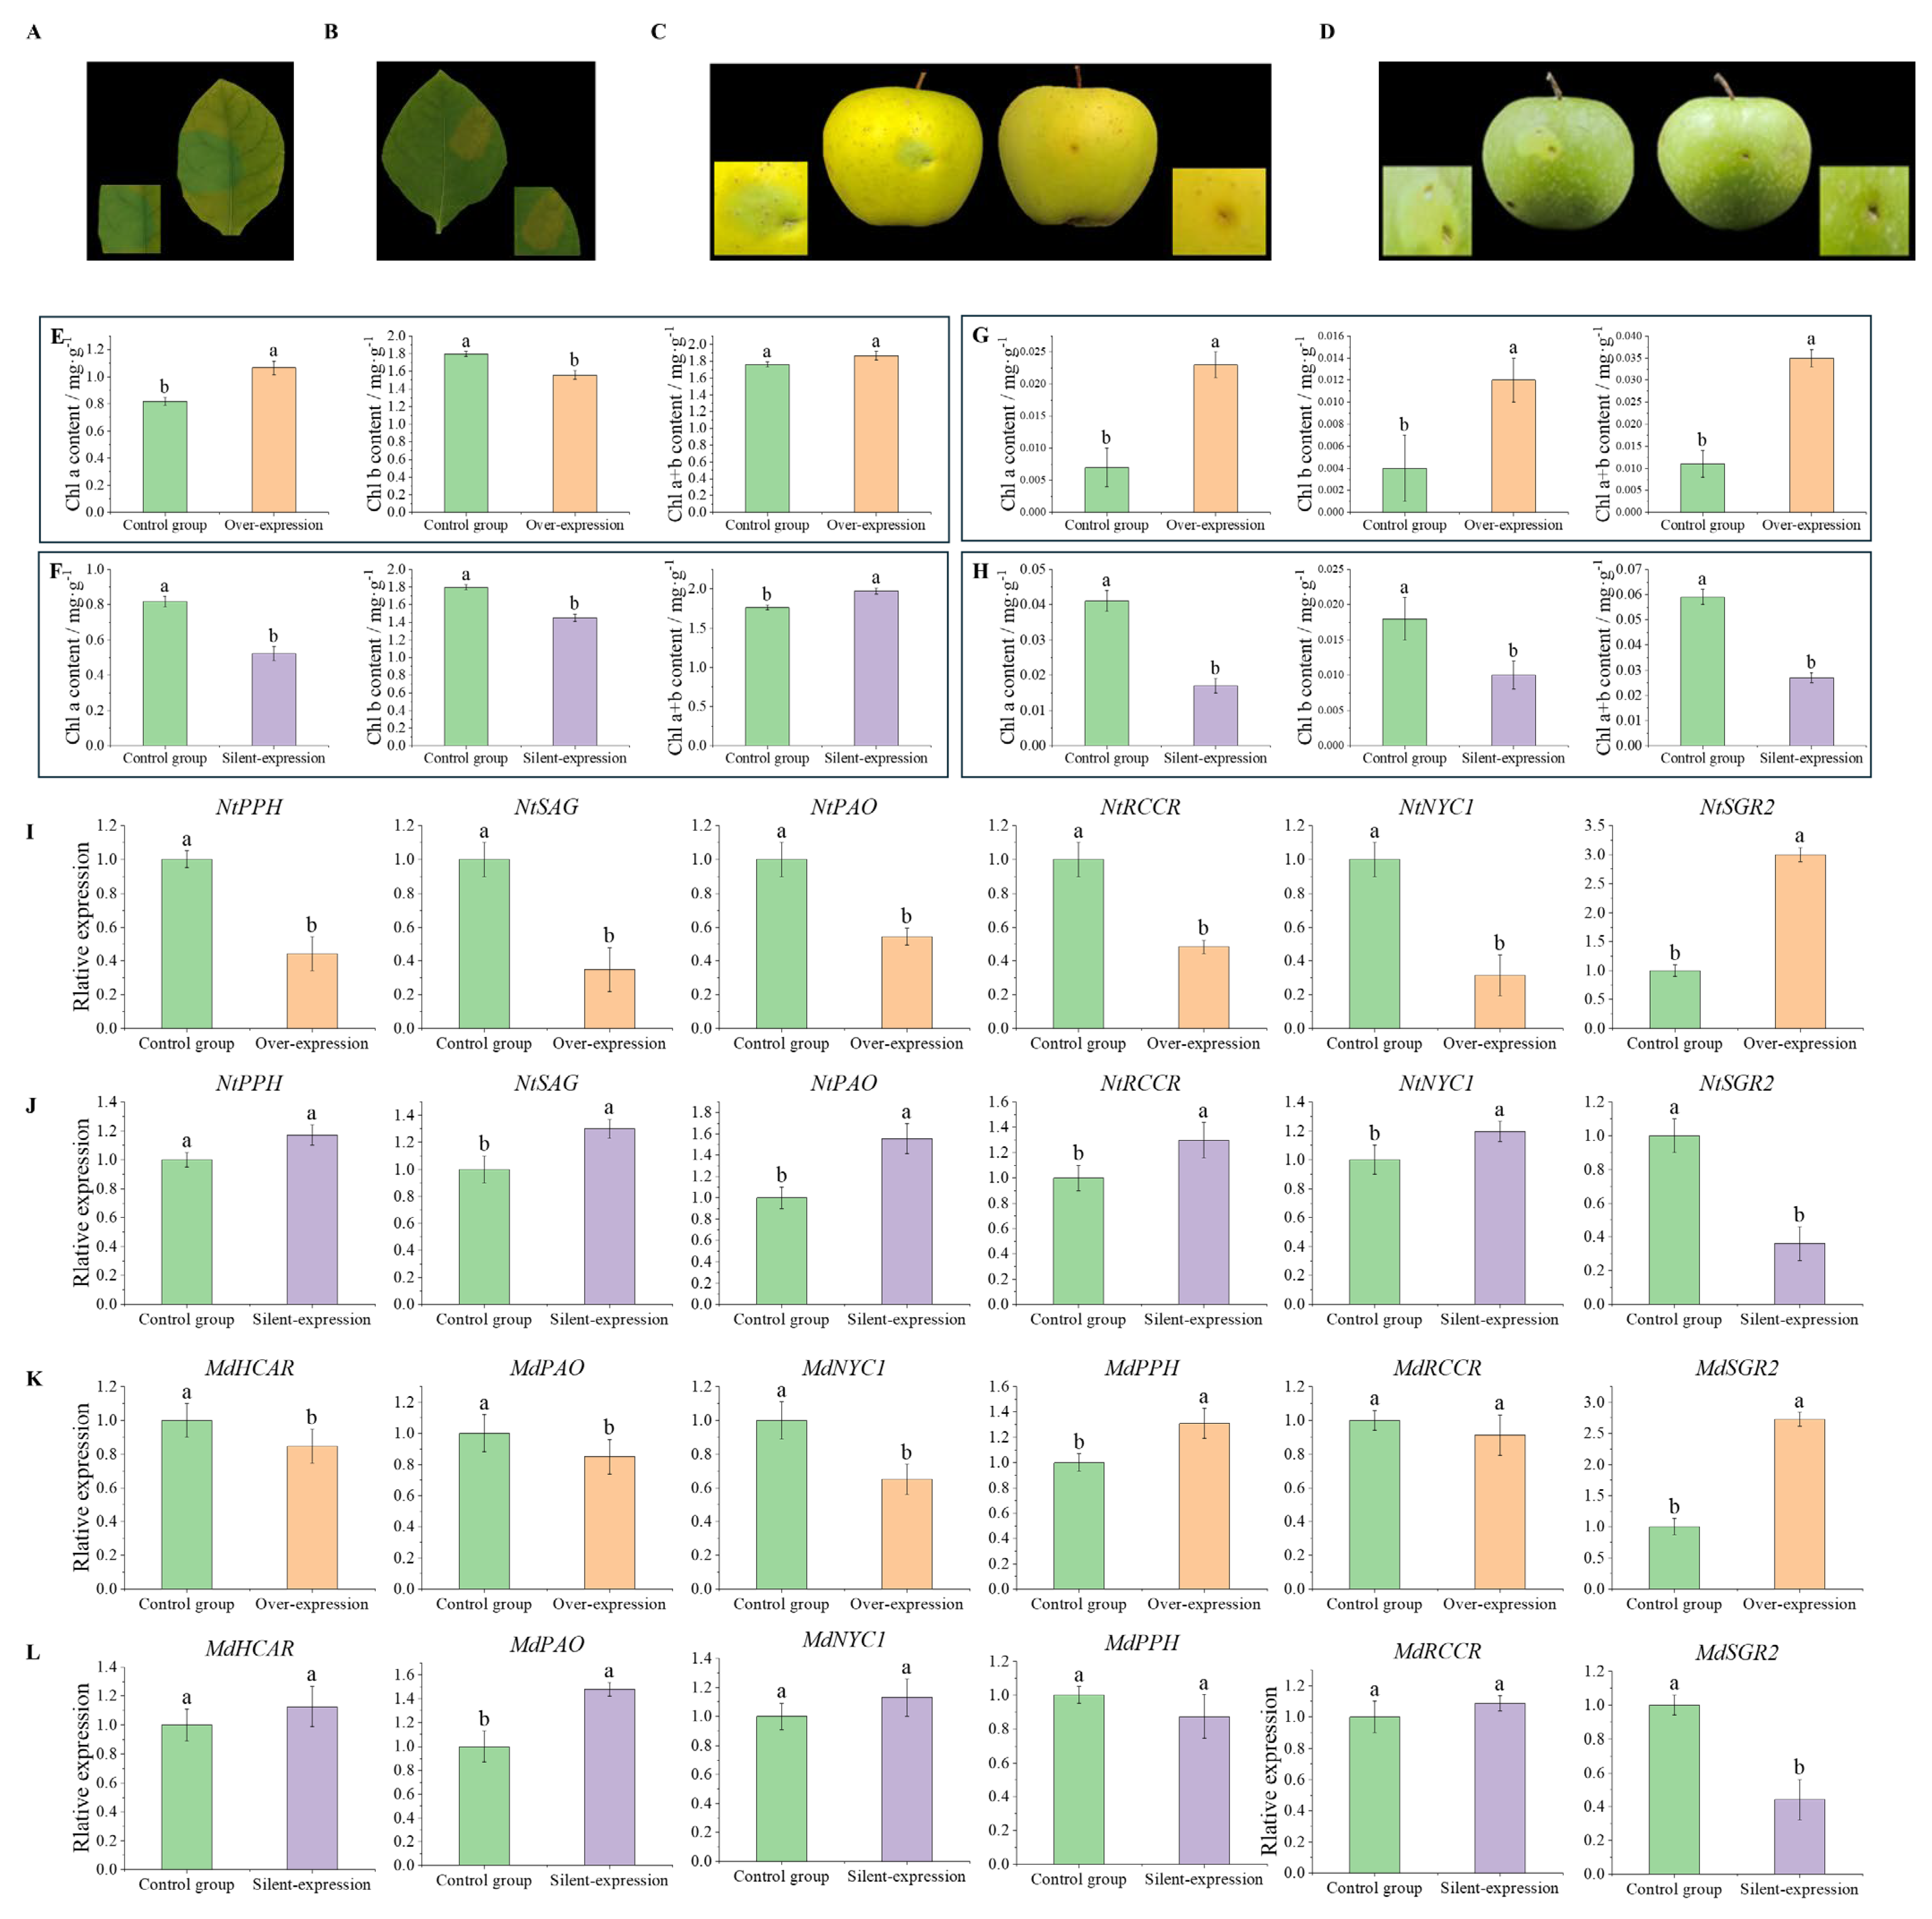
In a controlled experiment on tobacco leaves, one half was injected with a solution of pCAMBIA2301 Agrobacterium, while the other half received a solution of pCAMBIA2301-MdSGR2 Agrobacterium. As the plants matured, distinct outcomes emerged: The leaves injected with the pCAMBIA2301-MdSGR2 Agrobacterium solution retained their green color, whereas those injected with the pCAMBIA2301 Agrobacterium solution exhibited a yellow color (refer to Figure 5A). Subsequent analysis involved determining the chlorophyll content in the expressed tobacco leaves. The results indicated a significant increase in chlorophyll content following overexpression compared to the control (see Figure 5E). Furthermore, the relative expression levels of the NtSAG, NtPAO, NtNYCI, NtPPH, NtRCCR, and NtSGR2 genes in tobacco were assessed (illustrated in Figure 5I). The findings highlight that the relative expression levels of NtSAG, NtPAO, NtNYCI, NtPPH, and NtRCCR in tobacco leaves were notably lower than those in the control group.
The peel of the “Golden Delicious” apple underwent alternate injections of pCAMBIA2301 and pCAMBIA2301-MdSGR2 Agrobacterium solutions. The outcome revealed that the areas injected with the pCAMBIA2301-MdSGR2 Agrobacterium solution retained a green color, whereas the regions injected with the pCAMBIA2301 Agrobacterium solution exhibited a yellow coloration due to chlorophyll degradation (refer to Figure 5C). Following overexpression in the “Golden Delicious” apple peel, the levels of chlorophyll a and chlorophyll b significantly surpassed those of the control group (depicted in Figure 5G). Moreover, the relative expression levels of MdSGR2, MdNYC1, MdHCAR, MdPPH, MdPAO, and MdRCCR were scrutinized (as shown in Figure 5K). The findings indicate a notable 2.73-fold increase in the relative expression level of MdSGR2 in the overexpressed peel. While the MdPPH and MdSGR2 expression escalated in comparison to the control, the relative expression of the other genes declined. These results suggest that both homologous and heterologous overexpression of MdSGR2 play a negative regulatory role in chlorophyll degradation.
3.9. Instantaneous Silencing of MdSGR2 in the Tobacco Leaves and Apple Peel
On the same tobacco leaf, one half was injected with the pTRV1:pTRV2 Agrobacterium solution, and the other half was injected with the pTRV1:pTRV2-MdSGR2 Agrobacterium solution. The results showed that the leaf color of the control group did not change with the growth of the plant, while the leaf color of the experimental group showed chlorosis after injection of the pTRV1:pTRV2-MdSGR2 Agrobacterium solution (Figure 5B). After the silencing of MdSGR2, the contents of chlorophyll a and chlorophyll b were significantly lower than those of the control group (Figure 5F). The relative expression levels of NtSAG, NtPAO, NtNYC1, and NtRCCR were significantly higher than those of the control (Figure 5J).
The “Granny Smith” apple peel was alternately injected with pTRV1:pTRV2 and pTRV1:pTRV2-MdSGR2 Agrobacterium solutions. The results showed that the peel color of the region injected with pTRV1:pTRV2-MdSGR2 was light green, while the peel color of the region injected with pTRV1:pTRV2 was not significantly changed (Figure 5D). After silencing MdSGR2 in the peel of the “Granny Smith” apples, the chlorophyll content was significantly lower than that of the control (Figure 5H). The relative expression of MdSGR2 in the pericarp was decreased by 0.56 times (Figure 5L). The expression of MdPPH decreased compared to the control, and the relative expression of the other genes increased. These results suggest that the silencing of MdSGR2 has a positive regulatory effect on chlorophyll degradation.
4. Discussion
Fruit color is an important index of the appearance quality of apples, and fruit chlorosis at maturity directly affects fruit color formation. Chlorophyllin and the yellowing of green fruit and vegetables are caused by chlorophyll degradation, and SGR2 is a key regulatory gene involved in the plant chlorophyll degradation pathway. In the current study, the key gene MdSGR2 for apple fruit peel chlorophyll degradation was found through transcriptome sequencing. Then, the gene was cloned and subcellular localization and expression vectors were constructed to analyze its function, which could lay the foundation for further study on apple color formation.
At present, transcriptome sequencing technology is widely used in the mining of functional genes in many species [17,39,40]. Zhang et al. [41] conducted transcriptome and metabolome analysis on three different pericarp samples (gray–green, dark green, and yellow), and identified a total of 40 flavonoids related to pericarp coloring. Li et al. [42] performed transcriptome analysis of fig peel in the yellow (Y) and red (R) stages, and obtained 23 anthocyanin-related genes. Lai et al. [43] constructed a cDNA library of three different coloring stages of litchi peel. They found genes encoding enzymes involved in chlorophyll degradation and flavonoid biosynthesis. In this study, through GO analysis, significant enrichment was found in ADP binding, thylakoids, and photosynthesis. The KEGG results showed that it was enriched in plant hormone signal transduction and photosynthesis. These are all related to photosynthesis, which occurs in chloroplasts. The formation of chloroplasts requires light, which regulates the levels of hormones in plants, including brassin, cytokinin, auxin, and gibberellin, which regulate chloroplast development [44]. A light reaction takes place in the thylakoids of chloroplasts, and this process is accompanied by material and energy changes. In the presence of light, enzymes, and chlorophyll, chloroplasts use the absorbed light energy to break down water into H and O2. At the same time, ADP and Pi undergo a chemical reaction to generate ATP, and light energy is transformed into active chemical energy in ATP [45]. Among them, chlorophyll plays the role of absorbing light energy, which is a necessary condition for photosynthesis. Then, MdSGR2, a key gene for chlorophyll degradation, was used as the research object for subcellular localization, and the results showed that it was located in chloroplasts.
Subcellular localization is an indispensable technique for studying gene function. Proteins could be located in the nucleus, various organelles, and membranes of cells, which lays the foundation for studying the mechanism of gene action. The prediction of subcellular localization showed the probability of this protein being located in mitochondria. This is inconsistent with the results of previous studies on the subcellular localization of the SGR protein in tomatoes [46], Zoysia japonica [47], rice [25] and Tribulus terrestris alfalfa [48]. Therefore, we further confirmed the subcellular localization of MdSGR2 by fusion reporter gene analysis. A GFP expression vector of MdSGR2 was constructed and expressed instantaneously in tobacco. Confocal laser microscopy showed that MdSGR2 is localized in chloroplasts, which is consistent with the subcellular localization of the SGR protein in tomatoes [46], rice [25], Arabidopsis [26], Zoysia japonica [47], and Medicago terrestris [45]. This result not only proves the properties of MdSGR2, but also provides instructions for subsequent experiments.
The construction of a plant expression vector for transient gene expression is a rapid and effective technique for studying gene functions, which has been widely applied in many plants. Zhang et al. [49] successfully constructed the plant overexpression vector pCAMBIA2301-MdMYB10. They injected the plant super expression vector pCAMBIA2301-MdMYB10 Agrobacterium solution and pCAMBIA2301 Agrobacterium solution into fruit peel. The area of peel in which MdMYB10 was overexpressed was deeply colored, while the color of the peel of the control group was not significantly different from the surrounding area. Liu et al. [50] constructed plant overexpression vectors pGreenII 62-SK-MiPAO and pGreenII 62-SK-MiRCCR and studied the role of the MiPAO and MiRCCR genes in the chlorophyll degradation of mango peel by injecting Micro-Tom tomato stems with Agrobacteria-mediated injection. It was shown that the overexpression of MiPAO and MiRCCR accelerated the color transformation of tomatoes. At present, there have been many reports about SGR genes regulating the biological function of chlorophyll degradation in plants. Liu et al. [51] transformed the stagnant green gene CbSGR into Arabidopsis by inflorescence infection and found that the overexpressed lines showed yellowing and accelerated the senescence of the plants. Zhou et al. [48] cloned MsSGR and obtained transgenic alfalfa lines through RNA interference. They showed that the silencing of the MsSGR gene resulted in the green retention of transgenic alfalfa. All of the above studies indicate that the SGR gene can promote chlorophyll degradation. However, in this study, we found that MdSGR2 negatively regulates chlorophyll degradation. The function of MdSGR2 is consistent with that of SGR2 studied by Ma et al. [46] in tomatoes and by Sakuraba et al. [20] in Arabidopsis. Sakuraba et al. [20] overexpressed the SGR2 gene in Arabidopsis and found that the plants showed an evergreen phenotype, and the sgr2-1 knockout mutant had advanced leaf yellowing under natural aging. Since the phenotype of overexpressed SGR2 is opposite to that of SGR1-regulated plants, we hypothesized that SGR1 and SGR2 may interact differently with the six known CCEs (NOL, NYC1, HCAR, PPH, PAO, and RCCR). This was validated by Sakuraba et al. [35], who first used a yeast two-hybrid assay to detect pair-to-pair interactions between two SGRs and CCEs. The results showed that the CCE interaction capacity of SGR2 is quite limited compared to that of SGR1, except for its interaction with RCCR. Their pairwise interactions were further examined by in vitro protein-binding experiments, and the results of these pull-down tests were found to be consistent with those of the yeast two-hybridization tests. It can be concluded that the difference in the aging phenotypes between two SGR overexpressing lines and two SGR mutants is related to the difference in the interaction ability between SGR and CCEs. The above studies provide strong evidence for the current study, indicating that the SGR2 gene is involved in plant aging and plays a negative regulatory role in the process of chlorophyll degradation, while silencing this gene accelerates plant aging and promotes chlorophyll degradation.
5. Conclusions
A total of 9632 DEGs were identified, and 1206 DEGs were classified in 118 KEGG metabolic pathways. Additionally, 3258 transcription factors from 428 gene families were predicted. Furthermore, the key gene for chlorophyll degradation, MdSGR2, was selected from the transcriptome analysis of the “Granny Smith” and “Golden Delicious” apples. MdSGR2 was localized in chloroplasts by subcellular location analysis. The transient overexpression of MdSGR2 negatively regulated chlorophyll degradation, inhibited or slowed down chlorophyll degradation, and resulted in green stagnation in the leaves and peel.
Supplementary Materials
The following supporting information can be downloaded at: https://www.mdpi.com/article/10.3390/horticulturae10050439/s1, Table S1: qRT-PCR primer sequence; Table S2: Statistics of comparison between samples and reference genomes; Table S3: Differential genes in the metabolic pathways of porphyrin and chlorophyll.
Author Contributions
Validation, S.X.; data curation, S.X.; writing—original draft preparation, S.X.; investigation, P.Y. and X.Z. (Xiong Zheng); software, C.L. and J.K.; writing—review and editing, Y.G., D.Z., X.Z. (Xiaojun Zhang) and Y.H. All authors have read and agreed to the published version of the manuscript.
Funding
This work was supported by the Basic Research Program of Shanxi Province (No. 20210302123396); the science and technology major project of Shanxi Province (No. 202201140601027) and the Technology Innovation Fund of Shanxi Agricultural University (No. 2014YJ01).
Data Availability Statement
The data presented in this study are available upon request from the corresponding author due to privacy concerns.
Conflicts of Interest
The authors declare no conflicts of interest.
References
- An, J.-P.; Zhang, X.; Bi, S.Q.; You, C.-X.; Wang, X.-F.; Hao, Y. The ERF transcription factor MdERF38 promotes drought stress-induced anthocyanin biosynthesis in apple. Plant J. 2019, 101, 573–589. [Google Scholar] [CrossRef] [PubMed]
- Chen, H.; Ji, H.; Huang, W.; Zhang, Z.; Zhu, K.; Zhu, S.; Chai, L.; Ye, J.; Deng, X. Transcription factor CrWRKY42 coregulates chlorophyll degradation and carotenoid biosynthesis in citrus. Plant Physiol. 2024, kiae048. [Google Scholar] [CrossRef] [PubMed]
- Ryu, J.-A.; Duan, S.; Jeong, H.-Y.; Lee, C.; Kang, I.-K.; Eom, S.H. Pigmentation and flavonoid metabolite diversity in immature ‘Fuji’ apple fruits in response to lights and methyl jasmonate. Int. J. Mol. Sci. 2022, 23, 1722. [Google Scholar] [CrossRef] [PubMed]
- Wang, W.; Celton, J.-M.; Buck-Sorlin, G.; Balzergue, S.; Bucher, E.; Laurens, F. Skin color in apple fruit (Malus × domestica): Genetic and epigenetic insights. Epigenomes 2020, 4, 13. [Google Scholar] [CrossRef] [PubMed]
- Zou, S.; Zhuo, M.; Abbas, F.; Hu, G.; Wang, H.; Huang, X. Transcription factor LcNAC002 coregulates chlorophyll degradation and anthocyanin biosynthesis in litchi. Plant Physiol. 2023, 192, 1913–1927. [Google Scholar] [CrossRef] [PubMed]
- Zhang, X.; Xu, R.; Liu, Y.; You, C.-X.; An, J.-P. MdVQ10 promotes wound-triggered leaf senescence in association with MdWRKY75 and undergoes antagonistic modulation of MdCML15 and MdJAZs in apple. Plant J. 2023, 115, 1599–1618. [Google Scholar] [CrossRef]
- Pruzinská, A.; Tanner, G.; Anders, I.; Roca, M.; Hörtensteiner, S. Chlorophyll breakdown: Pheophorbide a oxygenase is a Rieske-type iron-sulfur protein, encoded by the accelerated cell death 1 gene. Proc. Natl. Acad. Sci. USA 2003, 100, 15259–15264. [Google Scholar] [CrossRef]
- Sun, L.; Xu, H.; Song, J.; Yang, X.; Wang, X.; Liu, H.; Pang, M.; Hu, Y.; Yang, Q.; Ning, X.; et al. OsNAC103, a NAC transcription factor, positively regulates leaf senescence and plant architecture in Rice. Rice 2024, 17, 15. [Google Scholar] [CrossRef]
- Taylor, L.; Nunes-Nesi, A.; Parsley, K.; Leiss, A.E.; Leach, G.E.; Coates, S.; Wingler, A.; Fernie, A.R.; Hibberd, J.M. Cytosolic pyruvate, orthophosphate dikinase functions in nitrogen remobilization during leaf senescence and limits individual seed growth and nitrogen content. Plant J. 2010, 62, 641–652. [Google Scholar] [CrossRef]
- Vom Dorp, K.; Hölzl, G.; Plohmann, C.; Eisenhut, M.; Abraham, M.; Weber, A.P.M.; Hanson, A.D.; Dörmann, P. Remobilization of phytol from chlorophyll degradation is essential for tocopherol synthesis and growth of Arabidopsis. Plant Cell 2015, 27, 2846–2859. [Google Scholar] [CrossRef]
- Zhao, Y.; Xu, W.; Wang, L.; Han, S.; Zhang, Y.; Liu, Q.; Liu, B.; Zhao, X. A maize necrotic leaf mutant caused by defect of coproporphyrinogen III oxidase in the porphyrin pathway. Genes 2022, 13, 272. [Google Scholar] [CrossRef] [PubMed]
- Hu, X.; Gu, T.; Khan, I.; Zada, A.; Jia, T. Research progress in the interconversion, turnover and degradation of chlorophyll. Cells 2021, 10, 3134. [Google Scholar] [CrossRef] [PubMed]
- Christ, B.; Hörtensteiner, S. Mechanism and significance of chlorophyll breakdown. J. Plant Growth Regul. 2013, 33, 4–20. [Google Scholar] [CrossRef]
- Tanaka, R.; Tanaka, A. Chlorophyll cycle regulates the construction and destruction of the light-harvesting complexes. Biochim. Biophys. Acta 2011, 1807, 968–976. [Google Scholar] [CrossRef] [PubMed]
- Kusaba, M.; Ito, H.; Morita, R.; Iida, S.; Sato, Y.; Fujimoto, M.; Kawasaki, S.; Tanaka, R.; Hirochika, H.; Nishimura, M.; et al. Rice NON-YELLOW COLORING1 is involved in light-harvesting complex II and grana degradation during leaf senescence. Plant Cell 2007, 19, 1362–1375. [Google Scholar] [CrossRef] [PubMed]
- Sato, Y.; Morita, R.; Katsuma, S.; Nishimura, M.; Tanaka, A.; Kusaba, M. Two short-chain dehydrogenase/reductases, NON-YELLOW COLORING 1 and NYC1-LIKE, are required for chlorophyll b and light-harvesting complex II degradation during senescence in rice. Plant J. 2009, 57, 120–131. [Google Scholar] [CrossRef] [PubMed]
- Cheng, Y.; Dong, Y.; Yan, H.; Ge, W.; Shen, C.; Guan, J.; Liu, L.; Zhang, Y. Effects of 1-MCP on chlorophyll degradation pathway-associated genes expression and chloroplast ultrastructure during the peel yellowing of Chinese pear fruits in storage. Food Chem. 2012, 135, 415–422. [Google Scholar] [CrossRef] [PubMed]
- Jiao, B.; Meng, Q.; Lv, W. Roles of stay-green (SGR) homologs during chlorophyll degradation in green plants. Bot. Stud. 2020, 25, 61–73. [Google Scholar] [CrossRef] [PubMed]
- Liu, Y.; Ou, L.; Liu, Z.; Lv, J.; Wang, J.; Song, J.; Yang, B.; Chen, W.; Yang, S.C.; Liu, W.; et al. A novel single-base mutation in CaSGR1 confers the stay-green phenotype in pepper (Capsicum annuum L.). Hortic. Plant J. 2022, 9, 293–305. [Google Scholar] [CrossRef]
- Sakuraba, Y.; Park, S.-Y.; Paek, N.-C. The divergent roles of STAYGREEN (SGR) homologs in chlorophyll degradation. Mol. Cells 2015, 38, 390–395. [Google Scholar] [CrossRef]
- Uluisik, S.; Kiyak, A.; Kurt, F.; Filiz, E. STAY-GREEN (SGR) genes in tomato (Solanum lycopersicum): Genome-wide identification, and expression analyses reveal their involvements in ripening and salinity stress responses. Hortic. Environ. Biotechnol. 2022, 63, 557–569. [Google Scholar] [CrossRef]
- Yang, M.; Zhu, S.; Jiao, B.; Duan, M.; Meng, Q.; Ma, N.; Lv, W. SlSGRL, a tomato SGR-like protein, promotes chlorophyll degradation downstream of the ABA signaling pathway. Plant Cell 2020, 157, 316–327. [Google Scholar] [CrossRef]
- Armstead, I.; Donnison, I.S.; Aubry, S.; Harper, J.A.; Hörtensteiner, S.; James, C.L.; Mani, J.; Moffet, M.D.; Ougham, H.; Roberts, L.A.; et al. Cross-species identification of mendel’s/locus. Science 2007, 315, 73. [Google Scholar] [CrossRef] [PubMed]
- Barry, C.S.; McQuinn, R.P.; Chung, M.-Y.; Besuden, A.; Giovannoni, J.J. Amino acid substitutions in homologs of the STAY-GREEN protein are responsible for the green-flesh and chlorophyll retainer mutations of tomato and pepper. Plant Physiol. 2008, 147, 179–187. [Google Scholar] [CrossRef] [PubMed]
- Park, S.-Y.; Yu, J.W.; Park, J.-S.; Li, J.; Yoo, S.-C.; Lee, N.-Y.; Lee, S.-K.; Jeong, S.-W.; Seo, H.S.; Koh, H.-J.; et al. The senescence-induced staygreen protein regulates chlorophyll degradation. Plant Cell 2007, 19, 1649–1664. [Google Scholar] [CrossRef]
- Ren, G.; An, K.; Liao, Y.; Zhou, X.; Cao, Y.; Zhao, H.; Ge, X.; Kuai, B. Identification of a novel chloroplast protein AtNYE1 regulating chlorophyll degradation during leaf senescence in Arabidopsis. Plant Physiol. 2007, 144, 1429–1441. [Google Scholar] [CrossRef]
- Shang, X. Construction of integration QTL map and identification of candidate genes for stay-green in maize. Acta Pratac. Sin. 2012, 21, 175–185. [Google Scholar]
- Rong, H.L.; Tang, Y.; Zhang, H.; Wu, P.; Chen, Y.; Li, M.; Wu, G.; Jiang, H. The Stay-Green Rice like (SGRL) gene regulates chlorophyll degradation in rice. J. Plant Physiol. 2013, 170, 1367–1373. [Google Scholar] [CrossRef]
- Shin, D.; Lee, S.; Kim, T.-H.; Lee, J.-H.; Park, J.; Lee, J.; Lee, J.Y.; Cho, L.-H.; Choi, J.Y.; Lee, W.; et al. Natural variations at the Stay-Green gene promoter control lifespan and yield in rice cultivars. Nat. Commun. 2020, 11, 2819–2830. [Google Scholar] [CrossRef]
- Zhu, K.; Zheng, X.; Ye, J.; Huang, Y.; Chen, H.; Mei, X.; Xie, Z.; Cao, L.; Zeng, Y.; Larkin, R.M.; et al. Regulation of carotenoid and chlorophyll pools in hesperidia, anatomically unique fruits found only in Citrus. Plant Physiol. 2021, 187, 829–845. [Google Scholar] [CrossRef]
- Chen, X.; Li, J.; Yu, Y.; Kou, X.; Periakaruppan, R.; Chen, X.; Li, X. STAY-GREEN and light-harvesting complex II chlorophyll a/b binding protein are involved in albinism of a novel albino tea germplasm ‘Huabai 1’. Sci. Hortic. 2022, 293, 653–665. [Google Scholar] [CrossRef]
- Luo, Z.; Zhang, J.; Li, J.; Yang, C.; Wang, T.; Ouyang, B.; Li, H.; Giovannoni, J.J.; Ye, Z. A STAY-GREEN protein SlSGR1 regulates lycopene and β-carotene accumulation by interacting directly with SlPSY1 during ripening processes in tomato. New Phytol. 2013, 198, 442–452. [Google Scholar] [CrossRef] [PubMed]
- Hu, Z.; Deng, L.; Yan, B.W.; Pan, Y.; Luo, M.; Chen, X.; Hu, T.; Chen, G. Silencing of the LeSGR1 gene in tomato inhibits chlorophyll degradation and exhibits a stay-green phenotype. Biol. Plant. 2011, 55, 27–34. [Google Scholar] [CrossRef]
- Sakuraba, Y.; Kim, D.; Kim, Y.-S.; Hörtensteiner, S.; Paek, N.-C. Arabidopsis STAYGREEN-LIKE (SGRL) promotes abiotic stress-induced leaf yellowing during vegetative growth. FEBS Lett. 2014, 588, 3830–3837. [Google Scholar] [CrossRef] [PubMed]
- Sakuraba, Y.; Park, S.-Y.; Kim, Y.-S.; Wang, S.-H.; Yoo, S.-C.; Hörtensteiner, S.; Paek, N.-C. Arabidopsis STAY-GREEN2 is a negative regulator of chlorophyll degradation during leaf senescence. Plant Mol. Biol. 2014, 7, 1288–1302. [Google Scholar] [CrossRef] [PubMed]
- Sakuraba, Y.; Schelbert, S.; Park, S.-Y.; Han, S.-H.; Lee, B.-D.; Andrès, C.B.; Kessler, F.; Hörtensteiner, S.; Paek, N.-C. STAY-GREEN and chlorophyll catabolic enzymes interact at light-harvesting complex II for chlorophyll detoxification during leaf senescence in arabidopsis. Plant Cell 2012, 24, 507–518. [Google Scholar] [CrossRef] [PubMed]
- Gao, J. Experimental Supervision of Plant Physiology, 1st ed.; Higher Education Press: Beijing, China, 2006; pp. 74–76. [Google Scholar]
- Mortazavi, A.; Williams, B.A.; McCue, K.; Schaeffer, L.; Wold, B.J. Mapping and quantifying mammalian transcriptomes by RNA-Seq. Nat. Methods 2008, 5, 621–628. [Google Scholar] [CrossRef]
- Chen, Z.; Yu, L.; Liu, W.; Zhang, J.; Wang, N.; Chen, X. Research progress of fruit color development in apple (Malus domestica Borkh.). Plant Physiol. Biochem. 2021, 162, 267–279. [Google Scholar] [CrossRef]
- Wang, S.; Shi, X.; Liu, F.; Laborda, P. Effects of exogenous methyl jasmonate on quality and preservation of postharvest fruits. Food Chem. 2021, 353, 129482. [Google Scholar] [CrossRef]
- Zhang, A.; Zheng, J.; Chen, X.; Shi, X.; Wang, H.; Fu, Q. Comprehensive analysis of transcriptome and metabolome reveals the flavonoid metabolic pathway is associated with fruit peel coloration of melon. Molecules 2021, 26, 2830. [Google Scholar] [CrossRef]
- Zhu, K.; Chen, H.; Mei, X.; Lu, S.; Xie, H.; Liu, J.; Chai, L.; Xu, Q.; Wurtzel, E.T.; Ye, J.; et al. Transcription factor CsMADS3 coordinately regulates chlorophyll and carotenoid pools in Citrus hesperidium. Plant Physiol. 2023, 193, 519–536. [Google Scholar] [CrossRef] [PubMed]
- Lai, B.; Hu, B.; Qin, Y.; Zhao, J.; Wang, H.; Hu, G. Transcriptomic analysis of Litchi chinensis pericarp during maturation with a focus on chlorophyll degradation and flavonoid biosynthesis. BMC Genom. 2015, 16, 225. [Google Scholar] [CrossRef] [PubMed]
- Cackett, L.; Luginbuehl, L.H.; Schreier, T.B.; Lopez-Juez, E.; Hibberd, J.M. Chloroplast development in green plant tissues: The interplay between light, hormone, and transcriptional regulation. New Phytol. 2022, 233, 2000–2016. [Google Scholar] [CrossRef]
- Miller, T.E.; Beneyton, T.; Schwander, T.; Diehl, C.; Girault, M.; McLean, R.; Chotel, T.; Claus, P.; Cortina, N.S.; Baret, J.C.; et al. Light-powered CO2 fixation in a chloroplast mimic with natural and synthetic parts. Science 2020, 368, 649–654. [Google Scholar] [CrossRef] [PubMed]
- Ma, J.; Dong, X.; Yu, L.; Zhang, Y. Response and function of Solanum lycopersicum L. SlSGR2 gene under cadmium stress. Horticulturae 2022, 8, 1002–1015. [Google Scholar] [CrossRef]
- Teng, K.; Chang, Z.; Xiao, G.; Guo, W.E.; Xu, L.X.; Chao, Y.; Han, L.B. Molecular cloning and characterization of a chlorophyll degradation regulatory gene (ZjSGR) from Zoysia japonica. Genet. Mol. Res. 2016, 15, 1–10. [Google Scholar] [CrossRef] [PubMed]
- Zhou, C.; Han, L.; Pislariu, C.I.; Nakashima, J.; Fu, C.; Jiang, Q.; Quan, L.; Blancaflor, E.B.; Tang, Y.; Bouton, J.H.; et al. From model to crop: Functional analysis of a STAY-GREEN gene in the model legume medicago truncatula and effective use of the gene for alfalfa improvement. Plant Physiol. 2011, 157, 1483–1496. [Google Scholar] [CrossRef]
- Zhang, B.; Qu, D.; Yang, H.; Yang, Y.; Wang, F.; Zhu, Z.; Zhao, Z. Effects of MdMYB10 gene on phenylalanine metabolism in apple peel. Acta Hortic. Sin. 2018, 45, 1429–1440. [Google Scholar]
- Liu, K.; Zhao, Z.; Luo, R.; Chen, Y. Cloning and expression analysis of pheophorbide a oxygenase gene (MiPAO) and construction of silencing expression vector from mango. Acta Agric. Boreali-Sin. 2018, 33, 1–9. [Google Scholar]
- Liu, L.; Tan, P.; Jiang, H.; Chang, Z.; Teng, K. Overexpression of CbSGR, a stay-green gene from carex breviculmis accelerated chlorophyll degradation and senescence in arabidopsis thaliana. Grassl. China 2020, 42, 15–24. [Google Scholar]
Figure 1.
Determination of the ripening fruit phenotypes and related physiological indexes of “Granny Smith” and “Golden Delicious” fruits. (A) The color of the ripened fruit. Y stands for “Golden Delicious” and G stands for “Granny Smith”. (B–E) Color parameters of the “Granny Smith” and “Golden Delicious” fruits. L* refers to the brightness and 0-100 indicates color from black to white. a* indicates red and green, with positive values indicating red and negative values indicating green. b* indicates the degree of yellow and blue, positive values indicate yellow, negative values indicate blue. ho stands for the tonal angle, different tones, different colors. (F–H) Content of chlorophyll in the “Granny Smith” and “Golden Delicious” fruit peel. Error bars represent the standard deviation of three biological replicates. Different lowercase letters indicate significant differences at the 0.05 level, same below (Student’s t-test).
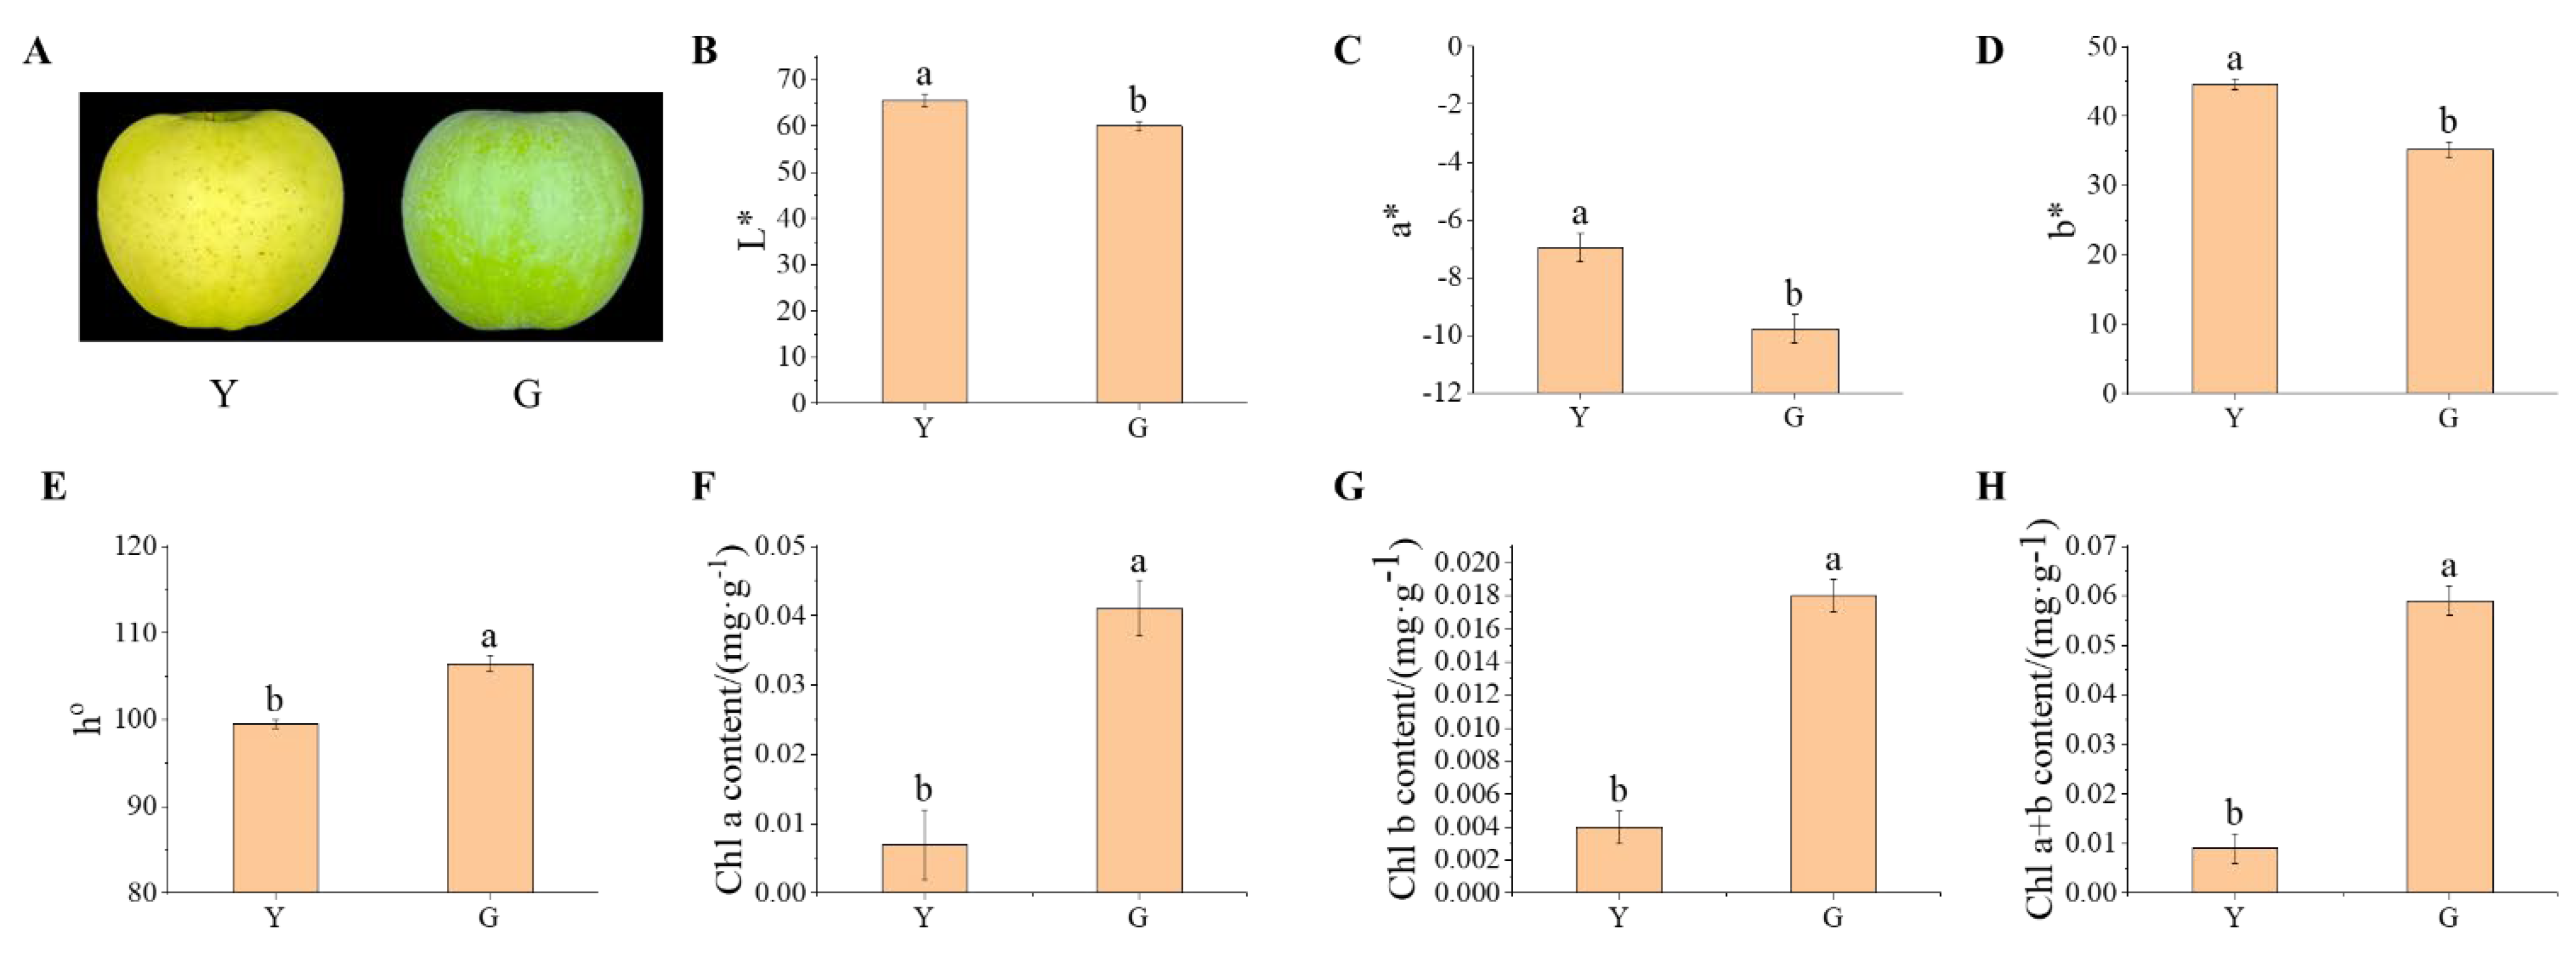
Figure 2.
RNA-seq data of the “Granny Smith” and “Golden Delicious” fruits. (A) Comparisons of the regional distribution. Blue represents the percentage of reads aligned to the exon region. Green represents the percentage of reads aligned to the intron region. Red represents the percentage of reads matched to the intergenic region. (B) The number of DEGs. (C) Volcano map of DEGs. (D) GO enrichment analysis of DEGs. BP, CC and MF stand for biological process, cellular component and molecular function, respectively. (E) Rich distribution points of KEGG enrichment.
Figure 3.
Expression of representative genes by comparing RNA-Seq and qRT-PCR. The purple color indicates the outcomes of RNA-seq analysis, while the yellow color represents the relative expression levels of genes.
Figure 3.
Expression of representative genes by comparing RNA-Seq and qRT-PCR. The purple color indicates the outcomes of RNA-seq analysis, while the yellow color represents the relative expression levels of genes.
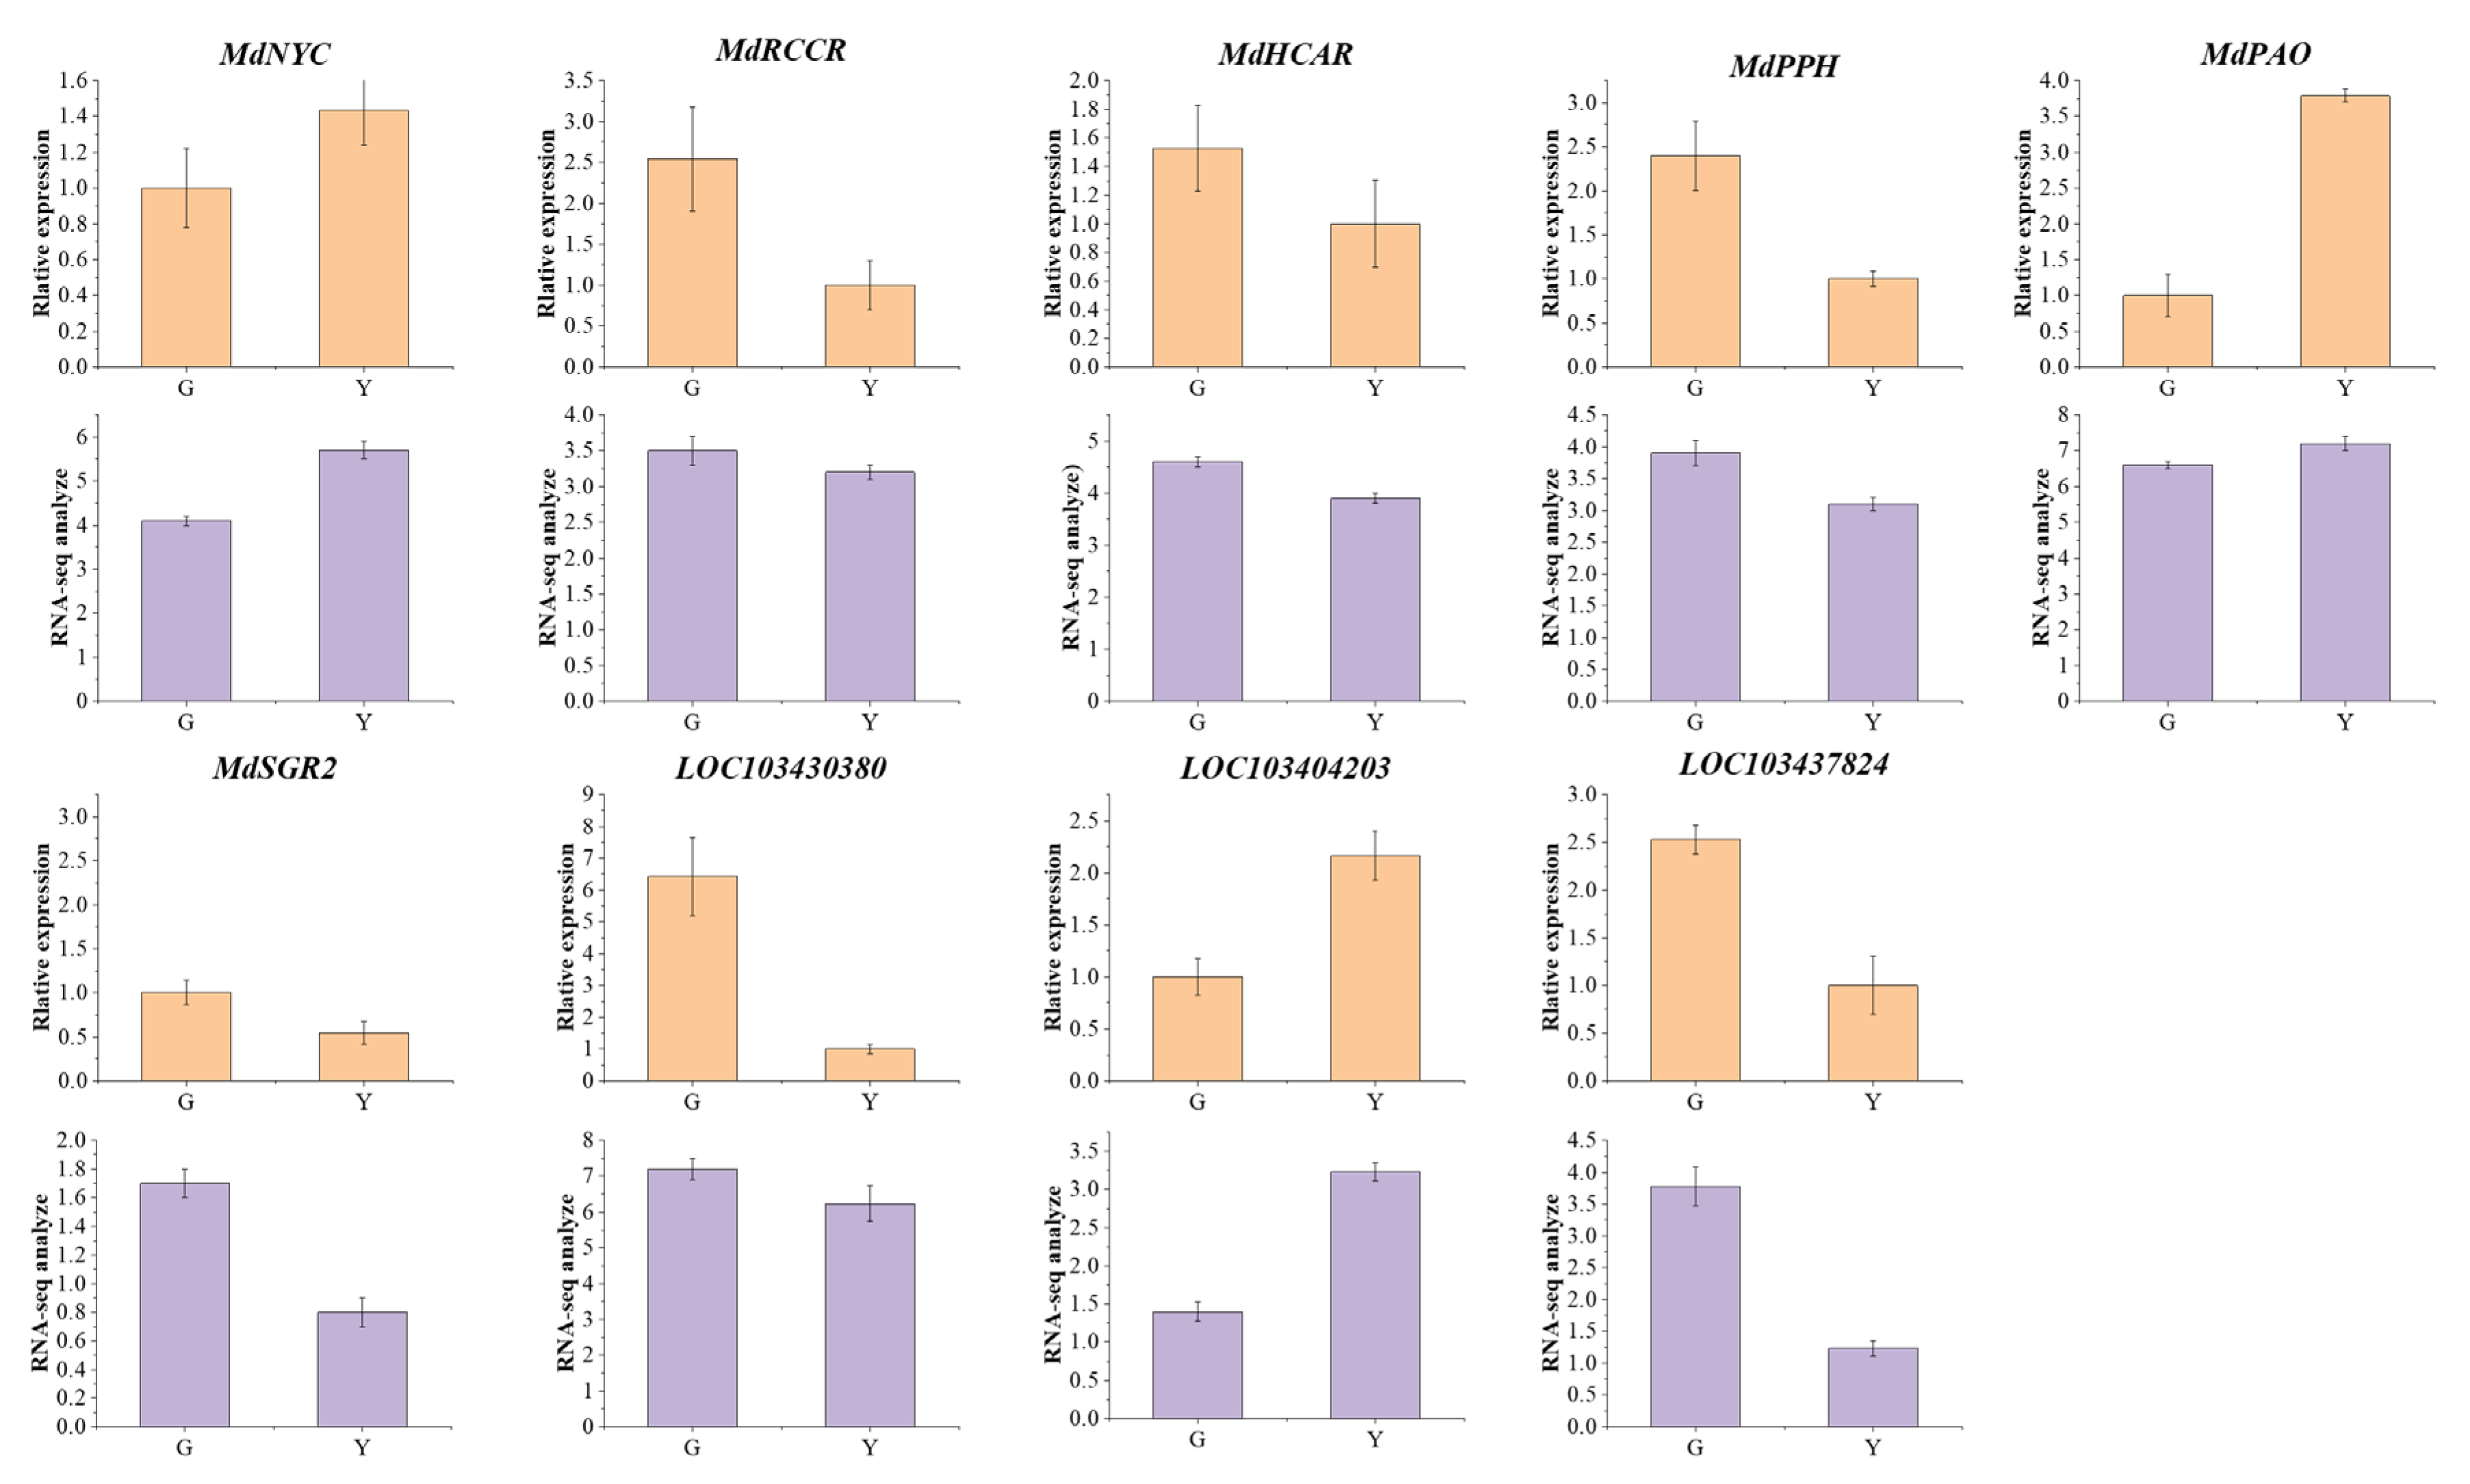
Figure 4.
Subcellular localization analysis of MdSGR2. The red circle refers to the chloroplast.

Figure 5.
Functional analysis of MdSGR2. (A) Phenotype observation of overexpressed tobacco. (B) Silenced tobacco phenotype observation. (C) Color changes in the MdSGR2 transient overexpression region of the “Golden Delicious” apple peel. (D) Color change of the MdSGR2-silent “Granny Smith” apple peel. (E) Chlorophyll content of the tobacco leaves after transient overexpression. (F) Chlorophyll content of the tobacco leaves after transient silencing expression. (G) Chlorophyll content of the “Golden Delicious” apple peel after the overexpression of MdSGR2. (H) Chlorophyll content of the “Granny Smith” apple peel after silencing MdSGR2. (I) Gene expression analysis of the chlorophyll-degradation-related genes in the tobacco leaves that overexpressed MdSGR2. (J) Gene expression analysis of the chlorophyll-degradation-related genes in the tobacco leaves that silenced MdSGR2. (K) Gene expression analysis of the chlorophyll-degradation-related genes in the overexpressed MdSGR2 “Golden Delicious” apple peel. (L) Gene expression analysis of the chlorophyll-degradation-related genes in the peel of the silenced MdSGR2 “Granny Smith” apples. Error bars represent the standard deviation of three biological replicates. Different lowercase letters indicate significant differences at the 0.05 level (Student’s t-test).
Disclaimer/Publisher’s Note: The statements, opinions and data contained in all publications are solely those of the individual author(s) and contributor(s) and not of MDPI and/or the editor(s). MDPI and/or the editor(s) disclaim responsibility for any injury to people or property resulting from any ideas, methods, instructions or products referred to in the content. |
© 2024 by the authors. Licensee MDPI, Basel, Switzerland. This article is an open access article distributed under the terms and conditions of the Creative Commons Attribution (CC BY) license (https://creativecommons.org/licenses/by/4.0/).
Share and Cite
MDPI and ACS Style
Xue, S.; Yao, P.; Kang, J.; Zheng, X.; Liu, C.; Gao, Y.; Zhang, D.; Zhang, X.; Hao, Y. MdSGR2 Negatively Regulates Chlorophyll Degradation in Apple. Horticulturae 2024, 10, 439. https://doi.org/10.3390/horticulturae10050439
AMA Style
Xue S, Yao P, Kang J, Zheng X, Liu C, Gao Y, Zhang D, Zhang X, Hao Y. MdSGR2 Negatively Regulates Chlorophyll Degradation in Apple. Horticulturae. 2024; 10(5):439. https://doi.org/10.3390/horticulturae10050439
Chicago/Turabian StyleXue, Shiyi, Pei Yao, Jiwei Kang, Xiong Zheng, Chang Liu, Yan Gao, Dehui Zhang, Xiaojun Zhang, and Yanyan Hao. 2024. "MdSGR2 Negatively Regulates Chlorophyll Degradation in Apple" Horticulturae 10, no. 5: 439. https://doi.org/10.3390/horticulturae10050439
Note that from the first issue of 2016, this journal uses article numbers instead of page numbers. See further details here.