Article

Modelling and Optimization of Operational Setpoint Parameters for Maximum Fermentative Biohydrogen Production Using Box-Behnken Design

Sustainable Energy & Environment Research Unit, School of Chemical and Metallurgical Engineering, Faculty of Engineering and the Built Environment, University of the Witwatersrand, Private Bag 3, Wits, Johannesburg 2050, South Africa
Fermentation 2016, 2(3), 15; https://doi.org/10.3390/fermentation2030015
Submission received: 3 June 2016 / Revised: 10 July 2016 / Accepted: 15 July 2016 / Published: 20 July 2016
(This article belongs to the Special Issue Biofuels and Biochemicals Production)

Abstract

:
Fermentative biohydrogen production has been flagged as a future alternative energy source due to its various socio-economical benefits. Currently, its production is hindered by the low yield. In this work, modelling and optimization of fermentative biohydrogen producing operational setpoint conditions was carried out. A box-behnken design was used to generate twenty-nine batch experiments. The experimental data were used to produce a quadratic polynomial model which was subjected to analysis of variance (ANOVA) to evaluate its statistical significance. The quadratic polynomial model had a coefficient of determination (R2) of 0.7895. The optimum setpoint obtained were potato-waste concentration 39.56 g/L, pH 5.56, temperature 37.87 °C, and fermentation time 82.58 h, predicting a biohydrogen production response of 537.5 mL H2/g TVS. A validation experiment gave 603.5 mL H2/g TVS resulting to a 12% increase. The R2 was above 0.7 implying the model was adequate to navigate the optimization space. Therefore, these findings demonstrated the feasibility of conducting optimized biohydrogen fermentation processes using response surface methodology.

Graphical Abstract

1. Introduction

The adverse effects of climate change coupled with environmental pollution makes it necessary to search for clean and sustainable energy resources [1,2,3]. Hydrogen is considered as one of the potential alternative fuels because it is a clean energy source and its combustion results in pure water. It can also be used in various applications such as fuel for automobiles, electricity, and thermal energy generation. Moreover, it can be derived from diverse substrates including waste materials.
Amongst the hydrogen producing methods, biological hydrogen production processes are highly recommended in hydrogen research fraternity as compared to thermo-chemical processes because they are environmentally friendly and less-energy intensive, i.e., can be carried out at ambient temperature and pressure. They mainly include photosynthetic and fermentative biohydrogen production. The challenges facing photosynthetic biohydrogen production are low production yields and the requirement for a light source. Meanwhile, fermentative biohydrogen production can produce hydrogen for long periods of time without any light using diverse substrates such as organic wastes and thus has a higher feasibility for industrialization. Moreso, it is more viable and extensively used [4]. Therefore, fermentative biohydrogen production process from waste materials plays a pivotal role because it simultaneously generates hydrogen while curbing environmental pollution.
The optimization of biohydrogen operational setpoint parameters is of critical importance in the research and development of biohydrogen fermentation technology owing to its impact on the economy and practicability of the process. The one dimensional search with successive variation in variables, such as the one-variable-at-a-time (OVAT) method, is still used, albeit it is well understood that it is impractical for the one dimensional search to achieve an appropriate optimum results in a restricted number of experiments [5]. The complexity of combinational interactions of operational setpoint variables and production does not allow for satisfactory detailed modelling [5]. Furthermore, single parameter optimization methods are not only tedious but can lead to misinterpretation of results, especially because the interaction between different factors is overlooked [6,7].
Statistical experimental approaches have been extensively used for many years and it can be implemented at various stages of an optimization strategy, such as screening of experiments or for investigating optimal setpoint parameters on production responses [8]. Fermentation optimization is conducted using a statistically designed experiment in a sequential process [9,10]. This involves a large number of variables that are initially screened and the irrelevant ones are eliminated in order to obtain a fewer and manageable set of parameters. The remaining variables are then optimized by a response surface modelling (RSM) method. Finally, after model building and optimization, the predicted optimum is verified [11,12]. The box-behnken RSM design uses a spherical design with good certainty within the design space. It requires fewer experiments as compared to other RSM designs [13]. In addition, box-behnken design is rotatable regardless of the number of parameters under investigation [14]. This statistical approach has been successfully applied in various fermentative biohydrogen production processes and has been proven to be very efficient in optimizing these processes [15,16,17,18,19].
This study modelled and optimized the operational setpoint parameters of potato-waste concentration, pH, temperature, and fermentation time for maximum biohydrogen production process using box-behnken design. Moreover, the pairwise interactive effect of the above mentioned setpoint parameters was investigated on biohydrogen production response.

2. Materials and Methods

2.1. Inoculum Development

Biohydrogen-producing anaerobic mixed sludge was collected from Olifantvlei Wastewater Treatment Plant, Johannesburg, South Africa. The sludge was boiled at 100 °C for 30 min. This was done in order to deactivate the biohydrogen-consuming methanogenic bacteria and enumerate the biohydrogen spore-forming bacteria. The sludge was supported with a nutrient stock solution (all in g/L): yeast extract 2.0, glucose 10, K2HPO4 0.420, CaCl2 0.375, MgSO4 0.312, NaHCO3 8.0, KCl 0.25. It was then transferred into an Erlenmeyer flask (100 mL) which was covered with foil, and cultured for three days at (30 °C) using a water-bath shaker, this was done to boost the population of biohydrogen-producing bacteria. In addition, the inoculum preparation stage is essential because biohydrogen-producing bacteria, such as Clostridium species, are fastidious and, therefore, a preliminary stage is carried out in order to revive them and increase their cell concentration. This served as inoculum for the twenty nine experimental designs.

2.2. Experimental Design

The four parameters studied and their search ranges were the concentration of potato-waste 10–40 g/L, pH 3–8, temperature 32–38 °C, and fermentation time 5–120 h. Based on these, box-behnken design was used to generate 29 different experiments by varying the operational setpoint parameters, as shown in Table 1.

2.3. Substrates and Pretreatment

Potato-waste was obtained from various dumping sites in the city of Johannesburg, South Africa. The effluents were oven dried at 60 °C for 24 h, and then grounded into fine particles (0.2–0.5 mm). The total volatile solid (TVS) of potato-waste was determined using Equation (1).
TVS = Weight of dried waste Weight of ash Weight of dried waste × 100 %

2.4. Fermentation Process

Substrate concentrations as specified in the design (Table 1) were weighed into 250 mL Erlenmeyer flask, and the volume was raised to 100 mL with distilled water. These were autoclaved prior to the fermentation process. One ml of inoculum was added to each 250 mL flask. The operational setpoint parameters were kept as specified in the design. The fermentation process was conducted in a temperature controlled shaking water-bath. Anaerobic microenvironments were achieved by flushing the fermenter flasks with nitrogen gas for 3 min. The twenty-nine batch fermentation processes were carried out in duplicates.

2.5. Analytical Procedures

Hydrogen was measured and monitored using the hydrogen sensor at 1 h interval (BCP-H2 Bluesens GmbH, Herten, Germany) connected to a computer measuring software system. The sensor has a measuring range of 0%–100% and use a thermal conductivity detector and infrared technology. The cumulative volume of hydrogen was calculated using Equation (2).
VH,i = VH,i−1 + CH,i(VG,iVG,i−1) + VH(CH,iCH,i−1)
VH,i and VH,i−1 are cumulative hydrogen gas volume at the current (i) and previous (i − 1) time intervals, VG,i and VG,i−1 the total biogas volumes in the current and previous time intervals, CH,i and CH,i−1 the fraction of hydrogen gas in the headspace of the reactor in the current and previous time intervals, and VH the total volume of headspace in the reactor [20].

2.6. General Model

The results obtained from the experiments were used to develop a quadratic model that relates hydrogen production to the considered parameters. The general form of the model with four parameters is represented by Equation (3).
Y = α0 + α1x1 + α2x2 + α3x3 + α4x4 + α11x12 + α22x22 + α33x32 + α44x42 + α12x1x2 + α13x1x3 + α14x1x4 + α23x2x3 + α24x2x4 + α34x3x4
where Y is the biohydrogen production response, α0 is the regression coefficient, α1x1 to α4x4 are linear terms, α11x12 to α44x42 are linear coefficient and α12x1x2 to α34x3x4 shows the interaction between parameters on biohydrogen production. The model fitness was evaluated by the analysis of variance (ANOVA) using Design Expert software (Stat Ease, Inc., Minneapolis, MN, USA).

3. Results and Discussion

3.1. The Linear Interactive Effect of Parameters on Biohydrogen Production

Table 1 shows the linear interaction of operational setpoint parameters on biohydrogen production. The hydrogen yields varied from 0 to 528 mL H2/g TVS. The highest biohydrogen production yield was observed in runs 12 and 15, i.e., a maximum biohydrogen yield of 495.5 and 528.0 mL H2/g TVS, respectively, were obtained from these batch experiments. Analysis of individual parameters impact on the biohydrogen production pattern indicated that the fermentation times of 5 and 62.5 h, low pH (3 and 5.5), and low concentration of potato waste (10 and 20 g/L) produce low yields of hydrogen. This is likely attributed to the low pH as confirmed in literature. pH has been identified as one of the most pivotal parameters that influence the growth of biohydrogen-producing bacteria. It also affects the activity of biohydrogen-producing hydrogenase enzymes and its metabolic pathway [4]. Moreover, it was shown that low pH values (below 4) have an inhibitory effect on the activity of biohydrogen-producing bacteria [4].
However, low fermentation time and high pH, moderate temperature, and concentration of potato waste increases the hydrogen yield. Similar findings were reported by Sekoai and Gueguim Kana [4], hence this highlights the importance of operational setpoint parameters on biohydrogen production process modelling and optimization.

3.2. Development of Model for Optimization of Biohydrogen Production

3.2.1. Model Analysis Based on Input Parameters

The experimental data were used to generate a quadratic polynomial equation (Equation (4)). This mathematical model relates hydrogen production to pH, temperature, fermentation time, and substrate concentration. Where Y represents the hydrogen production response; A, B, C, and D represents the operational setpoint parameters of potato-waste concentration, fermentation time, pH, and temperature respectively. Moreover A2, B2, C2, and D2 represents the quadratic coefficients of the above mentioned setpoint parameters.
Y = 707.40 + 248.00A + 123.58B + 107.25C + 152.00D + 41.75AB − 148.50AC + 140.75AD − 18.00BC + 202.5BD + 44.25CD − 141.66A2 - 421.28B2 − 155.28C2 − 96.66D2
The ANOVA was also conducted to test the significance and the fitness of the regression equation. Data from the analysis of variance is presented in Table 2, a high F-value (3.75) and low p-value (0.0094) indicates that the model is significant. The model’s coefficients of estimates and their confidence intervals are presented in Table 3. The generated model had a coefficient of determination (R2) value of 0.7895, this implies that 78.95% of the data can be explained by the model. The results obtained from this study correlate with literature, it has been reported that R2 values greater than 0.75 show that the model is accurate [21].

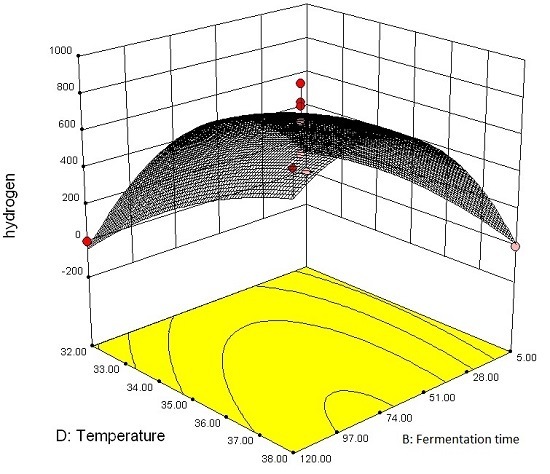
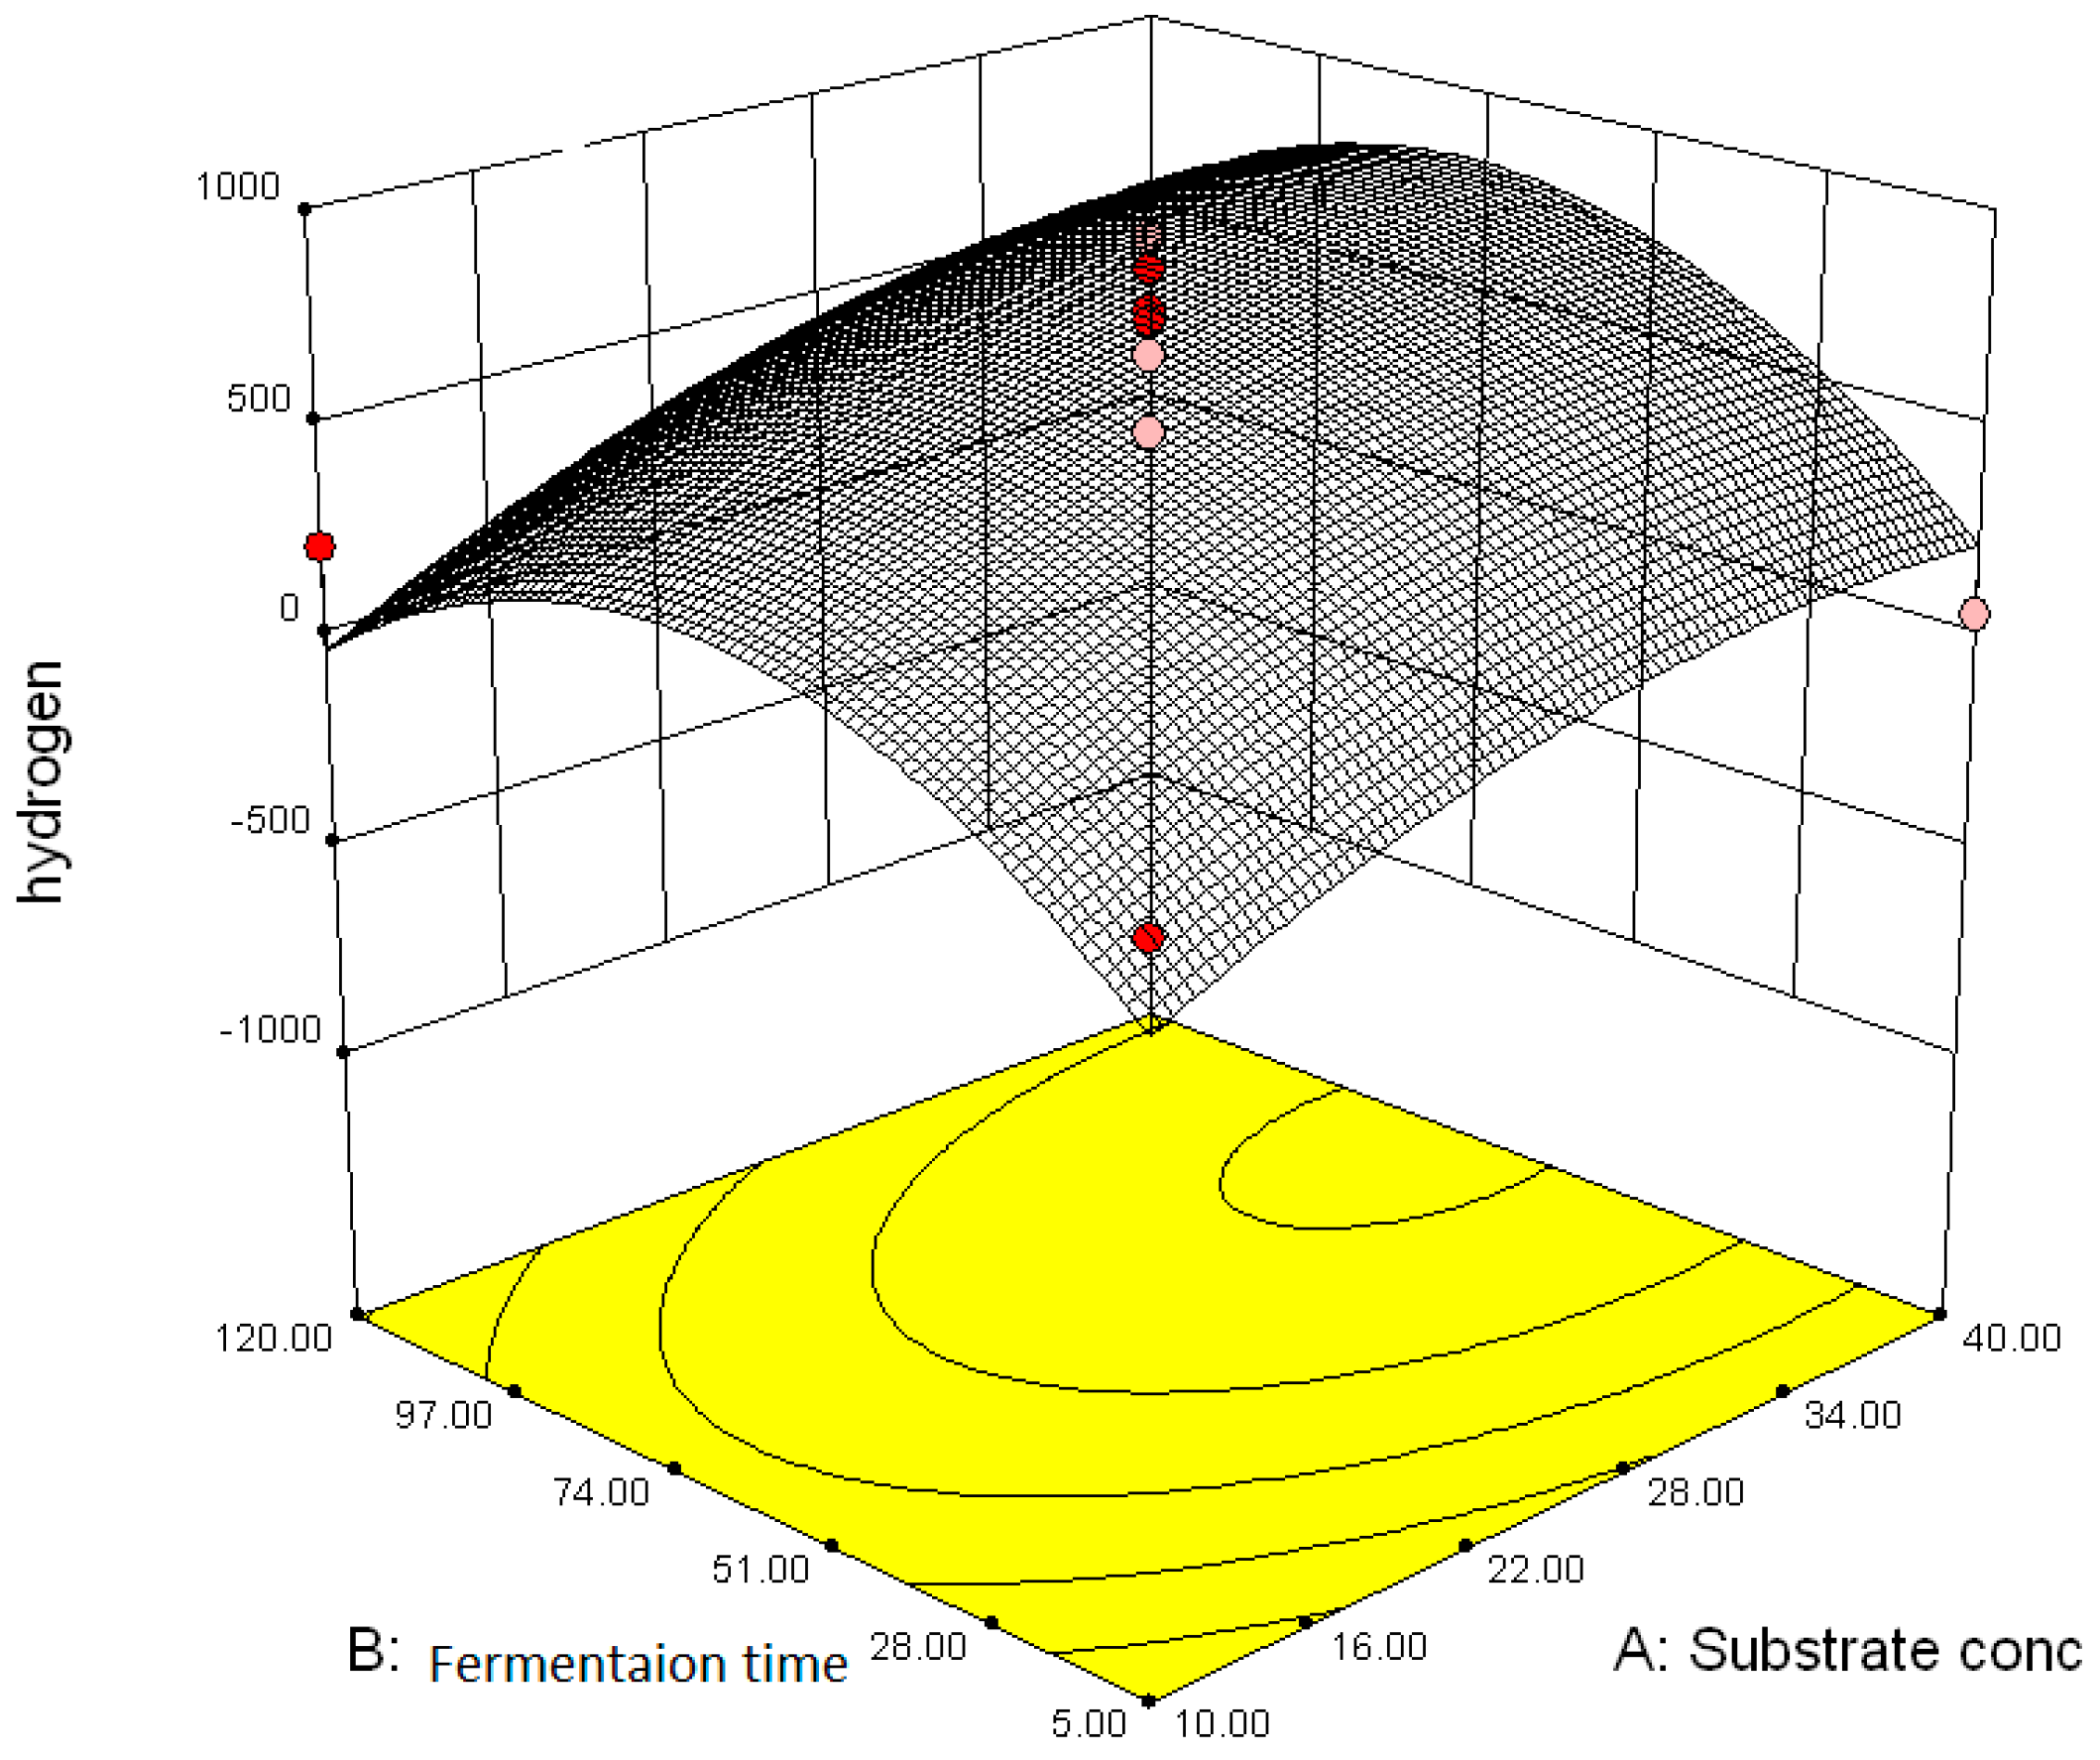
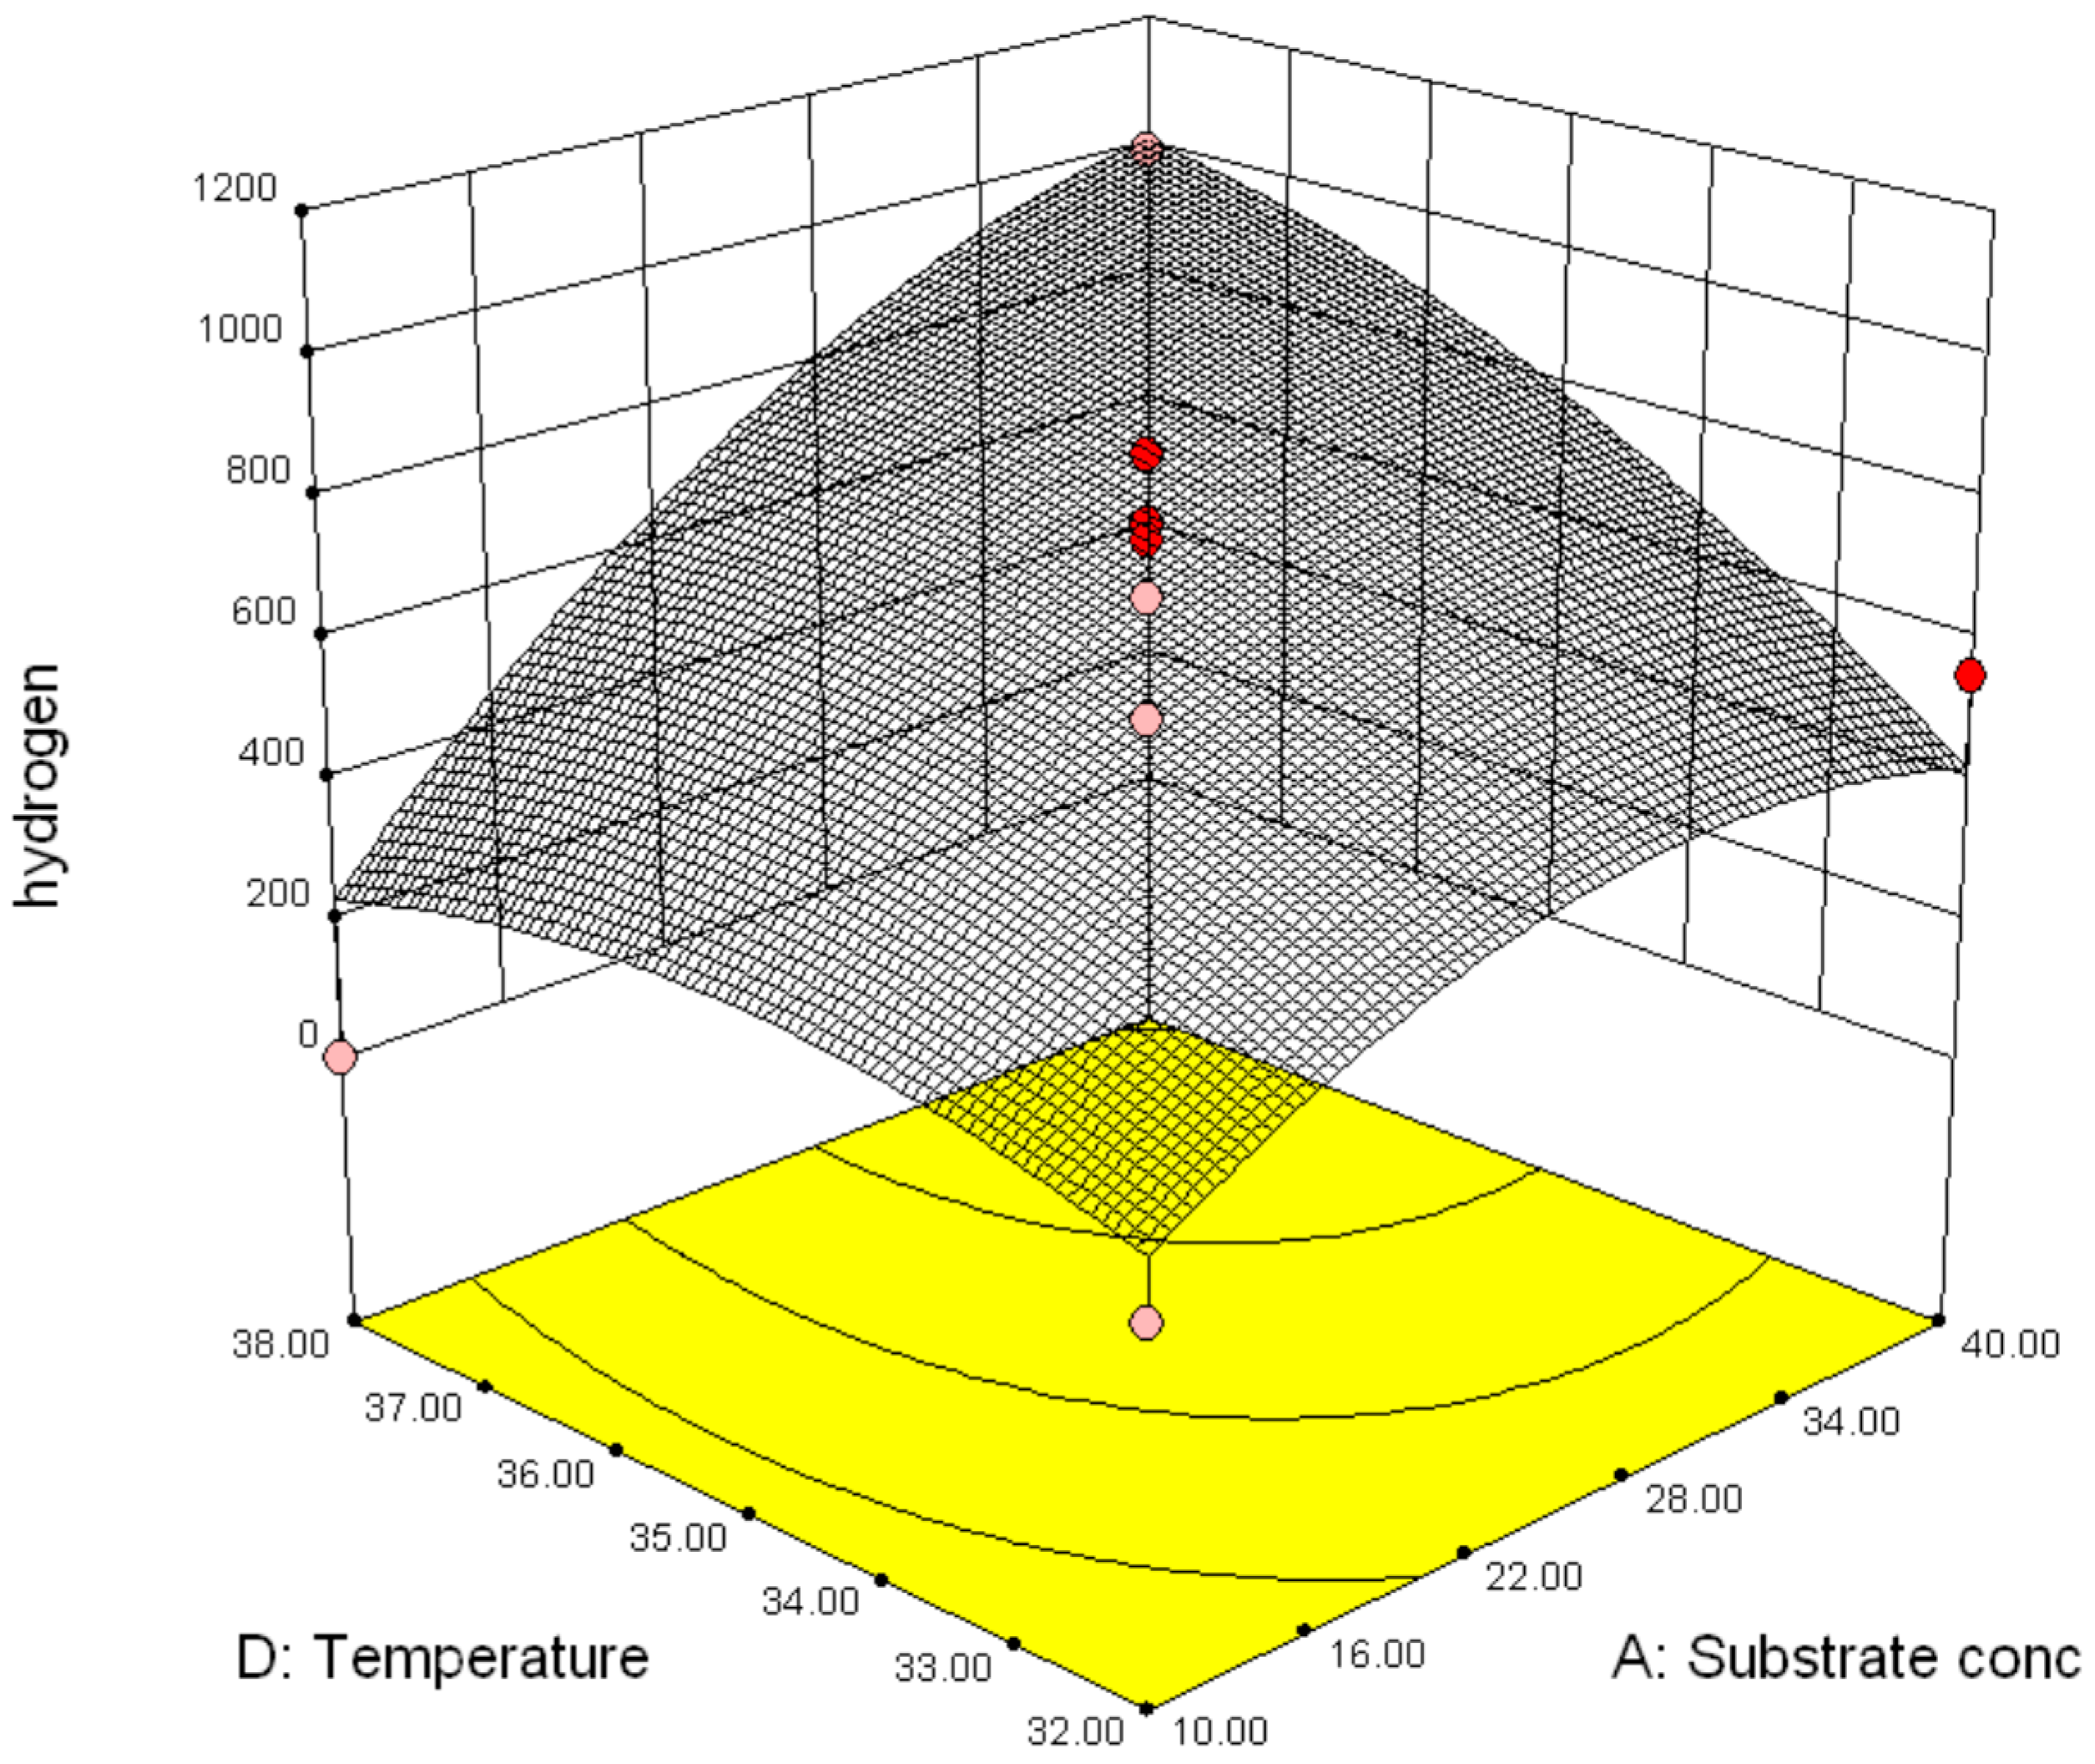
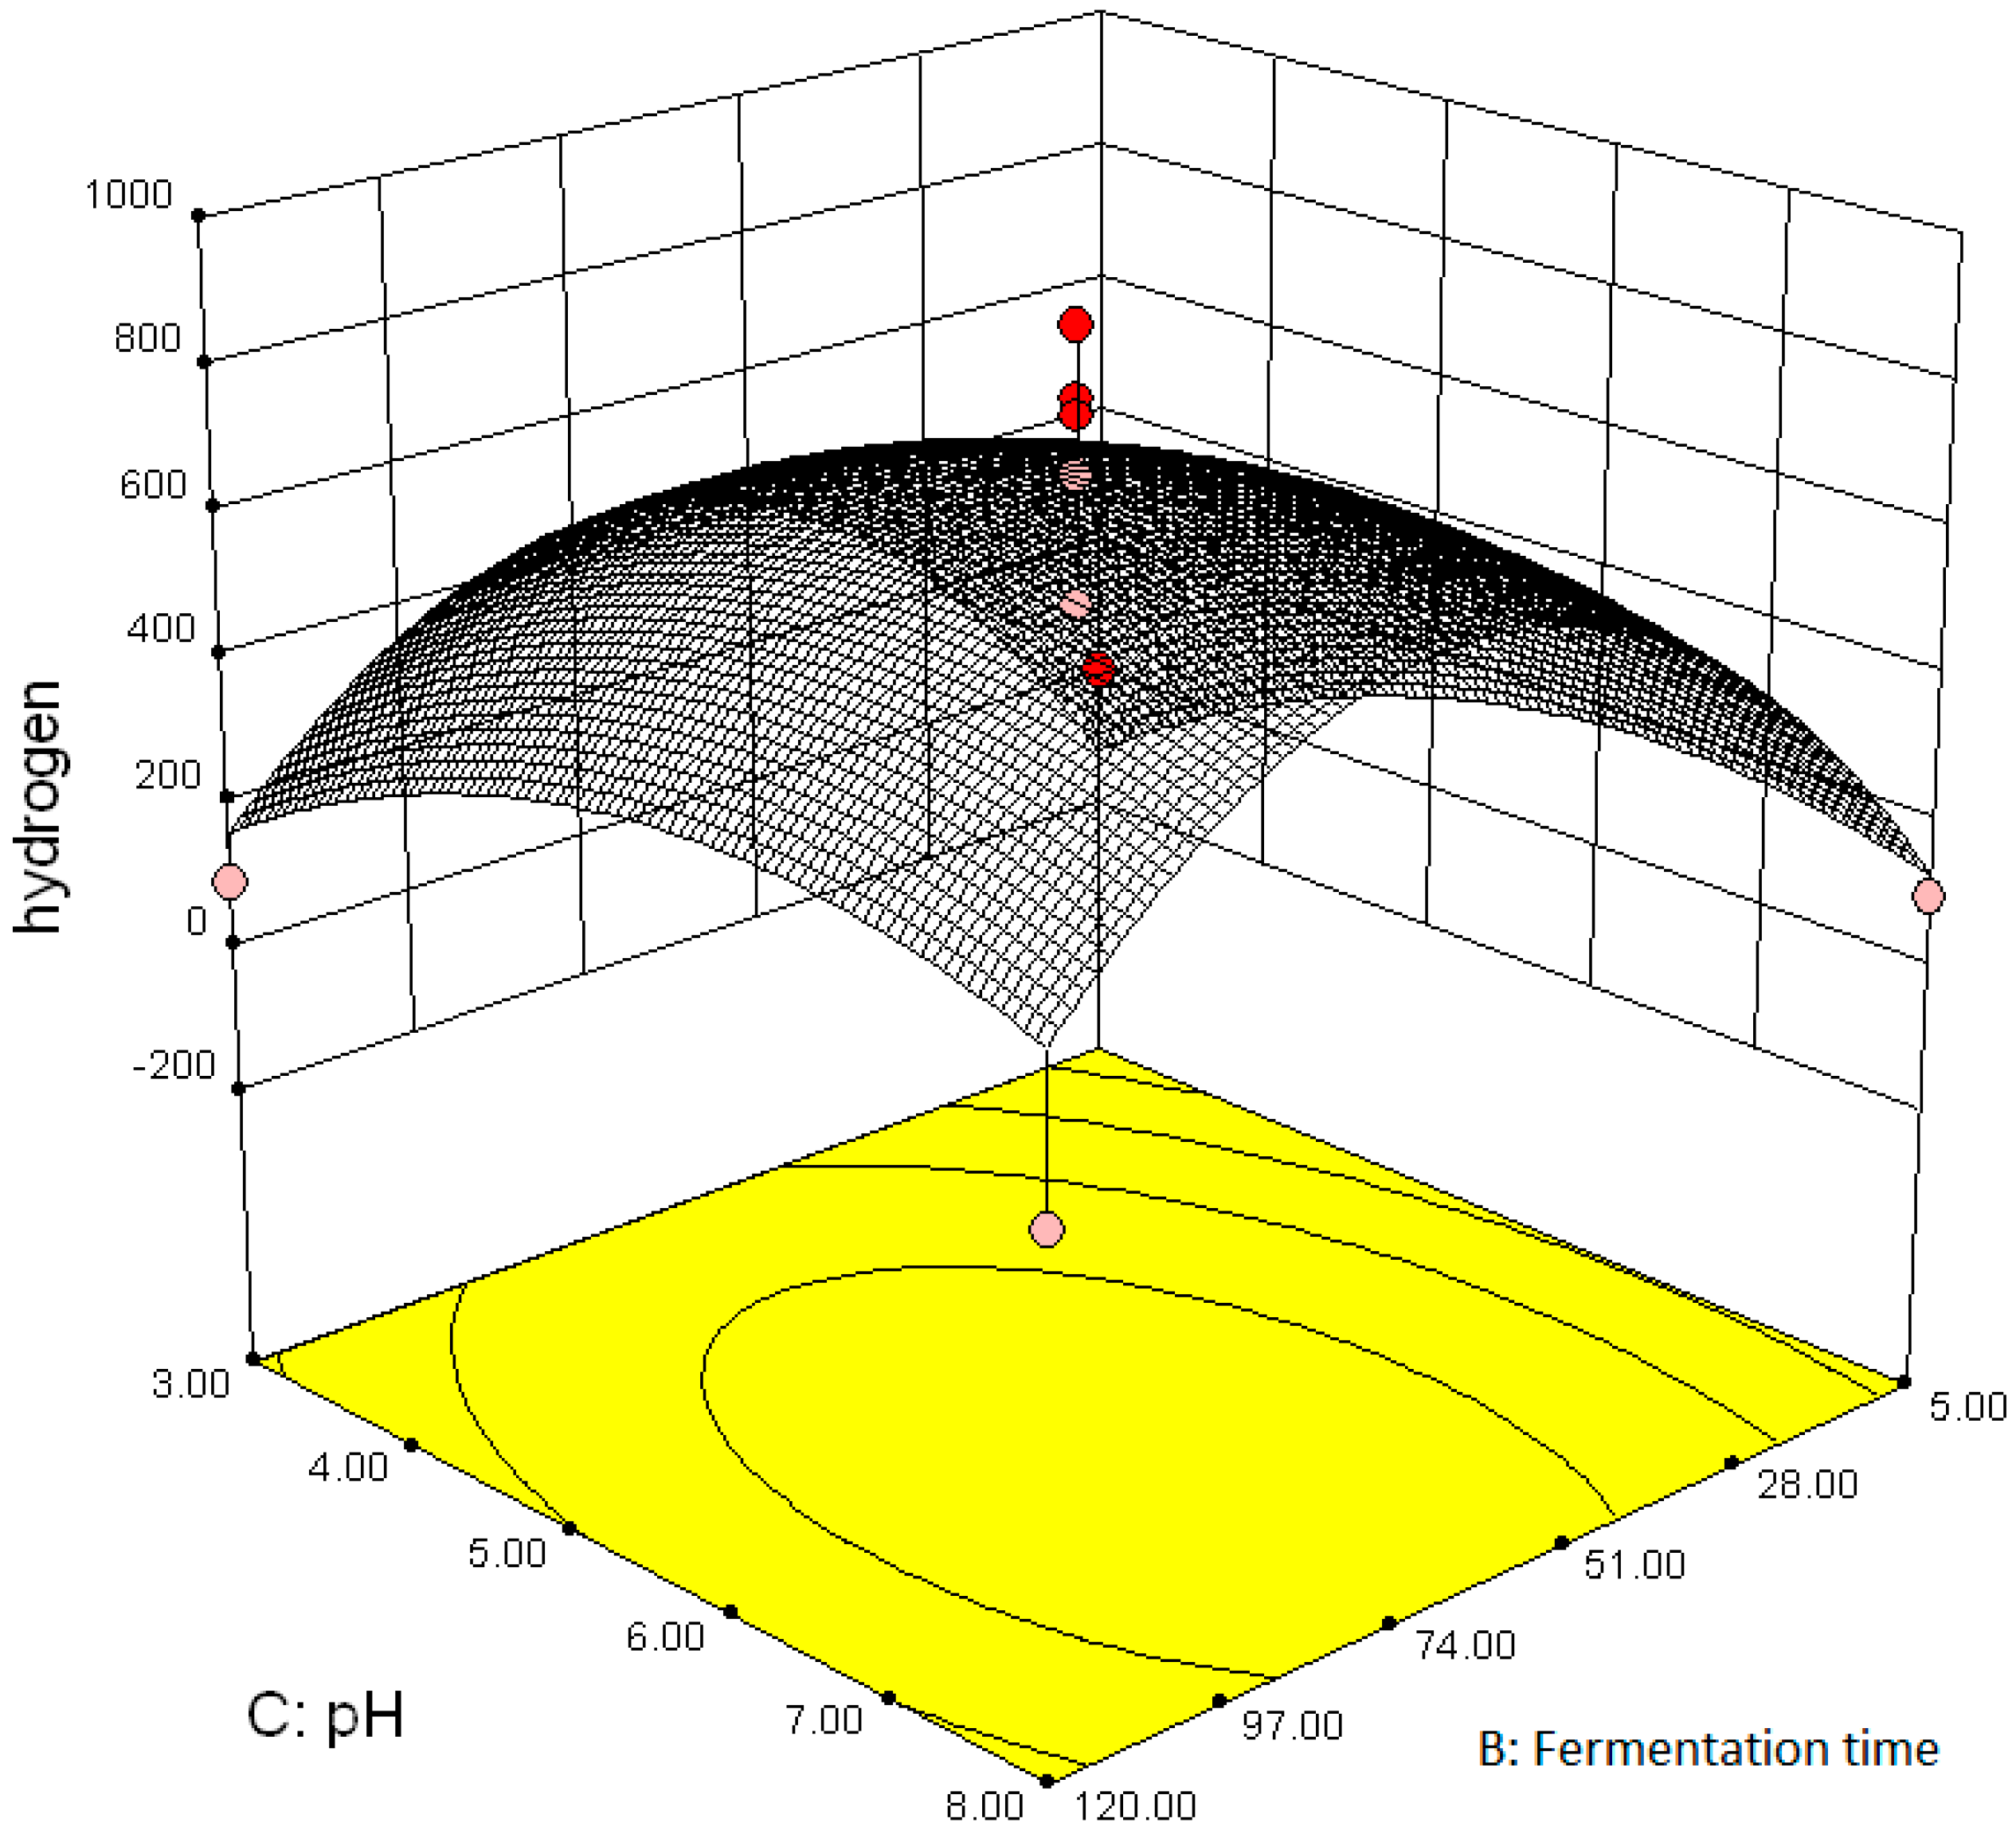
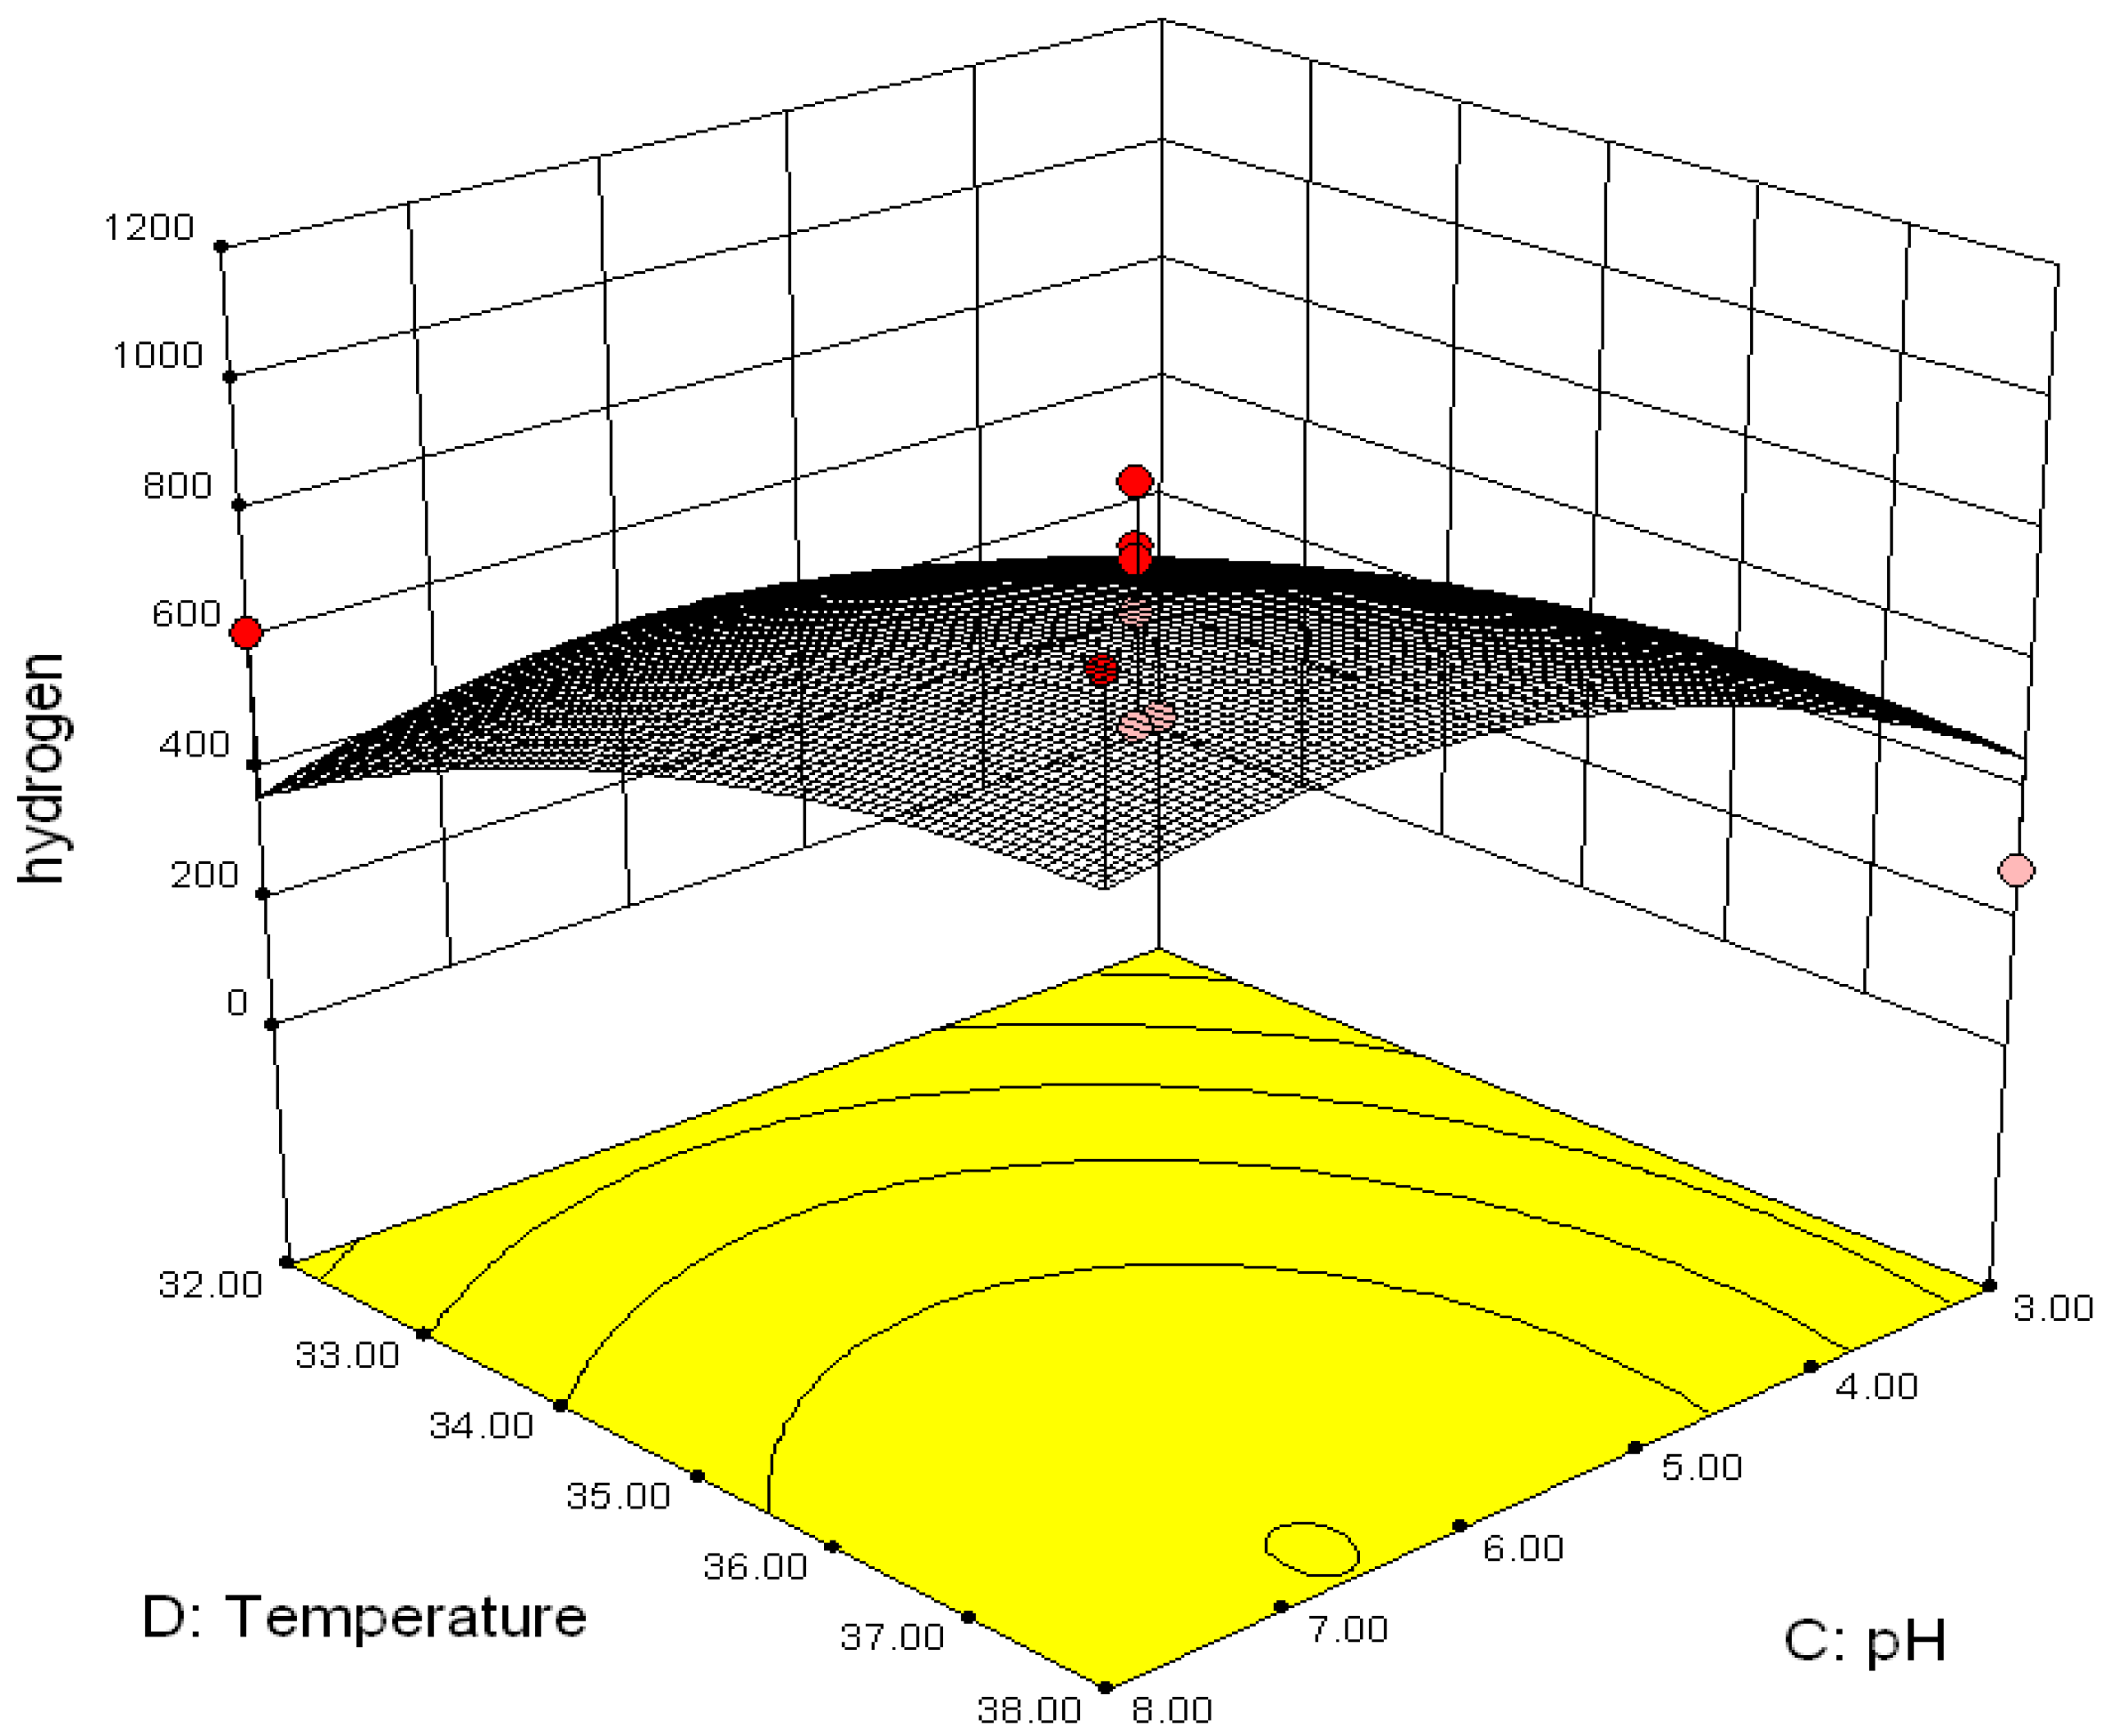
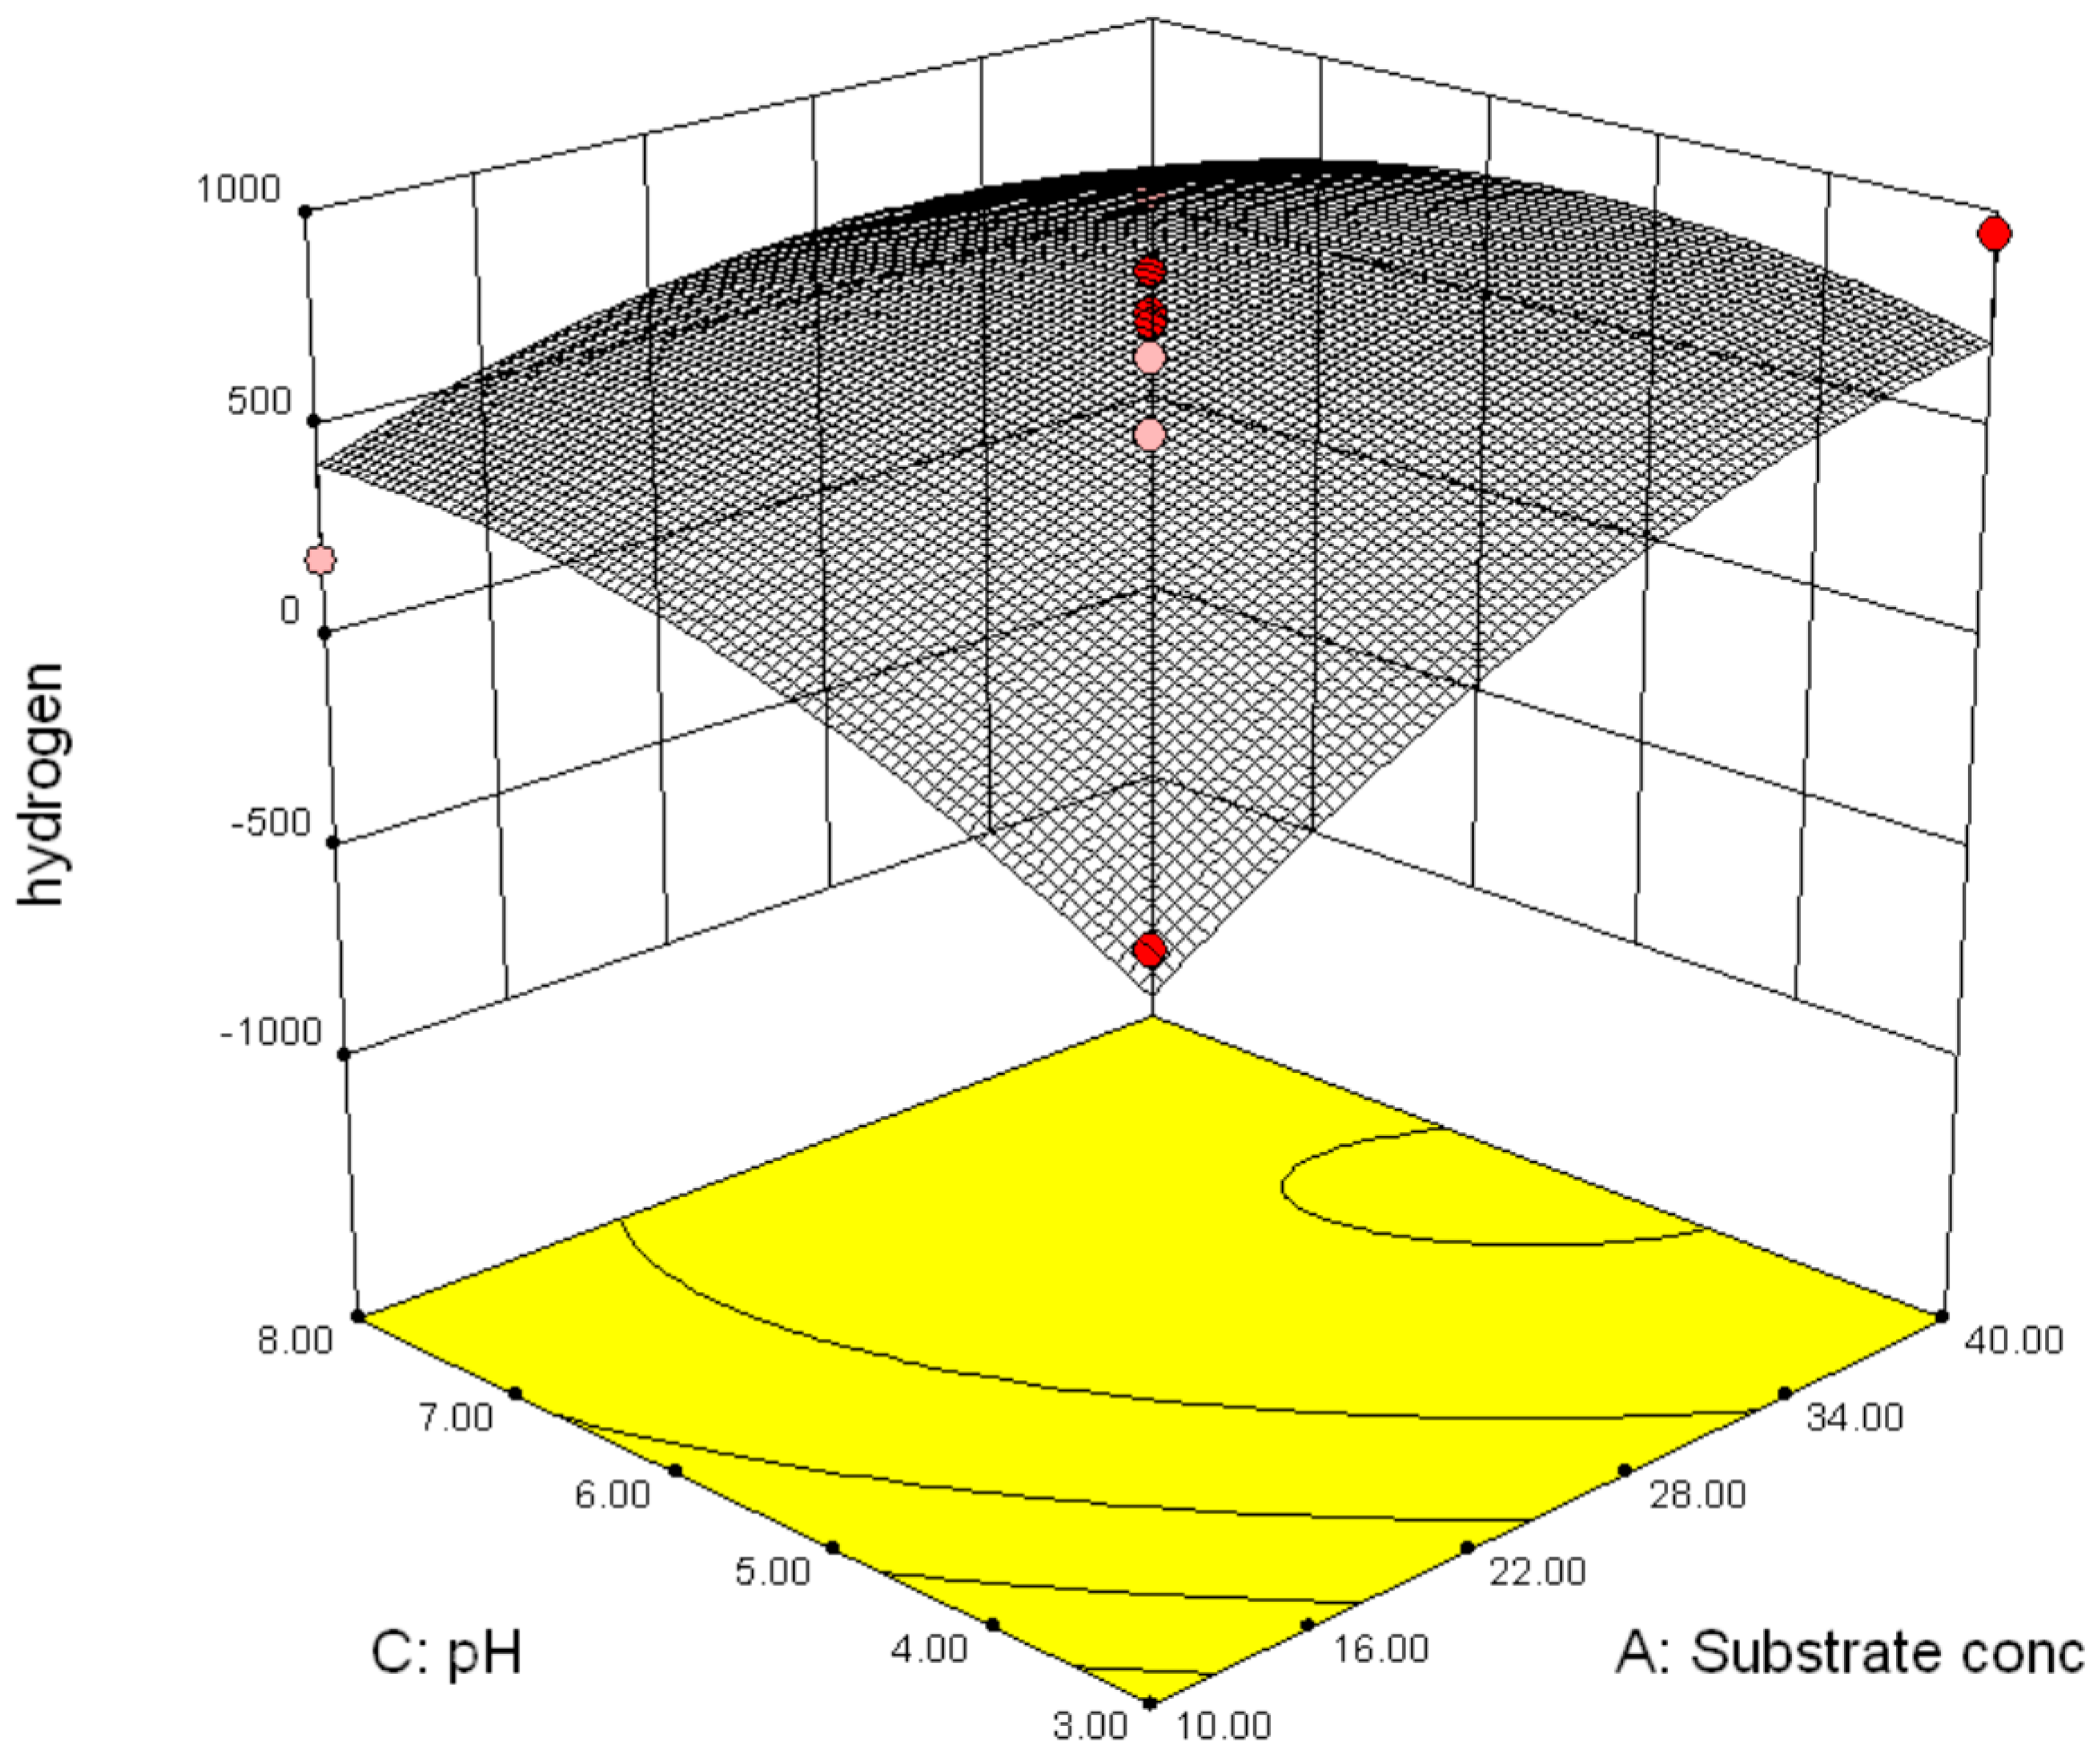
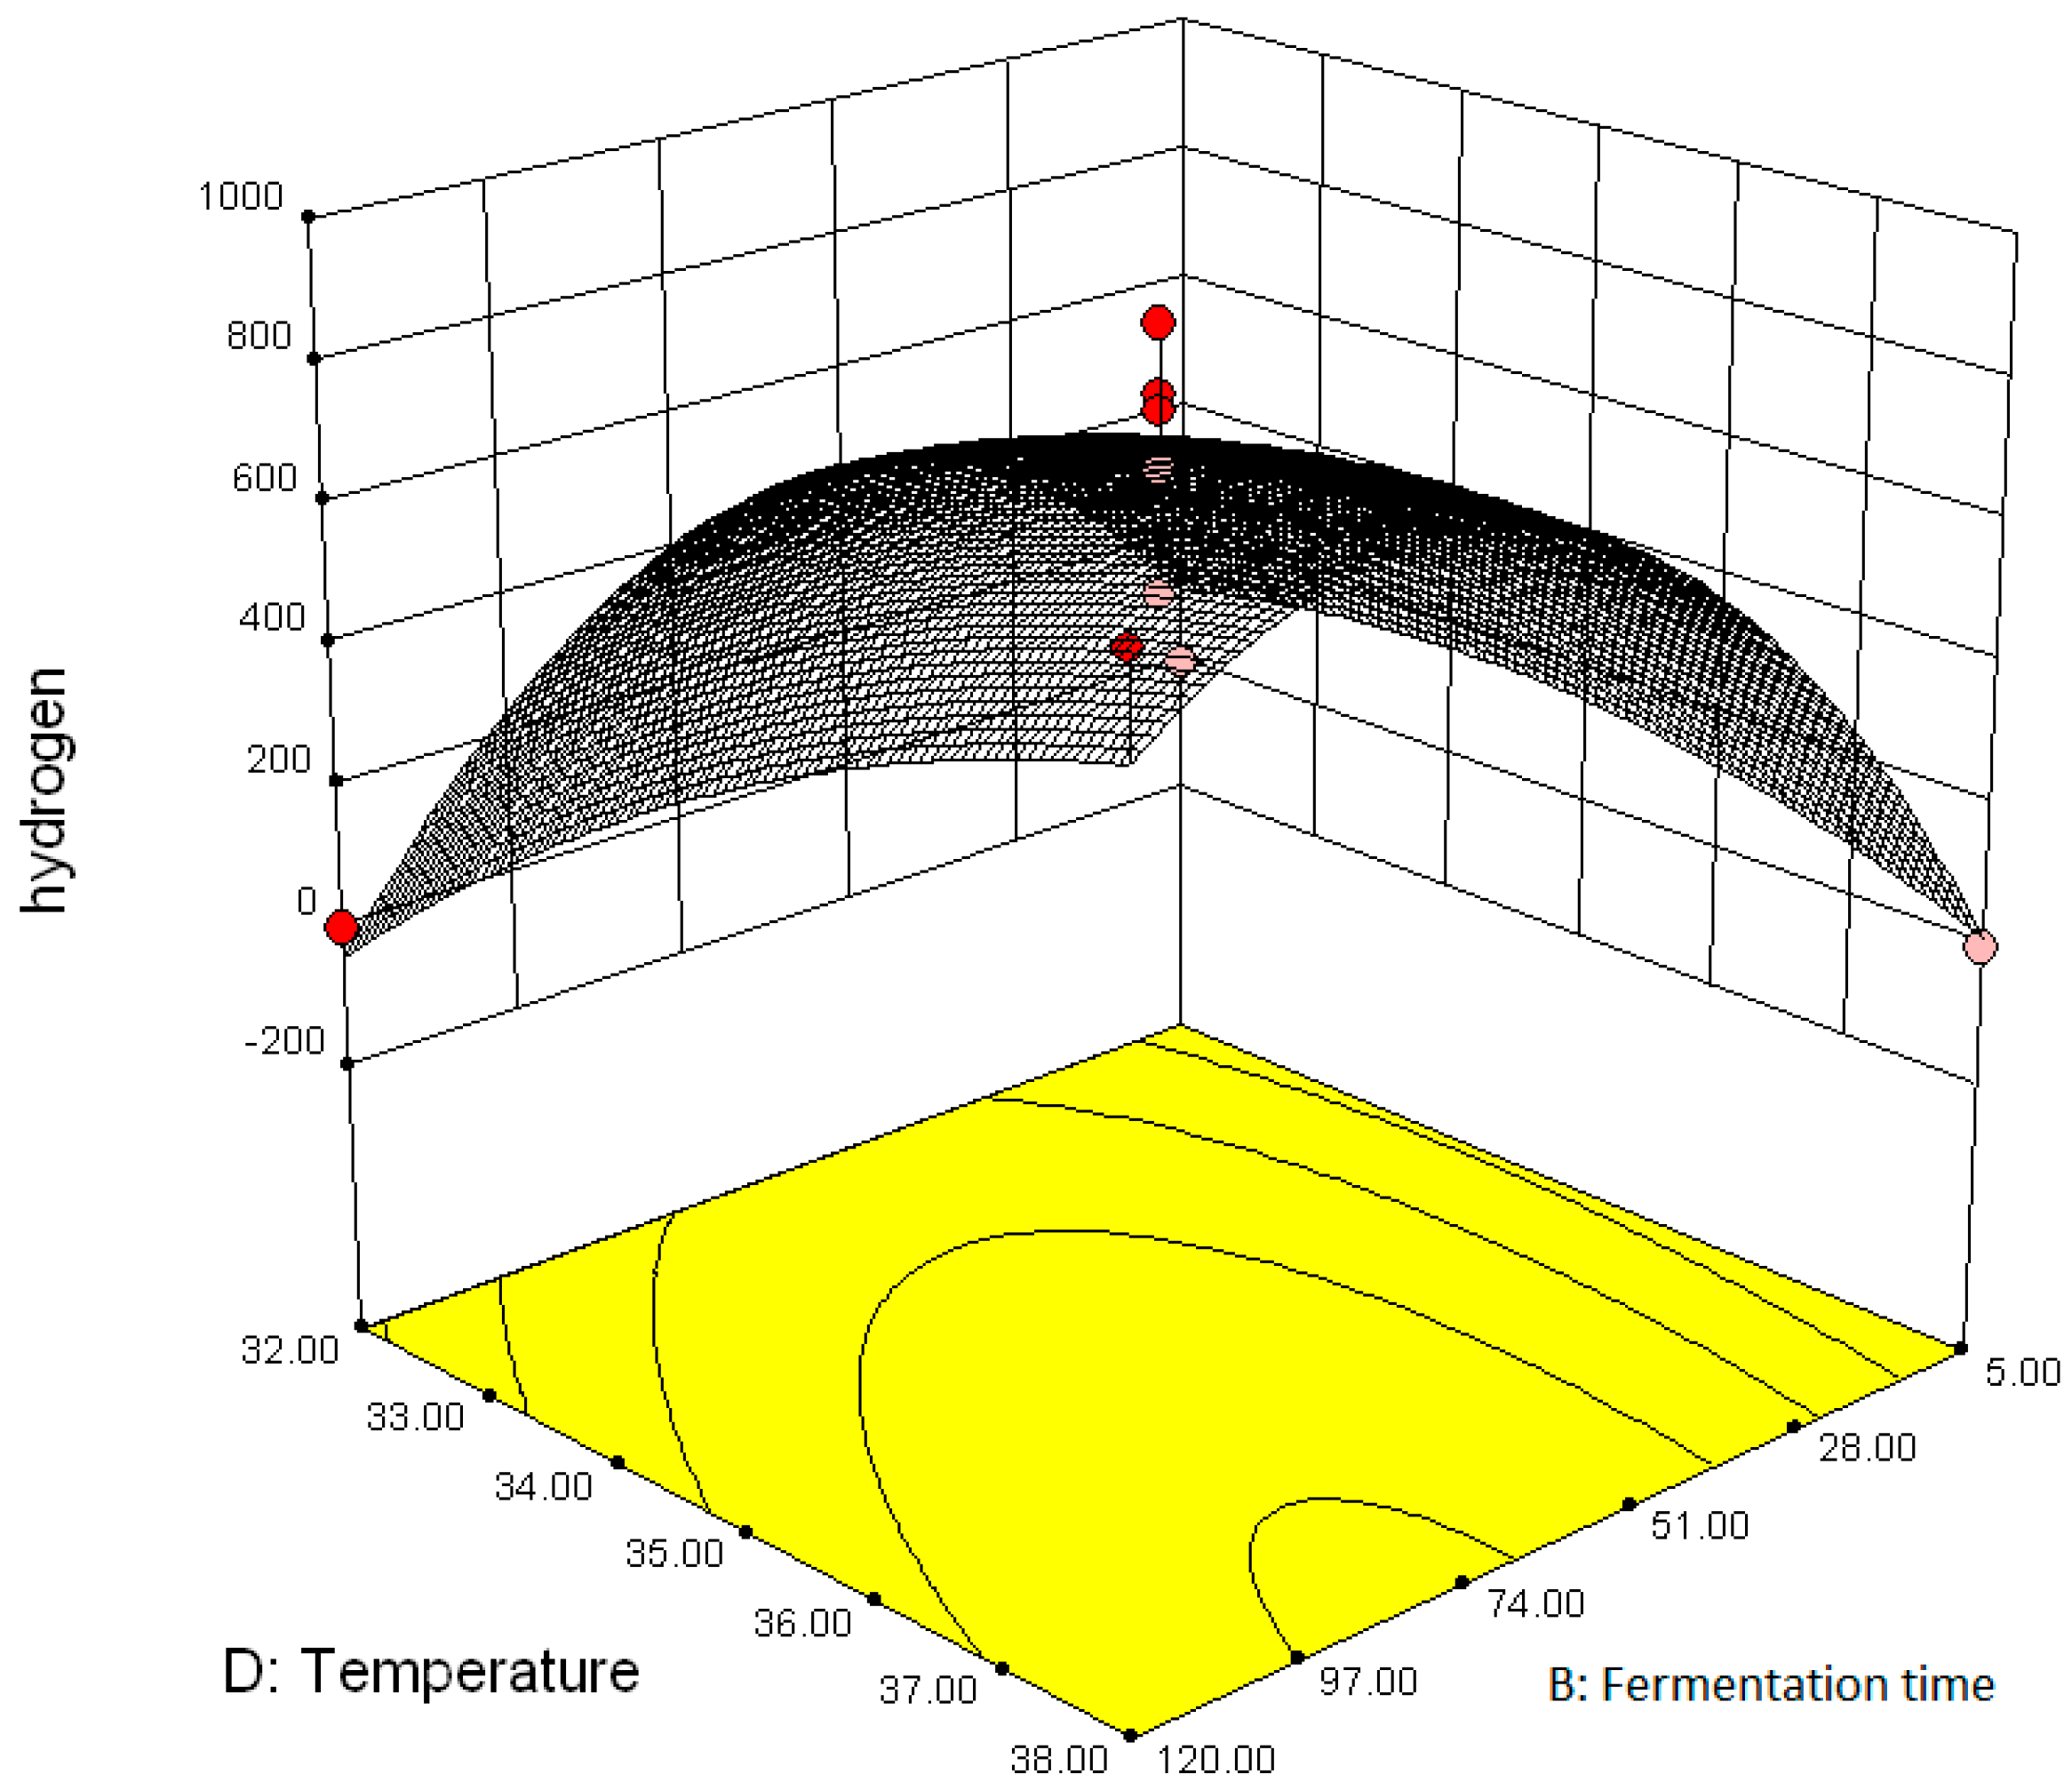
3.2.2. Effect of Parameter Interaction on Biohydrogen Production Response

The three dimensional response surface curves showing the production of biohydrogen as a function of parameters interaction are shown in Figure 1, Figure 2, Figure 3, Figure 4, Figure 5 and Figure 6. The interactive effect of fermentation time and substrate concentration is illustrated in Figure 1; it was observed that an increase in fermentation time (55–80 h) and concentration of potato-waste (22–30 g/L) maximized the production of biohydrogen. It has been reported that an increase in substrate concentration enhances the activity of biohydrogen-producing bacterial species especially during their exponential growth phase [17]. This implies that a large-scale biohydrogen production process can be achieved within this range. Moreover, from these findings it can be deduced that increasing the concentration of potato-waste has a positive effect on biohydrogen production, but higher substrate concentration may have an inhibitory effect on its production [17,22,23].
The interaction between pH and potato-waste concentration is shown in Figure 2, a simultaneous increase in pH (above 5) and potato-waste concentration (above 22 g/L), increases biohydrogen production. It has been confirmed that at an appropriate range, increasing pH could potentially increase the metabolic activities of biohydrogen-producing bacteria during dark fermentative process, but extreme pH values may inhibit their metabolic pathways [24]. For instance, Sekoai and Gueguim Kana [4] reported an optimal pH value of 7.9. In contrast, low concentrations of potato-waste generate low yields of biohydrogen (Figure 2). It has also been confirmed in various studies of biohydrogen production that increasing substrate concentration within the experimental range enhances its production. Earlier studies by Mu et al. [25] and Wang et al. [26] reported optimal concentrations above 25.0 g/L from organic effluents, whereas Sekoai and Gueguim Kana [19] reported an optimal concentration of 40.45 g/L from organic fraction of solid municipal waste.
The synergistic effect of temperature and potato-waste concentration showed than an increase in both temperature (35 °C) and potato-waste concentration (above 22 g/L) resulted in maximum biohydrogen production (Figure 3). Several studies of biohydrogen fermentation process have shown that mesophilic and thermophilic temperature have the ability to increase the population of biohydrogen-producing bacteria; however some extreme temperatures may inhibit their metabolic activities as reported in literature [1]. An increase in potato-waste concentration enhanced the biohydrogen yield but the ability of biohydrogen-producing bacteria to produce hydrogen decreased rapidly with increasing potato-waste concentration from 100 to 300 g/L (Figure 3). Thus, it is reasonable to predict that when the potato-waste concentration continues to increase to 520 g/L, the activity of biohydrogen-producing bacteria will be inhibited completely by the substrate at such high concentration, and the fermentative biohydrogen production by mixed cultures will stop accordingly [22]. With regards to the interactive effect of pH and fermentation time (Figure 4), it was observed that low pH (below 5) and short fermentation time (below 51 h) minimizes the production of biohydrogen. Khanal et al. [27] indicated that low pH values of 4.0–4.5 cause longer lag periods. On the other hand, high initial pH values such as 9.0 decrease lag time, but have a lower yield of biohydrogen production [28]. An optimum retention time between 8.0 and 14 h was reported to yield maximum H2 without activating methanogenic process [29,30].
Considering the effect of temperature and fermentation time (Figure 5), decreasing both temperature (below 35 °C) and fermentation time (below 51 h) generated low biohydrogen production. Similarly, Wang and Wan [1] observed that the concentration of hydrogen in batch tests increased with increasing temperature from 20 to 35 °C, however it decreased with further increase from 35 to 55 °C. A plausible explanation for such results might be due to the fact that the inoculum consisted of high population of mesophilic biohydrogen-producing bacteria. Conflicting results were reported by Hussy et al. [30]; they observed that reducing fermentation time from 18 to 12 h improved the biohydrogen yield without affecting starch removal efficiency when wheat starch was used as substrate. This might be attributed to various factors such as inoculum type, mode of fermentation, and operational setpoint parameters, i.e., organic loading rate.
In Figure 6, it is seen that low temperature (below 35 °C) coupled with low pH (below 5), decreases the overall production of biohydrogen. Therefore, temperature is one of the most critical parameters in biohydrogen process optimization because its affects the specific growth rate, substrate utilization rate, and the metabolic pathway of microorganisms [31,32,33,34]. pH is also highlighted as one of the most vital process parameters in biohydrogen production studies. It affects hydrogenase activity, metabolic activity, and substrate hydrolysis [35,36,37].

3.3. Modelling and Optimization of Setpoint Parameters Using Box-Behnken Design

Optimization studies revealed that a maximum hydrogen production of 537.5 mL H2/g TVS can be obtained with potato-waste concentration of 39.56 g/L, fermentation time 82.58 h, pH 5.56, and temperature 37.87 °C. Model validation gave 603.5 mL H2/g TVS resulting to a 12% increase. Thus, the models accurately optimized the biohydrogen production.

4. Conclusions

This study modelled and optimized the production of biohydrogen using box-behnken response surface methodology. It was shown that an enhanced biohydrogen production yield of 603.5 mL H2/g TVS is achievable at optimized operational setpoint variables of 39.56 g/L, 82.58 h, 5.56, and 37.87 °C for substrate concentration, fermentation time, pH, and temperature, respectively. Therefore, these findings could pave a way for large-scale biohydrogen production process by offering reliable fermentation data and, thus, make this technology economically viable. The scaling-up of biohydrogen production process will accelerate its commercialization and contribute in the global sustainable energy supply. Moreso, it is pivotal to conduct similar findings on large-scale processes to fully understand the process complexities of biohydrogen-producing fermentation processes from these setpoint conditions.

Acknowledgments

The Author would like to acknowledge financial support from the National Research Foundation (NRF-DST, grant no. 95061) and University of the Witwatersrand (Johannesburg, South Africa).

Author Contributions

Patrick T. Sekoai conducted the experimental design, and wrote the manuscript for publication.

Conflicts of Interest

The author declares no conflict of interest.

References

  1. Wang, J.L.; Wan, W. Effect of temperature on fermentative hydrogen production by mixed cultures. Int. J. Hydrog. Energy 2008, 33, 5392–5397. [Google Scholar] [CrossRef]
  2. Xing, D.F.; Ren, N.Q.; Wang, A.J.; Li, Q.B.; Feng, Y.J.; Ma, F. Continuous hydrogen production of auto-aggregative Ethanoligenens harbinense YUAN-3 under non-sterile condition. Int. J. Hydrog. Energy 2008, 33, 2137–2146. [Google Scholar] [CrossRef]
  3. Yang, H.J.; Shen, J.Q. Effect of ferrous iron concentration on anaerobic bio-hydrogen production from soluble starch. Int. J. Hydrog. Energy 2006, 31, 2137–2146. [Google Scholar] [CrossRef]
  4. Sekoai, P.T.; Gueguim Kana, E.B. Semi-pilot scale production of hydrogen from organic fraction of solid municipal waste and electricity generation from process effluents. Biomass Bioenergy 2014, 60, 156–163. [Google Scholar] [CrossRef]
  5. Lotfy, W.; Ghanem, K.M.; Helow, E.R. Citric acid by a novel Aspergillus niger isolate: II. Optimization of process parameters through statistical experimental designs. Bioresour. Technol. 2007, 98, 3470–3477. [Google Scholar] [CrossRef] [PubMed]
  6. He, G.Q.; Chen, Q.H.; Ju, X.J.; Shi, N.D. Improved elastase production by Bacillus sp. EL3140-further optimization and kinetics studies of culture medium for batch fermentation. J. Zhejiang Univ. Sci. 2004, 5, 149–156. [Google Scholar] [CrossRef] [PubMed]
  7. Haltrich, D.; Preiss, M.; Steiner, W. Optimization of a culture medium for increased xylanase production by a wild strain of Schizophyllum commune. Enzyme Microbiol. Technol. 1993, 15, 854–860. [Google Scholar] [CrossRef]
  8. Box, G.E.P.; Behnken, D.W. Some new three level designs for the study of quantitative variables. Technometrics 1960, 2, 455–475. [Google Scholar] [CrossRef]
  9. Haaland, P.D. Experimental Design in Biotechnology; Marcel Dekker: New York, NY, USA, 1989. [Google Scholar]
  10. Box, G.E.; Hunter, W.G.; Hunter, J.S. Statistical for Experimenters; John Wiley & Sons: Hoboken, NJ, USA, 1978. [Google Scholar]
  11. Strobel, R.J.; Nakatsukasa, W.M. Response surface for optimization Saccharopolyspora spinosa, a novel macrolide producer. J. Indian Microbiol. 1993, 11, 121–127. [Google Scholar] [CrossRef]
  12. Swanson, T.R.; Carroll, J.O.; Britto, R.A.; Durhart, D.J. Development and field confirmation of a mathematical model for amyloglucosidase/pollulanase saccharafication. Starch 1986, 38, 382–387. [Google Scholar] [CrossRef]
  13. Dhillon, G.S.; Brar, S.K.; Verma, M.; Tygi, R.D. Apple pomace ultrafiltration sludge—A novel substrate for fungal bioproduction of citric acid: Optimisation studies. Food Chem. 2011, 128, 864–871. [Google Scholar] [CrossRef]
  14. Nath, K.; Muthukumar, M.; Kumar, A.; Das, D. Kinetics of two stage fermentation process for the production of hydrogen. Int. J. Hydrog. Energy 2008, 33, 1195–1203. [Google Scholar] [CrossRef]
  15. Argun, H.; Kargi, F.; Kapdan, I.K.; Oztekin, R. Bio hydrogen production by dark fermentation of wheat powder solution: Effects of C/N and C/P ratio on hydrogen yield and formation rate. Int. J. Hydrog. Energy 2008, 33, 1813–1819. [Google Scholar] [CrossRef]
  16. Rorke, D.; Gueguim Kana, E.B. Biohydrogen process development on waste sorghum (Sorghum bicolor) leaves: Optimization of saccharafication, hydrogen production and preliminary scale up. Int. J. Hydrog. Energy 2016, 41, 12941–12952. [Google Scholar] [CrossRef]
  17. Mafuleka, S.; Gueguim Kana, E.B. Modelling and optimization of xylose and glucose production from Napier grass using hybrid pre-treatment techniques. Biomass Bioenergy 2015, 77, 200–208. [Google Scholar] [CrossRef]
  18. O-Thong, S.; Prasertsan, P.; Intrasungkha, N.; Dhamwichukorn, S.; Birkeland, N.K. Optimization of simultaneous thermophilic fermentative hydrogen production and COD reduction from palm oil mill effluent by Thermoanaerobacterium-rich sludge. Int. J. Hydrog. Energy 2008, 33, 1221–1231. [Google Scholar] [CrossRef]
  19. Sekoai, P.T.; Gueguim Kana, E.B. A two-stage modelling and optimization of biohydrogen production from a mixture of agro-municipal waste. Int. J. Hydrog. Energy 2013, 38, 8657–8663. [Google Scholar] [CrossRef]
  20. Chong, M.L.; Rahim, R.A.; Shirai, Y.; Hassan, M.A. Biohydrogen production by Clostridium butyricum EB6 from palm oil mill effluent. Int. J. Hydrog. Energy 2009, 34, 746–771. [Google Scholar] [CrossRef] [Green Version]
  21. Myers, R.H.; Montgomery, D.C. Response Surface Methodology: Process and Product Optimization Using Designed Experiments; John Wiley & Sons: Hoboken, NJ, USA, 1995. [Google Scholar]
  22. Moodley, P.; Gueguim Kana, E.B. Optimization of xylose and glucose production from sugarcane leaves (Saccharum officinarum) using hybrid pretreatment techniques and assessment for hydrogen generation at semi-pilot scale. Int. J. Hydrog. Energy 2015, 40, 3859–3867. [Google Scholar] [CrossRef]
  23. Wu, J.H.; Lin, C.Y. Biohydrogen production by mesophilic fermentation of food wastewater. Water Sci. Technol. 2004, 49, 223–228. [Google Scholar] [PubMed]
  24. Sinha, P.; Pandey, A. An evaluative report and challenges for fermentative biohydrogen production. Int. J. Hydrog. Energy 2011, 36, 7460–7478. [Google Scholar] [CrossRef]
  25. Mu, Y.; Wang, G.; Yu, H.Q. Response surface methodological analysis on bio hydrogen production by enriched anaerobic cultures. Enzyme Microbiol. Technol. 2006, 38, 905–913. [Google Scholar] [CrossRef]
  26. Wang, G.; Mu, Y.; Yu, H.Q. Response surface analysis to evaluate the influence of pH, temperature and substrate concentration on the acidogenesis of sucrose-rich wastewater. Biochem. Eng. J. 2005, 23, 175–184. [Google Scholar] [CrossRef]
  27. Khanal, S.K.; Chen, W.H.; Li, L.; Sung, S. Biological hydrogen production: Effects of pH and intermediate products. Int. J. Hydrog. Energy 2004, 29, 1123–1131. [Google Scholar] [CrossRef]
  28. Zhang, T.; Liu, H.; Fang, H.H.P. Biohydrogen production from starch in wastewater under thermophilic conditions. J. Environ. Manag. 2003, 69, 49–56. [Google Scholar] [CrossRef]
  29. Chen, C.C.; Lin, C.Y.; Lin, M.C. Acid-base enrichment enhances anaerobic hydrogen production process. Appl. Microbiol. Biotechnol. 2002, 58, 224–228. [Google Scholar] [PubMed]
  30. Hussy, I.; Hawkes, F.R.; Dinsdale, R.; Hawkes, D.L. Continuous fermentative hydrogen production from a wheat starch coproduct by mixed microflora. Biotechnol. Bioeng. 2003, 84, 619–629. [Google Scholar] [CrossRef] [PubMed]
  31. Cheng, X.Y.; Liu, C.Z. Hydrogen production via thermophilic fermentation of cornstalk by Clostridium thermocellum. Energy Fuels 2011, 25, 1714–1720. [Google Scholar] [CrossRef]
  32. Lay, J.J. Modelling and optimization of anaerobic digested sludge converting starch to hydrogen. Biotechnol. Bioeng. 2000, 68, 269–278. [Google Scholar] [CrossRef]
  33. Li, C.L.; Fang, H.H.P. Fermentative hydrogen production from wastewater and solid wastes by mixed cultures. Crit. Rev. Environ. Sci. Technol. 2007, 37, 1–39. [Google Scholar] [CrossRef]
  34. Van Ginkel, S.W.; Oh, S.E.; Logan, B.E. Bio hydrogen gas production from food processing and domestic wastewaters. Int. J. Hydrog. Energy 2005, 30, 1535–1542. [Google Scholar] [CrossRef]
  35. De Gioannis, G.; Muntoni, A.; Polettini, A.; Pomi, R. A review of dark fermentative hydrogen production from biodegradable municipal waste fractions. Waste Manag. 2013, 33, 1345–1361. [Google Scholar] [CrossRef] [PubMed]
  36. Sewsynker, Y.; Gueguim Kana, E.G. Modelling of biohydrogen generation in microbial electrolysis cells (MECs) using a committee of artificial neural networks (ANNs). Biotechnol. Biotechnol. Equip. 2015, 29, 1208–1215. [Google Scholar] [CrossRef]
  37. Faloye, F.D.; Gueguim Kana, E.B.; Schmidt, S. Optimization of biohydrogen inoculum development via a hybrid pH and microwave treatment technique—Semi pilot scale production assessment. Int. J. Hydrog. Energy 2014, 39, 5607–5616. [Google Scholar] [CrossRef]
Figure 1. Response surface graph showing the interactive effect of fermentation time (h) and potato-waste concentration (conc, g/L) on hydrogen yield (mL H2/g TVS).
Fermentation 02 00015 g001
Figure 2. Response surface graph showing the interactive effect of pH and potato-waste concentration (conc, g/L) on hydrogen yield (mL H2/g TVS).
Fermentation 02 00015 g002
Figure 3. Response surface graph showing the interactive effect of temperature (°C) and potato-waste concentration (conc, g/L) on hydrogen yield (mL H2/g TVS).
Fermentation 02 00015 g003
Figure 4. Response surface graph showing the interactive effect of fermentation time (h) and pH on hydrogen yield (mL H2/g TVS).
Fermentation 02 00015 g004
Figure 5. Response surface graph showing the interaction of fermentation time (h) and temperature (°C) on hydrogen yield (mL H2/g TVS).
Fermentation 02 00015 g005
Figure 6. Response surface graph showing the interactive effect of temperature (°C) and pH on hydrogen yield (mL H2/g TVS).
Fermentation 02 00015 g006
Table 1. Biohydrogen production response from the box-behnken design.
RunPWFTpHTempH2 Yield
11062.583589.8
2101205.535111.3
32553350.5
4401205.535214.2
54055.53530.9
625583550.4
72512083558.6
82512033548.7
91055.53510.5
102562.5338139.5
11251205.538405.0
124062.55.538495.5
132555.5380
141062.55.5380
152562.5838528.0
164062.5835474.5
172562.55.535373.0
182562.55.535245.5
192562.55.535333.0
202562.55.535384.5
211062.53350
224062.5835275.0
232562.55.535432.5
242562.533210.0
252555.5320
261062.55.53261.0
272562.5832310.0
284062.55.532277.0
29251205.5320
PW: Potato-waste concentration (g/L), FT: Fermentation time (h), Temp (°C), H2 yield (mL H2/g TVS).
Table 2. Analysis of variance (ANOVA) of the box-behnken model.
SourceSSdfMSF-Valuep-ValueR2
Model2,890,00014207,0003.750.00940.7895
A738,0001738,00013.40.0026
B183,0001183,0003.330.0895
C138,0001138,0002.510.1357
D277,0001277,0005.030.0415
AB6972.2510.130.7273
AC88,20911.60.2263
AD79,242.2511.440.2502
BC129610.0240.8803
BD164,00012.980.1064
CD7832.2517832.250.7117
A2130,00012.360.1465
B21,150,000120.90.0004
C2156,00012.840.1141
D260,602.1611.10.3119
A: Potato-waste concentration, B: Fermentation time, C: pH, D: Temperature, AB: interaction between potato-waste concentration and fermentation time, AC: interaction between potato-waste concentration and pH, AD: interaction between potato-waste concentration and temperature, BC: interaction between fermentation time and pH, BD: interaction between fermentation time and temperature, CD: interaction between pH and temperature, A2: quadratic value for potato-waste concentration, B2: quadratic value for fermentation time, C2: quadratic value for pH, D2: quadratic value for temperature, SS: Sum of squares, MS: Mean of squares, df: degrees of freedom, F-value: Fisher-Snedecor distribution value, p-value: Probability value, R2: Coefficient of determination.
Table 3. Coefficients of estimates and their confidence intervals for box-behnken design.
FactorCEdfSE95% CIL95% CIHVIF
Intercept707.41104.95482.31932.49
A248167.74102.7393.31
B123.58167.74−21.71268.881
C107.25167.74−38.05252.551
D152167.746.7297.31
AB41.751117.34−209.91293.411
AC−148.51117.34−400.16103.161
AD140.751117.34−110.91392.411
BC−181117.34−269.66233.661
BD202.51117.34−49.16454.161
CD44.251117.34−207.41295.911
A2−141.66192.14−339.2855.971.08
B2−421.28192.14−618.91−223.661.08
C2−155.28192.14−352.9142.341.08
D2−96.66192.14−294.28100.971.08
A: Potato-waste concentration, B: Fermentation time, C: pH, D: Temperature, AB: interaction between potato-waste concentration and fermentation time, AC: interaction between potato waste concentration and pH, AD: interaction between potato-waste concentration and temperature, BC: interaction between fermentation time and pH, BD: interaction between fermentation time and temperature, CD: interaction between pH and temperature, A2: quadratic value for potato-waste concentration, B2: quadratic value for fermentation time, C2: quadratic value for pH, D2: quadratic value for temperature, CE: Coefficient of estimate, df: degrees of freedom, SE: Standard error, 95% CIL: 95% Confidence Intervals (Low limit), 95% CIH: 95% Confidence Intervals (High limit), VIF: Variance Inflation Factor.

