3.1. Raw Milk and Whey Characteristics and Cheese Yield Performance
As can be seen in
Table 1, average dry matter content of the raw milk was 11.23%, fat content was 3.2%, protein content was 3.13%, lactose content was 4.37%, pH was 6.61 and acidity was 6.69 °SH. Whey pH values varied between 5.62–5.69%, titration acidity values varied between 8.26–8.75 °SH, dry matter ratios between 6.52–6.64%, protein contents between 0.90–0.91%, lactose contents between 4.25–4.49% and the values were close to each other (
p > 0.05). Fat contents of whey samples varied between 0.25–0.30% with the lowest values from the control and L1 cheese (
p < 0.01).
Cheese yield performances varied between 12.97–14.02% (
Table 2) and enzyme-supplemented cheeses had significantly different and lower values than the control cheese (
p < 0.05). The actual performance is indicated as transition ratio of milk dry matter components into the cheese. In case of performance calculations as to have 40% dry matter ratio in white cheese, it was observed that protease and lipase enzyme-supplemented cheeses had close performance values to each other but had significantly lower values than the control cheese and decreasing performance values were observed with increasing enzyme supplementation rates (
p < 0.05). Previous researchers also indicated that enzyme supplementation to cheese to accelerate ripening reduced performance values and such a case primarily resulted from increasing nitrogen losses in whey [
14,
19,
38,
39].
3.2. Gross Composition of Cheeses
Titration acidity, penetrometer values and general composition characteristics of white cheeses throughout 90-day ripening period are provided in
Table 3. Titration acidity (TA) values of cheeses throughout the ripening period were close to each other, while the differences between the cheeses and enzyme dose x ripening period interaction were not significant (
p > 0.05), but the effects of ripening period were found to be significant (
p < 0.01). It was also reported in previous studies that enzyme-supplemented cheeses did not have significantly different acidity values from the control cheese [
38,
40,
41].
Enzyme supplementation had significant effects on dry matter and protein contents of the chesses at 30th and 90th day of ripening (
p < 0.05), ripening period and enzyme × ripening period interaction had significant effects on these attributes at
p < 0.01 level. It was reported in previous studies that proteolytic and lipolytic enzymes did not have significant effect on dry matter content of cheeses [
42,
43,
44,
45]. Increasing acidity levels were reported to reduce water holding capacity of casein, thus increased dry matter content of the cheeses [
46]. At the 90th day of ripening, protease enzyme-supplemented cheeses had significantly lower protein contents than the control cheese (
p < 0.01) such a case was resulted from excessive protease contents. Protein contents of the cheeses had generally decreasing trends after the 30th day of ripening (
p < 0.01).
The effects of enzyme treatments and enzyme × ripening period interaction on fat contents of the cheeses were not found to be significant (
p > 0.05). It was reported that lipase enzyme supplementation did not have significant effects on fat contents of Ras cheese produced with Piccantase A [
42,
43], on fat contents of again Domiate cheese produced by using Palatase A, Palatase M and Piccantase [
46] and on fat contents of Kasher cheese produced with Palatase M 200 L [
47] and increasing fat contents were reported with the progress of ripening just based on increasing dry matter contents [
41]. Slightly lower fat contents of lipase enzyme-supplemented cheeses than the others on 90th day of ripening can be attributed to high lipase enzyme activity and resultant release of fat from the cheeses. High fat contents of protease enzyme-supplemented chesses than the others can be attributed to release of nitrogenous by-products from the cheeses because of proteolysis with the progress of ripening and resultant decreasing protein content and relatively increasing fat and other compound content of dry matter. Present analyses revealed that enzyme treatments had significant effects on salt ratios throughput the ripening period (
p < 0.05), except for 90th day of ripening. On the other hand, ripening period and enzyme × ripening period interaction had significant effects on the salt ratios at
p < 0.01 level. The fluctuations in dry matter salt ratios of lipase-supplemented cheeses can be attributed to changes in dry matter contents of these cheeses.
As compared to the 1st day of ripening, cheeses hardened on 15th day of ripening, but softened from the 30th day until the end of ripening period. Enzyme treatments, enzyme x ripening period interaction had significant effects on penetrometer value (PV) (
p < 0.01). As compared to the control cheese, at the last period of ripening, proteolytic enzyme-supplemented cheeses had either similar or harder texture and lipase enzyme-supplemented cheeses had softer texture (
p < 0.01). Such a case can be attributed to high lipase levels of the cheeses [
40,
48].
3.3. Nitrogen Fractions and Ripening Index of the Cheeses
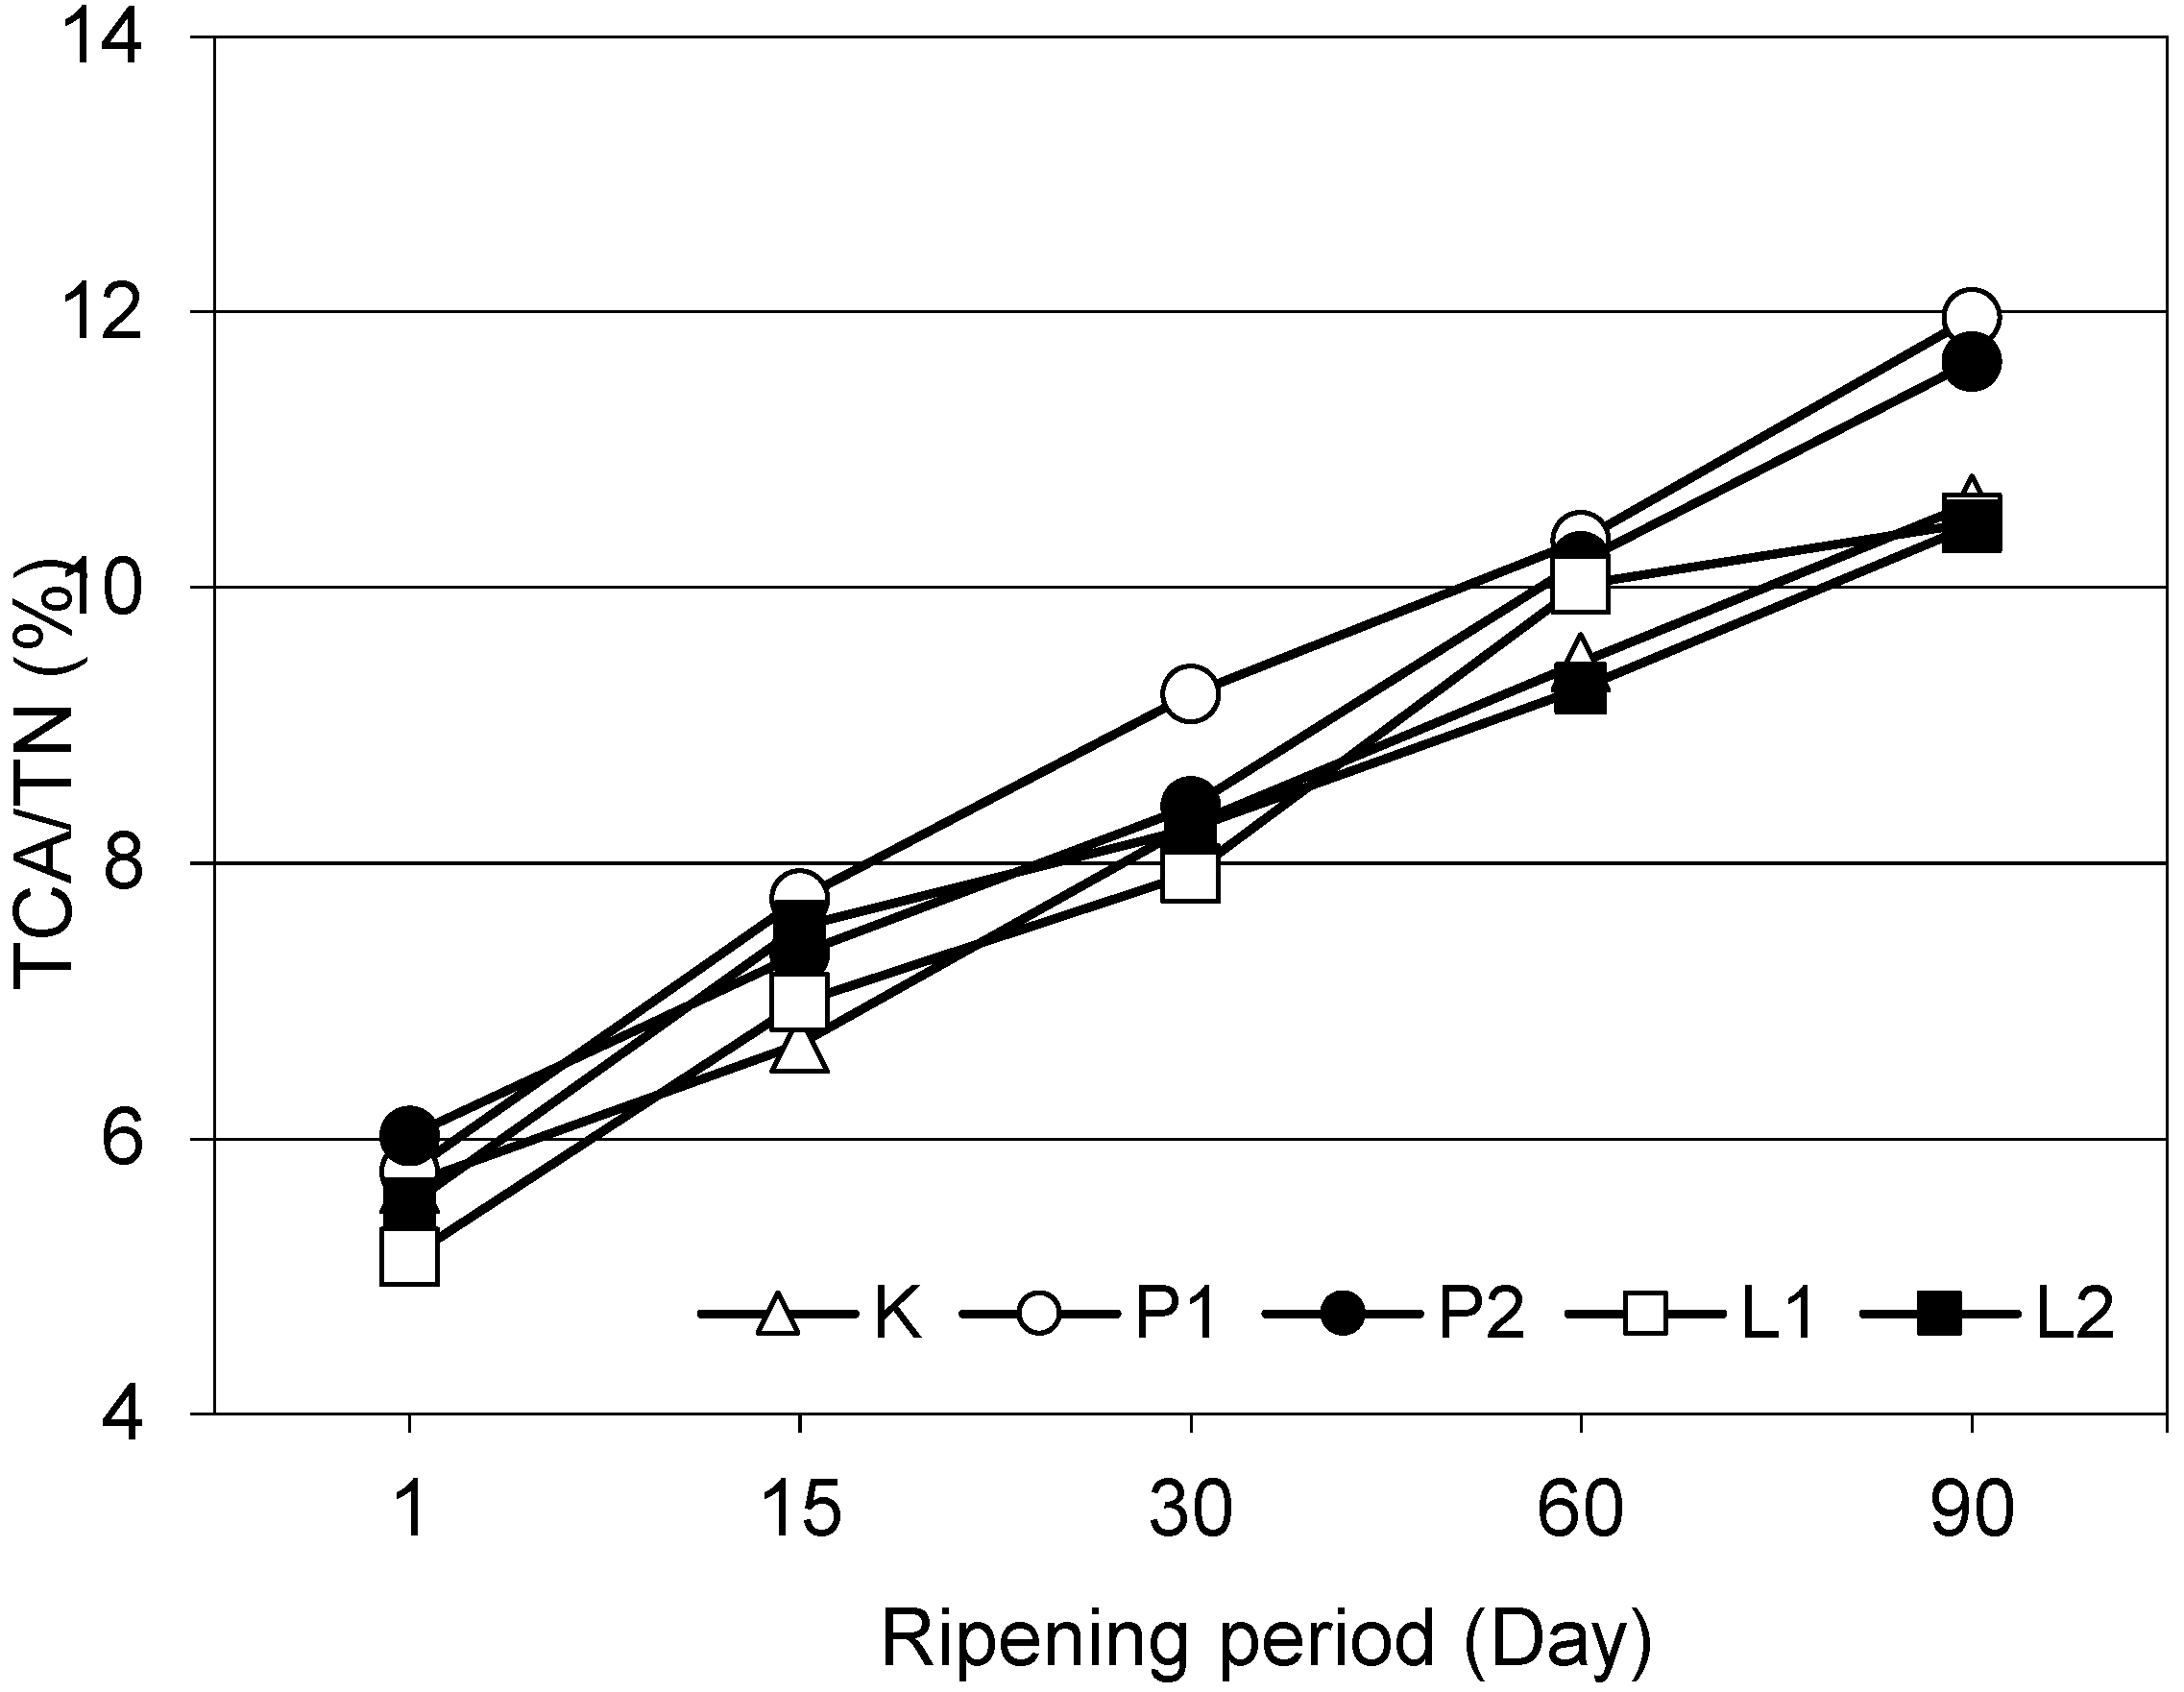
In terms of water soluble nitrogen and 12% TCA soluble nitrogen contents (
Table 4) of the cheeses, it was observed that protease enzyme-supplemented cheeses were significantly different from the others on the last day of ripening and significant increases were observed throughout the ripening period (
p < 0.01). Nunez et al. [
48]. reported that water soluble nitrogen formation in cheeses was more influenced from Neutrase L and Novozym proteinase enzyme supplementations than the 12% TCA-SN and 5% PTA-SN soluble nitrogen formation. Nasr [
38] for Piccantase enzyme-supplemented Romi cheeses, Kheadr et al. [
49] for
Mucor miehei-originated Palatase M and
Aspergillus niger-originated Lipase 50 enzyme-supplemented Cheddar cheeses, reported that water soluble nitrogen and non-protein nitrogenous substance contents were slightly higher than the control cheese and these values increased with the progress of ripening.
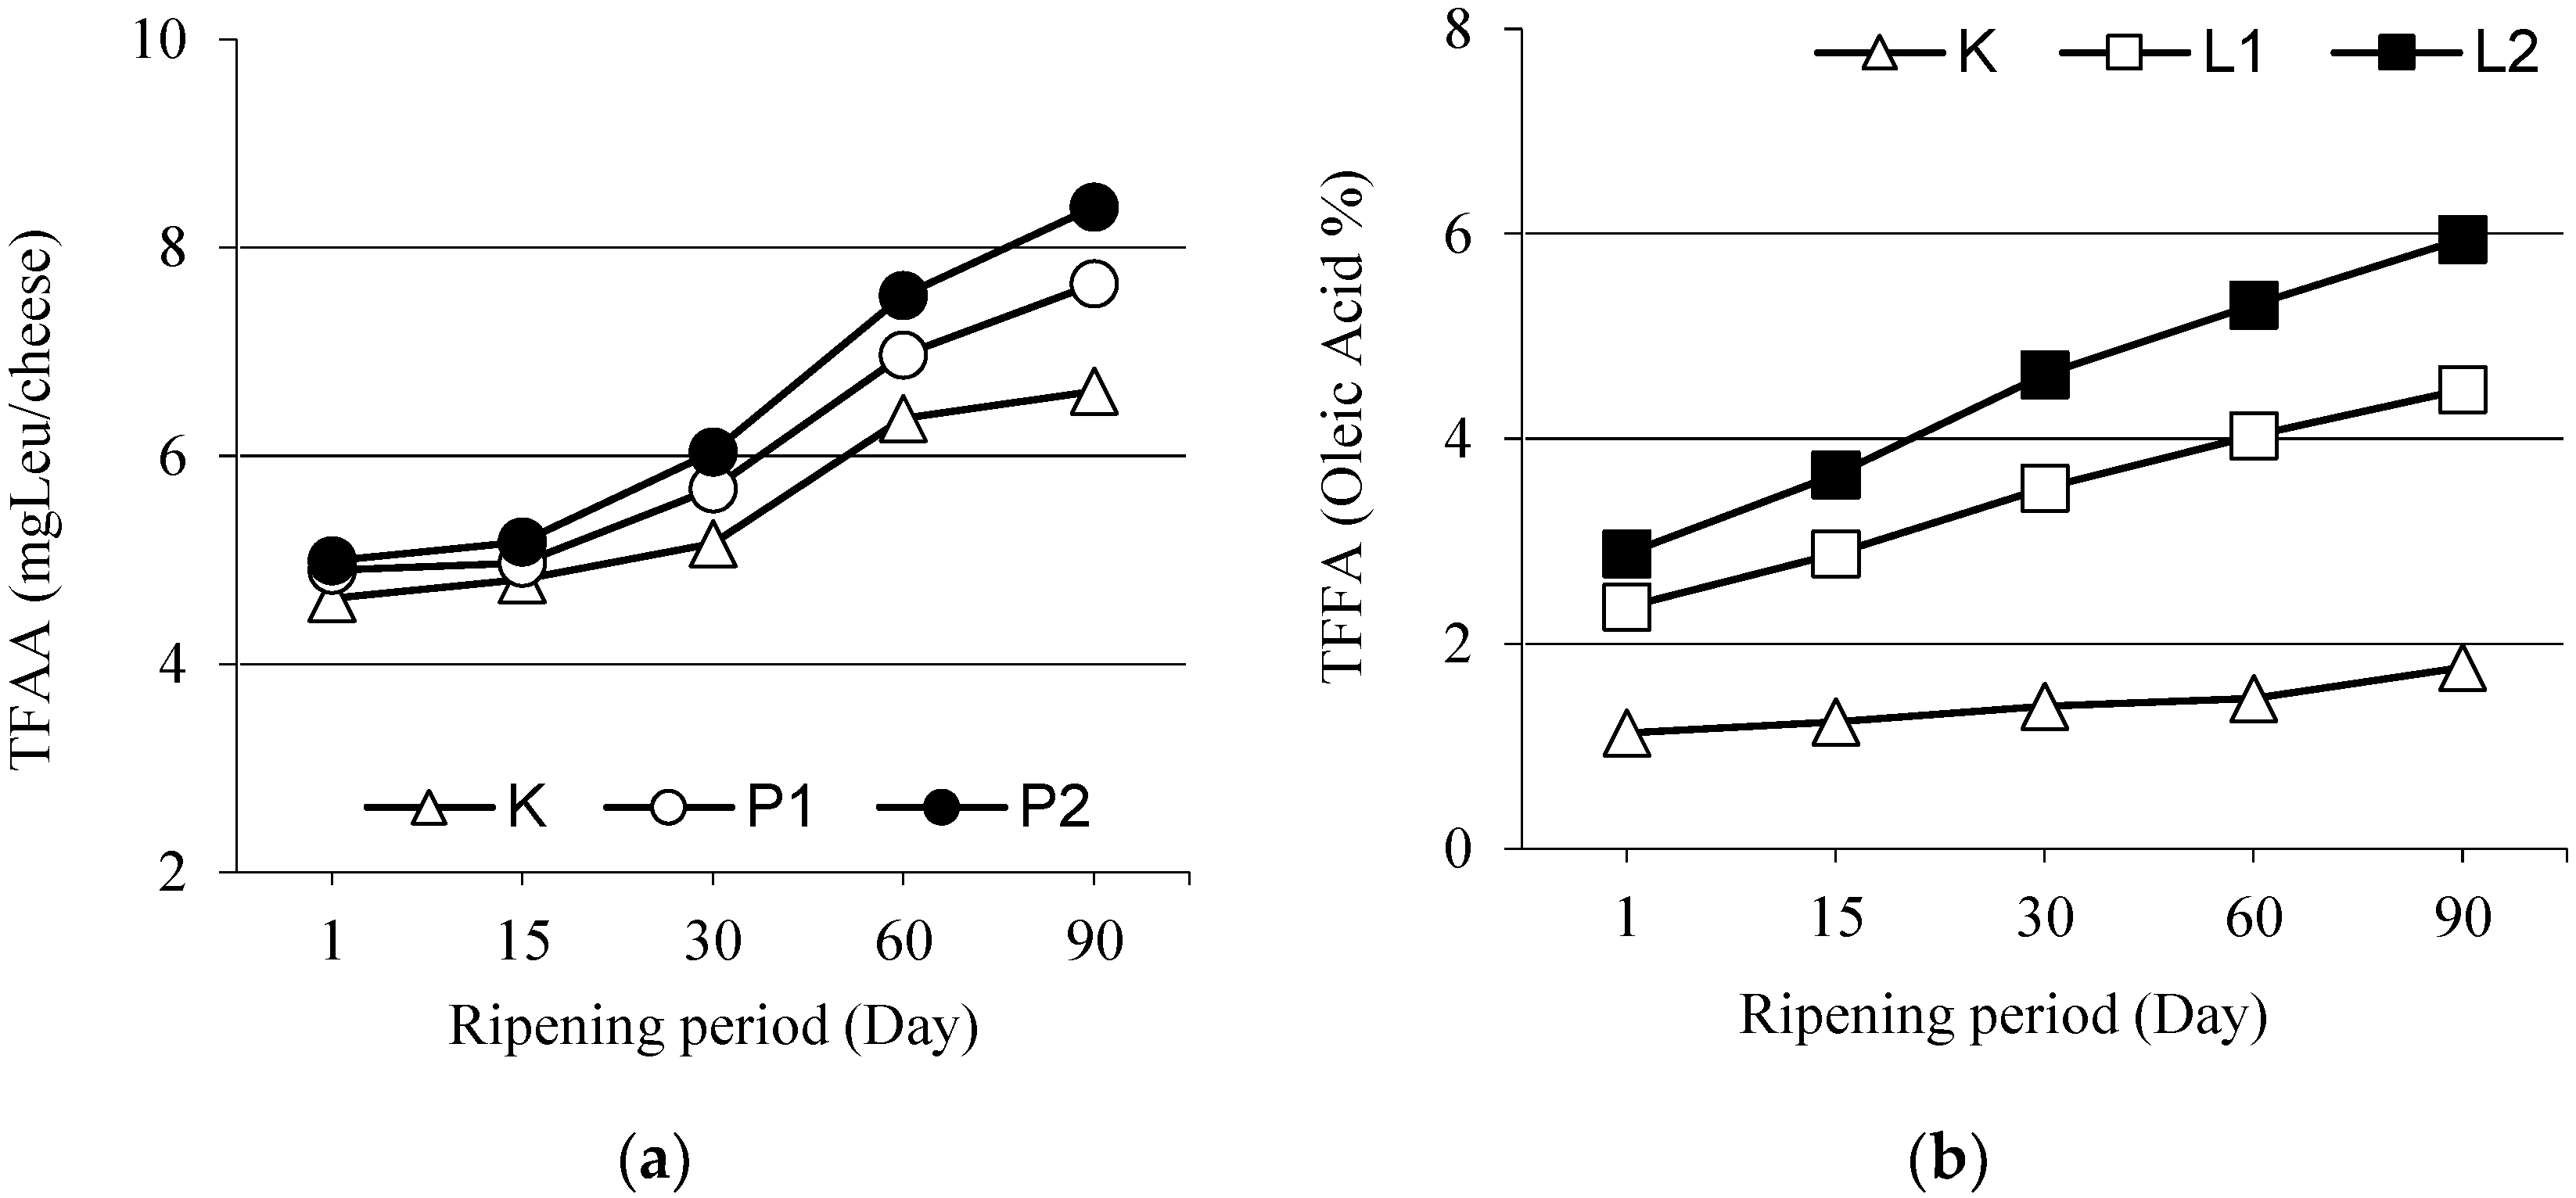
Peptide and amino acids with a molecular weight less than 600 dalton are significant indicators of cheese aroma levels [
18] and these substances dissolved in 5% PTA-SN [
50]. The differences in peptide and amino acid quantities dissolved in 5% PTA-SN at different ripening periods were found to be significant, proteolytic enzyme quantities did not yield significant differences (
p > 0.05) and protease enzyme-supplemented cheeses were significantly different from lipase enzyme-supplemented chesses (
p < 0.01). Such a case can be attributed to enhanced peptidase activity arising from the higher levels of primary proteolysis. Researchers indicated the primary reason for such cases as solubility of small molecule peptides and amino acids generated throughout the ripening duration in 5% PTA-SN. Increasing free amino acid quantities of these cheeses also support such an idea.
With regard to casein ratios in % nitrogen contents, it was observed that enzyme treatments (except for 30th day of ripening), ripening period, enzyme × ripening period interaction had significant effects on casein % nitrogen values, casein % nitrogen values decreased throughout the ripening duration (p < 0.01) and such a decrease was higher in proteolytic enzyme-supplemented cheeses than the control cheese (p < 0.01). Decreasing casein nitrogen quantities can be attributed to hydrolysis of α- and β-casein into peptides and amino acids.
Enzyme treatments, enzyme × ripening period interaction had significant effects on protease-peptone nitrogen values at
p < 0.05 levels and ripening period had significant effects at
p < 0.01 level. Except for 30th day of ripening, protease-peptone nitrogen rations of cheeses increased throughout the ripening period, except for 30th day of ripening (
p < 0.01). Karaca and Guven [
51] indicated regular decreases in casein nitrogen and increases in protease-peptone nitrogen ratios of white cheeses during the ripening process and reported the highest change in cheeses including
Mucor miehei-originated protease enzyme.
Except for the 15th and 30th day of ripening, lipolytic and proteolytic enzyme-supplementations had significant effects on 12% TCA soluble nitrogen ratios, in other words on ripening index (
Figure 1), of the cheeses (
p < 0.01). On the 90th day of ripening, lipase enzyme-supplemented L1 and L2 chesses had similar 12% TCA soluble nitrogen ratios with the control cheese and such a ratio of proteolytic enzyme-supplemented P1 and P2 cheeses were significantly higher than the other cheeses (
p < 0.01). On the other hand, enzyme quantities did not have significant effects on this ratio (
p > 0.05). The 12% TCA soluble nitrogen ratios of white cheeses regularly increased with the progress of ripening (
p < 0.01). Significant increases in 12% TCA soluble nitrogen ratios were also reported with the progress of ripening in Feta cheese by Valsamaki et al. [
52], in Manchego cheese by Gaya et al. [
53] and in white cheeses by Güven and Karaca [
54], Cinbaş and Kılıç [
55]. Significantly higher TCA soluble nitrogen ratios than the control cheese and increasing values with the progress of ripening were also reported for
Bacillus subtilis-originated neutral protease-supplemented Manchego cheese [
48,
56] and Cheddar cheese [
57].
3.5. Individual Free Amino Acid Composition
Individual free amino acid composition of cheeses (15 amino acids) is provided in
Table 5.
Free amino acid content of cheese is largely depending on manufacturing technology and ripening period. However, the primary factors responsible for amino acid release were indicated as non-starter lactic acid bacteria and proteolytic enzymes in the cheese [
4]. They contribute to the overall characteristic flavor of different cheese varieties [
6] and describe how far the ripening has proceeded [
62]. As compared to the control cheese, protease enzyme-supplemented cheeses had significantly higher proline, aspartate and glutamate amino acid concentrations on the 30th day of ripening (
p < 0.05). On the other hand, on the 90th day of ripening, proline, aspartate, glutamate and histidine amino acid concentrations of enzyme-supplemented cheeses were different from each other (
p < 0.05). A general increase was observed in free amino acid concentrations of the control and protease enzyme-supplemented cheeses throughout the ripening period. The proteolytic activity during cheese ripening produces a higher content of short-chain peptides and FAAs [
63]. The increase in aspartate and methionine concentrations of especially the proteolytic enzyme-supplemented cheeses throughout the ripening period was quite higher than the control treatment. In all periods of ripening of white cheeses, the highest amino acids were identified as glutamate, leucine, proline and aspartate and these amino acids increased with increasing protease enzyme quantities (
p < 0.05).
3.7. Mineral Composition
Some minerals move from the inside out with the effect of pH and thus variations are observed in mineral concentrations of the final products [
65]. On 30th day of ripening, calcium and magnesium contents of the cheese samples varied respectively between 687–764 and between 204–211 mg 100 g
−1 (
Table 6).
The values decreased on 90th day and varied respectively between 631–718 mg 100 g−1 and between 175–189 mg 100 g−1. The control and lipase enzyme-supplemented cheeses had higher calcium, sodium and phosphorus contents than the protease enzyme-supplemented cheeses. Statistical analyses revealed that enzyme treatments had significant effects on calcium, sodium, magnesium, phosphorus and zinc contents of while cheeses (p < 0.01) but did not have significant effects on potassium contents (p > 0.05). Ripening period and enzyme × ripening period interaction had significant effects on all minerals (p < 0.05). On the 30th day of ripening, the highest zinc (Zn) content (4.63 mg 100 g−1) was obtained from the control cheese and it was respectively followed by P2, L2, L1 and P1 cheeses (p < 0.05). The differences in iron (Fe) contents of the cheeses were not found to be significant on 30th day of ripening (p > 0.05). Enzyme treatments did not have significant effects on iron and manganese contents (p > 0.05) but had significant effects on copper contents (p < 0.01). Effects of ripening period and enzyme × ripening period interaction were not also found to be significant (p > 0.05). Major and minor minerals of cheese samples decreased with the progress of ripening. Such decreases throughout the ripening process were attributed to mineral passage into brine in time.


