3.2. Fitting the Response Surface Methodology Model
The RSM with Central Composite Design (CCD) was then employed to determine the optimal formulation for the infeed formula in terms of the overall concentration of the encapsulating agents (MD/GA, 1:1, w/w) in the stock solution and the optimal ratio of the aqueous bitter melon extract to the encapsulating agents’ stock solution (
Table 3), using the concentrations (X
1) and the ratios (X
2) listed in
Table 1. The combinations generated by the CCD model for X
1 and X
2 and carried out experimentally are shown in
Table 3. The experimental data (
Table 3) for the process yield and the retentions of TSC, TPC, TFC and TAA were analysed using multiple regression and response surface analysis to generate the final equations in terms of the two independent variables, concentration (X
1) and ratio (X
2). The predicted data (
Table 3) for all responses were calculated using the equations generated by the JMP software.
Table 4 shows the regression coefficients of the process yield with the independent variables (concentration and ratio). As determined using the P-value, the process yield coefficients were significant for first-order linear effects, with the concentration directly related and the ratio inversely related. However, the values for the second-order quadratic and interactive effects were not significant (
Table 4).
The coefficients of the retentions of TSC, TPC, TFC and TAA were also significant for the first-order linear effects, with both the concentration and the ratio being directly related (
Table 4). However, except for the retentions of TSC, the coefficients of the retentions were not significant for the linear effect of the ratio (
Table 4). In contrast to the process yield, the coefficients of the retentions were all significant for the second-order quadratic effects, with both the concentration and the ratio directly related (
Table 4). The second-order interactive coefficients of the retentions of TSC, TPC, TFC and TAA were not significant (
Table 4).
To generate the models, only the significant regression coefficients (
Table 4) were taken into account. The final equations in terms of the two independent variables, concentrations (X
1) and ratios (X
2) for process yield, and retentions of TSC, TPC, TFC and TAA to obtain the predicted values in
Table 3 were as follows:
Table 3.
The experimental (Exp.) and predicted (Pred.) values for the encapsulation yield (EY) and the retentions of total saponin (TSC), total phenolic (TPC) and total flavonoid (TFC) content and the total antioxidant activity (TAA) for the bitter melon extract encapsulated powder obtained from the RSM CCD design.
| Pattern * | X1 Concentration % (w/w) | X2 Ratio g/g (WW) | EY (%) | TSC (%) | TPC (%) | TFC (%) | TAA (%) |
|---|
| Exp. | Pred. | Exp. | Pred. | Exp. | Pred. | Exp. | Pred. | Exp. | Pred. |
|---|
| 00 | 30 | 1.00 | 63.47 | 63.38 | 60.10 | 63.52 | 54.98 | 56.04 | 48.68 | 49.49 | 45.79 | 44.11 |
| 00 | 30 | 1.00 | 65.89 | 63.38 | 62.67 | 63.52 | 57.28 | 56.04 | 51.16 | 49.49 | 43.54 | 44.11 |
| 0A | 30 | 1.71 | 52.15 | 54.17 | 74.23 | 79.13 | 87.81 | 87.21 | 62.95 | 61.68 | 90.02 | 89.15 |
| +− | 35 | 0.50 | 70.78 | 70.61 | 71.49 | 72.18 | 95.50 | 95.38 | 81.08 | 80.97 | 87.70 | 86.64 |
| 0a | 30 | 0.30 | 72.81 | 72.59 | 63.07 | 65.65 | 91.61 | 90.21 | 63.37 | 63.98 | 87.48 | 87.19 |
| 00 | 30 | 1.00 | 62.54 | 63.38 | 61.98 | 63.52 | 55.28 | 56.04 | 51.34 | 49.49 | 43.66 | 44.11 |
| ++ | 35 | 1.50 | 68.21 | 66.35 | 79.97 | 81.81 | 90.18 | 93.24 | 78.35 | 79.33 | 83.31 | 88.04 |
| A0 | 37 | 1.00 | 70.50 | 70.62 | 79.92 | 79.06 | 97.84 | 94.17 | 92.91 | 89.02 | 85.27 | 81.92 |
| −+ | 25 | 1.50 | 43.15 | 47.25 | 77.47 | 73.41 | 80.19 | 75.04 | 53.82 | 50.63 | 80.37 | 74.54 |
| a0 | 23 | 1.00 | 64.46 | 56.14 | 59.06 | 67.13 | 63.95 | 68.32 | 44.28 | 48.27 | 58.35 | 62.75 |
| −− | 25 | 0.50 | 63.56 | 69.31 | 63.20 | 63.78 | 79.46 | 77.18 | 57.07 | 52.27 | 74.01 | 73.14 |
Table 4.
The coded second-order regression coefficients for the encapsulation yield (EY) and the retentions of total saponin (TSC), total phenolic (TPC) and total flavonoid (TFC) content and the total antioxidant activity (TAA) for the bitter melon extract encapsulated powder obtained from the RSM CCD design.
| Independent Variables | Regression Coefficient Values |
|---|
| EY (Y1) | TSC (Y2) | TPC(Y3) | TFC (Y4) | TAA (Y5) |
|---|
| Intercept | 63.97 | 61.58 | 56.51 | 50.39 | 44.33 |
| Linear |
| X1 | 5.10 * | 5.04 * | 9.24 ** | 14.66 *** | 6.84 * |
| X2 | −6.53 * | 4.82 * | −1.07 | −0.82 | 0.70 |
| Quadratic |
| X1 X1 | 0.87 | 4.94 | 12.51 ** | 9.53 * | 14.01 ** |
| X2 X2 | −1.63 | 4.53 * | 16.67 ** | 6.81 * | 22.48 *** |
| Interaction |
| X1X2 | 4.46 | −1.45 | −1.51 | 0.13 | −2.69 |
| R2 | 0.86 | 0.87 | 0.98 | 0.97 | 0.98 |
| p-value of lack of fit | 0.083 | 0.062 | 0.071 | 0.100 | 0.075 |
Table 4 also shows that the predicted data from the equations and experimental data were highly correlated; the coefficient of multiple determination (
R2) for the process yield (
R2 = 0.86) and the retentions of TSC (
R2 = 0.87), TPC (
R2 = 0.98), TFC (
R2 = 0.97) and TAA (
R2 = 0.98) were all very high. In addition, the lack of fit for the process yield and the retentions of TSC, TPC, TFC and TAA were found to be non-significant (
p > 0.05) (
Table 4). This indicated that the second-order polynomial models (Equations (3)–(7)) were adequate to describe the true behaviour of the system and could be used for interpolating the experimental data.
3.3. Effects of the Concentration and Ratio on Encapsulation Yield and Encapsulation Efficiency
It is important to obtain as high a process yield as possible from any encapsulation process, including spray-drying. If the yield is low, the encapsulation may not be economical and therefore not worth doing. However, in order to maximise the yield, it is important that the effects of the important parameters of the system are known. For spray-drying, two of the parameters, which can be varied in the infeed solution, are the concentration of the encapsulating agents in the stock solution (X1) and the ratio of the extract solution to the encapsulating agents’ solution (X2).
In the present study,
Table 4 and the 3D response surface and 2D contour plot (
Figure 1a) show that the process yield significantly increased as the concentration (X
1) of the encapsulating agents increased and the ratio of the extract to the encapsulating agent (X
2) decreased. The yield of encapsulated powder from the spray-drying process is mainly determined by the efficiency with which the powder is collected. Usually, a low process yield is due to the sprayed droplets and powder sticking to the wall of the chamber and cyclone before they are sufficiently dry and therefore, this material is unable to be collected [
24,
25,
26].
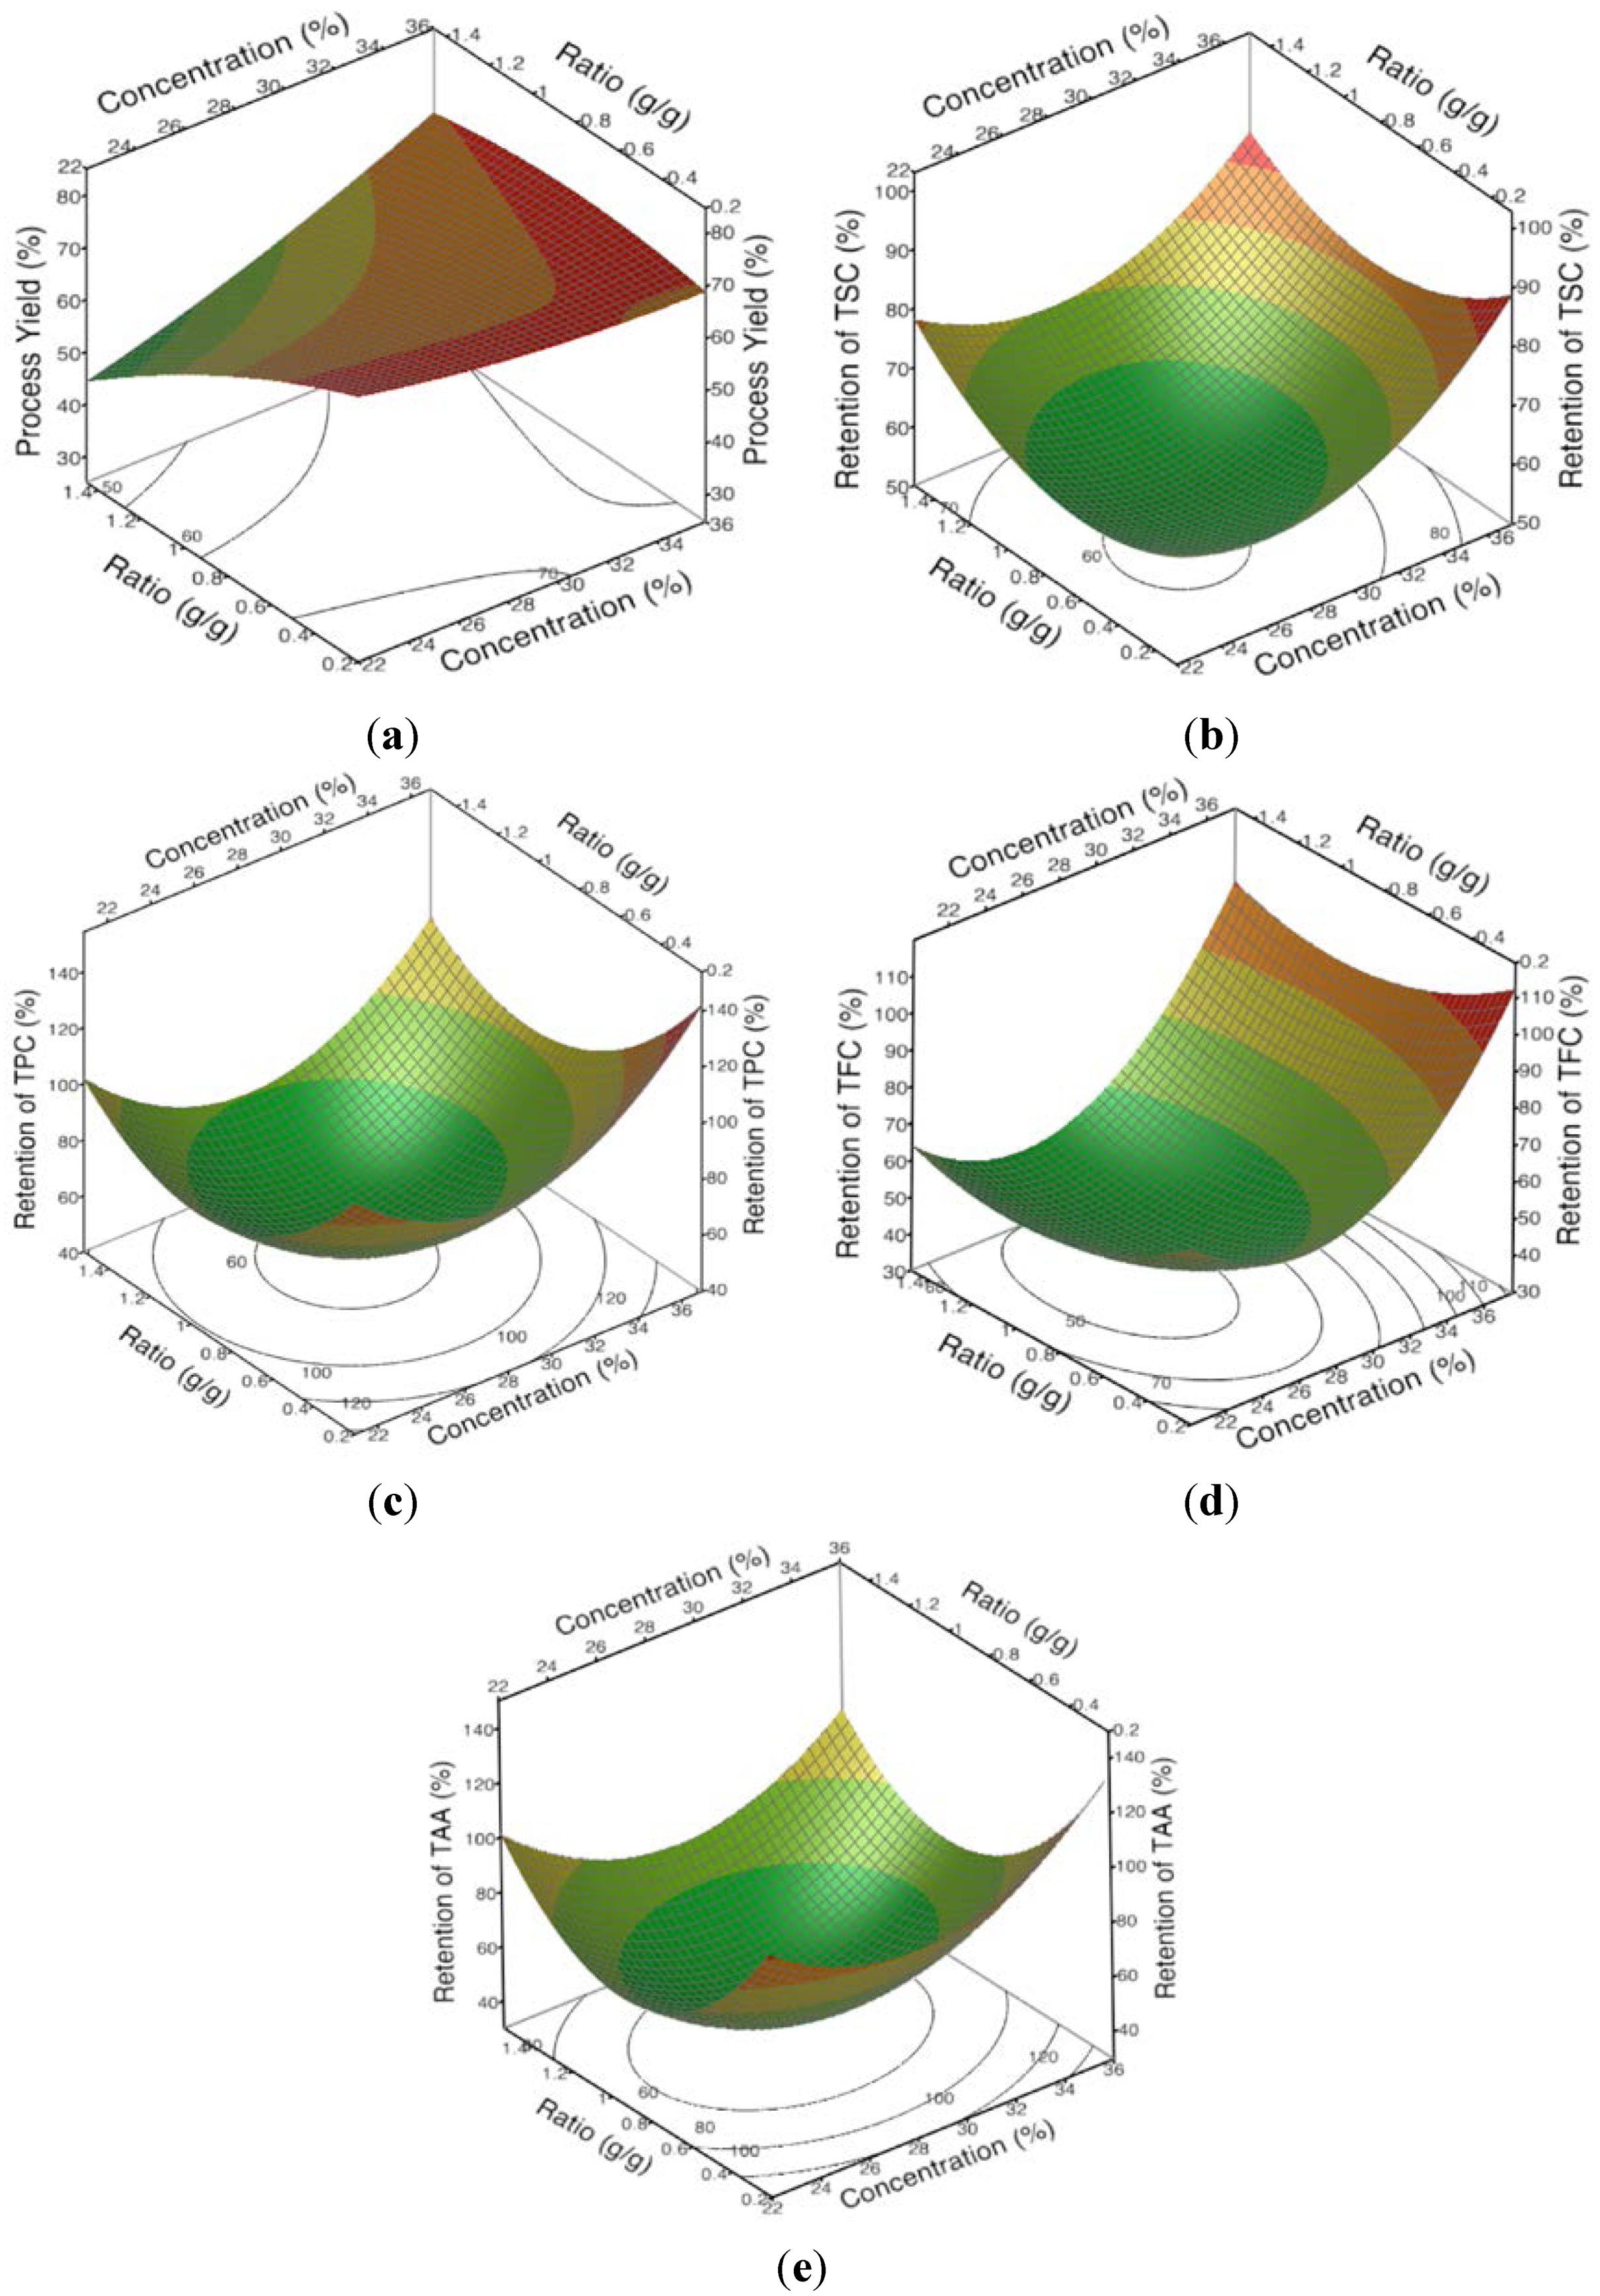
Figure 1.
The 3D response surface and 2D contour plots of the (a) process yield and the retentions of (b) total saponin content (TSC); (c) total phenolic content (TPC); (d) total flavonoid content (TFC) and (e) total antioxidant activity (TAA) in response to concentration (X1) and ratio (X2).
Figure 1.
The 3D response surface and 2D contour plots of the (a) process yield and the retentions of (b) total saponin content (TSC); (c) total phenolic content (TPC); (d) total flavonoid content (TFC) and (e) total antioxidant activity (TAA) in response to concentration (X1) and ratio (X2).
The lower yields obtained from spray-drying with the lower concentrations of the encapsulating agents in the stock solution (
Figure 1a,
Table 4, Equation (3)) and the higher ratios of the extract solution to the encapsulating agent solution are both likely to have been caused by an insufficient amount of the encapsulating agents being available to completely cover the sprayed water droplets, which would have caused some of the droplets to stick to the spray dryer’s chamber wall before they were sufficiently dry [
25]. Essentially, the lower concentrations of the encapsulating agents in the agents’ aqueous stock solution and adding relatively more of the aqueous bitter melon extract relative to the encapsulating agent stock solution (
Table 1) both resulted in lower concentrations of the encapsulating agents in these infeed solutions.
The response for the retentions of TSC, TPC, TFC and TAA was more complicated than for the process yield. The retentions also generally increased as the concentration of the encapsulating agents was increased in the stock solution (
Figure 1b–e,
Table 4, Equations (4)–(7)) but it was more curvilinear than for the process yield. Furthermore, the ratio of the aqueous bitter melon extract to the encapsulating agents’ stock solution did not have a significant effect on the retentions of TPC, TFC and TAA (
Table 4). There was a significant effect on the retention of TSC, but the effect was a direct effect, not an inverse effect as seen for the process yield (
Table 4). Therefore, unlike the effects on the process yield, which appeared to be mainly due to the concentration of the encapsulating agents in the infeed solution, it was not apparent what the underlying reason was for the effects on the retentions.
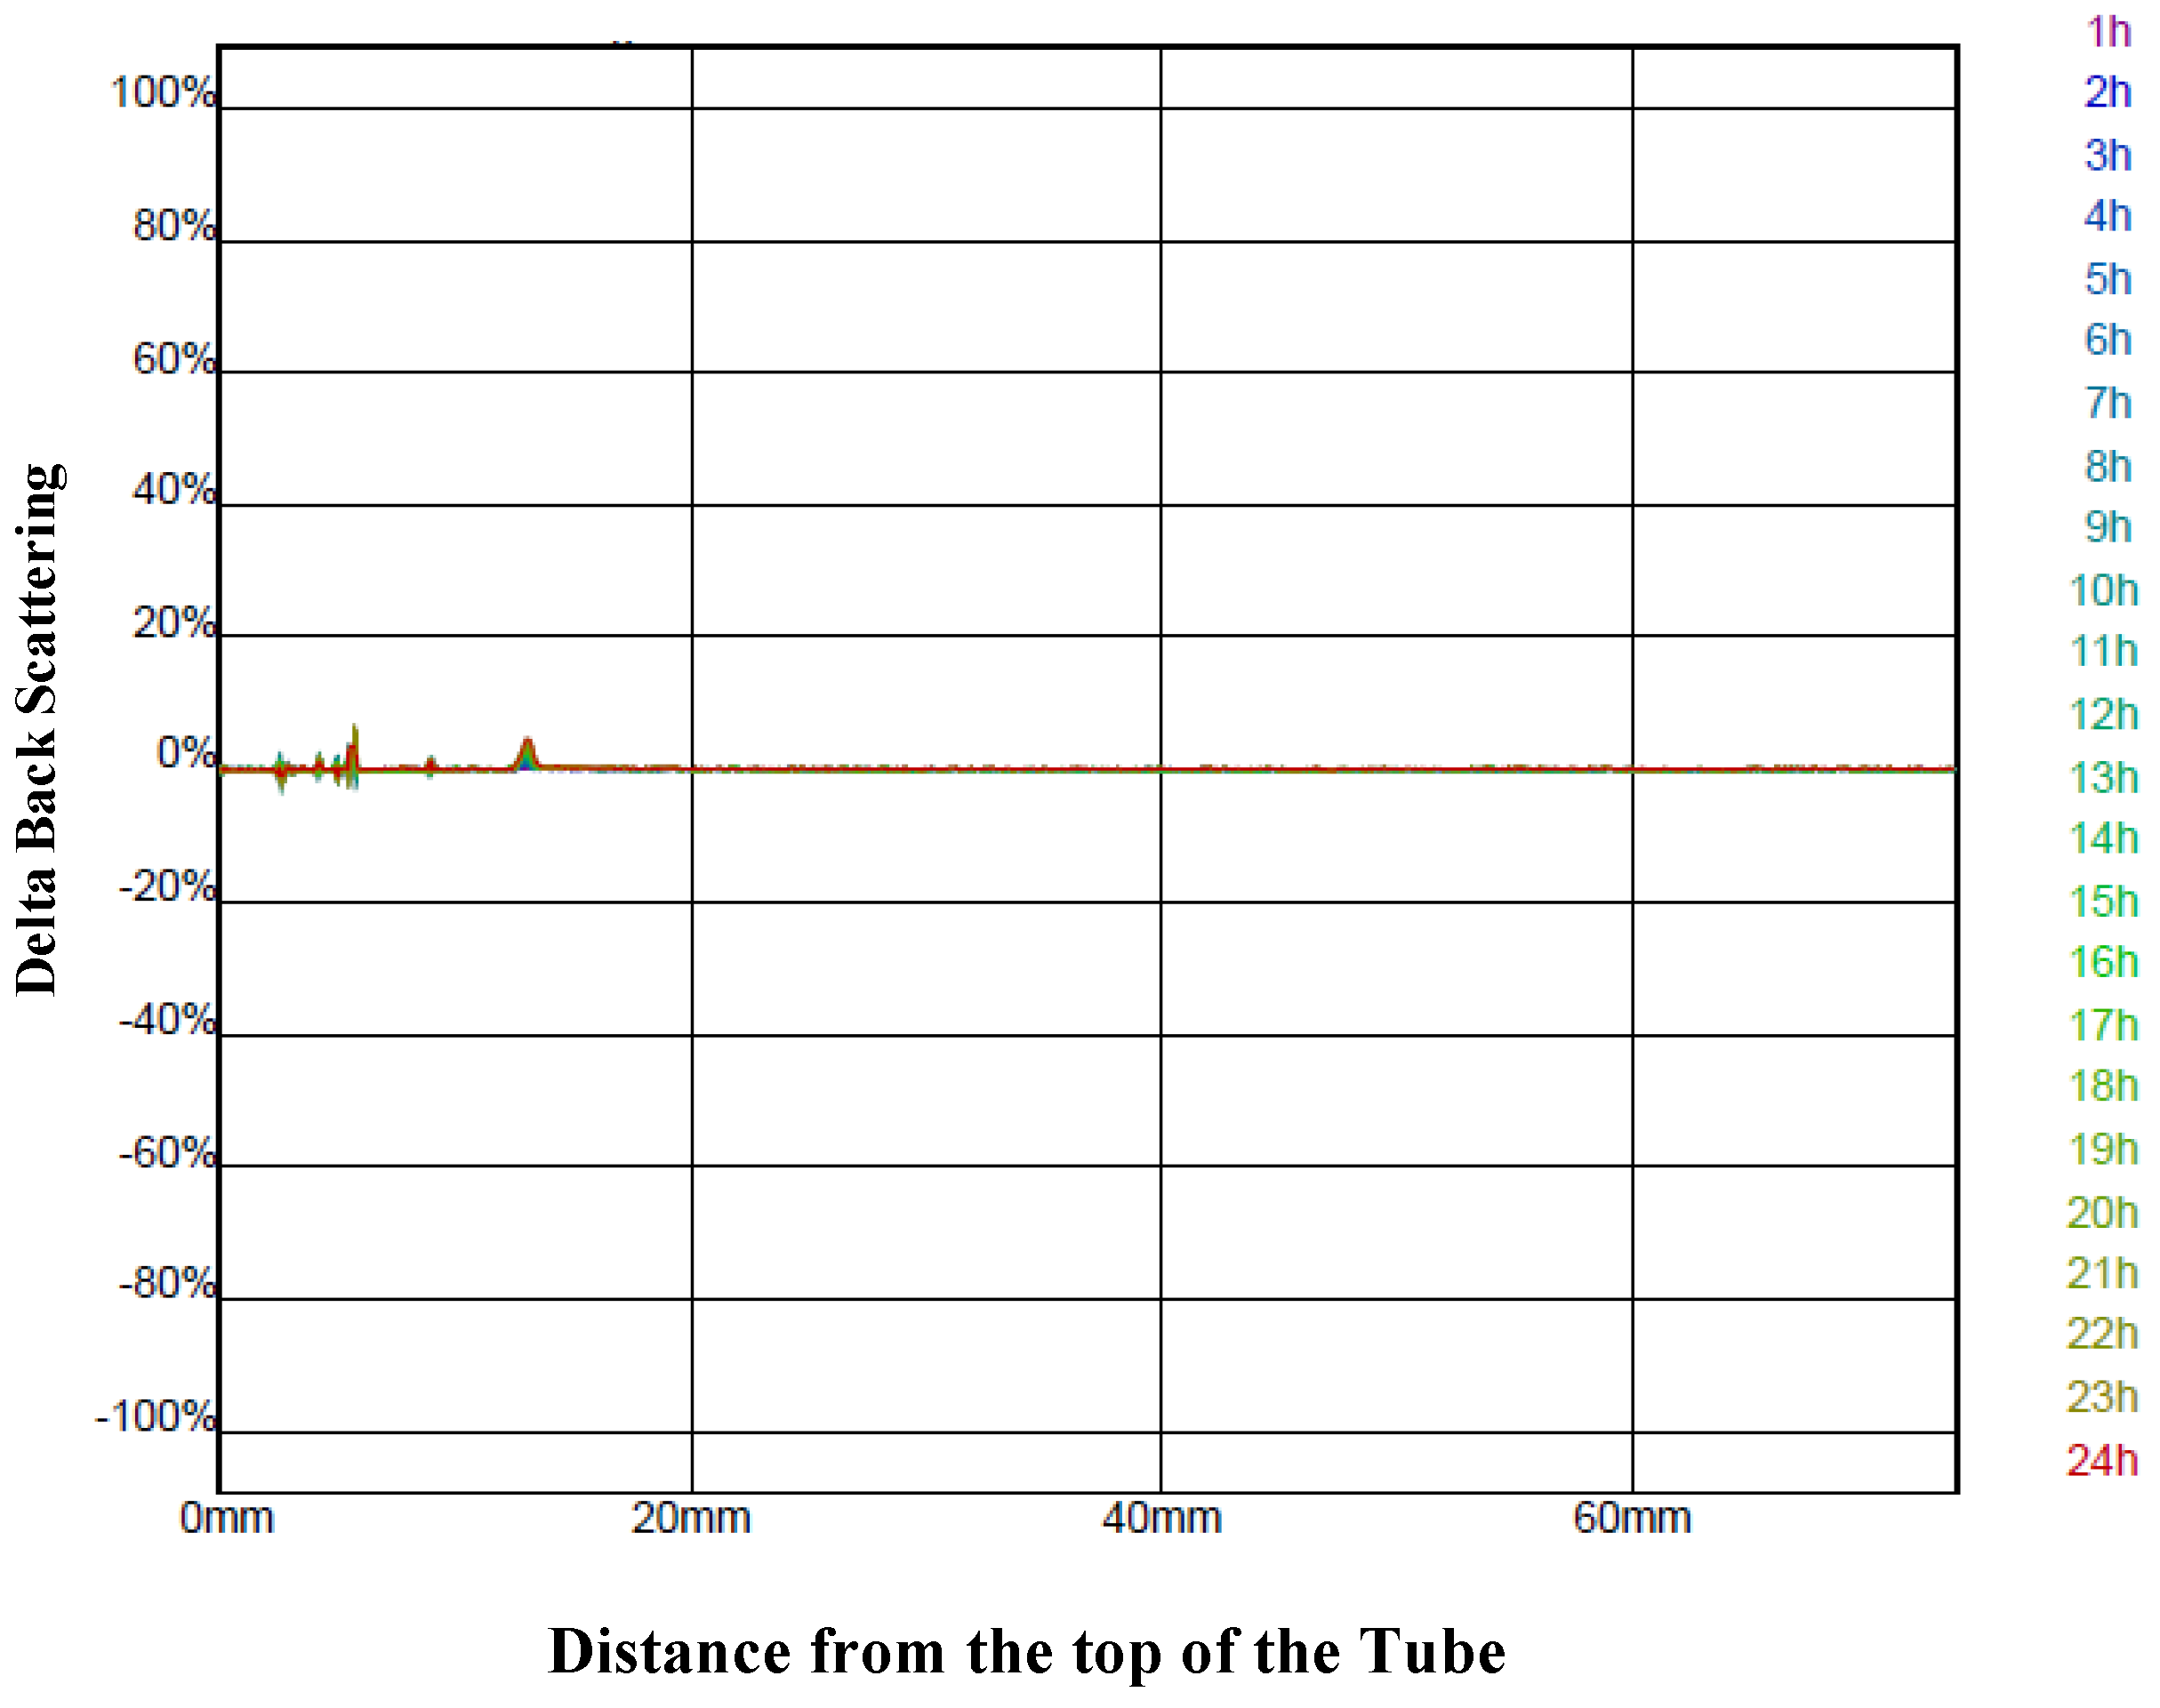
Of note is the fact that none of the variations seen in the process yield and retentions were due to differences in the stability of the different infeed solutions. Measurement of the backscattering profiles (
Figure 2) for all the infeed solutions showed that they were all very stable over 24 h and, therefore, the stability of the infeed solutions was unlikely to be a factor influencing their spray-drying.
Figure 2.
The delta back scattering profile measured every hour over 24 h for an infeed solution prepared with the encapsulating agents’ stock solution at 35% (w/w) and a ratio of 1.5:1 g/g of the aqueous bitter melon extract to the encapsulating agent solution. The graph is typical of the delta back scattering profile for all the other infeed solutions prepared with different concentrations and ratios.
3.4. The Optimal Formulation and Validation of the Models
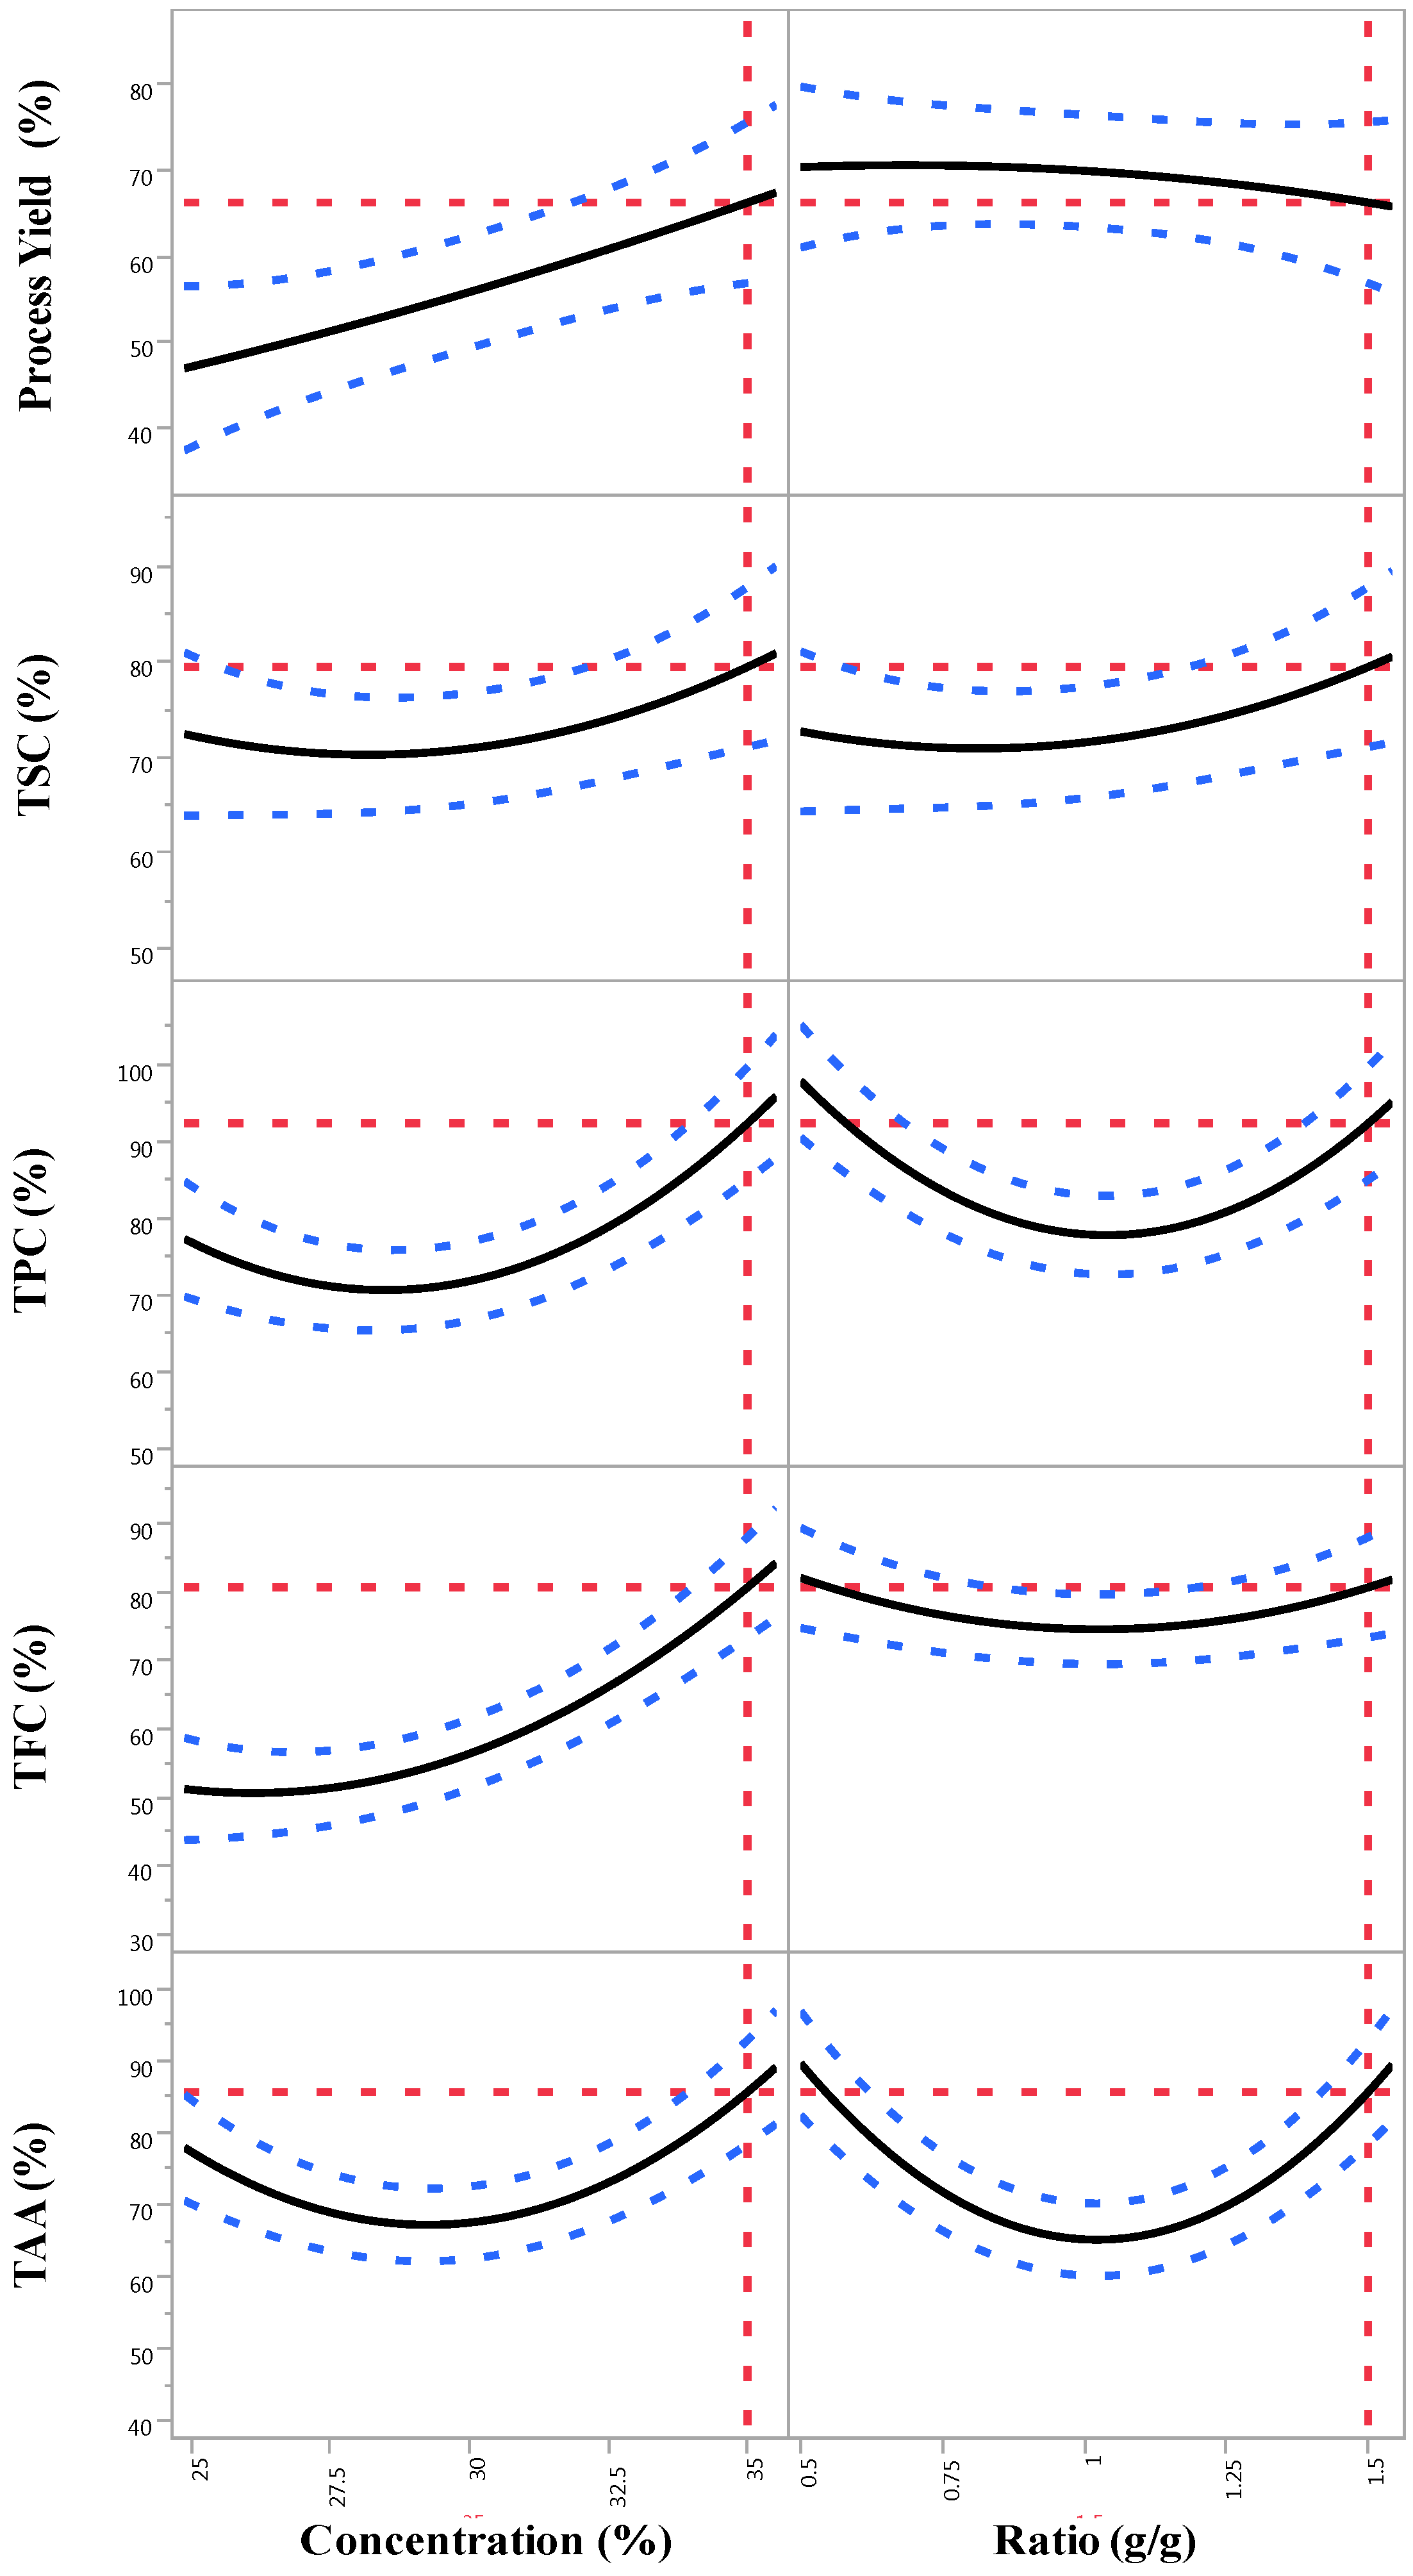
The optimal formulation for obtaining the overall highest values for the process yield and the retentions of the bioactive compounds and antioxidant activity was predicted by the generated model shown in
Figure 3. The theoretical maximum value for the optimal formulation was predicted to be a concentration (X
1) of 35% (w/w) for the encapsulating agents’ stock solution and a ratio (X
2) of 1.5:1 g/g of the aqueous bitter melon extract to the encapsulating agent solution.
Figure 3.
Prediction profiler plots for the process yield and the retentions of the process yield and the retentions of total saponin content (TSC), total phenolic content (TPC), total flavonoid content (TFC) and total antioxidant activity (TAA) of the encapsulated powder affected by concentration (X1) and ratio (X2).
The maximum response values predicted by the optimal formulation (X
1 = 35%, X
2 = 1.5:1 g/g) for the process yield and the retentions of TSC, TPC, TFC and TAA are shown in
Figure 3 and
Table 5. A verification experiment was performed in triplicate using the predicted optimal formulation to determine its validity. The mean values for the responses obtained from the real experiment were then compared with the predicted values. The results (
Table 5) showed that there were no significant differences (
p > 0.05) between the measured and the predicted values for the process yield and the retentions of TSC, TPC, TFC and TAA. Therefore, it was evident that the models (Equations (3)–(7)) were valid and reliable for predicting the optimal formulation.
Table 5.
Validation of the models. The predicted and experimental values for the encapsulation yield (EY) and the retentions of the total saponin (TSC), total phenolic (TPC) and total flavonoid (TFC) content and the total antioxidant activity (TAA) for the bitter melon extract encapsulated powder obtained for the optimal conditions.
| | EY (Y1) | TSC (Y2) | TPC (Y3) | TFC (Y4) | TAA (Y5) |
|---|
| Predicted values | 66.4 ± 4.4 | 80.9 ± 3.9 | 93.9 ± 3.5 | 80.6 ± 3.3 | 88.3 ± 3.9 |
| Experimental values | 62.4 ± 0.4 | 82.7 ± 1.6 | 92.0 ± 3.6 | 79.6 ± 3.5 | 83.6 ± 3.9 |
According to these results, a stock solution concentration of 35% (w/w) for the encapsulating agents appeared to be optimal for effectively forming a protective covering over the surface of the droplets, containing the bitter melon extract, during the spray drying process and thus to result in a high process yield and high retentions [
27]. Such a high encapsulating agent concentration is thought to result in a dense and tightly packed continuous phase membrane which can efficiently surround dispersed solutes, such as the saponins, phenolics and flavonoids from the aqueous bitter melon extract in the present study, and thereby prevent the degradation of these bioactive compounds due to exposure to heat and oxidation [
28]. The antioxidant activity of such solutes can also be preserved, and as seen in another study [
15], the TSC, TPC and TFC of the encapsulated bitter melon extract were highly correlated with the TAA; the correlation coefficients were 0.71, 0.97 and 0.68, respectively.
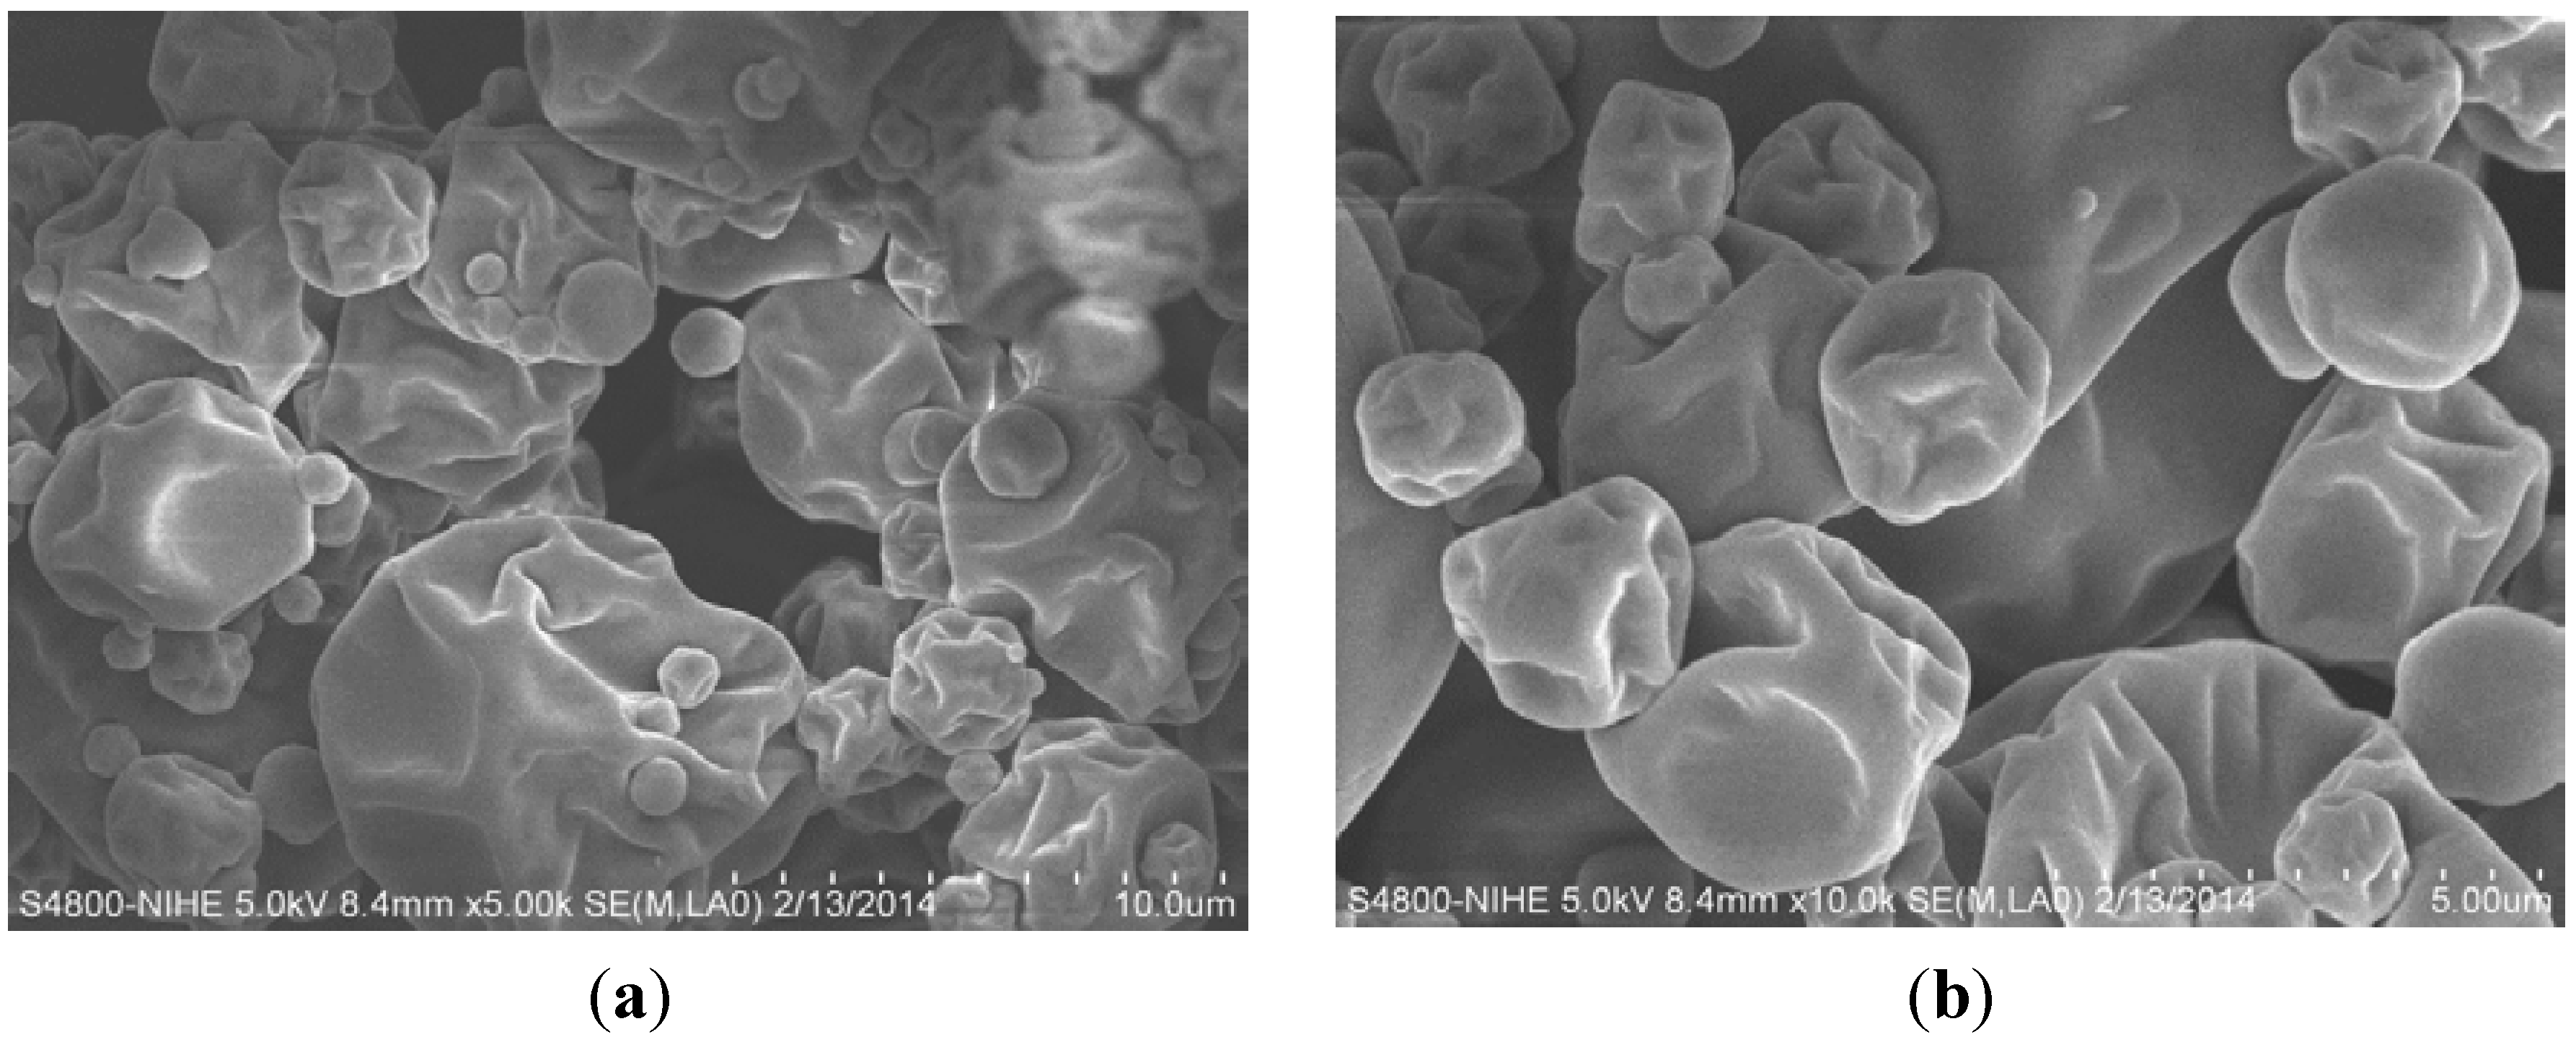
3.5. Properties of the Optimised Encapsulated Powder
The SEM images of the encapsulated powder prepared with the optimal formulation (X
1 = 35%, X
2 = 1.5:1 g/g) are shown in
Figure 4. Spherical particles of different sizes were observed, a well-known characteristic of spray-dried powders [
25]. The powder particles were micron-sized (<12 μm). As seen in
Figure 4, the encapsulated powders were free of cracks and pores, which is very important to prevent the bitter melon extract from being exposed to the atmosphere and being degraded through oxidation.
However, the SEM images also showed that the surface of the powder particles was wrinkled, which may have been due to the spray drying temperatures used [
29]. According to Nijdam and Langrish [
30], a vacuole forms once a skin has developed on the surface of a droplet, and it inflates when the temperature and the vapour pressure inside the vacuole are higher than the local ambient boiling point and pressure, respectively.
Figure 4.
Outer microstructure of the encapsulated powder prepared with the optimal infeed solution formulation, 35% (w/w) maltodextrin and gum arabic (MD/GA, 1:1) with a ratio of aqueous bitter melon extract to MD:GA of 1.5:1 g/g at magnifications of (a) ×5000 and (b) ×10,000.
Figure 4.
Outer microstructure of the encapsulated powder prepared with the optimal infeed solution formulation, 35% (w/w) maltodextrin and gum arabic (MD/GA, 1:1) with a ratio of aqueous bitter melon extract to MD:GA of 1.5:1 g/g at magnifications of (a) ×5000 and (b) ×10,000.
When the drying temperature is high, a large number of the powdered particles tend to have smooth surfaces because the moisture evaporates rapidly from the surface and the skin quickly becomes dry and rigid and keeps its smooth surface [
30]. However, when the drying temperature is relatively low, the particles produced tend to shrink and form wrinkled surfaces [
12]. This occurs because moisture remains in the skin, which remains soft and malleable, and the particles are susceptible to deflation when they cool [
30]. Therefore, optimisation of the spray-drying inlet and outlet temperatures appears to be needed to improve the surface characteristics of the powdered particles produced in the current study. It is desirable to obtain smooth spherical particles to maximize the stability of the powder, especially if it is going to be used as a controlled-release agent [
31].
The moisture content, water activity, colour, bulk density, WSI and WAI of the powder (
Table 6) prepared using the optimal formulation (X
1 = 35%, X
2 = 1.5:1 g/g) were also determined because they are important physical properties for indicating the quality and stability of powders [
13].
Deterioration of powders can occur when the moisture content level and the water activity are above the critical values of 6% and 0.6, respectively, because microbiological growth and degradation-causing chemical reactions can occur under these conditions [
13,
32].
Table 6 shows that the moisture content and the water activity were below their critical values for the aqueous extract bitter melon encapsulated powder and therefore, it was likely to be microbiologically stable during storage. These results were similar to findings for other spray dried powders, including for black mulberry juice [
33], sumac extract [
34] and watermelon [
35]. However, the stability of the bitter melon powder during long term storage conditions is yet to be investigated.
The bulk density of the encapsulated bitter melon powder was 0.5 g/mL (
Table 6), which is similar to that obtained for encapsulated black mulberry juice [
33] and flaxseed oil [
15] prepared using MD/GA. It is desirable for a powder to have a high bulk density as it will require less volume when packaged [
25]. In addition, a powder with a high bulk density usually has less empty space between particles when it is packed and, therefore, less air occupies these spaces, which can help to prevent oxidation and increase the stability of the powder [
36,
37].
Table 6.
The physical properties of the encapsulated powder prepared with the optimal formulation, 35% (w/w) maltodextrin and gum Arabic (MD:GA, 1:1) with a ratio of aqueous bitter melon extract to MD:GA of 1.5:1 g/g.
Table 6.
The physical properties of the encapsulated powder prepared with the optimal formulation, 35% (w/w) maltodextrin and gum Arabic (MD:GA, 1:1) with a ratio of aqueous bitter melon extract to MD:GA of 1.5:1 g/g.
| Physical Properties |
|---|
| Moisture content (%) | 2.82 ± 0.24 |
| Water activity | 0.33 ± 0.01 |
| Colour | Lightness | 92.41 ± 0.51 |
| | Chroma | 7.82 ± 0.19 |
| | Hue | 94.79 ± 0.38 |
| Bulk density (g/mL) | 0.50 ± 0.04 |
| Water solubility index (%) | 93.20 ± 0.36 |
| Water absorption index (%) | 1.63 ± 0.03 |
The results in
Table 6 also show that the water solubility of the encapsulated bitter melon powder was high (
Table 6). The WSI was 93% and was comparable to the WSI for encapsulated powders prepared for red pitaya peel [
38] and acerola pomace extract [
39]. The high solubility of the bitter melon powder may be attributed to the fact that MD and GA have superior water solubility [
35]. In general, a high WSI is important for the utilisation of powders in the food and pharmaceutical industries because they can be incorporated easily and evenly distributed into products [
40].
A low WAI (1.6%) was also obtained for the encapsulated bitter melon extract (
Table 6). This meant that its ability to absorb water was low and less likely to be affected by humidity and, therefore, more stable when stored under such conditions [
41].
Therefore, because of its low moisture content, low water activity, high bulk density, high WSI and low WAI, it can be concluded that the encapsulated aqueous bitter melon extract powder obtained in this study possessed the desirable characteristics of a high quality powder. Nonetheless, further investigation on controlled release properties of the encapsulated bitter melon extract is needed in order to fully understand how the bioactive compounds release when reconstituted with water.
Furthermore, encapsulation of an aqueous bitter melon extract by spray-drying is highly recommended and the resulting products can be added as fortificants in food products as functional foods and/or as therapeutic agents in the pharmaceutical industry. However, further sensory analysis and evaluation of safety and toxicity tests in vivo and human studies are needed prior to commercialisation of the products.


