
Enhancement of Nutritional Substance, Trace Elements, and Pigments in Waxy Maize Grains through Foliar Application of Selenite
 ,
,
Abstract
:1. Introduction
2. Materials and Methods
2.1. Testing Material
2.2. Site Description and Experimental Design
2.3. Sample Collection and Determination
2.4. Determination of Nutritional Quality Content
2.4.1. Determination of Soluble Sugar and Sucrose Content
2.4.2. Determination of Starch Content and Its Components
2.4.3. Determination of Protein Content
2.4.4. Determination of Fat Content
2.4.5. Determination of Vitamin C Content
2.4.6. Determination of Lysine Content
2.5. Determination of Trace Elements
2.6. Determination of Pigment Content
2.6.1. Determination of Anthocyanin Content
2.6.2. Determination of Carotenoid Content
2.7. Statistical Analysis
3. Results
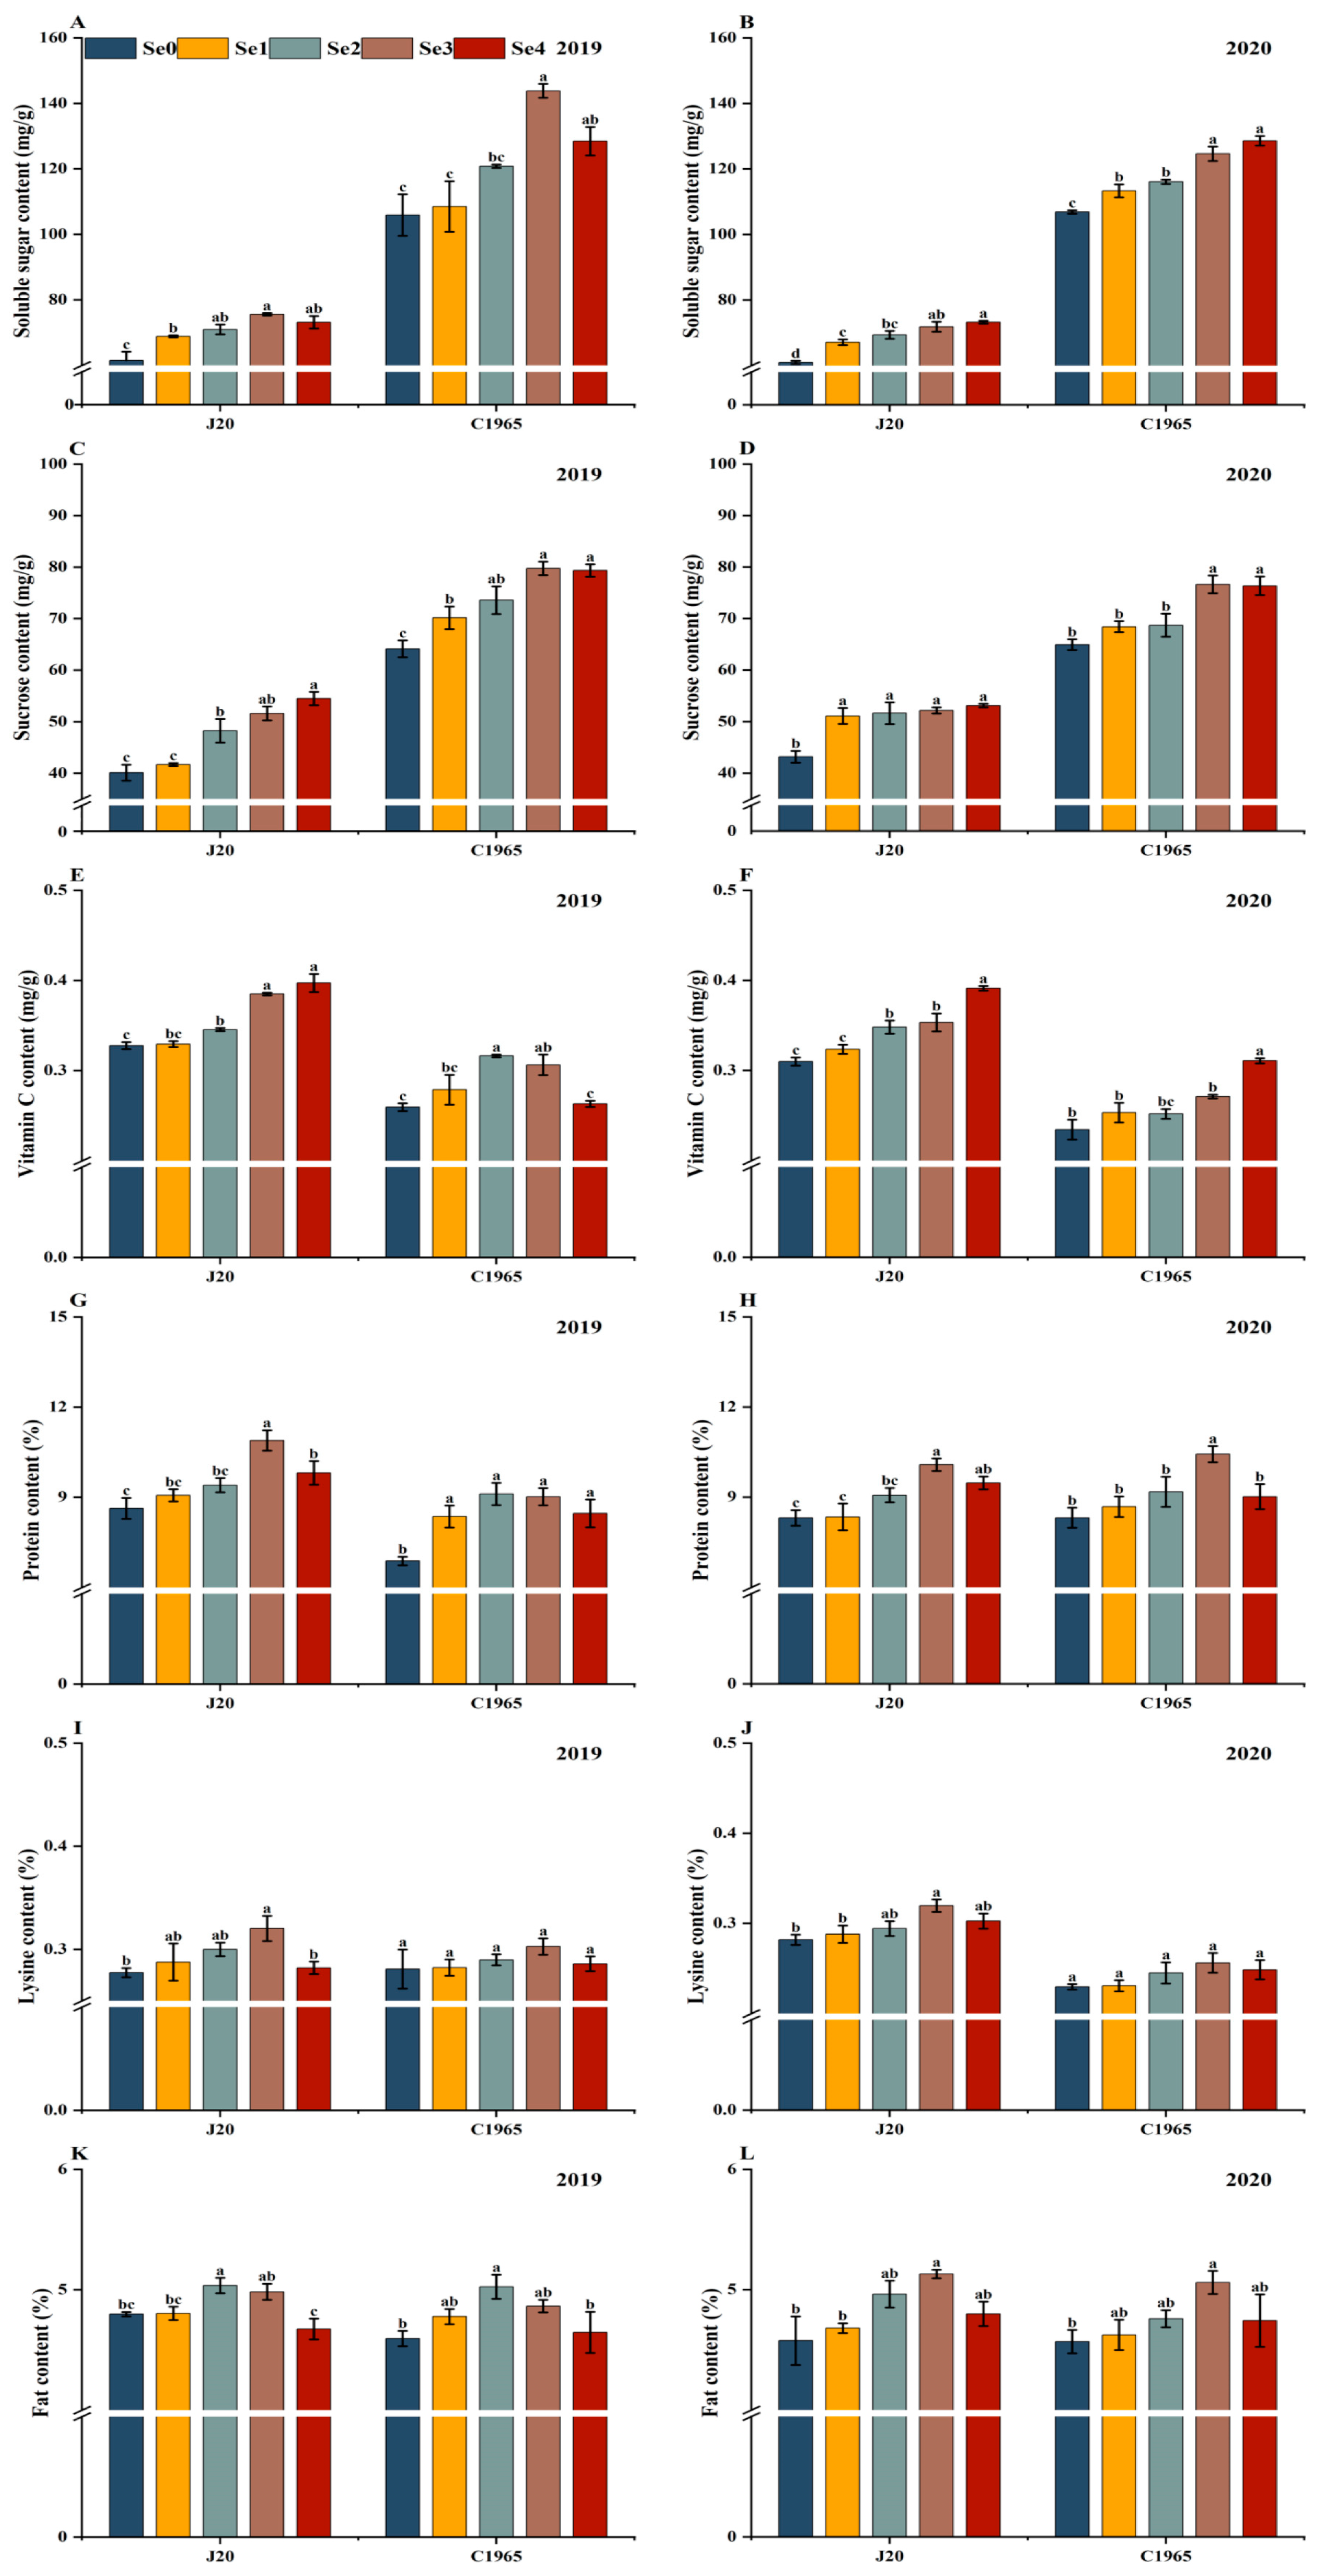
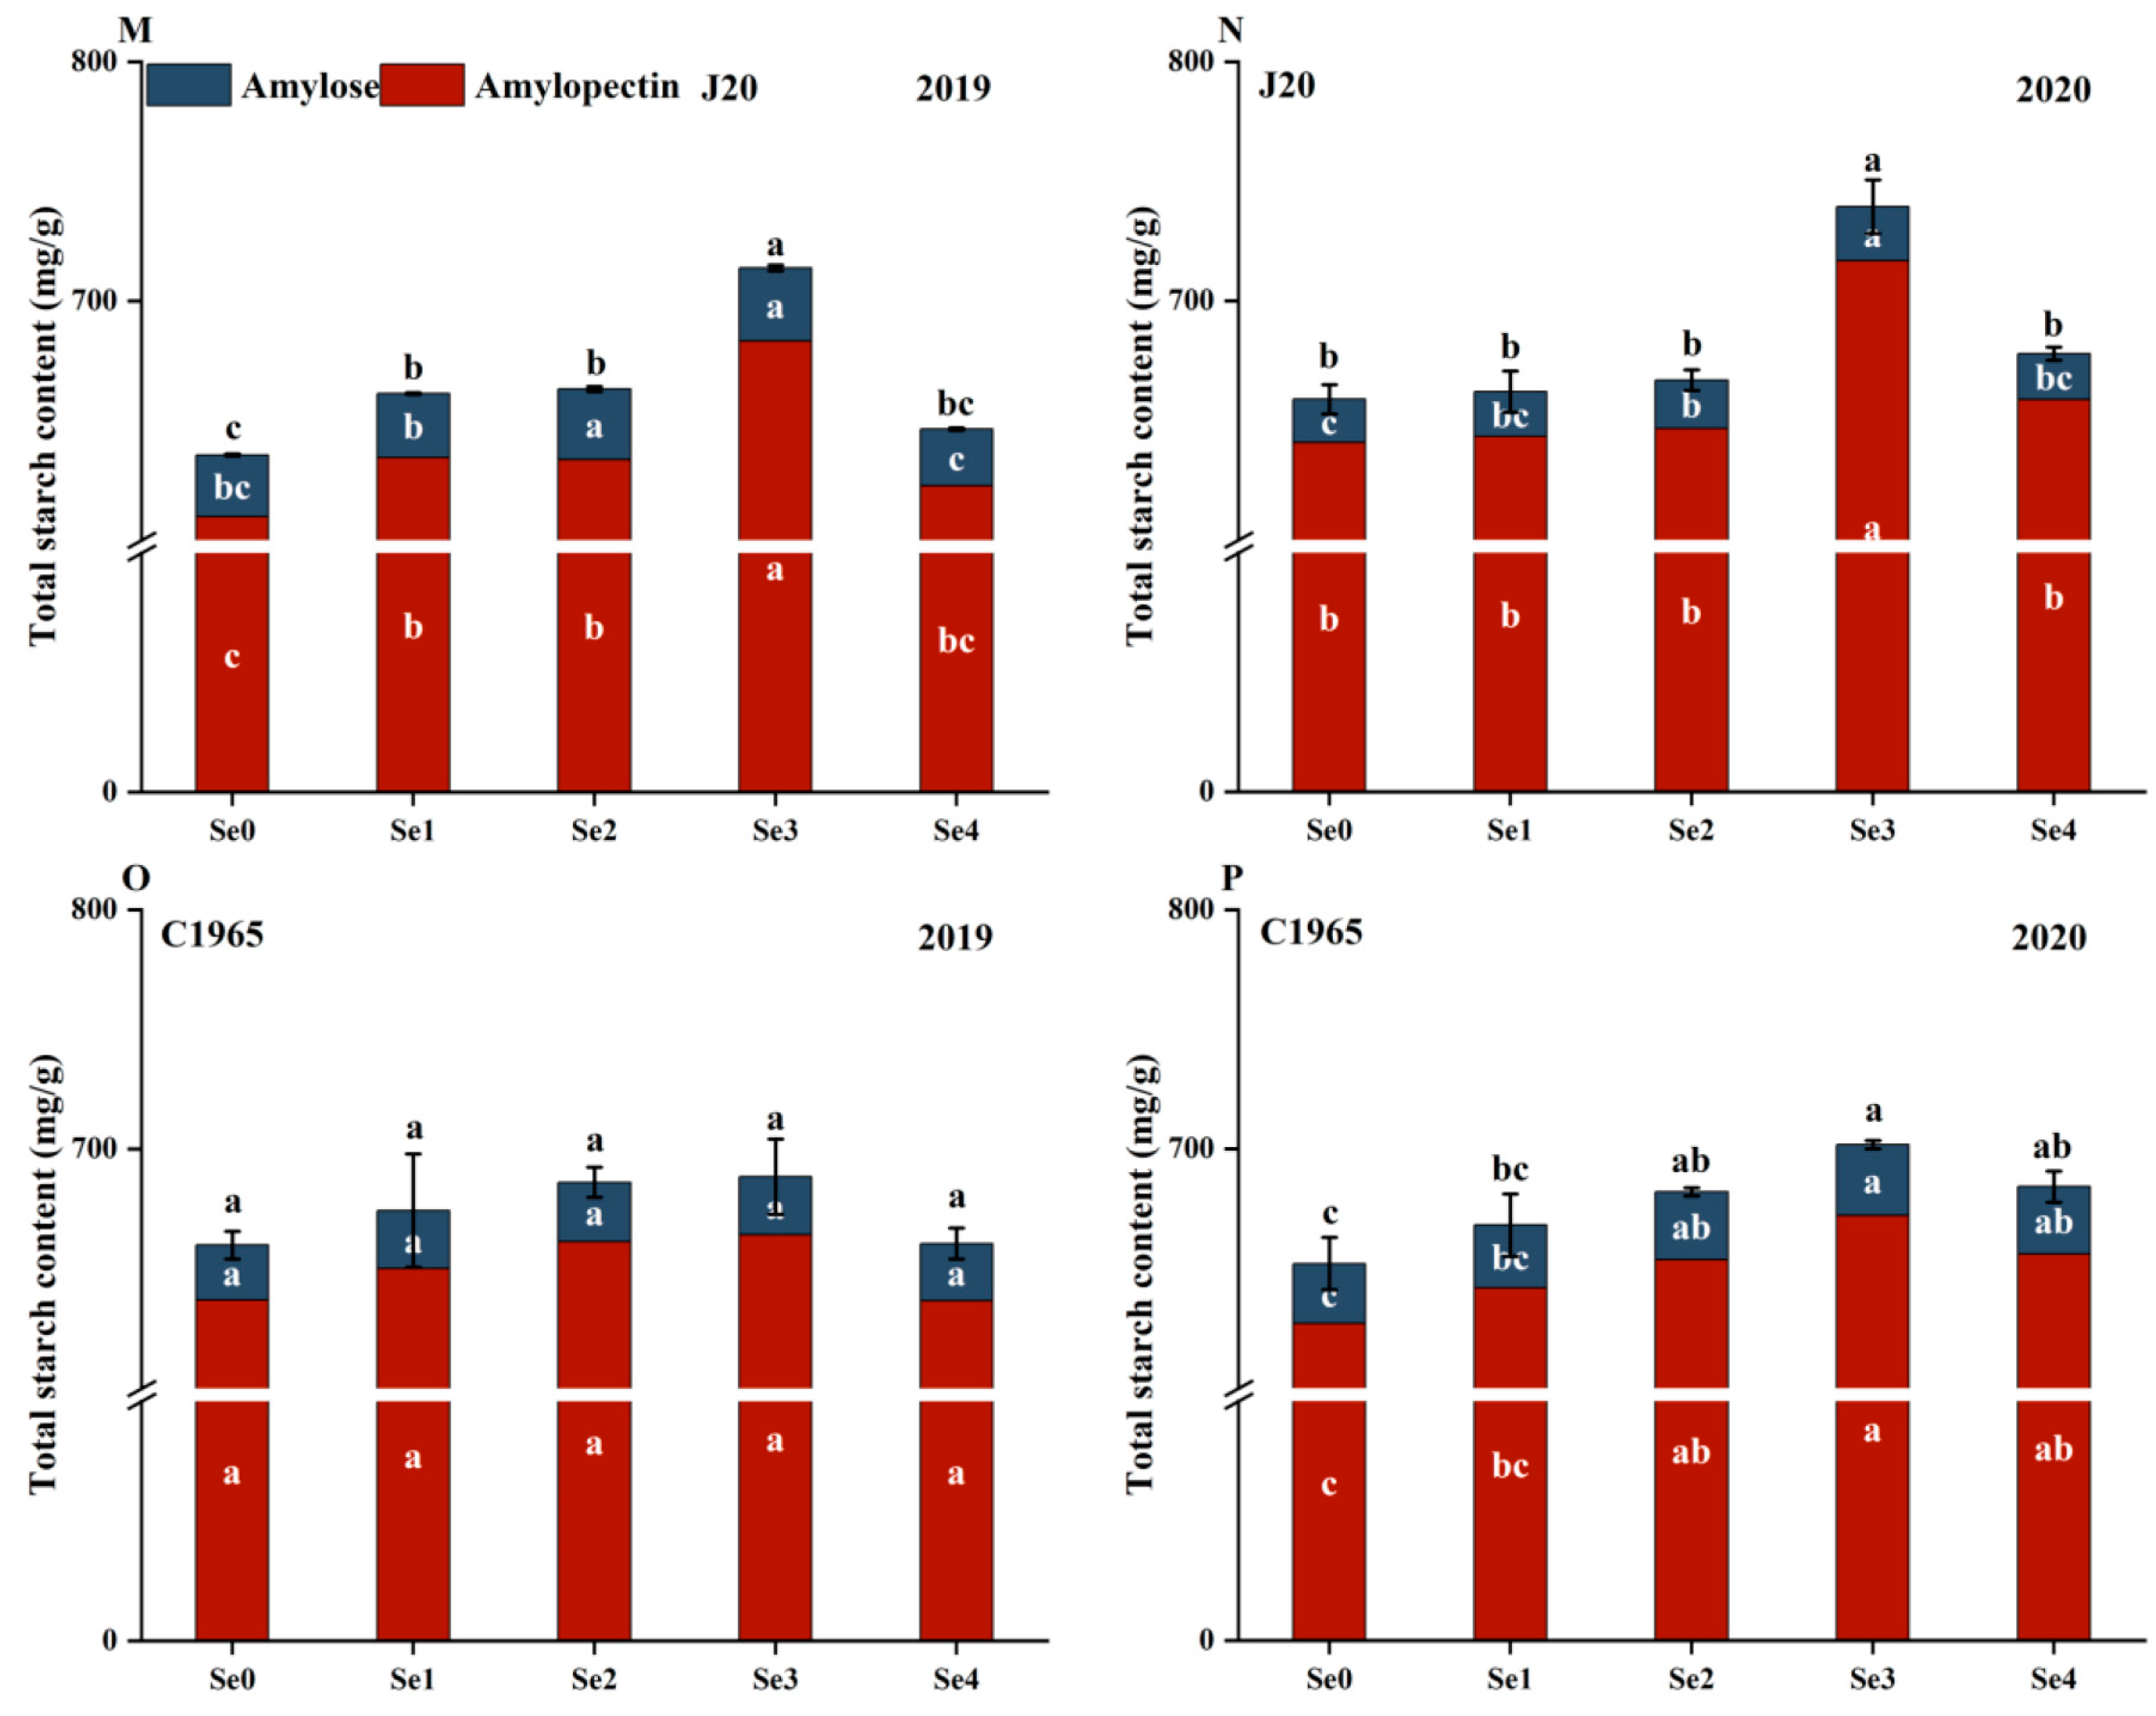
3.1. Nutritional Quality
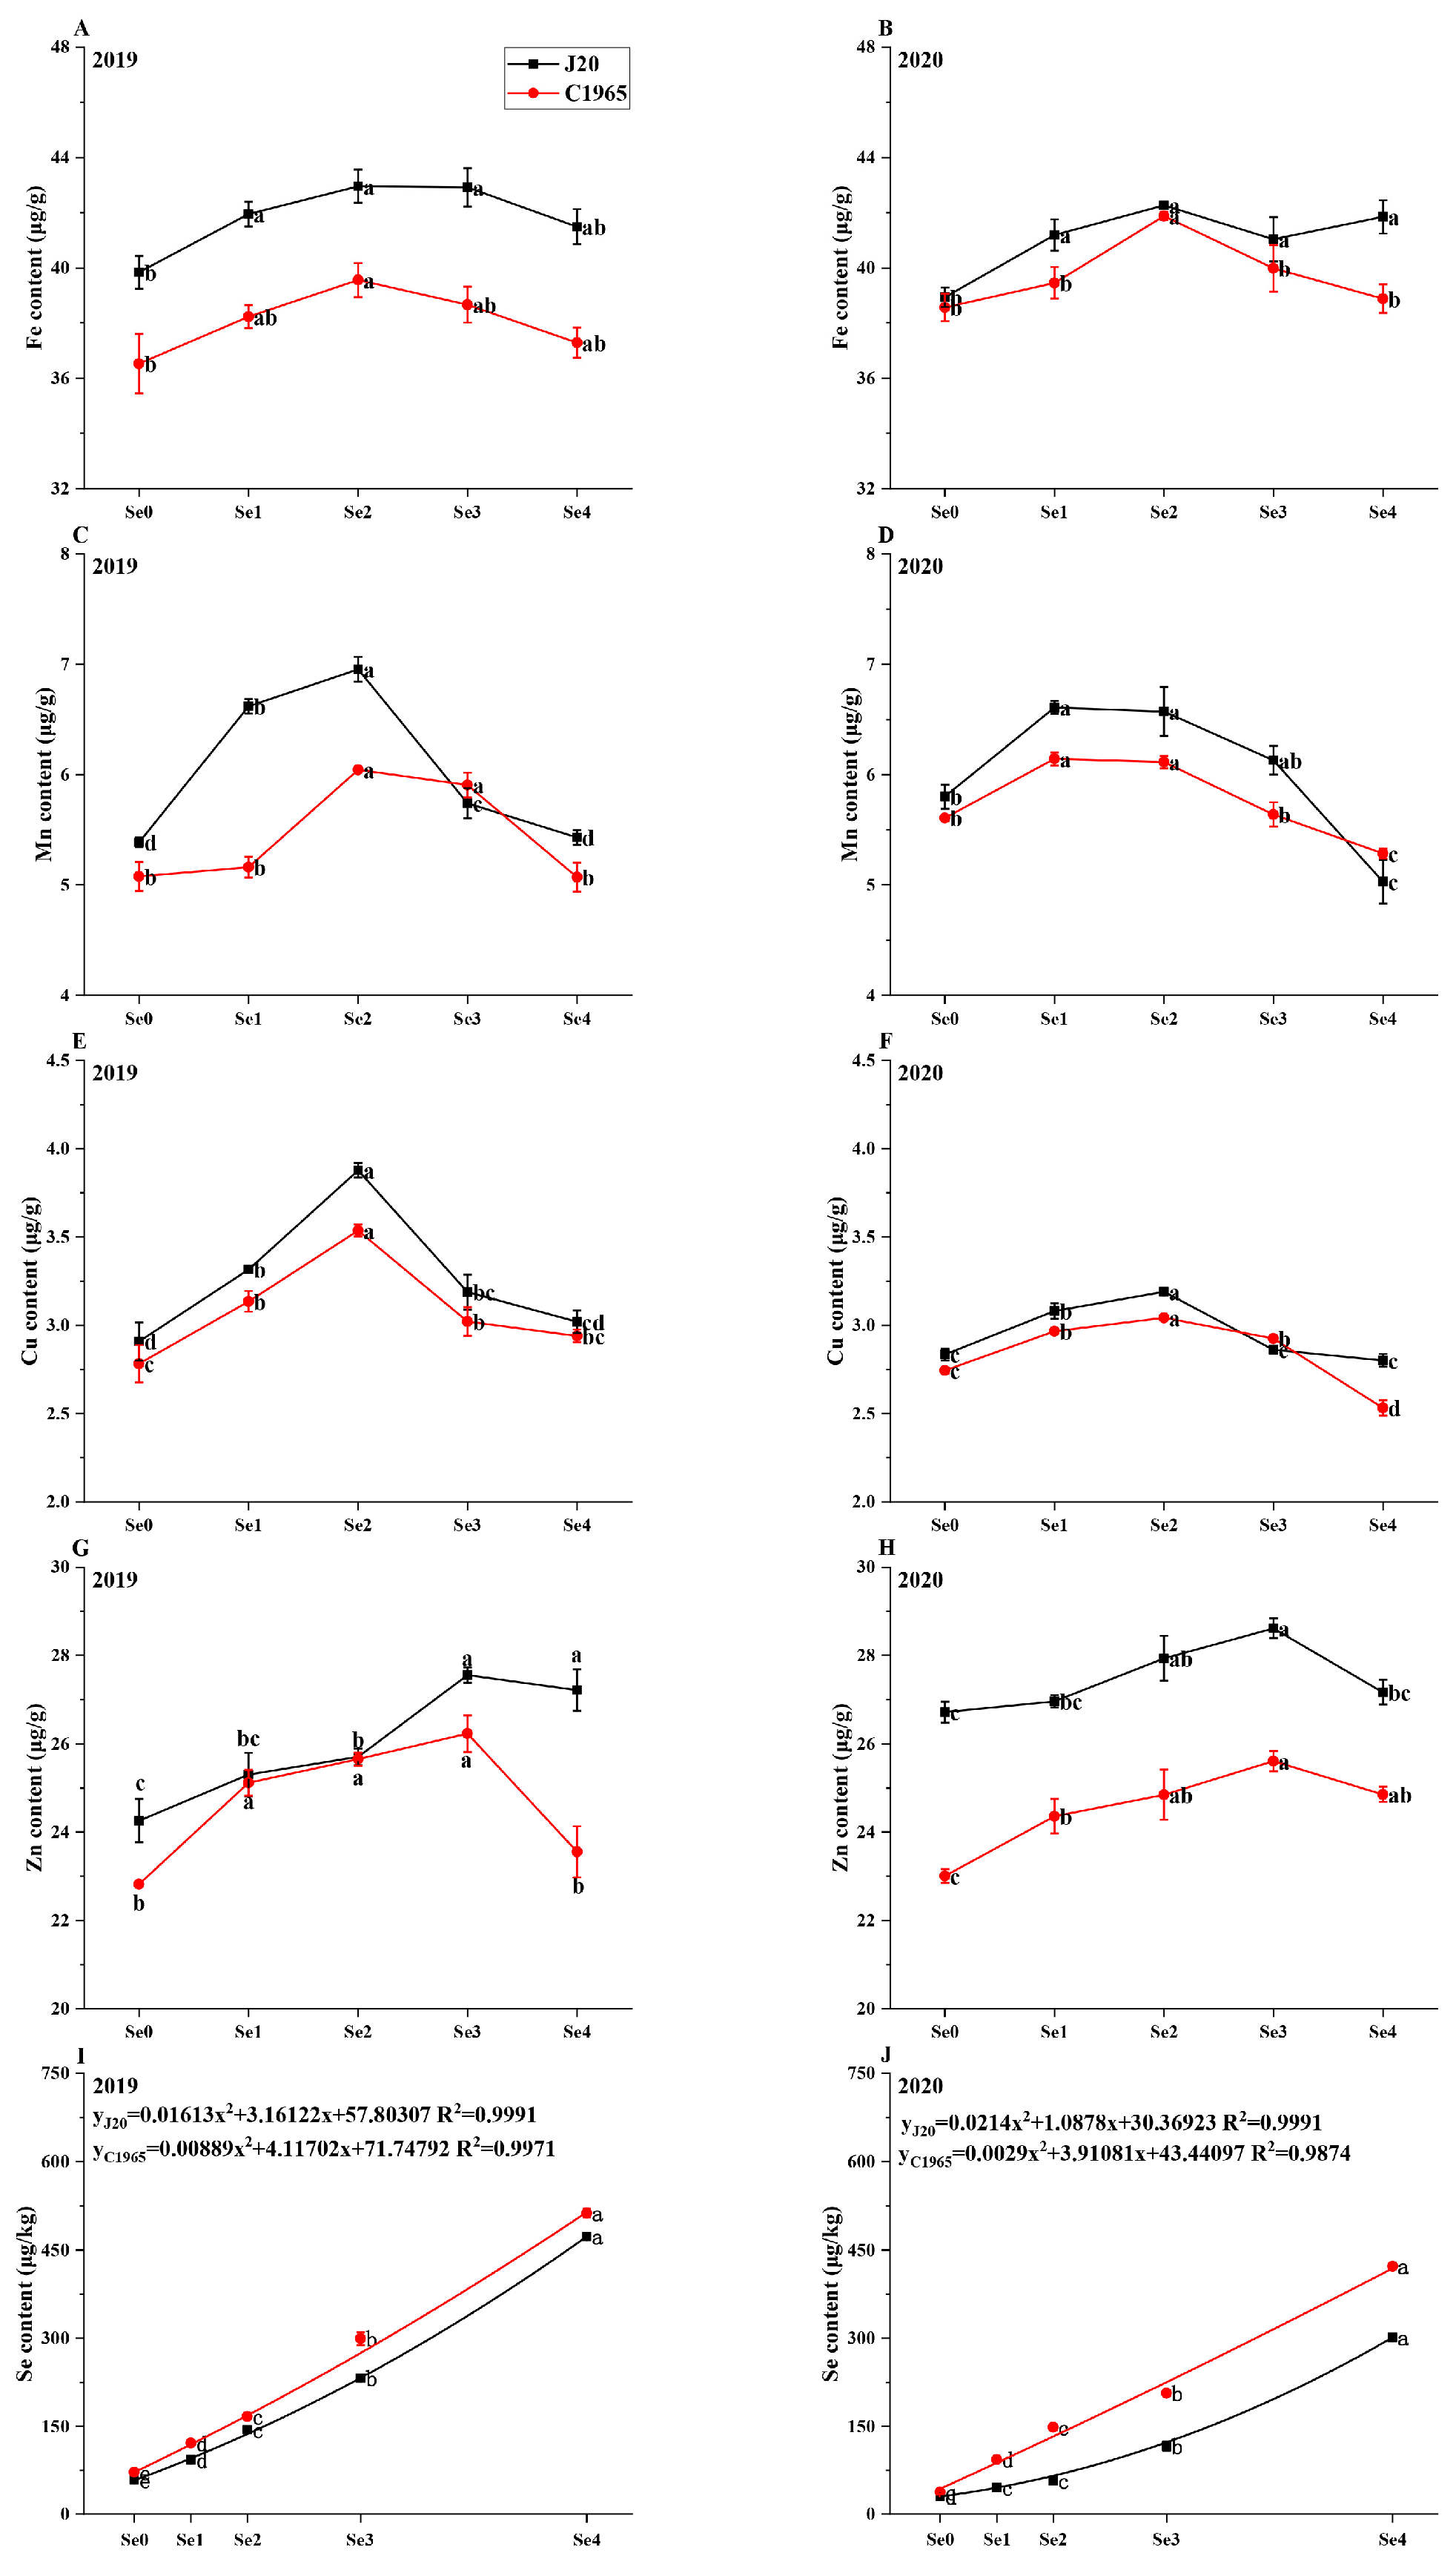
3.2. Trace Elements
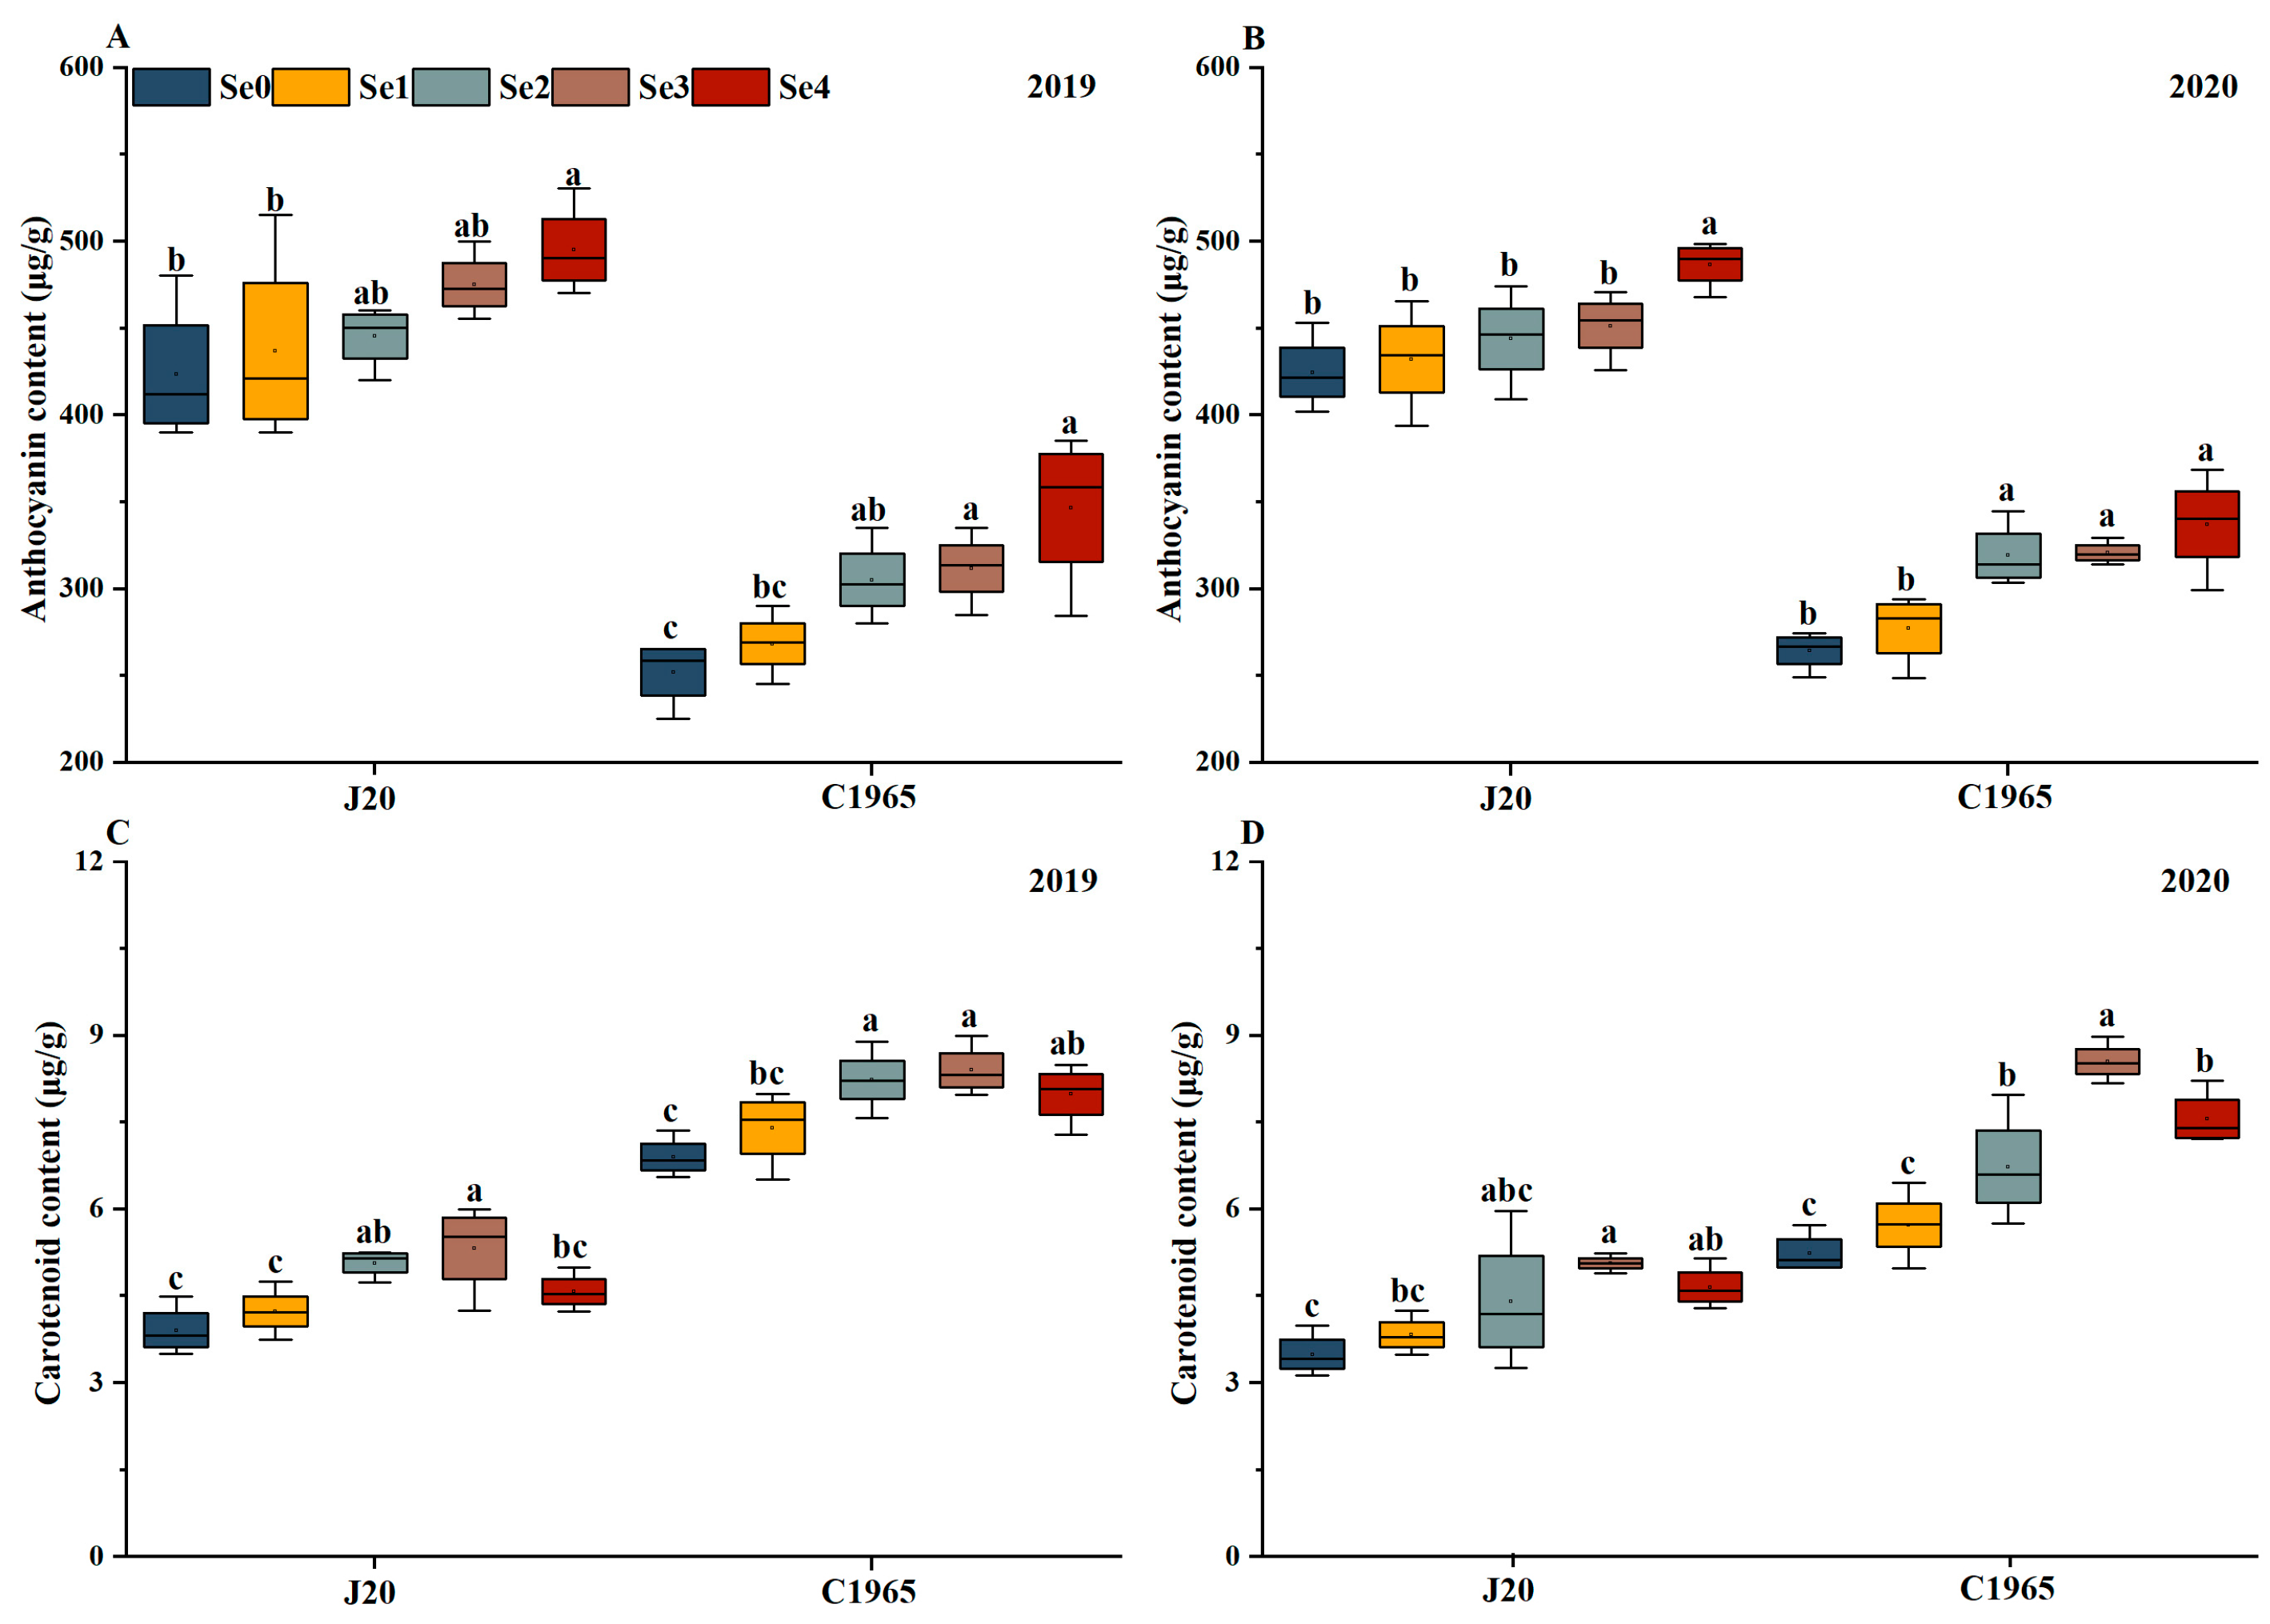
3.3. Pigments
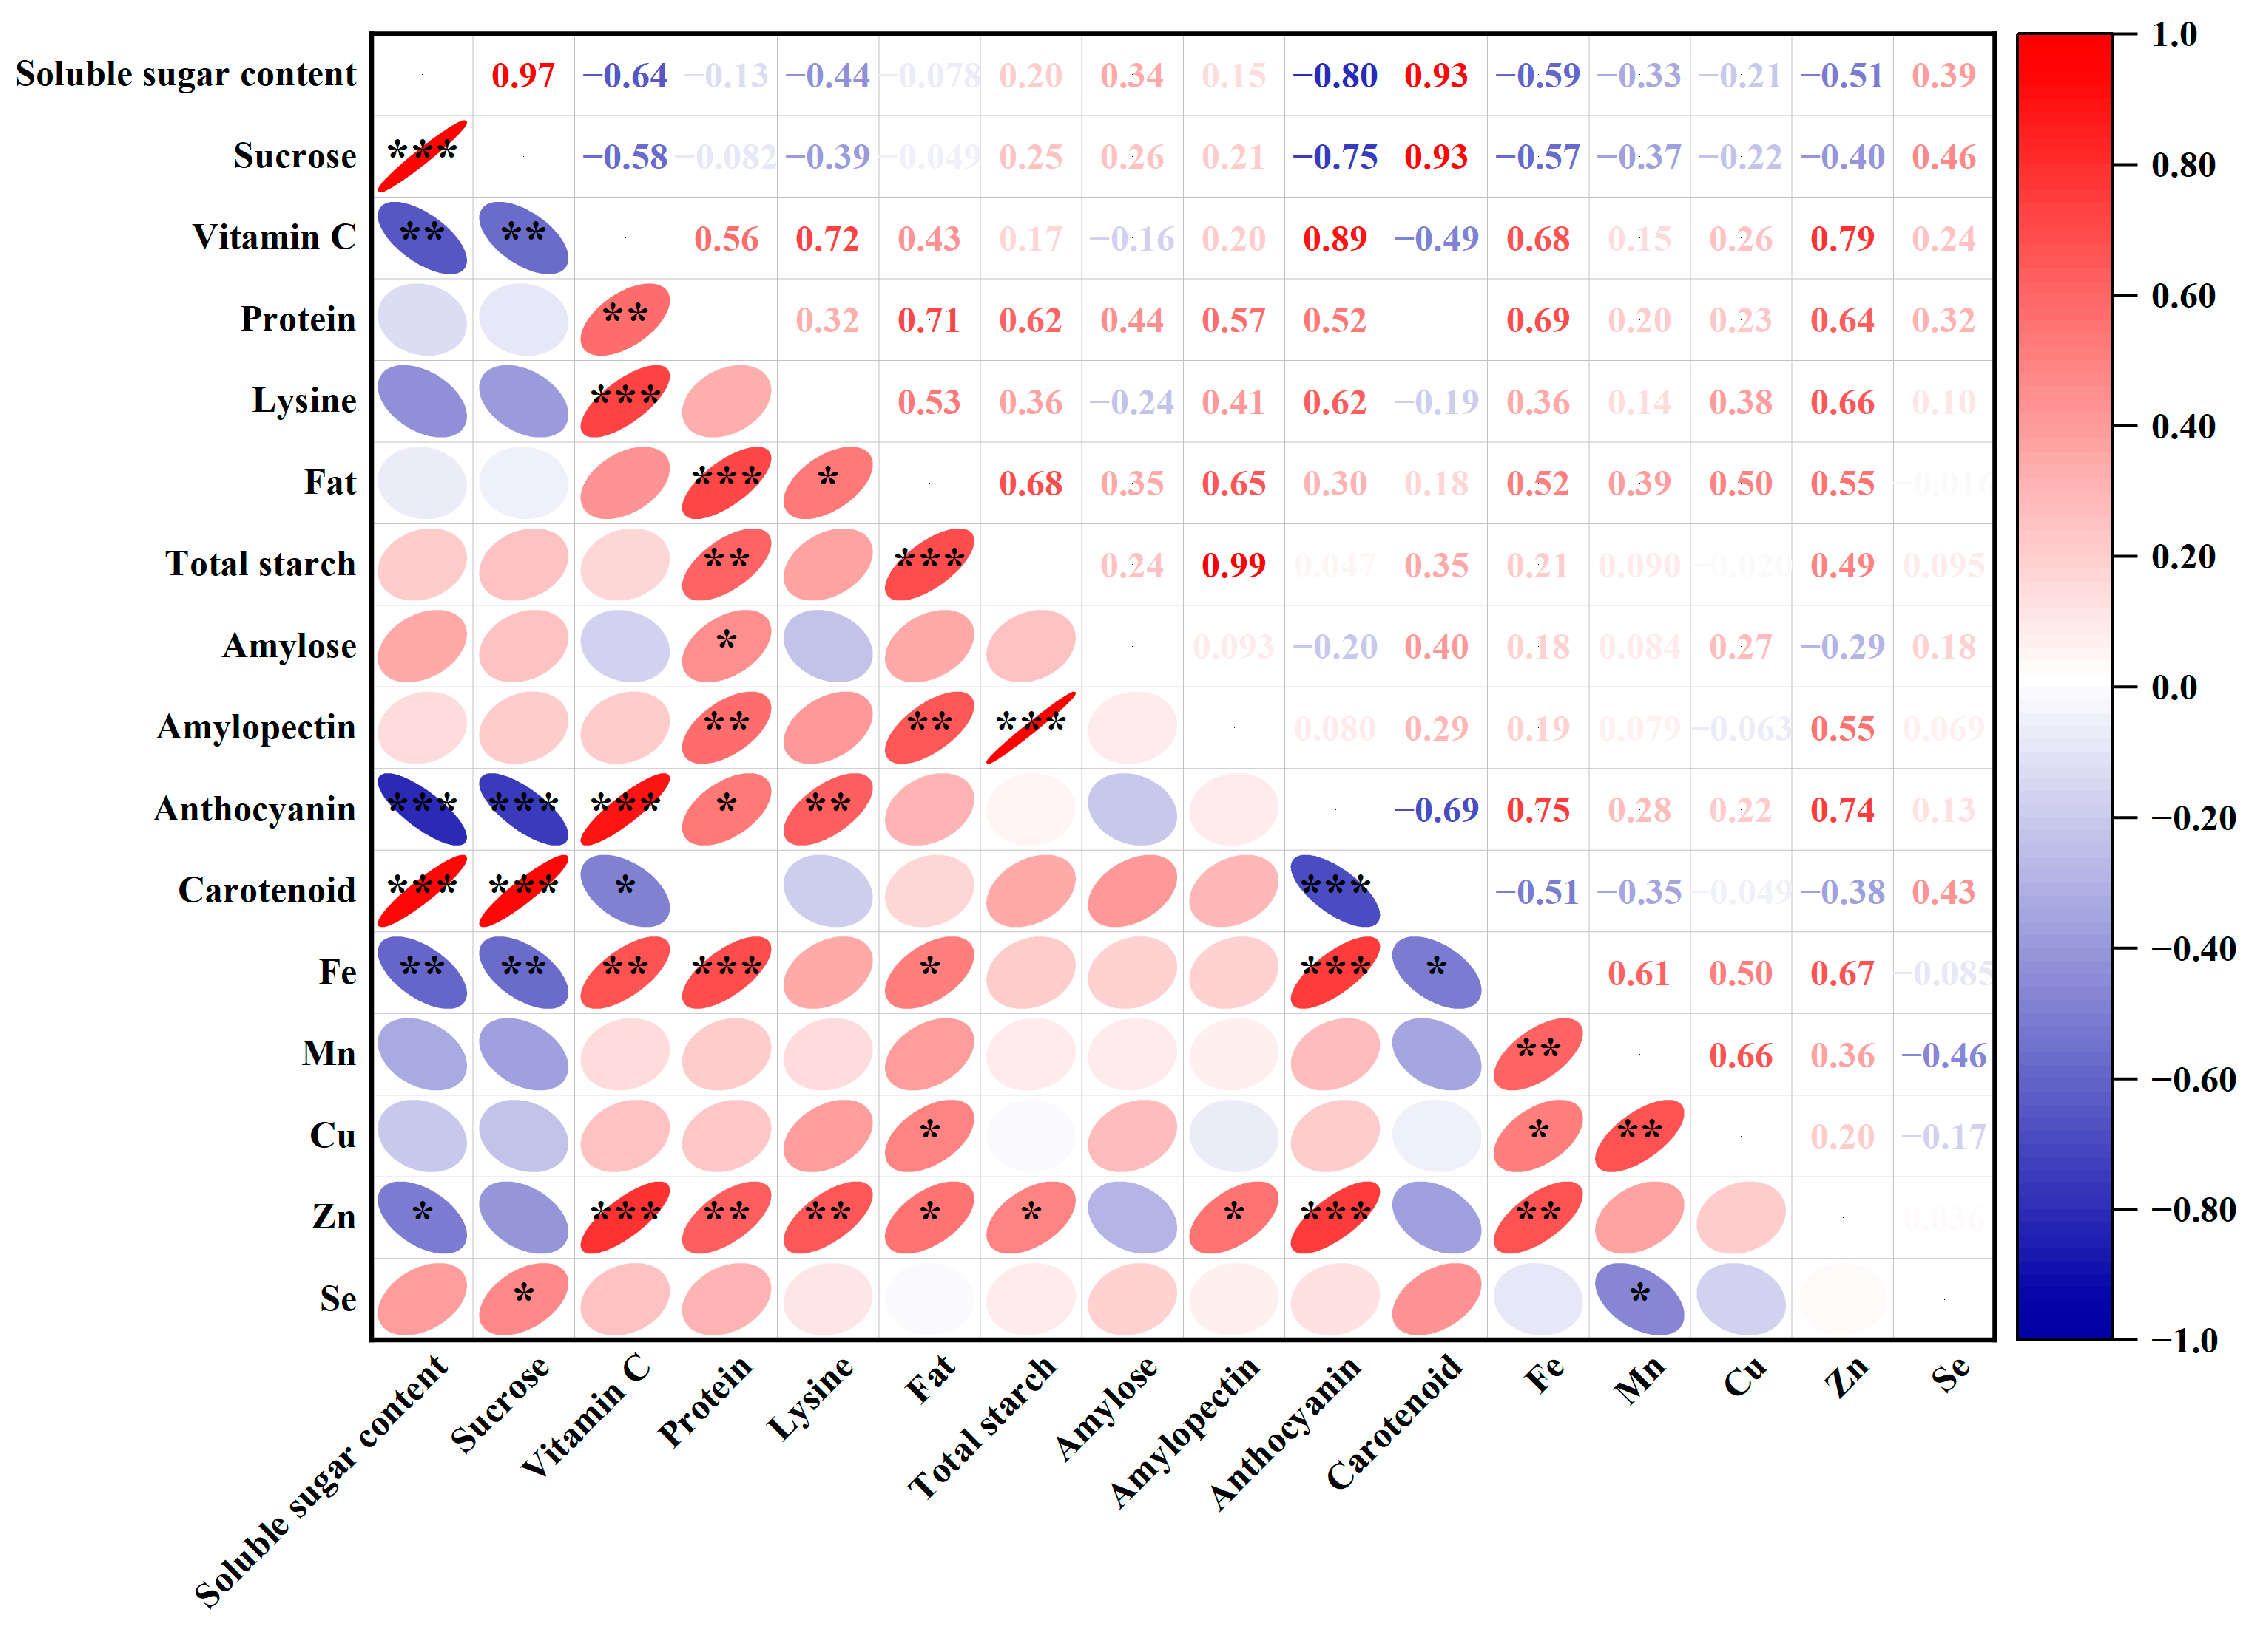
3.4. Correlation Analysis
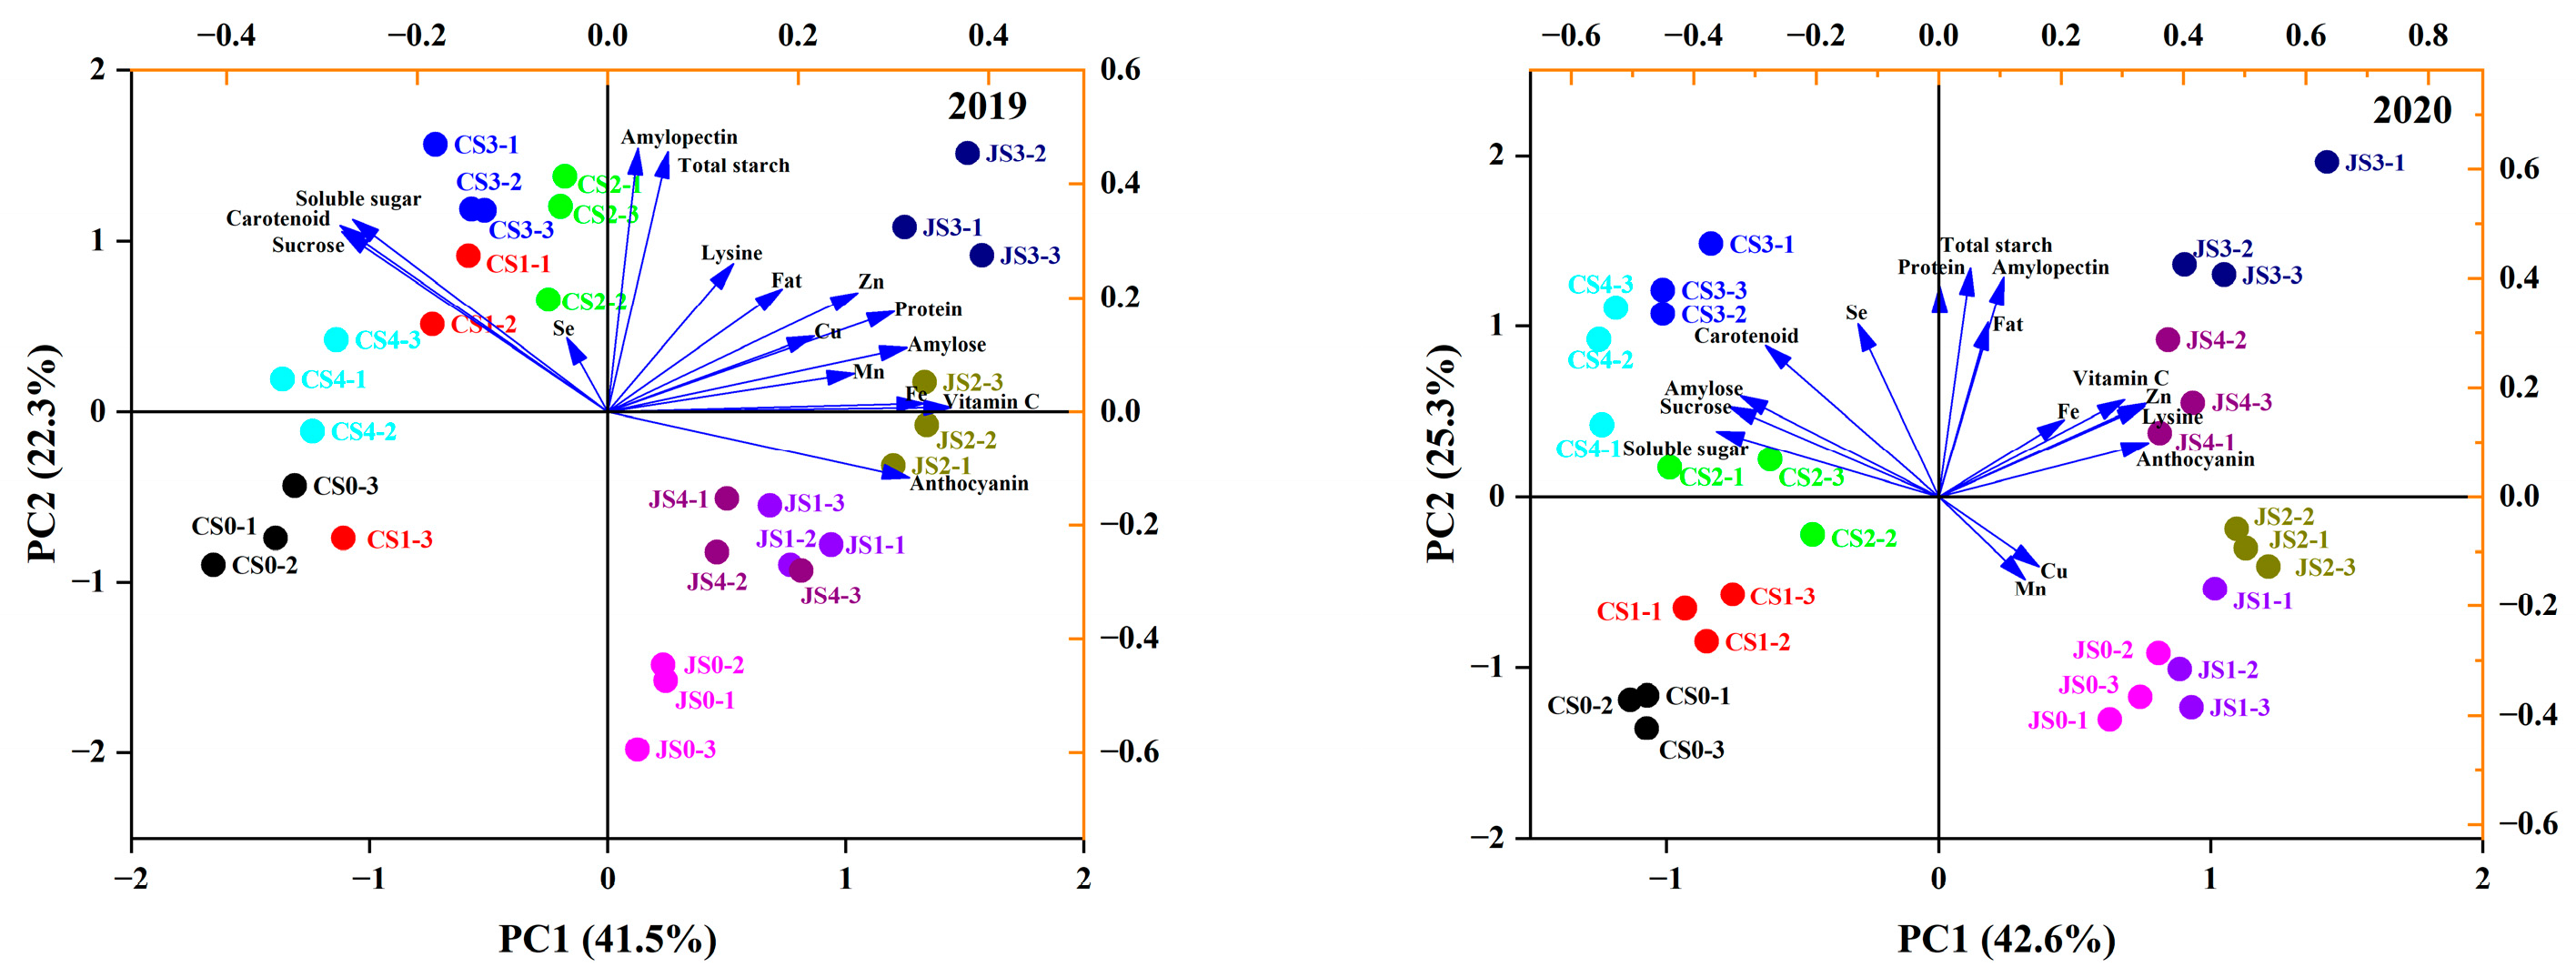
3.5. Principal Component Analysis
4. Discussion
5. Conclusions
Supplementary Materials
Author Contributions
Funding
Institutional Review Board Statement
Informed Consent Statement
Data Availability Statement
Acknowledgments
Conflicts of Interest
References
- Silva, M.A.; Sousa, G.F.D.; Van Opbergen, G.A.Z.; Van Opbergen, G.G.A.Z.; Corguinha, A.P.B.; Bueno, J.M.M.; Brunetto, G.; Leite, J.M.; Santos, A.A.D.; Lospes, G.; et al. Foliar Application of Selenium Associated with a Multi-Nutrient Fertilizer in Soybean: Yield, Grain Quality, and Critical Se Threshold. Plants 2023, 12, 2028. [Google Scholar] [CrossRef] [PubMed]
- Yuan, Z.; Long, W.; Liang, T.; Zhu, M.; Zhu, A.; Luo, X.; Fu, L.; Hu, Z.; Zhu, R.; Wu, X. Effect of foliar spraying of organic and inorganic selenium fertilizers during different growth stages on selenium accumulation and speciation in rice. Plant Soil 2023, 486, 87–101. [Google Scholar] [CrossRef]
- WS/T 578.3-2017; Standardization Administration of the People’s Republic of China. Chinese dietary reference intakes—Part 3: Trace element. Standard Press: Beijing, China, 2017.
- Di, X.; Qin, X.; Zhao, L.; Liang, X.; Xu, Y.; Sun, Y.; Huang, Q. Selenium distribution, translocation and speciation in wheat (Triticum aestivum L.) after foliar spraying selenite and selenate. Food Chem. 2023, 400, 134077. [Google Scholar] [CrossRef] [PubMed]
- Hao, S.; Liu, P.; Qin, J.; Song, L.; Yang, W.; Feng, M.; Zhang, M.; Wang, C.; Song, X. Effects of Applying Different Doses of Selenite to Soil and Foliar at Different Growth Stage on Selenium Content and Yield of Different Oat Varieties. Plants 2022, 11, 1810. [Google Scholar] [CrossRef]
- Dumont, E.; Vanhaecke, F.; Cornelis, R. Selenium speciation from food source to metabolites: A critical review. Anal. Bioanal. Chem. 2006, 385, 1304–1323. [Google Scholar] [CrossRef]
- Ros, G.H.; Van Rotterdam, A.M.D.; Bussink, D.W.; Bindraban, P.S. Selenium fertilization strategies for bio-fortification of food: An agro-ecosystem approach. Plant Soil 2016, 404, 99–112. [Google Scholar] [CrossRef]
- Zhang, H.Q.; Zhao, Z.Q.; Zhang, X.; Zhang, W.; Huang, L.Q.; Zhang, Z.Z.; Yuan, L.X.; Liu, X.W. Effects of foliar application of selenate and selenite at different growth stages on selenium accumulation and speciation in potato (Solanum tuberosum L.). Food Chem. 2019, 286, 550–556. [Google Scholar] [CrossRef] [PubMed]
- Li, M.F.; Zhao, Z.Q.; Zhou, J.J.; Zhou, D.W.; Chen, B.N.; Huang, L.Q.; Zhang, Z.H.; Liu, X.W. Effects of a foliar spray of selenite or selenate at different growth stages on selenium distribution and quality of blueberries. J. Sci. Food Agric. 2018, 98, 4700–4706. [Google Scholar] [CrossRef] [PubMed]
- Keskinen, R.; Räty, M.; Yli-Halla, M. Selenium fractions in selenate-fertilized field soils of Finland. Nutr. Cycl. Agroecosyst. 2011, 91, 17–29. [Google Scholar] [CrossRef]
- K’apolna, E.; Hillestrøm, P.R.; Laursen, K.H.; Husted, S.; Larsen, E.H. Effect of foliar application of selenium on its uptake and speciation in carrot. Food Chem. 2009, 115, 1357–1363. [Google Scholar] [CrossRef]
- Yang, H.; Yang, X.F.; Ning, Z.P.; Kwon, S.Y.; Li, M.L.; Tack, F.M.G.; Kwon, E.E.; Rinklebe, J.; Yin, Y.R.S. The beneficial and hazardous effects of selenium on the health of the soil-plant-human system: An overview. J. Hazard. Mater. 2022, 422, 126876. [Google Scholar] [CrossRef]
- Li, X.J.; Sun, J.J.; Li, W.S.; Gong, Z.Q.; Jia, C.Y.; Li, P. Effect of foliar application of the selenium-rich nutrient solution on the selenium accumulation in grains of Foxtail millet (Zhangzagu 10). Environ. Sci. Pollut. Res. 2022, 29, 5569–5576. [Google Scholar] [CrossRef] [PubMed]
- Wang, M.; Ali, F.; Qi, M.X.; Peng, Q.; Wang, M.K.; Bañuelos, G.S.; Miao, S.Y.; Zhe, L.; Dinh, Q.T.; Liang, D.L. Insights into uptake, accumulation, and subcellular distribution of selenium among eight wheat (Triticum aestivum L.) cultivars supplied with selenite and selenate. Ecotoxicol. Environ. Saf. 2021, 207, 111544. [Google Scholar] [CrossRef] [PubMed]
- Farooq, M.U.; Tang, Z.C.; Zeng, R.; Liang, Y.K.; Zhang, Y.J.; Zheng, T.D.; Ei, H.H.; Ye, X.Y.; Jia, X.M.; Zhu, J. Accumulation, mobilization, and transformation of selenium in rice grain provided with foliar sodium selenite. J. Sci. Food Agric. 2019, 99, 2892–2900. [Google Scholar] [CrossRef] [PubMed]
- Wang, Y.; Zhu, Q.; Wang, Z.W.; Wang, J.P.; Wang, Z.; Yu, F.Y.; Zhang, L.H. Effects of foliar application of amino acid-chelated selenite on photosynthetic characteristics of peanut (Arachis hypogaea L.) leaves at the podding stage. Plant Soil Environ. 2024, 70, 17–25. [Google Scholar] [CrossRef]
- Cipriano, P.E.; da Silva, R.F.; de Lima, F.R.D.; de Oliveira, C.; de Lima, A.B.; Celante, G.; Dos Santos, A.A.; Archilha, M.V.L.R.; Pinatto-Botelho, M.F.; Faquin, V.; et al. Selenium biofortification via soil and its effect on plant metabolism and mineral content of sorghum plants. J. Food Compos. Anal. 2022, 109, 104505. [Google Scholar] [CrossRef]
- Ning, N.; Yuan, X.Y.; Dong, S.Q.; Wen, Y.Y.; Gao, Z.P.; Guo, M.J.; Guo, P.Y. Increasing selenium and yellow pigment concentrations in foxtail millet (Setaria italica L.) grain with foliar application of selenite. Biol. Trace Elem. Res. 2016, 170, 245–252. [Google Scholar] [CrossRef] [PubMed]
- Keliszek, M.; Błazejak, S.; Bzducha-Wrobel, A.; Kot, A.M. Effect of Selenium on Lipid and Amino Acid Metabolism in Yeast Cells. Biol. Trace Elem. Res. 2019, 187, 316–327. [Google Scholar] [CrossRef]
- Liang, K.; Liang, S.; Zhu, H. Comparative proteomics analysis of the effect of selenium treatment on the quality of foxtail millet. LWT 2020, 131, 109691. [Google Scholar] [CrossRef]
- Li, J.H.; Yang, W.P.; Guo, A.N.; Qi, Z.W.; Chen, J.; Huang, T.M.; Yang, Z.P.; Gao, Z.Q.; Sun, M.; Wang, J.W. Combined foliar and soil selenium fertilizer increased the grain yield, quality, total Se, and organic Se content in naked oats. J. Cereal Sci. 2021, 100, 103265. [Google Scholar] [CrossRef]
- Luo, H.W.; He, L.X.; Du, B.; Pan, S.G.; Mo, Z.W.; Duan, M.Y.; Tian, H.; Tang, X.R. Biofortification with chelating selenium in fragrant rice: Effects on photosynthetic rates, aroma, grain quality and yield formation. Field Crops Res. 2020, 255, 107909. [Google Scholar] [CrossRef]
- Radawiec, A.; Rutkowska, B.; Tidaback, J.A.; Gozdowski, D.; Knapowski, T.; Szulc, W. The impact of selenium fertilization on the quality characteristics of spring wheat grain. Agronomy 2021, 11, 2100. [Google Scholar] [CrossRef]
- Zhu, Z.; Zhang, Y.B.; Liu, J.; Chen, Y.L.; Zhang, X.J. Exploring the effects of selenium treatment on the nutritional quality of tomato fruit. Food Chem. 2018, 252, 9–15. [Google Scholar] [CrossRef] [PubMed]
- Zhu, Z.; Chen, Y.L.; Shi, G.Q.; Zhang, X.J. Selenium delays tomato fruit ripening by inhibiting ethylene biosynthesis and enhancing the antioxidant defense system. Food Chem. 2017, 219, 179–184. [Google Scholar] [CrossRef] [PubMed]
- Gupta, M.; Gupta, S. An overview of selenium uptake, metabolism, and toxicity in plants. Front. Plant Sci. 2007, 7, 234638. [Google Scholar] [CrossRef] [PubMed]
- Silva, M.A.; de Sousa, G.F.; Bañuelos, G.; Amaral, D.; Brown, P.H.; Guilherme, L.R.G. Selenium speciation in se-enriched soybean grains from biofortified plants grown under different methods of selenium application. Foods 2023, 12, 1214. [Google Scholar] [CrossRef] [PubMed]
- Gui, J.Y.; Rao, S.; Huang, X.R.; Liu, X.M.; Cheng, S.Y.; Xu, F. Interaction between selenium and essential micronutrient elements in plants: A systematic review. Sci. Total Environ. 2022, 853, 158673. [Google Scholar] [CrossRef] [PubMed]
- Liu, Y.X.; Huang, S.H.; Jiang, Z.H.; Wang, Y.Z.; Zhang, Z.M. Selenium biofortification modulates plant growth, microelement and heavy metal concentrations, selenium uptake, and accumulation in black-grained wheat. Front. Plant Sci. 2021, 12, 748523. [Google Scholar] [CrossRef] [PubMed]
- Yao, X.Q.; Chu, J.Z.; He, X.L.; Liu, B.B.; Li, J.M.; Yur, Z.W. Effects of selenium on agronomical characters of winter wheat exposed to enhanced ultraviolet-B. Ecotoxicol. Environ. Saf. 2013, 92, 320–326. [Google Scholar] [CrossRef]
- Skalnaya, M.G.; Tinkov, A.A.; Prakash, N.T.; Ajsuvakova, O.P.; Jaiswal, S.K.; Prakash, R.; Grabeklis, A.R.; Kirichuk, A.A.; Zhuchenko, N.A.; Regula, J.; et al. Selenium and other elements in wheat (Triticum aestivum) and wheat bread from a seleniferous area. Biol. Trace Elem. Res. 2019, 192, 10–17. [Google Scholar] [CrossRef]
- Xue, M.Y.; Wang, D.; Zhou, F.; Du, Z.K.; Zhai, H.; Wang, M.K.; Dinh, Q.T.; Tran, T.A.T.; Li, H.N.; Yan, Y.; et al. Effects of selenium combined with zinc amendment on zinc fractions and bioavailability in calcareous soil. Ecotoxicol. Environ. Saf. 2020, 190, 110082. [Google Scholar] [CrossRef] [PubMed]
- Alves, L.R.; Prado, E.R.; de Oliveira, R.; Santos, E.F.; de Souza, I.L.; Dos Reis, A.R.; Azevedo, R.A.; Gratão, P.L. Mechanisms of cadmium-stress avoidance by selenium in tomato plants. Ecotoxicology 2020, 29, 594–606. [Google Scholar] [CrossRef]
- Rios, J.J.; Blasco, B.; Leyva, R.; Sanchez-Rodriguez, E.; Rubio-Wilhelmi, M.M.; Romero, L.; Ruiz, J.M. Nutritional balance changes in lettuce plant grown under different doses and forms of selenium. J. Plant Nutr. 2013, 36, 1344–1354. [Google Scholar] [CrossRef]
- do Nascimento da Silva, E.; Cadore, S. Bioavailability assessment of copper, iron, manganese, molybdenum, selenium, and zinc from selenium-enriched lettuce. J. Food Sci. 2019, 84, 2840–2846. [Google Scholar] [CrossRef] [PubMed]
- Feng, R.W.; Wei, C.Y.; Tu, S.X.; Wu, F.C. Effects of Se on the uptake of essential elements in Pteris vittata L. Plant Soil 2009, 325, 123–132. [Google Scholar] [CrossRef]
- Li, J.; Lens, P.N.L.; Otero-Gonzalez, L.; Du Laing, G. Production of selenium-and zinc-enriched Lemna and Azolla as potential micronutrient-enriched bioproducts. Water Res. 2020, 172, 115522. [Google Scholar] [CrossRef] [PubMed]
- Roland, B.; Michael, N.; Thomas, F.; Gabriele, S.; Irmgard, B. Bioavailability and Biokinetics of Anthocyanins From Red Grape Juice and Red Wine. J. Biomed. Biotechnol. 2004, 2004, 293–298. [Google Scholar] [CrossRef] [PubMed]
- Pascual-Teresa, S.D.; Sanchez-Ballesta, M.T. Anthocyanins: From plant to health. Phytochem. Rev. 2008, 7, 281–299. [Google Scholar] [CrossRef]
- Xia, Q.; Shui, Y.; Zhi, H.; Ali, A.; Yang, Z.P.; Gao, Z.Q. Exogeneous selenium enhances anthocyanin synthesis during grain development of colored-grain wheat. Plant Physiol. Biochem. 2023, 200, 107742. [Google Scholar] [CrossRef]
- Dong, J.Z.; Wang, Y.; Wang, S.H.; Yin, L.P.; Xu, G.J.; Zheng, C.; Lei, C.; Zhang, M.Z. Selenium increases chlorogenic acid, chlorophyll and carotenoids of Lycium chinense leaves. J. Sci. Food Agric. 2012, 93, 310–315. [Google Scholar] [CrossRef]
- Hossain, F.; Zunjare, R.U.; Muthusamy, V.; Bhat, J.S.; Mehta, B.K.; Sharma, D.; Talukder, Z.A.; Chhabra, R.; Katral, A.; Dutta, S.; et al. Biofortification of Maize for Nutritional Security. Biofortification of Staple Crops; Springer: Singapore, 2022; pp. 147–174. [Google Scholar] [CrossRef]
- Singh, N.; Inouchi, N.; Nishinari, K. Structural, thermal and viscoelastic characteristics of starches separated from normal, sugary and waxy maize. Food Hydrocoll. 2006, 20, 923–935. [Google Scholar] [CrossRef]
- Huang, B.; Zhao, G.; Zou, X.; Cheng, X.X.; Li, S.N.; Yang, L.P. Feasibility of replacing waxy rice with waxy or sweet-waxy corn viewed from the structure and physicochemical properties of starches. Food. Res. Int. 2024, 182, 114178. [Google Scholar] [CrossRef] [PubMed]
- Hu, X.D.; Liu, J.H.; Shan, Q.J.; Bai, S.; Li, W.; Wen, T.X.; Guo, X.B.; Hu, J.G. The Accumulation and Biosynthesis of Anthocyanin in Black, White, and Yellow Waxy Corns (Zea mays L. sinensis kulesh) during Kernel Maturation. Foods 2023, 12, 1486. [Google Scholar] [CrossRef]
- Ketthaisong, D.; Suriharn, B.; Tangwongchai, R.; Jane, J.L.; Lertrat, K. Physicochemical and morphological properties of starch from fresh waxy corn kernels. J. Food Sci. Technol. Mysore 2015, 52, 6529–6537. [Google Scholar] [CrossRef]
- Gao, J.F. Experimental Guidance for Plant Physioloy, 1st ed.; Beijing Higher Education: Beijing, China, 2006; pp. 144–204. (In Chinese) [Google Scholar]
- Chen, J.H.; Chen, H.; Wang, H.X.; Zhan, J.Y.; Yuan, X.X.; Cui, J.; Su, N.N. Selenium treatment promotes anthocyanin accumulation in radish sprouts (Raphanus sativus L.) by its regulation of photosynthesis and sucrose transport. Food Res. Int. 2023, 165, 112551. [Google Scholar] [CrossRef]
- Lin, M.J.; Song, J.F.; Li, D.J.; Liu, C.H. Determination of Amylose and Amylopectin Content in Fresh Corn by Dual-wavelength Spectrophotometry. Acta Agric. Jiangxi 2010, 22, 117–119+123. [Google Scholar] [CrossRef]
- Wang, J.S. Research Technology of Agricultural Biochemistry, 1st ed.; China Agriculture Press: Beijing, China, 2001; pp. 188–192. (In Chinese) [Google Scholar]
- GB/T 5009.6-2016; Standardization Administration of the People’s Republic of China. Determination of Fat in Food. Standard Press: Beijing, China, 2016.
- Giusti, M.M.; Wrolstad, R.E. Characterization and measurement of anthocyanins by UV-visible spectroscopy. Curr. Protoc. Food Anal. Chem. 2001, 1, 1–2. [Google Scholar] [CrossRef]
- Handa, N.; Kohli, S.K.; Sharma, A.; Thukral, A.K.; Bhardwaj, R.; Alyemeni, M.N.; Wijaya, L.; Ahmad, P. Selenium ameliorates chromium toxicity through modifications in pigment system, antioxidative capacity, osmotic system, and metal chelators in Brassica juncea seedlings. South Afr. J. Bot. 2018, 119, 1–10. [Google Scholar] [CrossRef]
- Sun, M.J.; Kang, X.R.; Wang, T.T.; Fan, L.R.; Wang, H.; Pan, H.; Yang, Q.G.; Liu, H.M.; Lou, Y.H.; Zhuge, Y.P. Genotypic diversity of quality traits in Chinese foxtail millet (Setaria italica L.) and the establishment of a quality evaluation system. Food Chem. 2021, 353, 129421. [Google Scholar] [CrossRef]
- GHT1135-2017; Standardization Administration of the People’s Republic of China. Selenium-Enriched Agricultural Products. Standard Press: Beijing, China, 2017.
- Zhu, S.M.; Liang, Y.L.; An, X.J.; Kong, F.C.; Gao, D.K.; Yin, H.F. Changes in sugar content and related enzyme activities in table grape (Vitis vinifera L.) in response to foliar selenium fertilizer. J. Sci. Food Agric. 2017, 97, 4094–4102. [Google Scholar] [CrossRef]
- Skrypnik, L.; Novikova, A.; Tokupova, E. Improvement of phenolic compounds, essential oil content and antioxidant properties of sweet basil (Ocimum basilicum L.) depending on type and concentration of selenium application. Plants 2019, 8, 458. [Google Scholar] [CrossRef]
- Islam, M.Z.; Park, B.J.; Kang, H.M.; Lee, Y.T. Influence of selenium biofortification on the bioactive compounds and antioxidant activity of wheat microgreen extract. Food Chem. 2020, 309, 125763. [Google Scholar] [CrossRef]
- Shi, L.J.; Bai, W.B.; Cao, C.L.; Gao, P. Effects of Exogenous Selenium Application on Yield, Grain Selenium Content and Quality in Sorghum. Crops 2020, 3, 191–196. [Google Scholar] [CrossRef]
- Gao, Z.P.; Guo, P.Y.; Yuan, X.Y.; Nin, N.; Guo, M.J.; Gao, H.; Wang, B.Q.; Feng, L.; Dong, S.Q.; Wen, Y.Y. Effects of Foliar Spraying Na2SeO3 during the Grain Filling Stage on Ouality and Seeds Selenium Content of Foxtail Millet. J. Shanxi Agric. Univ. 2015, 35, 157–161. [Google Scholar] [CrossRef]
- Yan, G.X.; Wu, L.; Hou, M.Y.; Jia, S.F.; Jiang, L.A.; Zhang, D.J. Effects of selenium application on wheat yield and grain selenium content: A global meta-analysis. Field Crops Res. 2024, 307, 109266. [Google Scholar] [CrossRef]
- Prom-U-Thai, C.; Rashid, A.; Ram, H.; Zou, C.Q.; Guilherme, L.R.G.; Corguinha, A.P.B.; Guo, S.W.; Kaur, C.; Naeem, A.; Yamuangmorn, S.; et al. Simultaneous biofortification of rice with zinc, iodine, iron and selenium through foliar treatment of a micronutrient cocktail in five countries. Front. Plant Sci. 2020, 11, 589835. [Google Scholar] [CrossRef]
- Cunha, M.L.O.; de Oliveira, L.C.A.; Silva, V.M.; Montanha, G.S.; Dos Reis, A.R.D. Selenium increases photosynthetic capacity, daidzein biosynthesis, nodulation and yield of peanuts plants (Arachis hypogaea L.). Plant Physiol. Biochem. 2022, 190, 231–239. [Google Scholar] [CrossRef] [PubMed]
- Drahoňovský, J.; Száková, J.; Mestek, O.; Tremlová, J.; Kaňa, A.; Najmanová, J.; Tlustoš, P. Selenium uptake, transformation and inter-element interactions by selected wildlife plant species after foliar selenate application. Environ. Exp. Bot. 2016, 125, 12–19. [Google Scholar] [CrossRef]
- Giordano, D.; Locatelli, M.; Travaglia, F.; Bordiga, M.; Reyneri, A.; Coïsson, J.D.; Blandino, M. Bioactive compound and antioxidant activity distribution in roller-milled and pearled fractions of conventional and pigmented wheat varieties. Food Chem. 2017, 233, 483–491. [Google Scholar] [CrossRef] [PubMed]
- Puccinelli, M.; Pezzarossa, B.; Pintimalli, L.; Malorgio, F. Selenium biofortification of three wild species, Rumex acetosa L., Plantago coronopus L., and Portulaca oleracea L., grown as microgreens. Agronomy 2021, 11, 1155. [Google Scholar] [CrossRef]
- Jiang, C.Q.; Zu, C.L.; Shen, J.; Shao, F.W.; Li, T. Effects of selenium on the growth and photosynthetic characteristics of flue-cured tobacco (Nicotiana tabacum L.). Acta Soc. Bot. Pol. 2015, 84, 71–77. [Google Scholar] [CrossRef]
- Yao, X.Q.; Chu, J.Z.; Wang, G.Y. Effects of selenium on wheat seedlings under drought stress. Biol. Trace Elem. Res. 2009, 130, 283–290. [Google Scholar] [CrossRef] [PubMed]
- Germ, M.; Kreft, I.; Osvald, J. Influence of UV-B exclusion and selenium treatment on photochemical efficiency of photosystem II, yield and respiratory potential in pumpkins (Cucurbita pepo L.). Plant Physiol. Biochem. 2005, 43, 445–448. [Google Scholar] [CrossRef]
- Dragicevic, V.; Dolijanovic, Z.; Janosevic, B.; Brankov, M.; Stoiljkovic, M.; Dodevska, M.S.; Simic, M. Enhanced Nutritional Quality of Sweet Maize Kernel in Response to Cover Crops and Bio-Fertilizer. Agronomy 2021, 11, 981. [Google Scholar] [CrossRef]
- Ding, C.; Xu, C.; Lu, B.; Zhu, X.; Luo, X.; He, B.; Elidio, C.; Liu, Z.; Ding, Y.; Yang, J.; et al. Comprehensive Evaluation of Rice Qualities under Different Nitrogen Levels in South China. Foods 2023, 12, 697. [Google Scholar] [CrossRef]
- Shi, S.J.; Wang, E.T.; Li, C.X.; Zhou, H.; Cai, M.L.; Cao, C.G.; Jiang, Y. Comprehensive Evaluation of 17 Qualities of 84 Types of Rice Based on Principal Component Analysis. Foods 2021, 10, 2883. [Google Scholar] [CrossRef]


| Year | Organic Matter (g/kg) | Available N (mg/kg) | Available Phosphorus (mg/kg) | Available Potassium (mg/kg) | Fe (mg/kg) | Mn (mg/kg) | Cu (mg/kg) | Zn (mg/kg) | Se (mg/kg) |
|---|---|---|---|---|---|---|---|---|---|
| 2019 | 10.8 | 61.96 | 22.43 | 121.05 | 82.13 | 63.86 | 38.13 | 57.37 | 0.057 |
| 2020 | 9.6 | 62.47 | 21.97 | 122.41 | 87.71 | 65.65 | 37.54 | 50.51 | 0.041 |
Disclaimer/Publisher’s Note: The statements, opinions and data contained in all publications are solely those of the individual author(s) and contributor(s) and not of MDPI and/or the editor(s). MDPI and/or the editor(s) disclaim responsibility for any injury to people or property resulting from any ideas, methods, instructions or products referred to in the content. |
© 2024 by the authors. Licensee MDPI, Basel, Switzerland. This article is an open access article distributed under the terms and conditions of the Creative Commons Attribution (CC BY) license (https://creativecommons.org/licenses/by/4.0/).
Share and Cite
Lu, B.; An, H.; Song, X.; Yang, B.; Jian, Z.; Cui, F.; Xue, J.; Gao, Z.; Du, T. Enhancement of Nutritional Substance, Trace Elements, and Pigments in Waxy Maize Grains through Foliar Application of Selenite. Foods 2024, 13, 1337. https://doi.org/10.3390/foods13091337
Lu B, An H, Song X, Yang B, Jian Z, Cui F, Xue J, Gao Z, Du T. Enhancement of Nutritional Substance, Trace Elements, and Pigments in Waxy Maize Grains through Foliar Application of Selenite. Foods. 2024; 13(9):1337. https://doi.org/10.3390/foods13091337
Chicago/Turabian StyleLu, Boyu, Haoyuan An, Xinli Song, Bosen Yang, Zhuqing Jian, Fuzhu Cui, Jianfu Xue, Zhiqiang Gao, and Tianqing Du. 2024. "Enhancement of Nutritional Substance, Trace Elements, and Pigments in Waxy Maize Grains through Foliar Application of Selenite" Foods 13, no. 9: 1337. https://doi.org/10.3390/foods13091337