
Differences in New Zealand Hop Cultivars Based on Their Unique Volatile Compounds: An Integrated Fingerprinting and Chemometrics Approach


 , and
, and
Abstract
:1. Introduction
2. Materials and Methods
2.1. Materials
2.2. Sample Analysis
2.3. Data Preprocessing and Multivariate Data Analysis (MVDA)
3. Results and Discussion
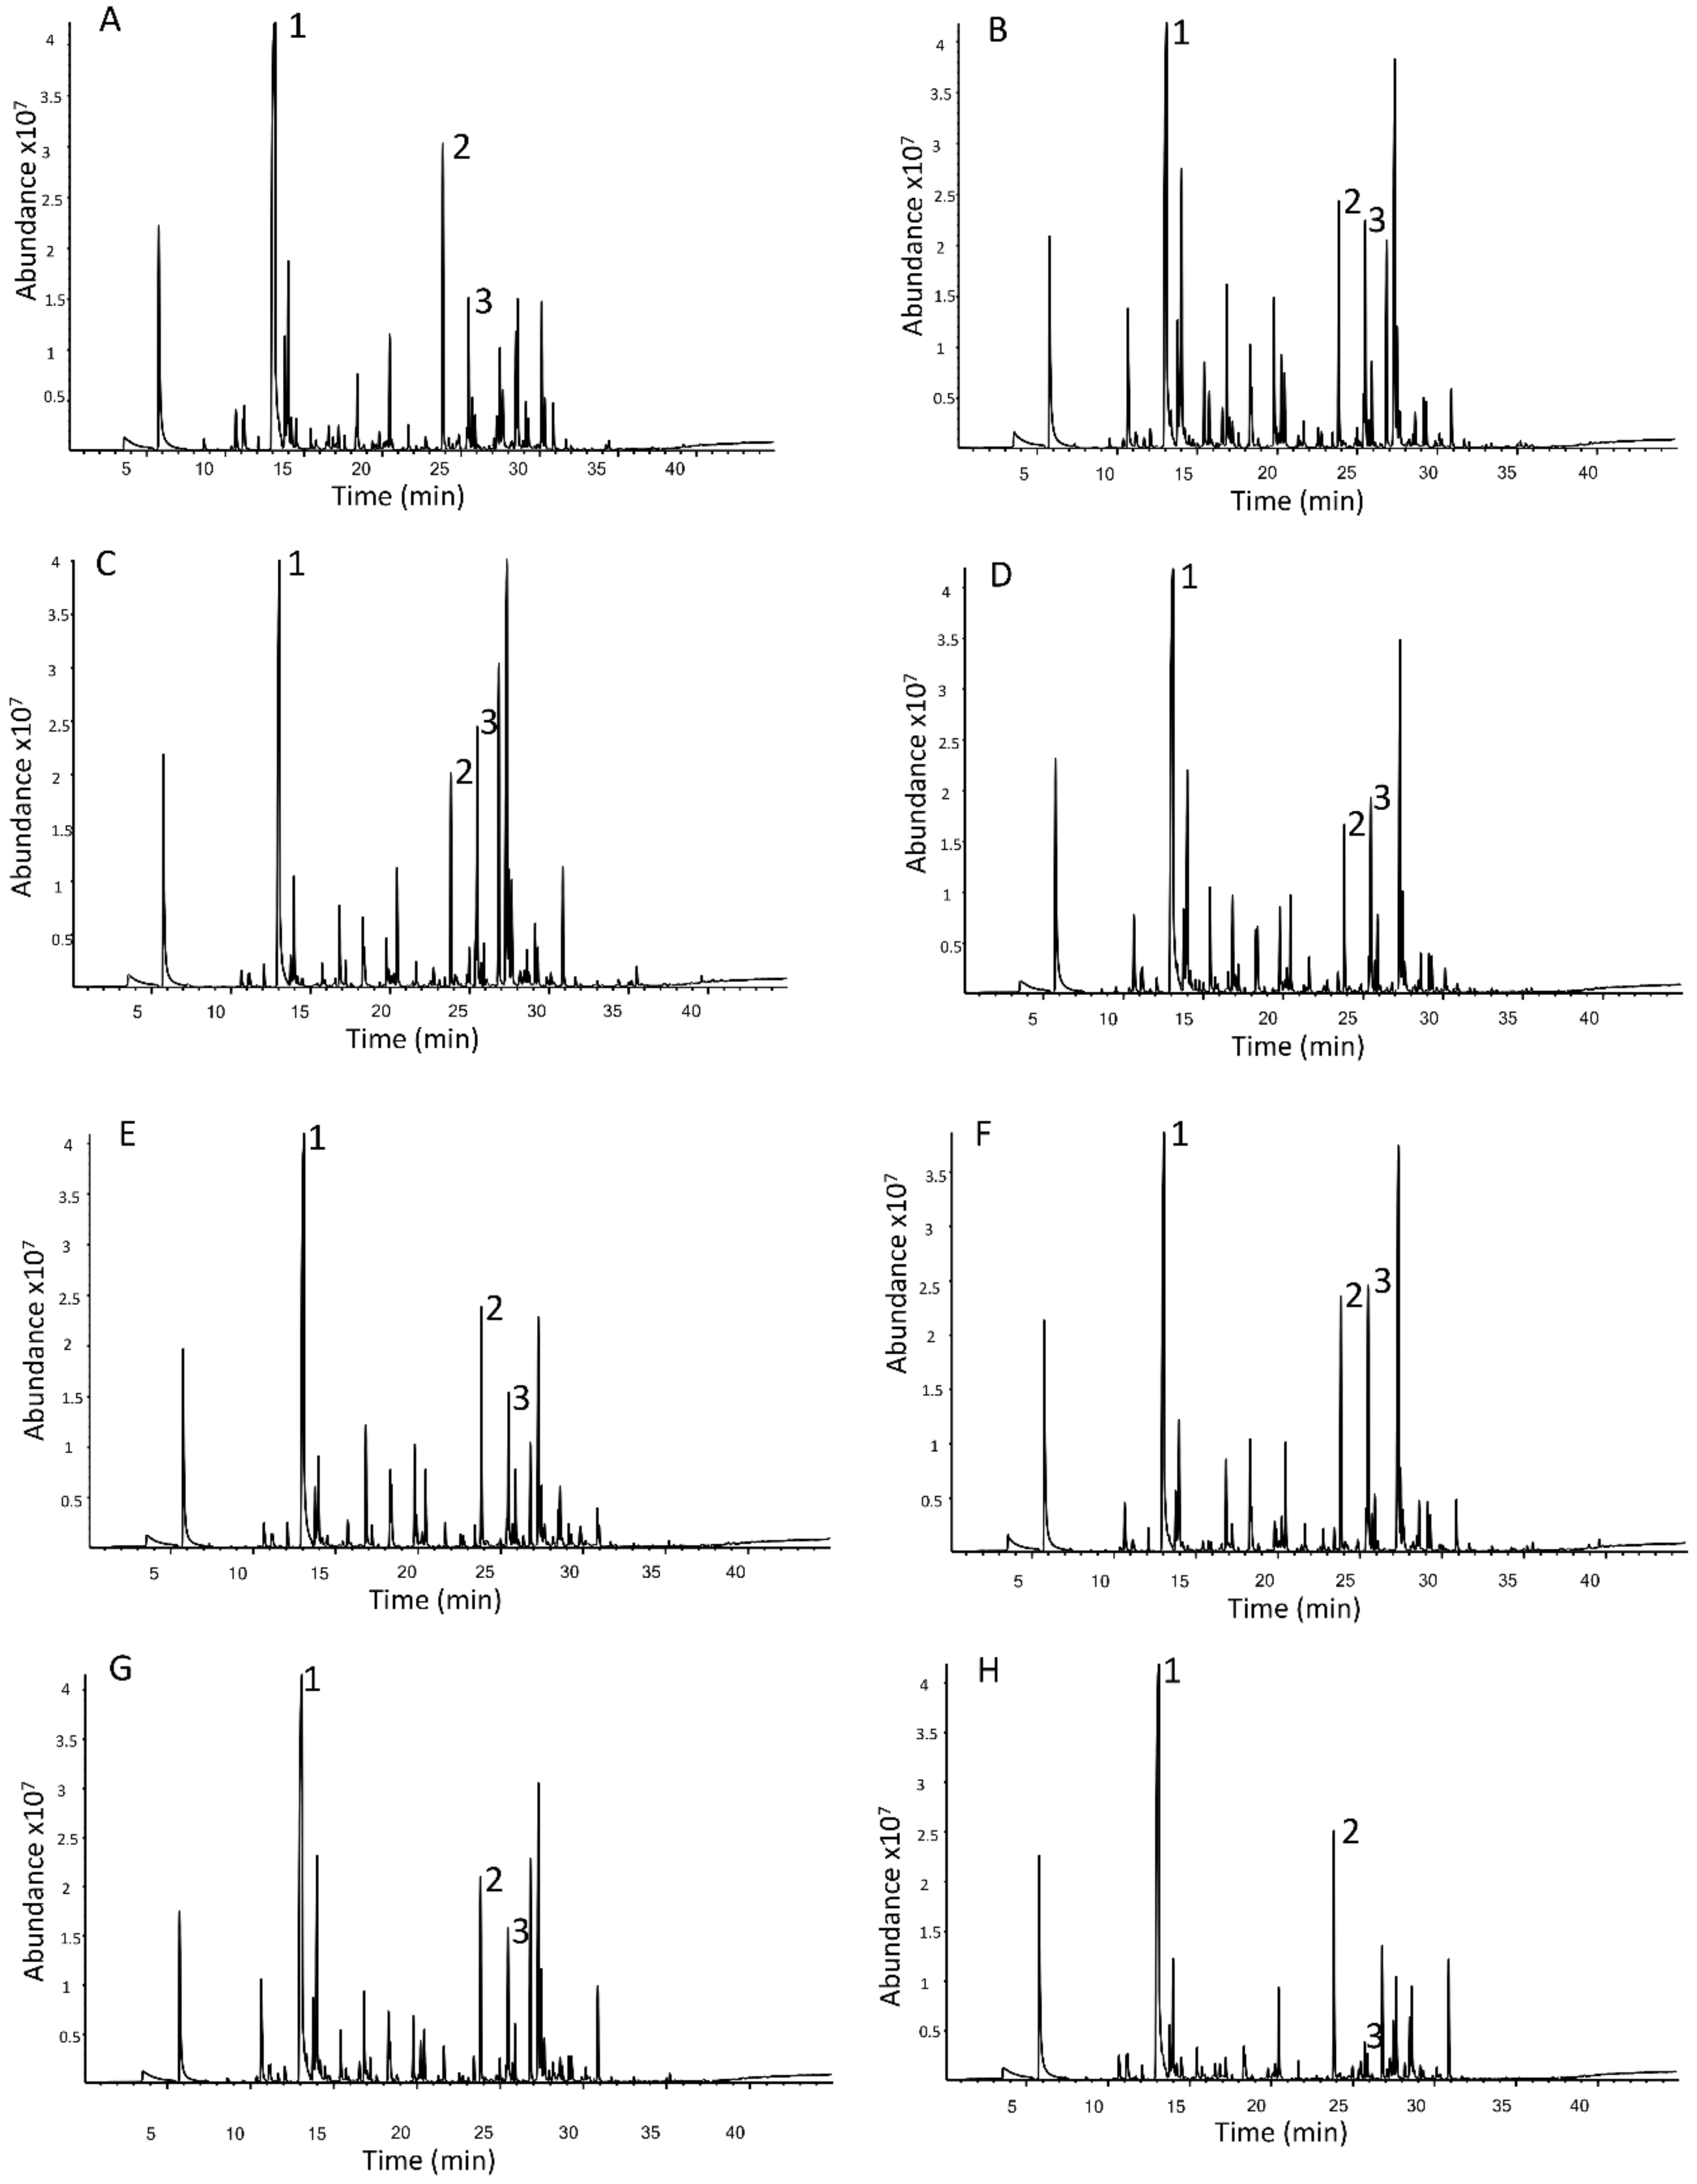
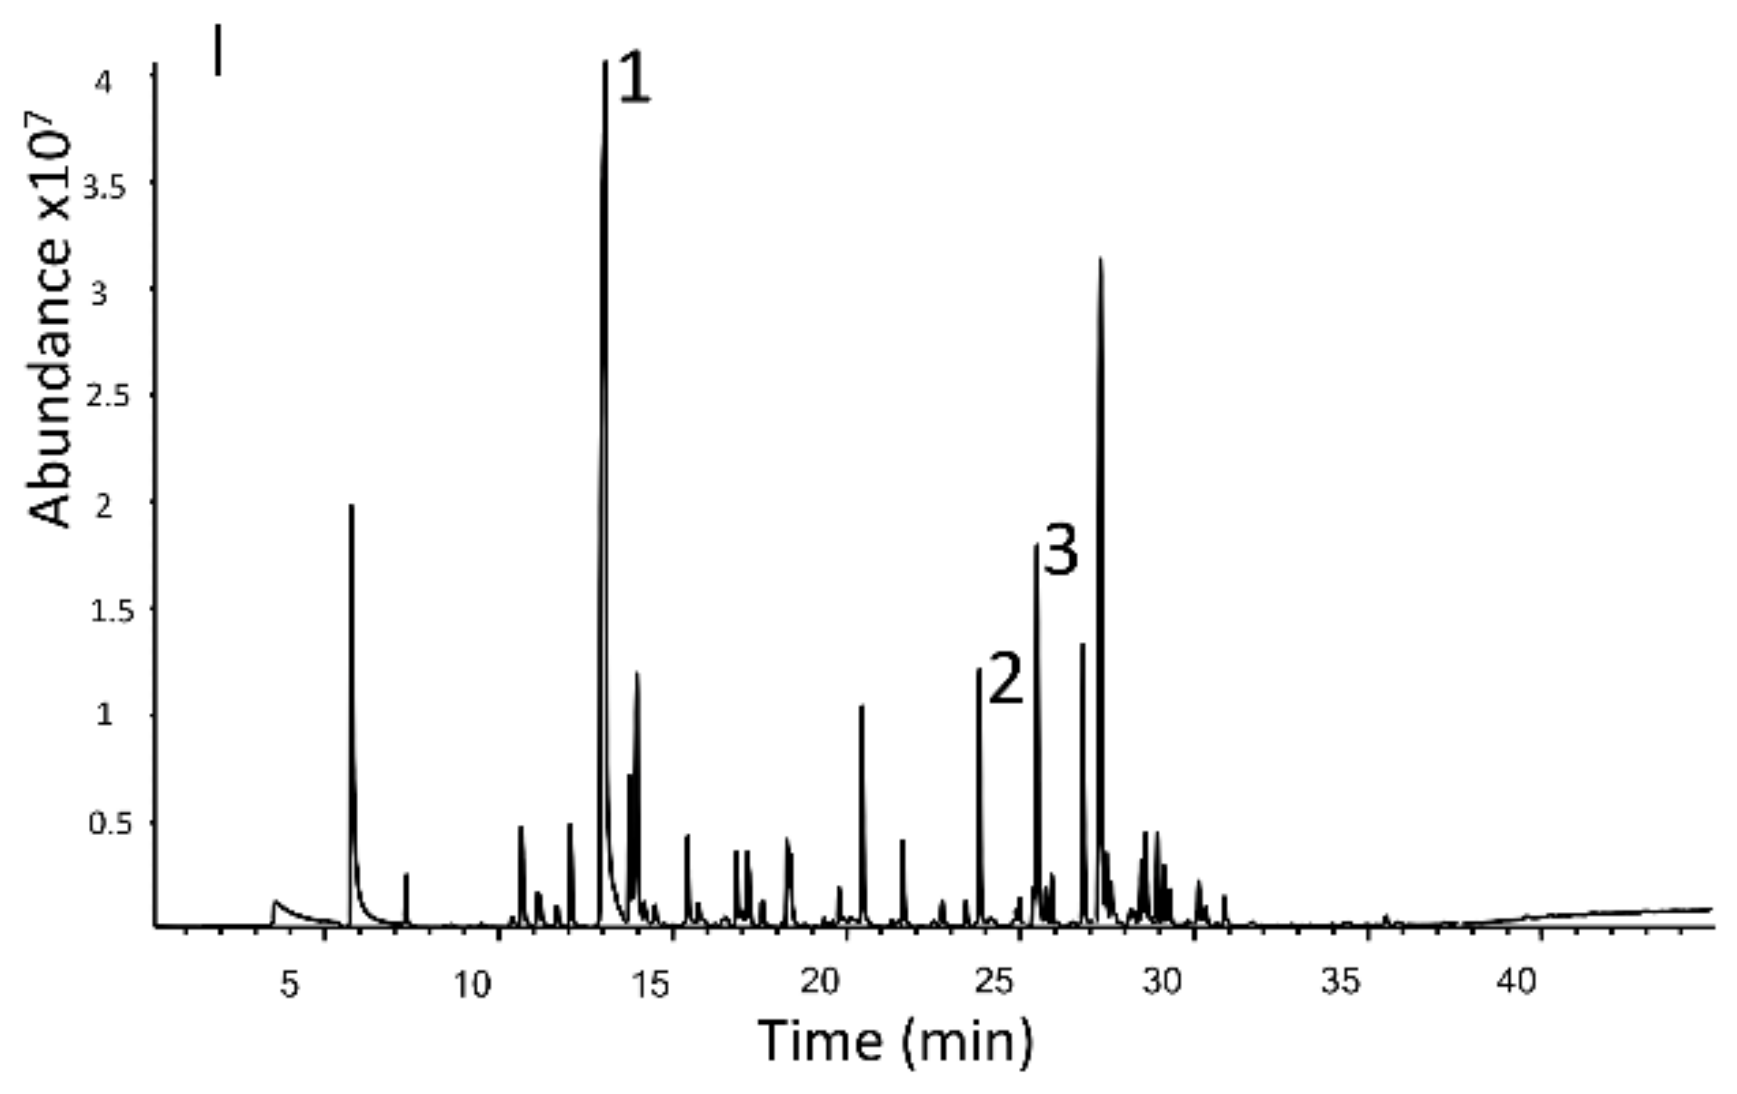
3.1. Commercial Hop Cultivars
3.1.1. Commercial Hop Cultivar Data Pre-Processing
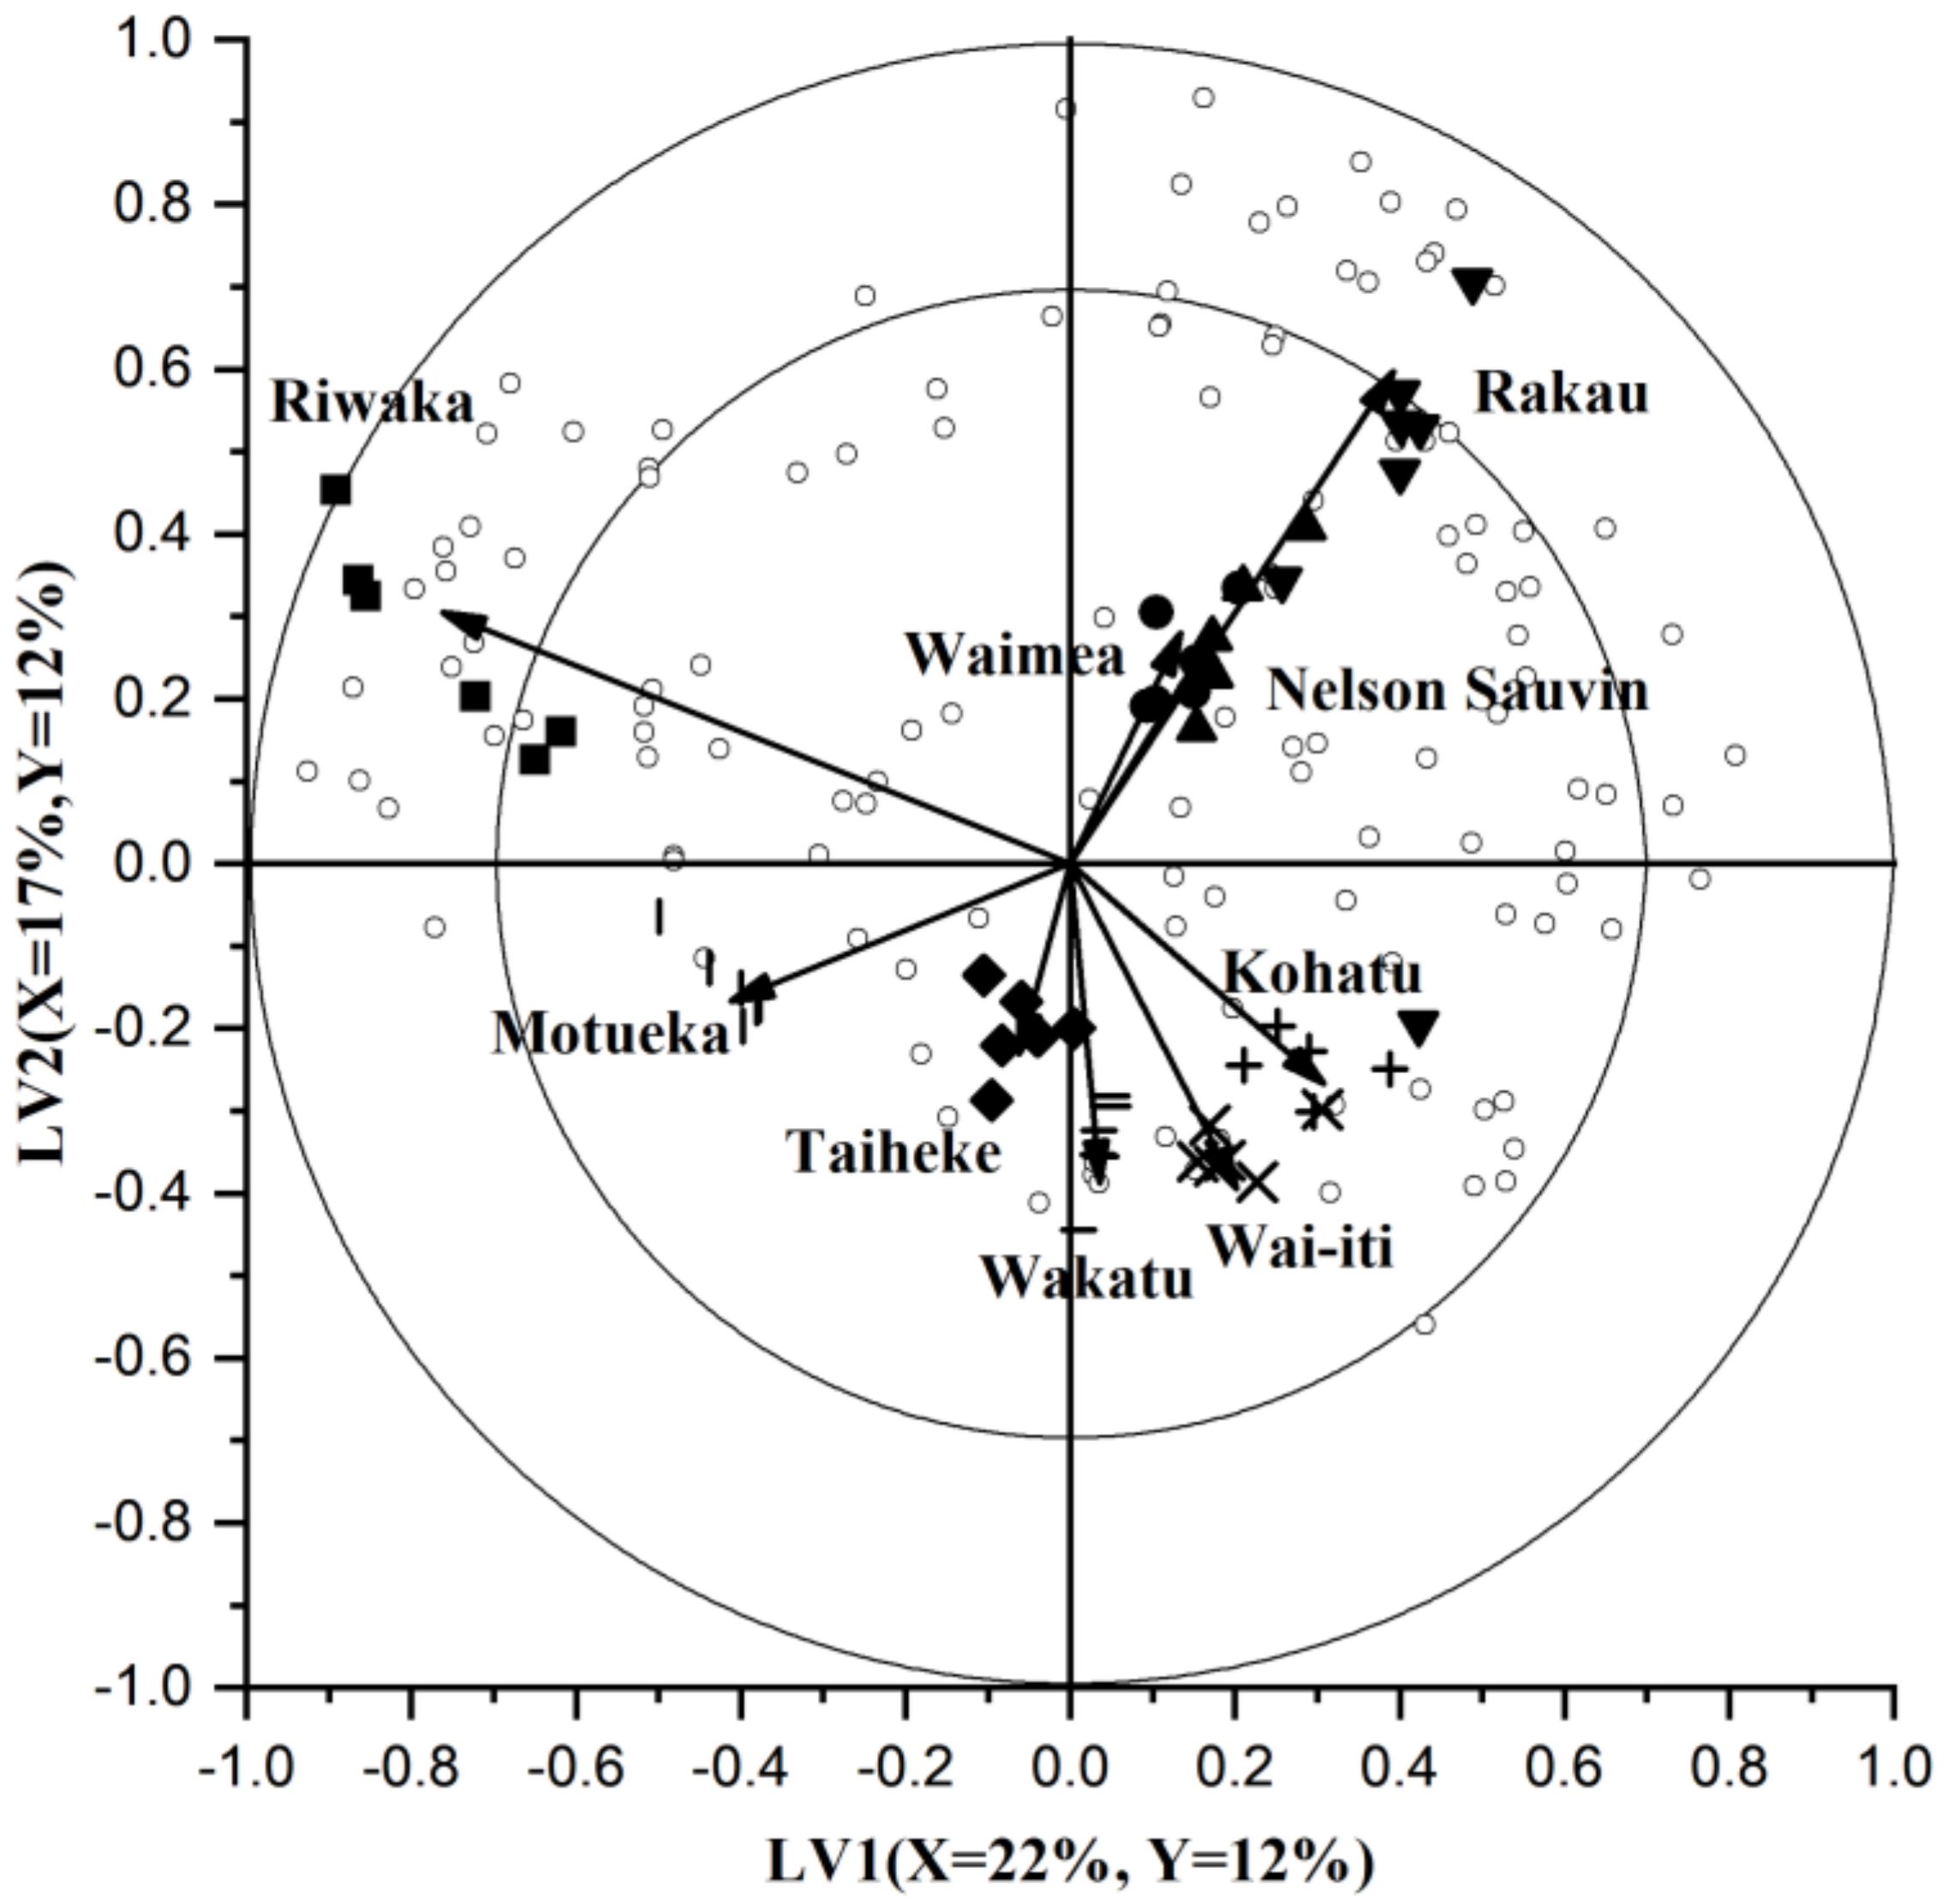
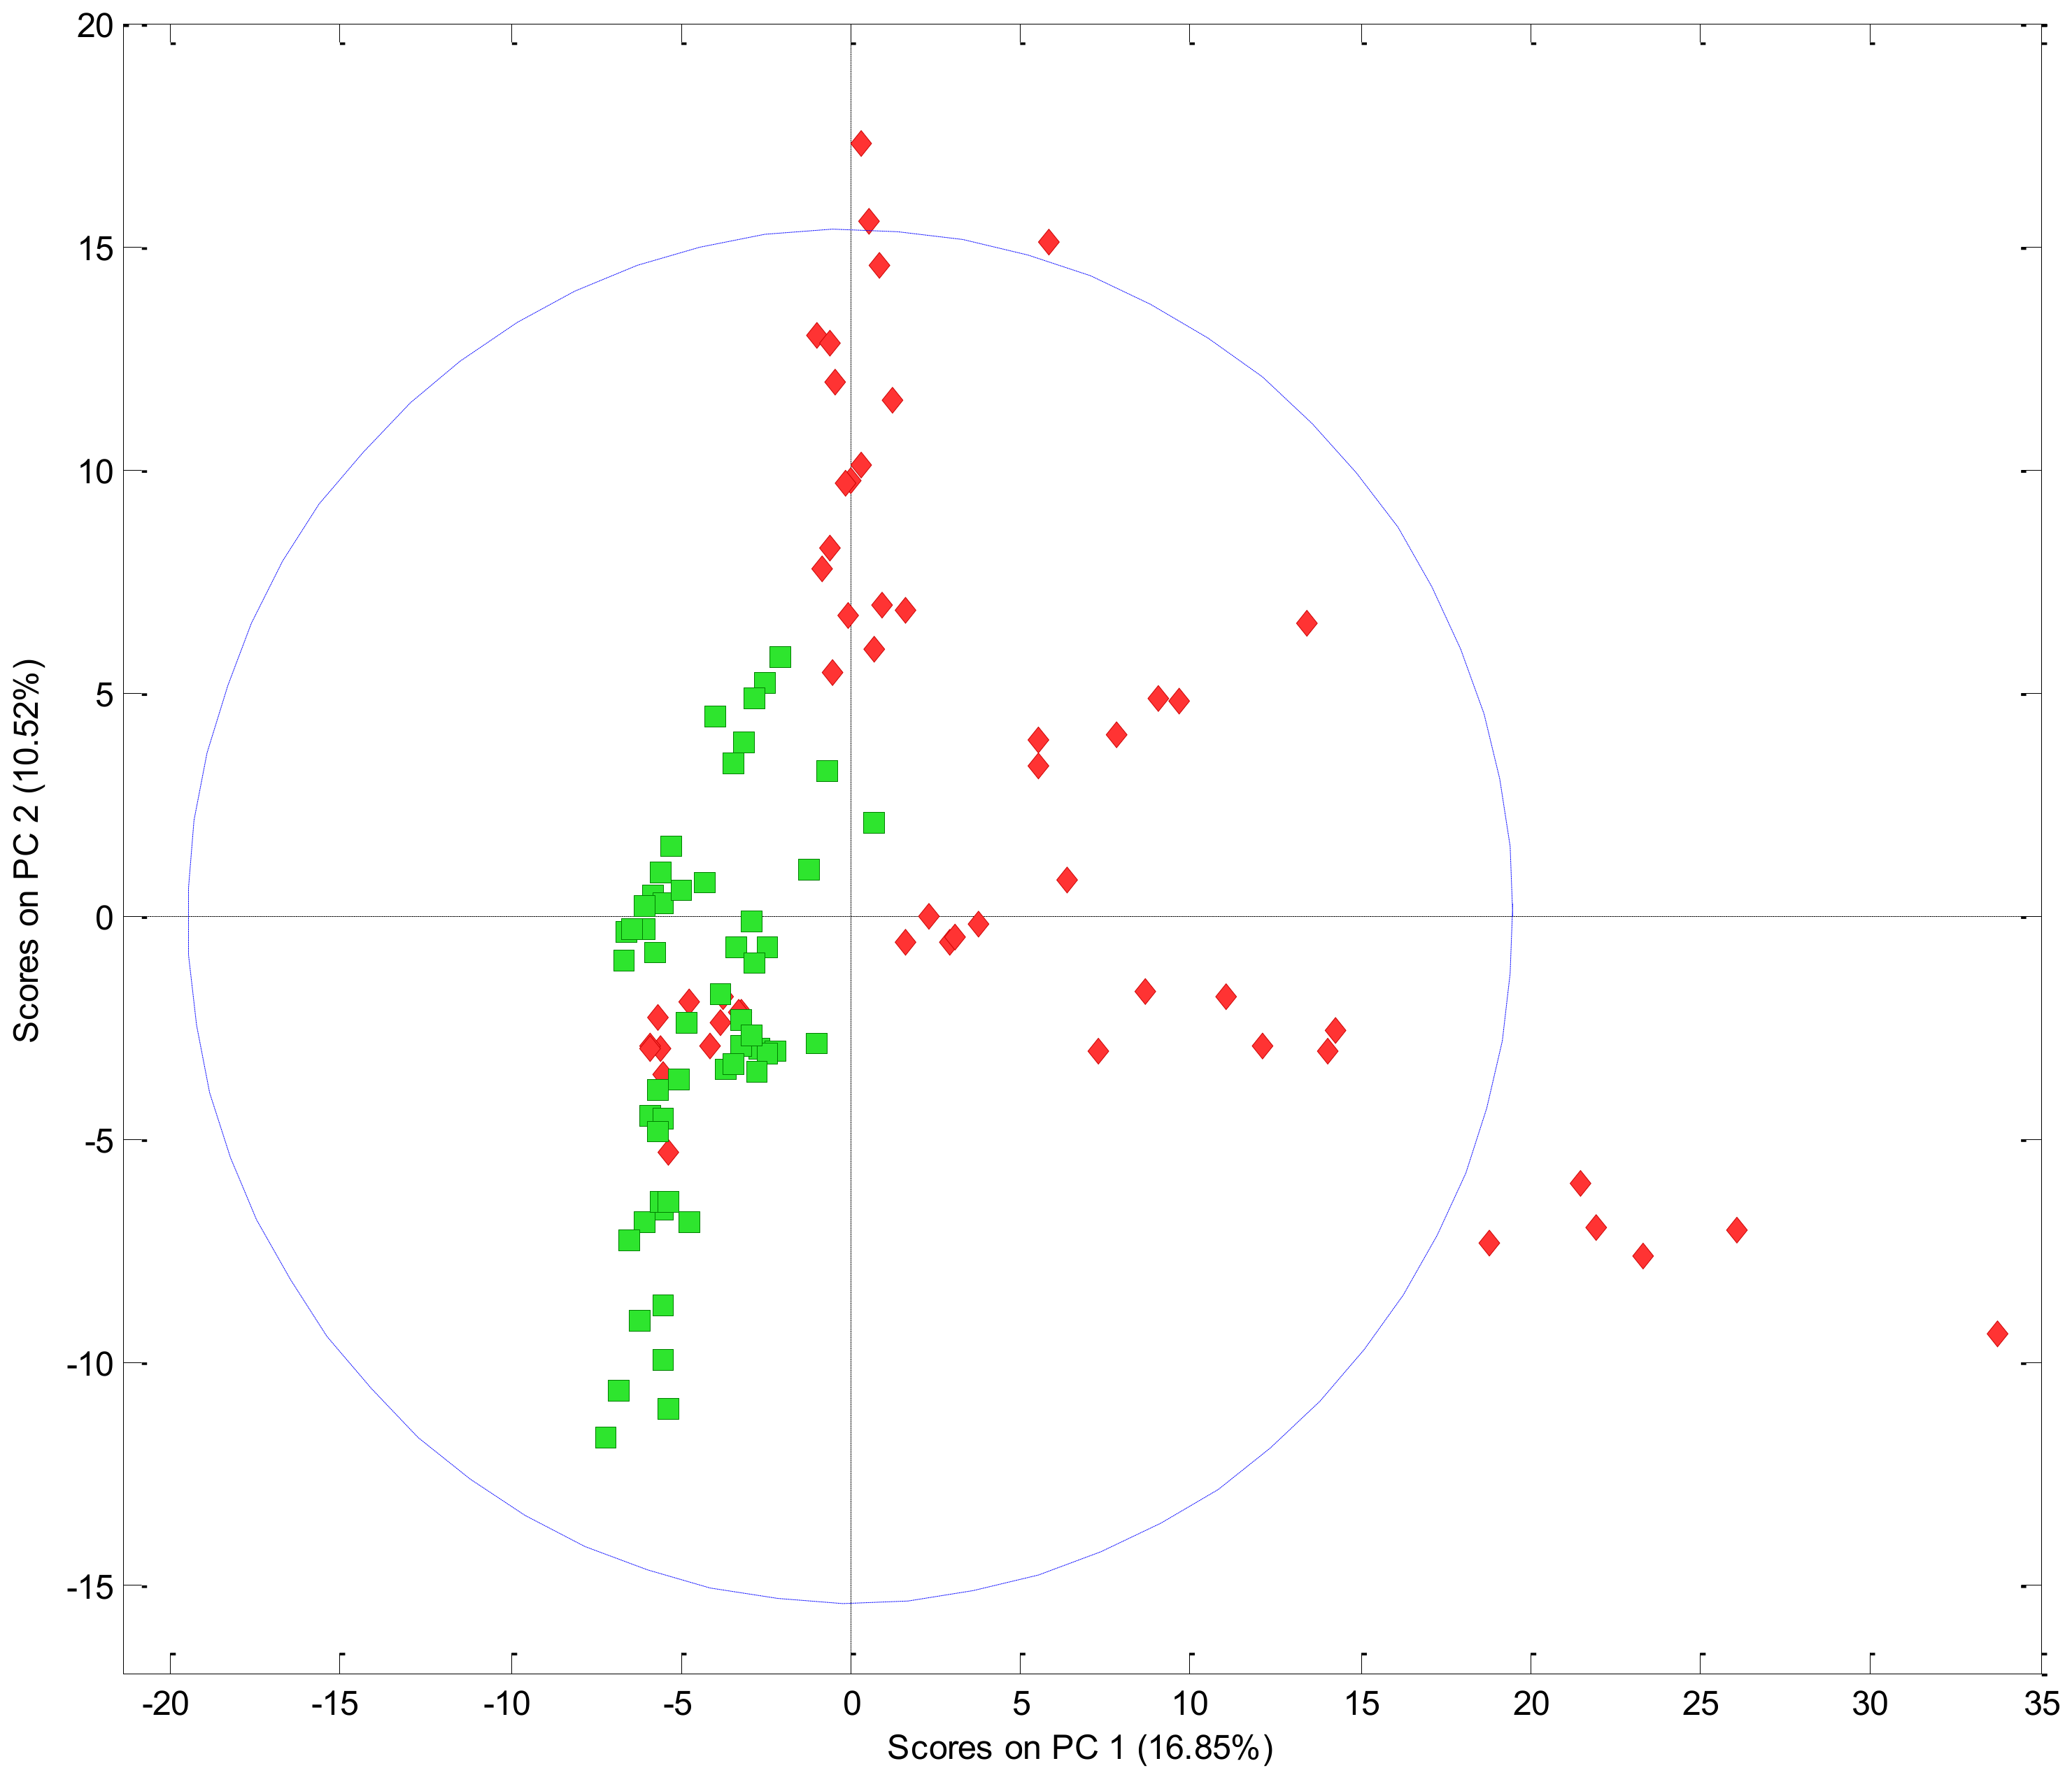
3.1.2. Comparing the Volatile Fraction of Commercial Cultivars Using Multivariate Data Analysis (MVDA)
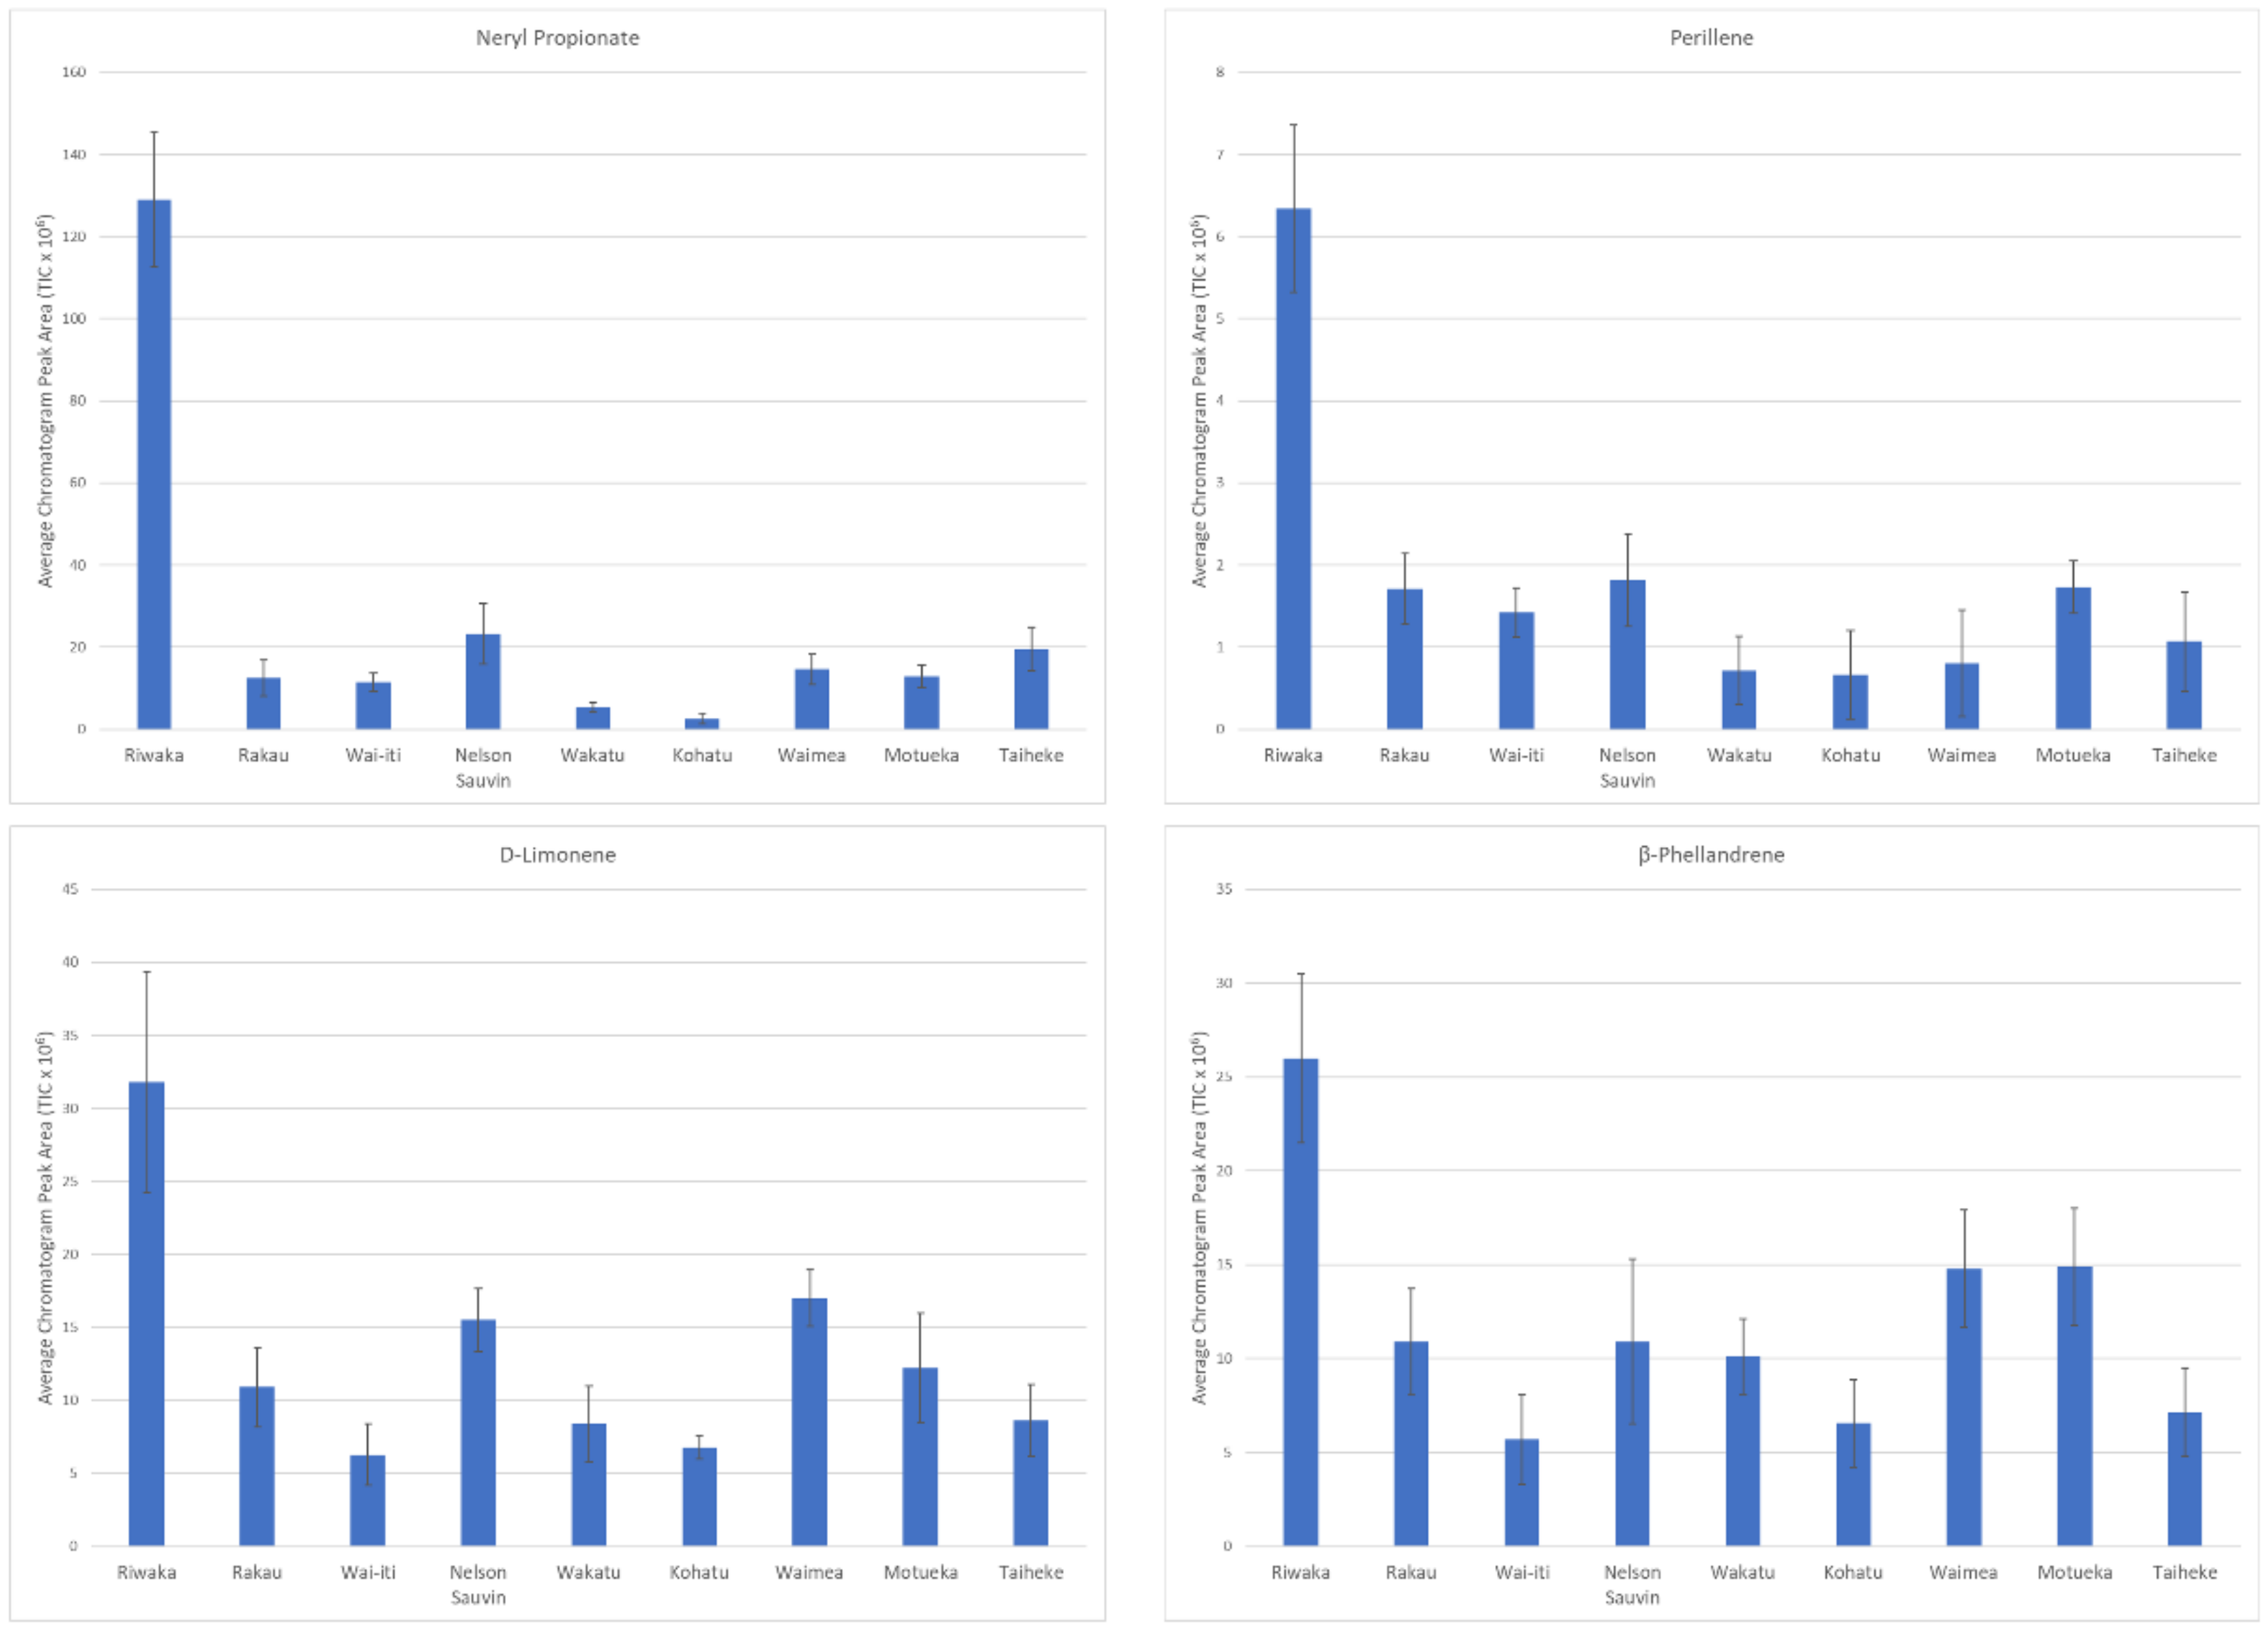
3.1.3. Selection and Interpretation of Discriminant Volatile Compounds in Commercial Cultivars
3.2. Comparison of Volatile Fractions of Commercial Cultivars and Advanced Selections
4. Conclusions
Supplementary Materials
Author Contributions
Funding
Data Availability Statement
Acknowledgments
Conflicts of Interest
References
- Verzele, M.; Keukeleire, D. Chemistry and Analysis of Hop and Beer Bitter Acids; Elsevier Science: Amsterdam, The Netherlands, 1991; Volume 27. [Google Scholar]
- Almaguer, C.; Schönberger, C.; Gastl, M.; Arendt, E.K.; Becker, T. Humulus lupulus—A story that begs to be told. A review. J. Inst. Brew. 2014, 120, 289–314. [Google Scholar] [CrossRef]
- Van Opstaele, F.; De Causmaecker, B.; Aerts, G.; De Cooman, L. Characterization of novel varietal floral hop aromas by headspace solid phase microextraction and gas chromatography-mass spectrometry/olfactometry. J. Agric. Food Chem. 2012, 60, 12270–12281. [Google Scholar] [CrossRef]
- Eyres, G.; Dufour, J.-P. Hop essential oil: Analysis, chemical composition and odor characteristics. In Beer in Health and Disease Prevention; Elsevier BV: Amsterdam, The Netherlands, 2009; pp. 239–254. [Google Scholar]
- Breitmaier, E. Terpenes: Importance, General Structure, and Biosynthesis; Wiley: Weinheim, Germany, 2007; pp. 1–9. [Google Scholar]
- Beatson, R.; Alspach, P.; Donelan, D. Developments in the New Zealand hop breeding programme. In Proceedings of the 32nd Convention of the Institute of Brewing and Distilling - Asia Pacific Section, Melbourne, Australia, 25–30 March 2012. [Google Scholar]
- Beatson, R.; Alspach, P.; Stephens, M.; Buck, E.; Datson, P.; Ferguson, A. Breeding polyploid hop cultivars for New Zealand conditions. Acta Hortic. 2016, 1127, 9–14. [Google Scholar] [CrossRef]
- Beatson, R.; Stephens, M.; Alspach, P. Polyploid breeding strategies for developing hop cultivars in New Zealand. Acta Hortic. 2019, 105–112. [Google Scholar] [CrossRef]
- Gros, J.; Nizet, S.; Collin, S. Occurrence of odorant polyfunctional thiols in the Super Alpha tomahawk hop cultivar. Comparison with the Thiol-rich Nelson Sauvin bitter variety. J. Agric. Food Chem. 2011, 59, 8853–8865. [Google Scholar] [CrossRef]
- Beatson, R.; Ansell, K.A.; Graham, L.T. Breeding, development, and characteristics of the hop (Humulus lupulus) cultivar ‘Nelson Sauvin’. N. Zldn. J. Crop. Hortic. Sci. 2003, 31, 303–309. [Google Scholar] [CrossRef] [Green Version]
- Arcena, M.R.; Kebede, B.; Leong, S.Y.; Silcock, P.; Oey, I. Feasibility of using integrated fingerprinting, profiling and chemometrics approach to understand (bio) chemical changes throughout commercial red winemaking: A case study on Merlot. Food Res. Int. 2020, 127, 108767. [Google Scholar] [CrossRef]
- Kebede, B.; Grauwet, T.; Mutsokoti, L.; Palmers, S.; Vervoort, L.; Hendrickx, M.; Van Loey, A. Comparing the impact of high pressure high temperature and thermal sterilization on the volatile fingerprint of onion, potato, pumpkin and red beet. Food Res. Int. 2014, 56, 218–225. [Google Scholar] [CrossRef]
- Kebede, B.T.; Grauwet, T.; Palmers, S.; Vervoort, L.; Carle, R.; Hendrickx, M.; Van Loey, A. Effect of high pressure high temperature processing on the volatile fraction of differently coloured carrots. Food Chem. 2014, 153, 340–352. [Google Scholar] [CrossRef]
- Plutowska, B.; Wardencki, W. Application of gas chromatography–olfactometry (GC–O) in analysis and quality assessment of alcoholic beverages—A review. Food Chem. 2008, 107, 449–463. [Google Scholar] [CrossRef]
- Yan, D.; Wong, Y.F.; Tedone, L.; Shellie, R.A.; Marriott, P.J.; Whittock, S.P.; Koutoulis, A. Chemotyping of new hop (Humulus lupulus L.) genotypes using comprehensive two-dimensional gas chromatography with quadrupole accurate mass time-of-flight mass spectrometry. J. Chromatogr. A 2018, 1536, 110–121. [Google Scholar] [CrossRef]
- Takoi, K.; Koie, K.; Itoga, Y.; Katayama, Y.; Shimase, M.; Nakayama, Y.; Watari, J. Biotransformation of hop-derived monoterpene alcohols by lager yeast and their contribution to the flavor of hopped beer. J. Agric. Food Chem. 2010, 58, 5050–5058. [Google Scholar] [CrossRef]
- Takoi, K.; Degueil, M.; Shinkaruk, S.; Thibon, C.; Maeda, K.; Ito, K.; Bennetau, B.; Dubourdieu, D.; Tominaga, T. Identification and characteristics of new volatile thiols derived from the hop (Humulus lupulus L.) Cultivar Nelson Sauvin. J. Agric. Food Chem. 2009, 57, 2493–2502. [Google Scholar] [CrossRef]
- Richter, T.M.; Eyres, G.T.; Silcock, P.; Bremer, P.J. Comparison of four extraction methods for analysis of volatile hop-derived aroma compounds in beer. J. Sep. Sci. 2017, 40, 4366–4376. [Google Scholar] [CrossRef]
- Vervoort, L.; Grauwet, T.; Kebede, B.; Van Der Plancken, I.; Timmermans, R.; Hendrickx, M.; Van Loey, A. Headspace fingerprinting as an untargeted approach to compare novel and traditional processing technologies: A case-study on orange juice pasteurisation. Food Chem. 2012, 134, 2303–2312. [Google Scholar] [CrossRef]
- Gauvin, A.; LeComte, H.; Smadja, J. Comparative investigations of the essential oils of two scented geranium (Pelargonium spp.) cultivars grown on Reunion Island. Flavour Fragr. J. 2004, 19, 455–460. [Google Scholar] [CrossRef]
- Njoroge, S.M.; Koaze, H.; Karanja, P.N.; Sawamura, M. Volatile constituents of redblush grapefruit (Citrus paradisi) and pummelo (Citrus grandis) peel essential oils from Kenya. J. Agric. Food Chem. 2005, 53, 9790–9794. [Google Scholar] [CrossRef]
- Umano, K.; Shibamoto, T. New method of headspace sampling: Grapefruit volatiles. In Developments in Food Science; Lawrence, B.M., Mookherjee, B.D., Willis, B.J., Eds.; Elsevier: New York, NY, USA, 1988; Volume 18, pp. 981–998. [Google Scholar]
- Vernin, G.; Merad, L.O. Mass spectra and Kovats indices of some new cis-chrysanthenyl esters found in the essential oil of Artemisia herba alba from Algeria. J. Essent. Oil Res. 1994, 6, 437–448. [Google Scholar] [CrossRef]
- Viljoen, A.; Subramoney, S.; Van Vuuren, S.; Baser, K.H.C.; Demirci, B. The composition, geographical variation and antimicrobial activity of Lippia javanica (Verbenaceae) leaf essential oils. J. Ethnopharmacol. 2005, 96, 271–277. [Google Scholar] [CrossRef]
- Avato, P.; Raffo, F.; Al-Douri, N.; Vartanian, S.T. Essential oils of Varthemia iphionoides from Jordan. Flavour Fragr. J. 2004, 19, 559–561. [Google Scholar] [CrossRef]
- İşcan, G.; Kirimer, N.; Kürkçüoglu, M.N.; Arabaci, T.; Küpeli, E.; Can Başer, K.H. Biological activity and composition of the essential oils of Achillea schischkinii Sosn. and Achillea aleppica DC. subsp. aleppica. J. Agric. Food Chem. 2006, 54, 170–173. [Google Scholar] [CrossRef]
- Tatsuka, K.; Suekane, S.; Sakai, Y.; Sumitani, H. Volatile constituents of kiwi fruit flowers: Simultaneous distillation and extraction versus headspace sampling. J. Agric. Food Chem. 1990, 38, 2176–2180. [Google Scholar] [CrossRef]
- Tressl, R.; Friese, L.; Fendesack, F.; Koeppler, H. Studies of the volatile composition of hops during storage. J. Agric. Food Chem. 1978, 26, 1426–1430. [Google Scholar] [CrossRef]
- Kourkoutas, D.; Elmore, J.S.; Mottram, D.S. Comparison of the volatile compositions and flavour properties of cantaloupe, Galia and honeydew muskmelons. Food Chem. 2006, 97, 95–102. [Google Scholar] [CrossRef]
- Loayza, I.; Abujder, D.; Aranda, R.; Jakupovic, J.; Collin, G.; Deslauriers, H.; Jean, F.-I. Essential oils of Baccharis salicifolia, B. latifolia and B. dracunculifolia. Phytochemistry 1995, 38, 381–389. [Google Scholar] [CrossRef]
- Umano, K.; Hagi, Y.; Tamura, T.; Shoji, A.; Shibamoto, T. Identification of volatile compounds isolated from round kumquat (Fortunella japonica Swingle). J. Agric. Food Chem. 1994, 42, 1888–1890. [Google Scholar] [CrossRef]
- Bianchi, F.; Careri, M.; Mangia, A.; Musci, M. Retention indices in the analysis of food aroma volatile compounds in temperature-programmed gas chromatography: Database creation and evaluation of precision and robustness. J. Sep. Sci. 2007, 30, 563–572. [Google Scholar] [CrossRef] [Green Version]
- El Kabouss, A.; Charrouf, Z.; Faid, M.; Garneau, F.-X.; Collin, G. Chemical composition and antimicrobial activity of the leaf essential oil of Argania spinosa L. skeels. J. Essent. Oil Res. 2002, 14, 147–149. [Google Scholar] [CrossRef]
- Randriamiharisoa, R.P.; Gaydou, E.M. Composition of palmarosa (Cymbopogon martinii) essential oil from Madagascar. J. Agric. Food Chem. 1987, 35, 62–66. [Google Scholar] [CrossRef]
- Vinogradov, B. Production, Composition, Properties and Application of Essential Oils. 2004. Available online: http://webbook.nist.gov (accessed on 15 May 2019).
- Ledauphin, J.; Saint-Clair, J.-F.; Lablanquie, O.; Guichard, H.; Founier, N.; Guichard, E.; Barillier, D. Identification of trace volatile compounds in freshly distilled calvados and cognac using preparative separations coupled with gas chromatography-mass spectrometry. J. Agric. Food Chem. 2004, 52, 5124–5134. [Google Scholar] [CrossRef]
- Eyres, G.; Marriott, P.; Leus, M.; Lysaght, B. Characterisation of impact aroma compounds in hop essential oils. In Proceedings of the Flavour Science: The XIV Weurman Flavor Research Symposium, Cambridge, UK, 15–19 September 2014; pp. 19–24. [Google Scholar]
- New Zealand Hops Ltd. New Zealand Hops. 2019 Harvest Report. 2019. Available online: https://www.nzhops.co.nz/history (accessed on 8 August 2019).


| Retention Index ** | |||||
|---|---|---|---|---|---|
| VID | Tentative Identification | Calculated | Reference | Chemical Class | |
| Riwaka™ | |||||
| 0.97 | Neryl Propanoate | 1815 | 1831 | [20] | Terpene Ester |
| 0.96 | Geranyl 2-methylbutyrate | 1822 | 1819 | NIST | Terpene Ester |
| 0.95 | Unknown | 2081 | |||
| 0.94 | Perillene | 1454 | 1431 | [21] | Terpene |
| 0.88 | β-Eudesmene | 1752 | 1717 | NIST | Terpene |
| 0.86 | D-Limonene * | 1211 | 1213 | [20] | Terpene |
| 0.86 | Unknown | 1542 | Unknown | ||
| 0.83 | Unknown | 1513 | Unknown | ||
| 0.83 | β-Phellandrene | 1223 | 1201 | [22] | Terpene |
| 0.79 | α-Selinene | 1757 | 1725 | NIST | Terpene |
| 0.79 | Methyl 6-methyl heptanoate | 1370 | 1338 | NIST | Ester |
| 0.79 | cis-Chrysanthenol acetate | 1648 | 1590 | [23] | Ester |
| 0.79 | Unknown | 1798 | Unknown | ||
| 0.77 | Ipsdienol | 1700 | 1678 | [24] | Terpene Alcohol |
| 0.75 | cis-2-Menthenol | 1600 | 1608 | [25] | Terpene Alcohol |
| 0.73 | Unknown | 1407 | Unknown | ||
| 0.73 | Neointermedeol | 2156 | 2138 | NIST | Terpene Alcohol |
| 0.72 | γ-Terpinene * | 1265 | 1246 | NIST | Terpene |
| 0.71 | β-Pinene | 1098 | 1097 | [22] | Terpene |
| 0.71 | Caryophyllene oxide | 1975 | 1989 | NIST | Terpene Oxide |
| Rakau™ | |||||
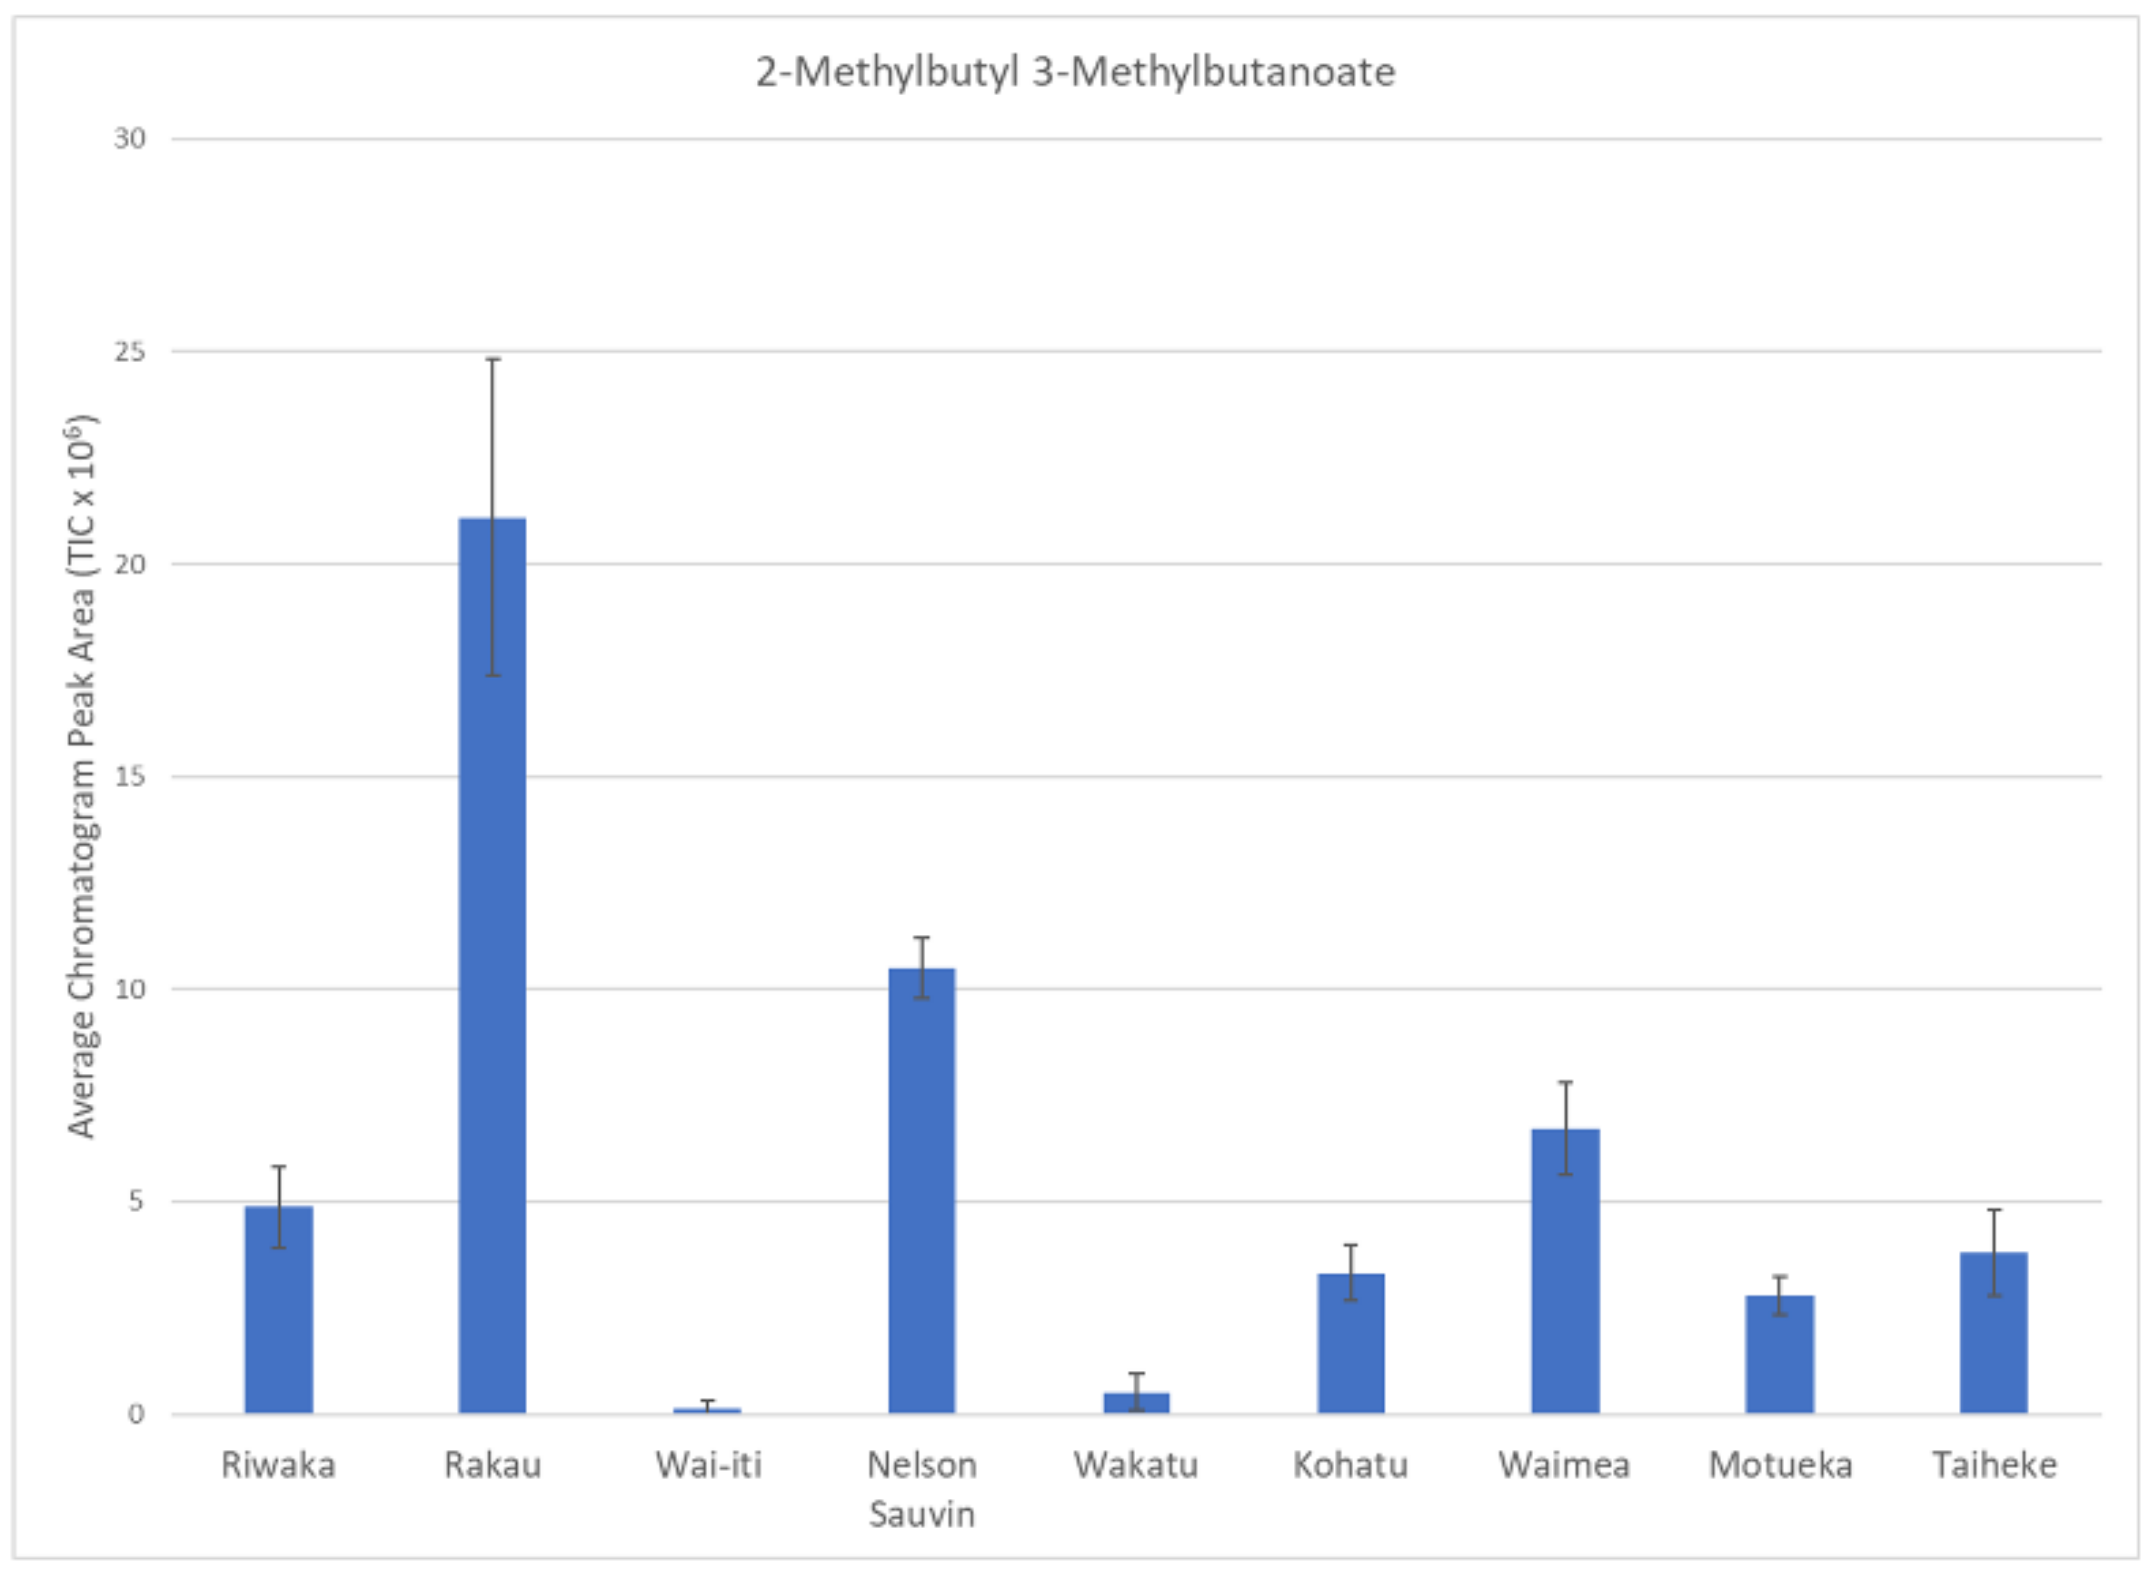
| 0.93 | 2-Methylbutyl 3-methylbutanoate | 1318 | 1299 | [26] | Ester |
| 0.93 | S-Methyl hexanethioate | 1440 | 1412 | NIST | Ester |
| 0.87 | Unknown | 1937 | Unknown | ||
| 0.84 | cis-β-Ocimene | 1270 | 1238 | [27] | Terpene |
| 0.84 | Propyl 2-methylpropanoate | 1035 | 1056 | NIST | Ester |
| 0.83 | Methyl 4-decenoate | 1674 | 1622 | [28] | Ester |
| 0.80 | Methyl nonanoate * | 1480 | 1487 | [28] | Ester |
| 0.79 | 2-Methylpropyl butanoate | 1078 | 1094 | [29] | Ester |
| 0.76 | 2-Methylbutyl 2-methylbutanoate | 1301 | 1285 | [29] | Ester |
| 0.74 | Methyl decanoate | 1627 | 1592 | [28] | Ester |
| 0.73 | 2-Methylbutyl 2-methylpropanoate | 1204 | 1199 | [29] | Ester |
| 0.72 | Unknown | 1884 | Unknown | ||
| 0.71 | Unknown | 1289 | Unknown | ||
| 0.71 | 2-Methylpropyl 2-methylbutanoate | 1180 | 1178 | NIST | Ester |
| Wai-iti™ | |||||
| 0.91 | Cubenol | 2029 | 2084 | [30] | Terpene Alcohol |
| 0.86 | Humulene-1,2-epoxide | 2019 | 2071 | NIST | Terpene Oxide |
| 0.84 | Unknown | 2172 | Unknown | ||
| 0.78 | 2-Nonanol | 1548 | 1508 | [28] | Alcohol |
| 0.76 | β-Bisabolene | 1748 | 1728 | NIST | Terpene |
| 0.75 | 1-Octanol * | 1586 | 1561 | [31] | Alcohol |
| Nelson Sauvin™ | |||||
| 0.90 | S-Methyl 3-methylbutanethioate | 1242 | 1225 | NIST | Ester |
| 0.86 | 2-Dodecanone | 1686 | 1698 | NIST | Ketone |
| 0.84 | Unknown | 1232 | Unknown | ||
| 0.80 | Methyl 5-methylhexanoate | 1258 | 1247 | NIST | Ester |
| 0.76 | Unknown | 1795 | |||
| 0.72 | n-Propyl-2-methylpropanoate | 1035 | 1054 | [32] | Ester |
| Wakatu | |||||
| 0.97 | β-Eudesmol | 2143 | 2188 | [33] | Terpene Alcohol |
| 0.93 | 2-Ethyl-1-hexanol | 1519 | 1491 | NIST | Alcohol |
| 0.93 | γ-Elemene | 1672 | 1625 | [34] | Terpene |
| 0.91 | Germacrene B | 1846 | 1819 | NIST | Terpene |
| 0.89 | α-Eudesmol | 2138 | Terpene Alcohol | ||
| Kohatu® | |||||
| 0.86 | Heptyl 2-methylpropanoate | 1474 | 1433 | [35] | Ester |
| 0.85 | Unknown | 1276 | Unknown | ||
| 0.76 | Unknown | 1567 | Unknown | ||
| 0.72 | 1-Heptanol | 1486 | 1453 | NIST | Alcohol |
| 0.71 | 1-Octanol * | 1586 | 1561 | [31] | Alcohol |
| Waimea™ | |||||
| 0.91 | 2-Undecanol | 1732 | 1723 | [36] | Alcohol |
| −0.72 | 2-Undecanone | 1589 | 1598 | NIST | Ketone |
| Motueka™ | |||||
| −0.71 | γ-Muurolene | 1719 | 1681 | [31] | Terpene |
| −0.77 | Caryophyllene | 1639 | 1595 | NIST | Terpene |
| Taiheke® | |||||
| 0.90 | Geranyl acetate * | 1770 | 1756 | [31] | Terpene Ester |
Publisher’s Note: MDPI stays neutral with regard to jurisdictional claims in published maps and institutional affiliations. |
© 2021 by the authors. Licensee MDPI, Basel, Switzerland. This article is an open access article distributed under the terms and conditions of the Creative Commons Attribution (CC BY) license (http://creativecommons.org/licenses/by/4.0/).
Share and Cite
Purdy, V.; Kebede, B.; Beatson, R.; Templeton, K.; Silcock, P.; Eyres, G.T. Differences in New Zealand Hop Cultivars Based on Their Unique Volatile Compounds: An Integrated Fingerprinting and Chemometrics Approach. Foods 2021, 10, 414. https://doi.org/10.3390/foods10020414
Purdy V, Kebede B, Beatson R, Templeton K, Silcock P, Eyres GT. Differences in New Zealand Hop Cultivars Based on Their Unique Volatile Compounds: An Integrated Fingerprinting and Chemometrics Approach. Foods. 2021; 10(2):414. https://doi.org/10.3390/foods10020414
Chicago/Turabian StylePurdy, Victoria, Biniam Kebede, Ron Beatson, Kerry Templeton, Patrick Silcock, and Graham T. Eyres. 2021. "Differences in New Zealand Hop Cultivars Based on Their Unique Volatile Compounds: An Integrated Fingerprinting and Chemometrics Approach" Foods 10, no. 2: 414. https://doi.org/10.3390/foods10020414