Stem and Calyx Identification of 3D Apples Using Multi-Threshold Segmentation and 2D Convex Hull


1
College of Engineering, Anhui Agricultural University, Hefei 230036, China
2
Anhui Province Engineering Laboratory of Intelligent Agricultural Machinery and Equipment, Hefei 230036, China
3
Institute of Artificial Intelligence, Hefei Comprehensive National Science Center, Hefei 230088, China
*
Author to whom correspondence should be addressed.
Photonics 2022, 9(5), 346; https://doi.org/10.3390/photonics9050346
Submission received: 28 March 2022
/
Revised: 11 May 2022
/
Accepted: 12 May 2022
/
Published: 15 May 2022
(This article belongs to the Special Issue Optical 3D Sensing Systems)
Abstract
:Traditional machine vision is widely used to identify apple quality, but this method finds it difficult to distinguish the apple stem and calyx from defects. To address this, we designed a new method to identify the stem and calyx of apples based on their concave shape. This method applies a fringe projection in a computer vision system of 3D reconstruction, followed by multi-threshold segmentation and a 2D convex hull technique to identify the stem and calyx. A camera and projector were used to reconstruct the 3D surface of the front half of an inspected apple. The height information for each pixel was reconstructed by a fringe projection and mathematical transformation. The 3D-reconstructed result was subjected to a multi-threshold segmentation technique and the segmentation results contained a concave feature in the curved line, representing the concave stem and calyx. The segmentation results were then subjected to a 2D convex hull technique, allowing for the identification of the stem and calyx. This method was evaluated using four groups of apples, and the proposed method is able to identify the stem and calyx with 98.93% accuracy.
1. Introduction
The apple is a popular fruit, which is rich in nutritional value and consumed worldwide. With the development of apple-growing technology and the increase in apple cultivation, global apple production has increased significantly. The consumer demand for high-quality apples has increased, and apple quality is mainly evaluated by fruit appearance [1,2]. The early detection of fruit damage is economically important, as the presence of even a single rotten or defective apple in a box of apples accelerates damage to all the apples, so the efficient removal of damaged fruit is necessary to preserve the quality of the remaining apples in the box. Low-quality apples reduce economic benefits and damage the reputation of the seller. Thus, it is essential to evaluate the appearance of apples early for optimal storage. Traditional apple grading relies on human workers who observe apples on an assembly line and select apples after visual inspection. Although somewhat effective, this method is time-consuming and has a low accuracy. Therefore, it is essential to develop an automatic system to inspect apples quickly and with high accuracy.
According to a consumer survey [3], 90% of consumers think the most important characteristic of apples is their flavor, with only a few consumers prioritizing the color, variety, or price. Bruised and blemished apples may have an altered flavor. Considering the consumer demand for apples that taste good, an effective inspection system is required to identify blemishes and bruises before the apples are distributed to markets. However, the stem and calyx regions of apples may look similar to defects on the apple’s surface, making it difficult to distinguish these regions during practical identification [4,5]. Therefore, it is critical to develop improved methods to distinguish the stem and calyx from apple surface defects. Machine vision is applied in many fields [6,7,8,9].Since the early 1990s, machine vision has been adapted for the rapid and precise identification of fruit quality [10]. Machine vision technology does not require physical contact with the apples, which reduces the risk of additional damage [11,12,13]. Machine vision has been applied to assess the quality of apples based on the color [14], size [15], and the presence of bruises [16,17,18], and size and color identification has been applied in practical production [19,20].
Many studies have explored strategies to identify surface bruises on apples. For example, Throop et al. designed a machine that can transfer apples and use a camera to photograph the stem and calyx regions [21]. However, this machine is expensive and cannot effectively differentiate between defects and the stem or calyx. Zhang et al. proposed a method to identify the stem and calyx, which relies on the formation of different spots after the projection of encoded dot-matrix structured light on the stem and calyx regions or the fruit surface [22]. Spot location changes can be used as coding primitives to produce M-dot arrays, and then the analysis of the matched difference matrix can identify the stem and calyx regions with 93.17% accuracy. Yang et al. built an imaging system using a linear structured light emitter, which detects structured light streak patterns based on structured light contours and can identify fruit stem and calyx regions [23]. Jiang et al. proposed a method to identify apple stem and calyx regions based on pattern recognition, and used vector machine, nearest neighbor classifier, decision tree, and AdaBoost classifier methods to distinguish defects from the stem and calyx regions [24]. The experimental results show that this method can identify the apple stem with a 95% correct classification rate and the calyx with a 96% correct classification rate. Zhang et al. proposed an automatic identification algorithm to identify the stem and calyx regions using an evolution-constructed feature. This method uses a near-infrared spectrum to obtain images and constructs a series of transformations by evolution-constructed features, allowing the identification of high-quality features with 94% accuracy [25]. Tian et al. used hyperspectral imaging combined with principal component analysis and neural networks to segment the stem and calyx. This model exhibited 97.8% accuracy, but the identification was slow and efficiency was low [26]. Zhang et al. used the structure of near-infrared light to reconstruct a three-dimensional model of an apple, which was compared to a standard spherical model to segment the stem and calyx, but the slow scanning speed of the line-structured light did not allow for an online assessment of apple quality [27].
These studies show significant progress, but these methods are insufficient for the rapid and accurate stem and calyx identification required for an actual production line. Mechanical positioning methods have low accuracy, because it is difficult to hold an apple steadily. Spectral identification techniques typically have high recognition accuracy, but require large amounts of data for image processing, with long processing times and high system hardware costs, making these strategies unsuitable for practical online processing. The main purpose of this work was to develop a computer vision system to identify the stem and calyx of an apple. To achieve this, a multi-threshold technique and 2D convex hull techniques were used to identify the convex and concave parts of the apple surface. The system allows for adaptations to the size and position of an apple during inspection.
The efficient identification of the stem and calyx regions requires the following sub-objectives: (1) the construction of a stem and calyx identification system (see Section 2.2); (2) the reconstruction of the 3D model of the apple to be tested (see Section 2.2 and Section 2.3); (3) the construction of a mathematical model of multi-threshold segmentation to segment the apple phase–height image, and implement a two-dimensional convex hull technique to calculate the convex hull in segmented apple phase–height segmentation images (see Section 2.4); (4) testing the recognition performance of this algorithm to identify the stem and calyx (see Section 3); (5) discussing the advantages and limitations of the method, and considering changes for future implementation (see Section 4).
2. Materials and Methods
2.1. Samples Used in the Experiments
Many types of apples are grown in China. The ‘Fuji’ apple is one of the most popular cultivars, and has good nutritional value. To test the effectiveness of this method to identify the stem and calyx regions in different apples, we purchased 60 ‘Fuji’ apples of different sizes and shapes from the local market in Hefei as experimental samples. These examples included 20 apples with defects and 40 apples without apparent defects. The apples were red and yellow in appearance, 40~80 mm in diameter, and 35–60 mm in height. To increase the randomness of samples, the apples were placed on an electric spinning plate, which moved 60° at a time, and a screw-sliding table, which moved randomly. The screw-sliding table and the electric spinning plate worked together and effectively increased the number of experimental groups, ensuring the stem and calyx regions were randomly positioned in each apple image. Then, we randomly selected five different images for each apple. This gave a total of 300 experimental groups, including 280 effective experimental groups in four categories: (a) 34 groups of apple images with defects, without an apparent stem and calyx; (b) 62 groups of apple images with defects, with an apparent stem and calyx; (c) 36 groups of apple images without defects, without an apparent stem and calyx; (d) 148 groups of apple images without defects, with an apparent stem and calyx.
2.2. Fringe Projection System
The fringe projection system, as shown in Figure 1, included a camera (Basler a2A1920-160ucBAS, Basler AG, Ahrensburg, Germany), a projector (DLP Light-Crafter 4500, Texas Instruments, Dallas, TX, USA), a screw-sliding table, an electric spinning plate, and a computer. The resolution of the camera was 1920 × 1200 pixels, the focal length of the lens was 8 mm, and the effective formation of the slide rail was 300 mm. The angle between the camera and the projector was approximately 30°, the optical center of the camera and projector was parallel to the reference plane, and imaging occurred with the apple 0.4~0.5 m in front of the field of view. The electric spinning plate was fixed to a screw-sliding table and rotated in the plane of operation, while the reciprocating screw-sliding table moved along the slide rail in the direction of the y-axis.
The principle of the fringe projection system is shown in Figure 2. This widely-used technique is based on the use of structured illumination for an optical three-dimensional shape measurement. First, fringes were projected onto the surface of the object by the projector. Fringes were deformed by passage through the object’s height modulation, capturing the height information of the object. The image information was transferred into a computer and the phase–height of the object could be reconstructed by an analysis of the fringes.
As shown in Figure 2, point C represents the optical center of the projector and point D represents the optical center of the camera. Line CD is parallel to the reference plane, the camera optic axis is perpendicular to the reference plane, and the distance from the optical center of the camera to the reference plane is l. For point H, a random point on the surface of the object, the distance from this point to the reference plane is h, and the lines connecting the optical center of the camera and the optical center of the projector intersect the reference plane at points A and B, respectively [28,29]. The mathematical expression of the fringe image taken by the camera was:
where and are the spatial coordinates; is the average intensity; is the intensity modulation; is the spatial frequency along the x-axis direction; and represents the initial phase. Assuming the phases at points B and H were:
The phase difference between point H and point B was:
To the similar triangles and point B, we knew that:
Therefore, the phase–height mapping relationship to the measured object could be calculated as:
2.3. Height Measurement
The phase-shift method can measure three-dimensional images with advantages of good stability and high accuracy. Here, a five-step phase shift was used to solve the phase of the fringe. The general mathematical expression of the intensity of every point in the phase-shift fringe is:
where represents the number of phase-shift steps; ; ; represents the phase shift, and is the phase to be determined, which was calculated as:
The value of , calculated by Equation (9), is limited at , so is also known as the wrapped phase. This requires the unwrapping of the phase to calculate the absolute phase :
where k represents the integer fringe orders. Here, we used a three-frequency method of high, medium, and low frequency to unwrap the wrapped phase.
The low-frequency fringe contained only one period, so the low-frequency wrapped phase did not require phase unwrapping to obtain the low-frequency absolute phase B, i.e., = . Based on the mathematical proportionality between the low-frequency absolute phase , the medium-frequency absolute phase , and the high-frequency absolute phase , the fringe levels corresponding to the medium-frequency wrapped phase and the high-frequency wrapped phase could be calculated as follows ( and ):
where Round[] denotes rounding to the closest integer value; , , and represent the frequencies of the high-frequency fringes, the medium-frequency fringes, and the low-frequency fringes, respectively. In turn, it could be calculated that:
2.4. Stem and Calyx Identification
As described earlier, a real-time apple inspection system requires the ability to distinguish the stem and calyx from true defects. In our approach, we considered the surface of an apple to be composed of both convex and concave parts. The concave parts were usually around the stem or calyx, and the convex parts were nearly spherical, so our approach was to try to identify the concave parts on the apple’s surface. We assumed that the stem and calyx always appeared in the center of a concave surface and that a bruise always appeared on a convex surface, so to distinguish the stem and calyx regions, we tried to identify concave surfaces.
As shown in Figure 2, we obtained the phase–height image of each apple by a fringe projection and 3D reconstruction technique. After 3D reconstruction to generate the image of the apple, we next performed a multi-threshold segmentation to segment the 3D reconstruction. First, as shown in Equation (15), we calculated the segmentation spacing h from the height maximum and minimum values of the phase–height image.
where h denotes the segmentation spacing between adjacent segmentation layers; represents the maximum value of the phase–height image; represents the minimum value of the phase–height image; N represents the number of layers of segmentation of the phase–height image, the most important multi-threshold parameter in this approach.
After the determination of the segmentation range and segmentation spacing h, we next segmented between the maximum and minimum values to generate N equally spaced layers. Then, we selected an optimum number of layers (N) to segment the phase–height image and obtain all segmented images. Figure 3 shows a schematic diagram illustrating the multi-threshold segmentation for N equal to six layers. The positions of the blue lines indicate the layers which were segmented. Each segmentation layer was parallel and equally spaced. Equation (16) shows the calculation principle for the segmentation of the phase–height image.
where ; represents the segmentation result.
After obtaining the segmentation result, all layers were next processed with the 2D convex hull technique. Figure 4 shows the selection of an optimal threshold number of layers (N = 120) to segment a phase–height image. Using the 2D convex hull technique, we processed all segmentation results to obtain the 2D convex hull (Qn) data. As shown in Figure 5a, compared to the segmentation result (Pn), the 2D convex hull result (Qn) better filled the concave feature. Using the algorithm, we could easily separate concave and convex features. The concave feature information (Dn) was obtained by subtracting the 2D convex hull data (Qn) from the segmentation information (Pn) to obtain the concave features (Dn) of the apple. Using Equation (17), the concave features were identified using the 2D convex hull algorithm:
where Dn is the concave feature; Qn is the 2D convex hull result.
By segmenting the reconstruction results and then calculating the 2D convex hull of the segmentation results, we obtained the concave features in all layers. We then processed Dn and the edge of the apple image to identify the stem and calyx in the image. The specific Equation (18) was as follows:
S in Equation (18) represents the outer contour edge curve of the apple image region; R represents the identified stem or calyx.
To explain this approach more intuitively, we illustrate the multi-threshold segmentation technique, 2D convex hull technique, and algorithm process in Figure 5. As shown in Figure 5b, we used multi-threshold segmentation to segment the 3D-reconstructed result. The colored lines in (b) represent part of the segmentation region. The lines on the 3D reconstruction were exactly parallel and equally spaced. The lines on the convex surface were parabolic, and their curvature directions were maintained, but the lines on the concave surface were more complex. Adjacent lines may have been obscured due to sharp changes in depth. As shown in Figure 5c, we used a 2D convex hull technique to calculate the convex hull of the segmentation result, thereby obtaining smoother and more continuous lines. Figure 5d shows the superposition results of all concave features and (e) shows the identification of the stem and calyx.
3. Results
3.1. Assessment of Method Accuracy
In order to assess the efficiency of this identification method, we developed two rules for the identification of the apple stem and calyx, and tested the method on 280 apple images. We introduced a connected component to determine whether the stem and calyx were detected. Connected components greater than 1000 pixels were considered images with accurately identified stem and calyx regions, while connecting components less than 1000 pixels indicated that the images contained no stem and calyx regions. After confirming the detection of the stem and calyx, we judged whether the stem and calyx regions were located in the center or at the edge of the apple image, and classified the results based on the Euclidean distance between the center of the stem and calyx regions and the nearest edge. For a Euclidean distance greater than 100, the stem and calyx were considered to be located in the center of the apple image, while a distance of less than 100 indicated that the stem and calyx were located on the edge of the apple image.
3.2. Identify Results
To evaluate the effectiveness of the method, 280 apple images were imported into the MATLAB R2021a software platform, and typical results are displayed in Figure 6. The first column of each group shows the original image of an apple; the second column of each group shows the result of the stem and calyx identification, where the stem and calyx regions have a lower gray value than the surface region of the apple; the third column shows the 2D convex hull subtraction diagram; and the fourth column shows the identification of the stem and calyx regions located in the center or near the edge of the images. The average processing time was 0.353 s, so approximately three apples were analyzed per second. The average stem and calyx identification rates were calculated as 97.06%, 100.00%, 100.00%, and 98.65% for groups ①, ②, ③, and ④, respectively (Table 1).
The results showed that 2 out of the 184 images of apples without defects were misidentified and 1 out of 96 apple images with defects was misidentified. As shown in Figure 6, independent of whether an image contained the stem and calyx, this method was accurate for the analysis of the reconstructed images. The results showed that this identification method improved the identification rate.
4. Discussion
In our experiment, we tested 280 apple images. Using the lead screw-sliding table and the electric spinning plate, we simulated an actual detection environment. Compared to previous methods described in the Introduction, our method was more accurate. Some strategies have been accurate, so the accuracy of those methods cannot be directly compared with the analysis of a single apple at a time, which was performed here. Some modifications may be required to apply this strategy for production line detection. The projector and camera in our detection platform could start automatically and synchronously, for a convenient system.
This study was the first application of multi-threshold segmentation and 2D convex hull techniques to identify stem and calyx regions. The image analysis software may have not been able to accurately distinguish between surface bruises and the apple stem and calyx, so an improved process is needed for apple grading. The method developed here allowed the accurate identification of the stem and calyx regions, with only 3 out of 280 apple images inaccurately identified. These results showed that this method was an effective way to abstract the stem and calyx areas of the apple, but it depended on the appropriate selection of the value of N. We tested different values of N in the range of 5 to 500, and after many experiments, N of 120 was selected as the best threshold to identify the stem and calyx to balance identification time and error, as shown in Figure 7. The stem and calyx regions were not correctly identified for N values of less than or equal to 10. A value of N of 120 gave an optimal identification, but different values may be required for different samples or different applications. For N values bigger than or equal to 300, the stem and calyx regions were identified, but deeper bruises and edges could be misidentified as stem and calyx regions. Future work should focus on the determination of the best threshold value for this method to accurately identify the stem and calyx regions, and to identify surface bruises.
Even with an appropriate N selection, there were still some incidents of false identification. In one case, a shadow on the surface of the apple interfered with the reconstruction, leading to an inaccurate result. As shown in Figure 8, cavities in the reconstructed result corresponding to the stem appear dark in color, as do surface blemishes. The identification system filled the cavities, but the effect of shadows was not completely eliminated, so the filled region still differed from the curved features of the apple. The system may misidentify filled areas as stem and calyx regions because the multi-threshold and 2D convex hull techniques are sensitive to non-surface features.
In a second example of misidentification, the stem and calyx were located in the dead center of the projection. This area was obscured by shadows, preventing the complete reconstruction and identification of the stem and calyx. One way to address this problem would be to optimize the direction of projection and adjust the placement of the apple using a mechanical device. The proposed method shared the limitation of conventional camera identification in that only the upper part of the apple was imaged. For improved identification, rotating an apple at a certain angle using an electric spinning plate and combining multiple images should allow for a better stem and calyx identification to meet the requirements of industrial application.
Imaging could also be complicated if severe water loss caused blackened regions of apple rot. Blackened areas would present a sharp contrast with the undamaged peel. In this case, rotten fruit can be identified using an algorithm.
5. Conclusions
We developed a method for stem and calyx identification based on a fringe projection. This method used a phase-shift fringe projection based on the concave characteristics of the stem and calyx and solved the convex hull in the concave region of an apple phase–height map in a hierarchical way by a digital transformation and graphical algorithm, followed by analyzing the phase difference map before and after processing. A total of 280 apple images was analyzed, and the results showed that this method could effectively identify the stem and calyx regions of apples with an overall correct identification rate of 98.93%. This method can reduce the potential interference of the stem and calyx regions for an improved identification of defects. Compared with the existing stem and calyx identification methods, the method developed here exhibited an improved accuracy for an improved assessment of the apple stem and calyx.
Author Contributions
Conceptualization, Y.W.; methodology, M.X.; software, M.X.; validation, J.C.; formal analysis, H.Z.; investigation, H.Z.; supervision, L.L.; project administration, L.L.; funding acquisition, L.L.; data curation, J.C.; writing—original draft preparation, M.X.; writing—review and editing, L.L., Y.W. and H.Z.; visualization, J.C. All authors have read and agreed to the published version of the manuscript.
Funding
This work was supported by the Collaborative Innovation Project of Universities in Anhui Province (GXXT-2021-032), the Natural Science Foundation of Anhui Province (2008085QF318), and The University Synergy Innovation Program of Anhui Province (202004h07020009).
Institutional Review Board Statement
Not applicable.
Informed Consent Statement
Not applicable.
Data Availability Statement
Not applicable.
Acknowledgments
The authors would like to thank the Natural Science Foundation of Anhui.
Conflicts of Interest
The authors declare that they have no known competing financial interests or personal relationships that could have appeared to influence the work reported in this paper.
References
- Blasco, J.; Aleixos, N.; Moltó, E. Computer vision detection of peel defects in citrus by means of a region oriented segmentation algorithm. J. Food Eng. 2007, 81, 535–543. [Google Scholar] [CrossRef]
- Brosnan, T.; Sun, D.-W. Inspection and grading of agricultural and food products by computer vision systems—A review. Comput. Electron. Agric. 2002, 36, 193–213. [Google Scholar] [CrossRef]
- Ricks, D.J.; Sterns, J.A.; Woods, T.A. Customer preferences for michigan apples: A case example of a market research program for a commodity industry. J. Food Distrib. Res. 2002, 33, 125–135. [Google Scholar]
- Unay, D.; Gosselin, B.; Kleynen, O.; Leemans, V.; Destain, M.-F.; Debeir, O. Automatic grading of Bi-colored apples by multispectral machine vision. Comput. Electron. Agric. 2011, 75, 204–212. [Google Scholar] [CrossRef] [Green Version]
- Unay, D.; Gosselin, B. Stem and calyx recognition on ‘Jonagold’ apples by pattern recognition. J. Food Eng. 2007, 78, 597–605. [Google Scholar] [CrossRef]
- Gladju, J.; Kamalam, B.S.; Kanagaraj, A. Applications of data mining and machine learning framework in aquaculture and fisheries: A review. Smart Agric. Technol. 2022, 2, 100061. [Google Scholar] [CrossRef]
- Lopes, B.D.; Silva, L.C.; Blanquet, I.M.; Georgieva, P.; Marques, C.A. Prediction of fish mortality based on a probabilistic anomaly detection approach for recirculating aquaculture system facilities. Rev. Sci. Instrum. 2021, 92, 025119. [Google Scholar] [CrossRef]
- Silva, L.C.; Lopes, B.; Pontes, M.J.; Blanquet, I.; Segatto, M.E.; Marques, C. Fast decision-making tool for monitoring recirculation aquaculture systems based on a multivariate statistical analysis. Aquaculture 2021, 530, 735931. [Google Scholar] [CrossRef]
- Silva, L.C.B.D.; Lopes, B.D.M.; Blanquet, I.M.; Marques, C.A.F. Gaussian Distribution Model for Detecting Dangerous Operating Conditions in Industrial Fish Farming. Appl. Sci. 2021, 11, 5875. [Google Scholar] [CrossRef]
- Lu, Y.; Lu, R. Detection of Surface and Subsurface Defects of Apples Using Structured- Illumination Reflectance Imaging with Machine Learning Algorithms. Trans. ASABE 2018, 61, 1831–1842. [Google Scholar] [CrossRef]
- Zhang, B.; Huang, W.; Li, J.; Zhao, C.; Fan, S.; Wu, J.; Liu, C. Principles, developments and applications of computer vision for external quality inspection of fruits and vegetables: A review. Food Res. Int. 2014, 62, 326–343. [Google Scholar] [CrossRef]
- Dananjayan, S.; Tang, Y.; Zhuang, J.; Hou, C.; Luo, S. Assessment of state-of-the-art deep learning based citrus disease detection techniques using annotated optical leaf images. Comput. Electron. Agric. 2022, 193, 106658. [Google Scholar] [CrossRef]
- Zhuang, J.; Luo, S.; Hou, C.; Tang, Y.; He, Y.; Xue, X. Detection of orchard citrus fruits using a monocular machine vision-based method for automatic fruit picking applications. Comput. Electron. Agric. 2018, 152, 64–73. [Google Scholar] [CrossRef]
- Zou, X.; Zhao, J.; Li, Y. Apple color grading based on organization feature parameters. Pattern Recognit. Lett. 2007, 28, 2046–2053. [Google Scholar] [CrossRef]
- Zou, X.; Zhao, J. On-line detecting size and color of fruit by fusing information from images of three color camera systems. In Proceedings of the International Conference on Computer and Computing Technologies in Agriculture, Beijing, China, 18–20 October 2008; pp. 1087–1095. [Google Scholar]
- Unay, D.; Gosselin, B. Automatic defect segmentation of ‘Jonagold’ apples on multi-spectral images: A comparative study. Postharvest Biol. Technol. 2006, 42, 271–279. [Google Scholar] [CrossRef]
- Zou, X.-B.; Zhao, J.-W.; Li, Y.; Holmes, M. In-line detection of apple defects using three color cameras system. Comput. Electron. Agric. 2010, 70, 129–134. [Google Scholar] [CrossRef]
- Lu, Y.; Lu, R.; Zhang, Z. Detection of subsurface bruising in fresh pickling cucumbers using structured-illumination reflectance imaging. Postharvest Biol. Technol. 2021, 180, 111624. [Google Scholar] [CrossRef]
- Kleynen, O.; Leemans, V.; Destain, M.-F. Selection of the most efficient wavelength bands for ‘Jonagold’ apple sorting. Postharvest Biol. Technol. 2003, 30, 221–232. [Google Scholar] [CrossRef] [Green Version]
- Kleynen, O.; Leemans, V.; Destain, M.F. Development of a multi-spectral vision system for the detection of defects on apples. J. Food Eng. 2005, 69, 41–49. [Google Scholar] [CrossRef] [Green Version]
- Throop, J.; Aneshansley, D.; Anger, W.; Peterson, D. Quality evaluation of apples based on surface defects: Development of an automated inspection system. Postharvest Biol. Technol. 2005, 36, 281–290. [Google Scholar] [CrossRef]
- Zhang, Z.; Chen, L.; Huang, W.Q.; Guo, Z.M.; Wang, Q.Y. On-line Identification of Apple Stem-end/Calyx Based on Coded Spot-array Structured Light. Soc. Agric. Mach. 2015, 46, 1–9. (In Chinese) [Google Scholar]
- Yang, Q. Finding stalk and calyx of apples using structured lighting. Comput. Electron. Agric. 1993, 8, 31–42. [Google Scholar] [CrossRef]
- Jiang Yinu, X.C. On apple quality grade identification based on machine vision. Comput. Appl. Softw. 2010, 27, 99–101. (In Chinese) [Google Scholar]
- Zhang, D.; Lillywhite, K.D.; Lee, D.-J.; Tippetts, B.J. Automated apple stem end and calyx detection using evolution-constructed features. J. Food Eng. 2013, 119, 411–418. [Google Scholar] [CrossRef]
- Tian, Y.; Cheng, Y.; Wang, X.Q. Recognition method of insect damage and stem/calyx on apple based on hyperspectral imaging. Trans. Chin. Soc. Agric. Eng. 2015, 31, 325–331. (In Chinese) [Google Scholar]
- Zhang, B.; Huang, W.; Wang, C.; Gong, L.; Zhao, C.; Liu, C.; Huang, D. Computer vision recognition of stem and calyx in apples using near-infrared linear-array structured light and 3D reconstruction. Biosyst. Eng. 2015, 139, 25–34. [Google Scholar] [CrossRef]
- Lu, Y.; Lu, R. Development of a Multispectral Structured Illumination Reflectance Imaging (SIRI) System and Its Application to Bruise Detection of Apples. Trans. ASABE 2017, 60, 1379–1389. [Google Scholar] [CrossRef]
- Wang, Y.; Liu, L.; Wu, J.; Song, X.; Chen, X.; Wang, Y. Dynamic three-dimensional shape measurement with a complementary phase-coding method. Opt. Lasers Eng. 2020, 127, 105982. [Google Scholar] [CrossRef]
Figure 1.
Schematic illustration of fringe projection system.
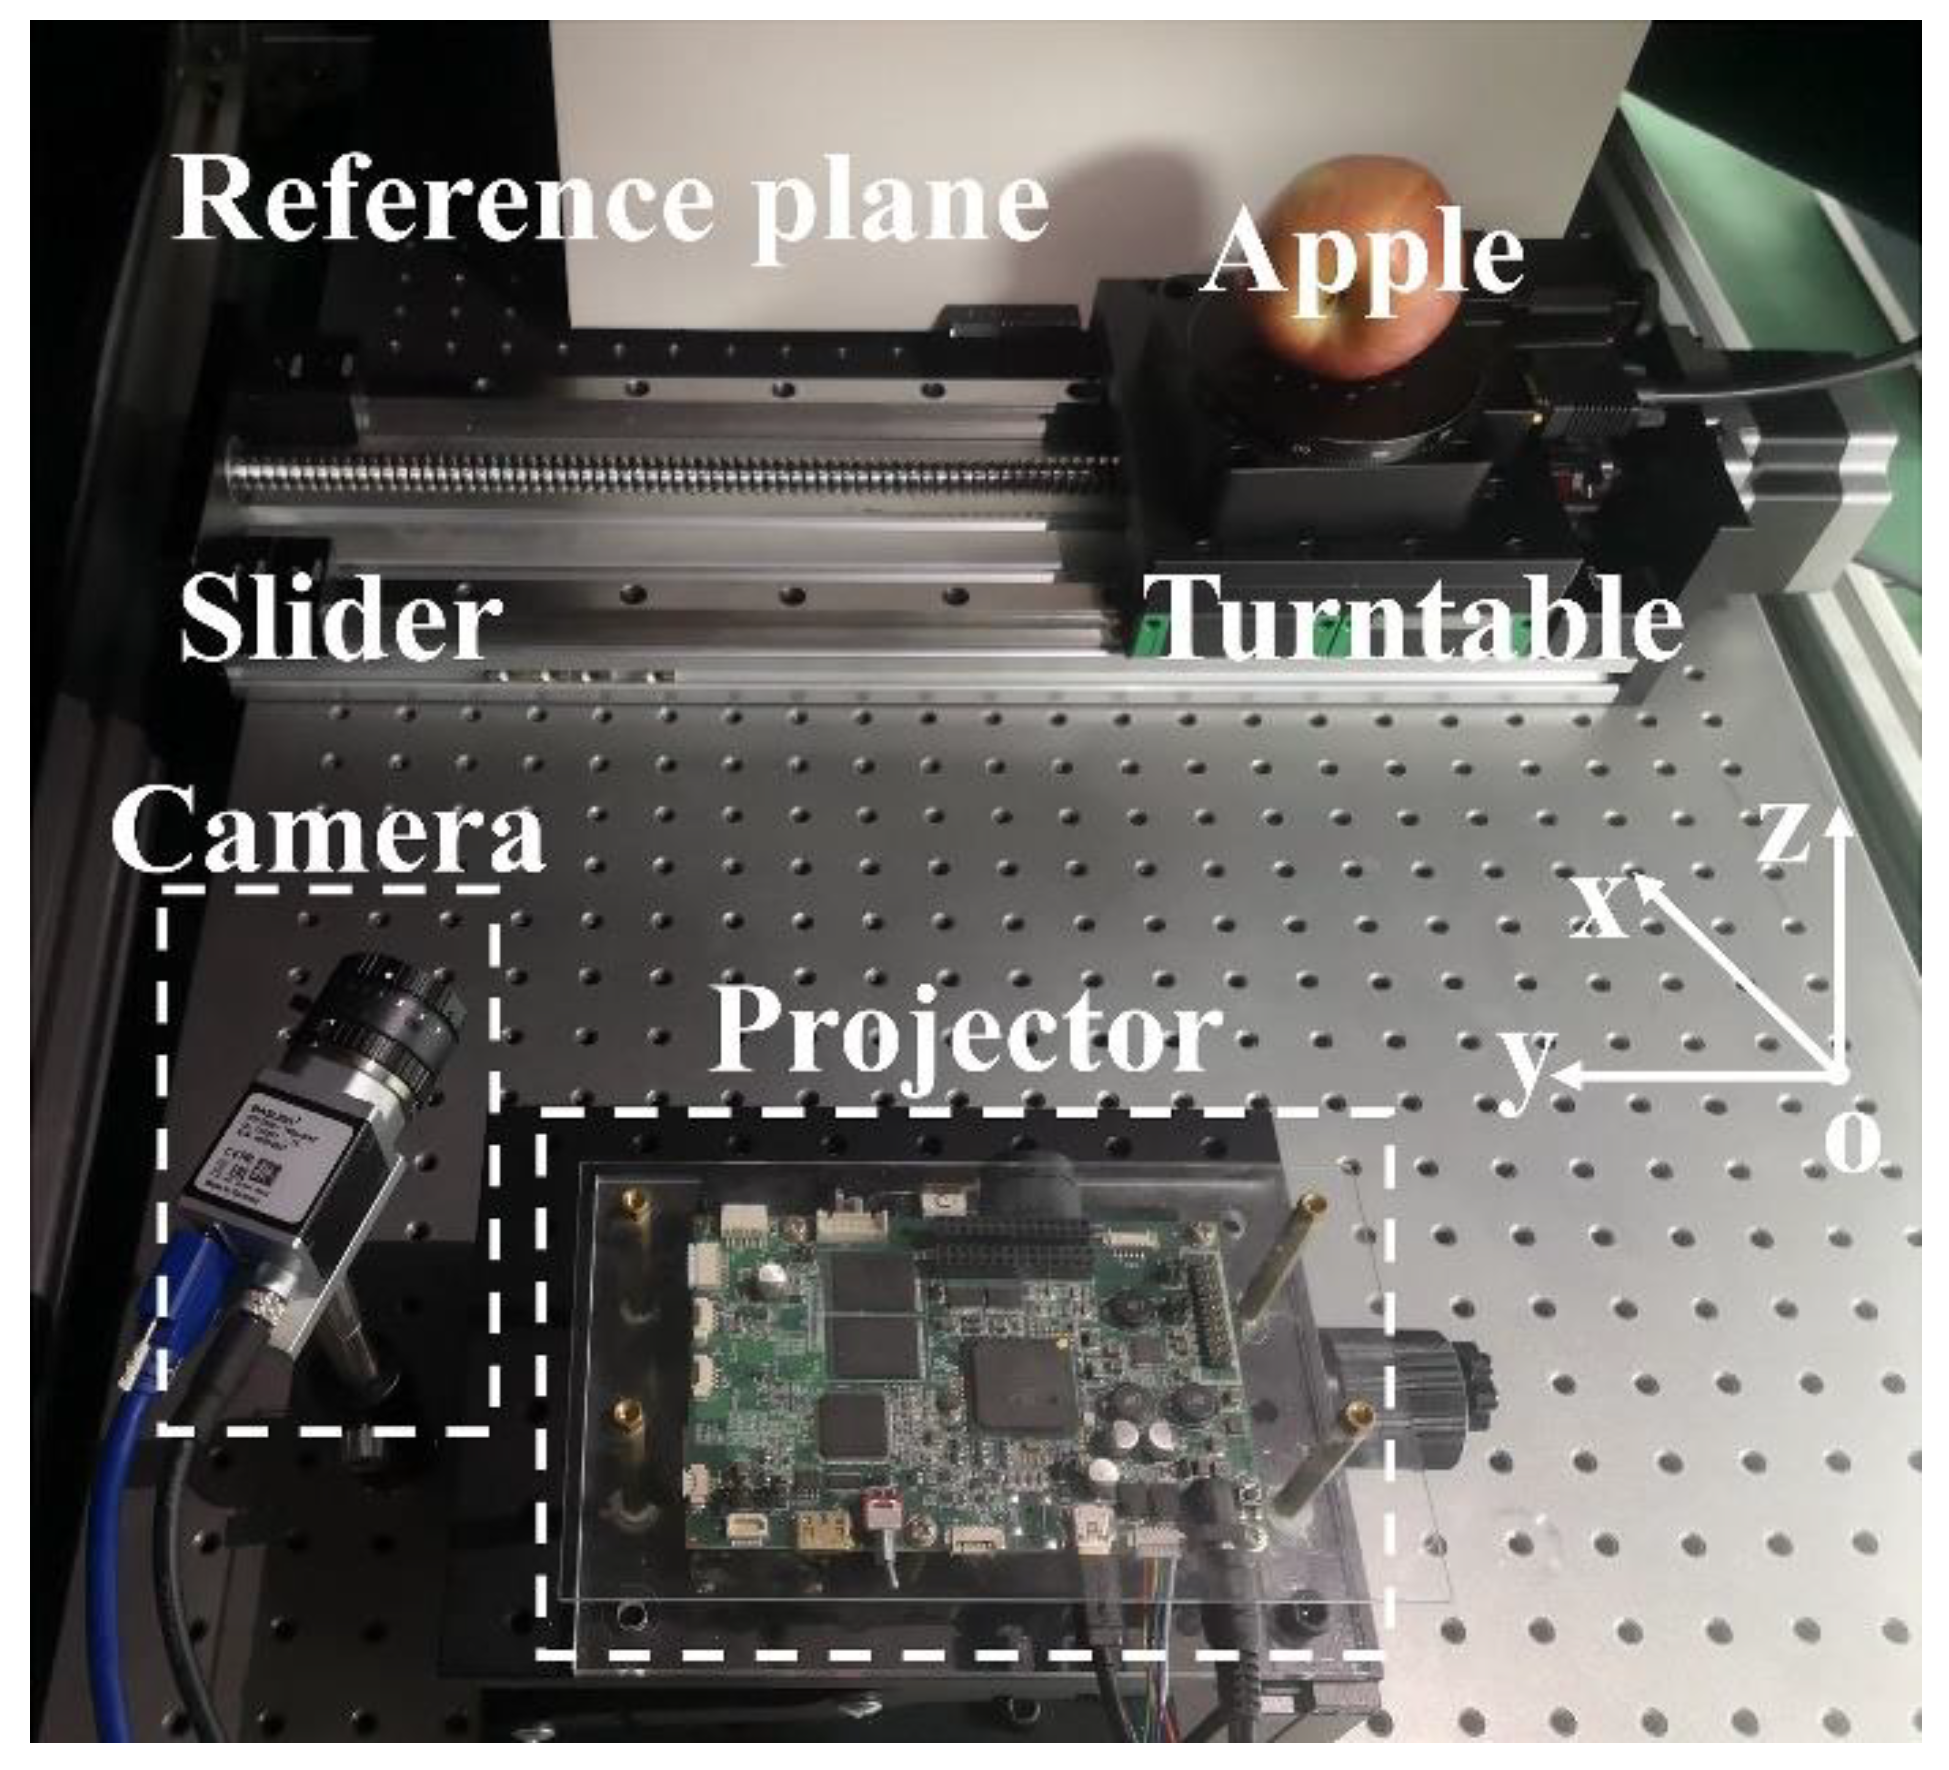
Figure 2.
Schematic diagram of the system.
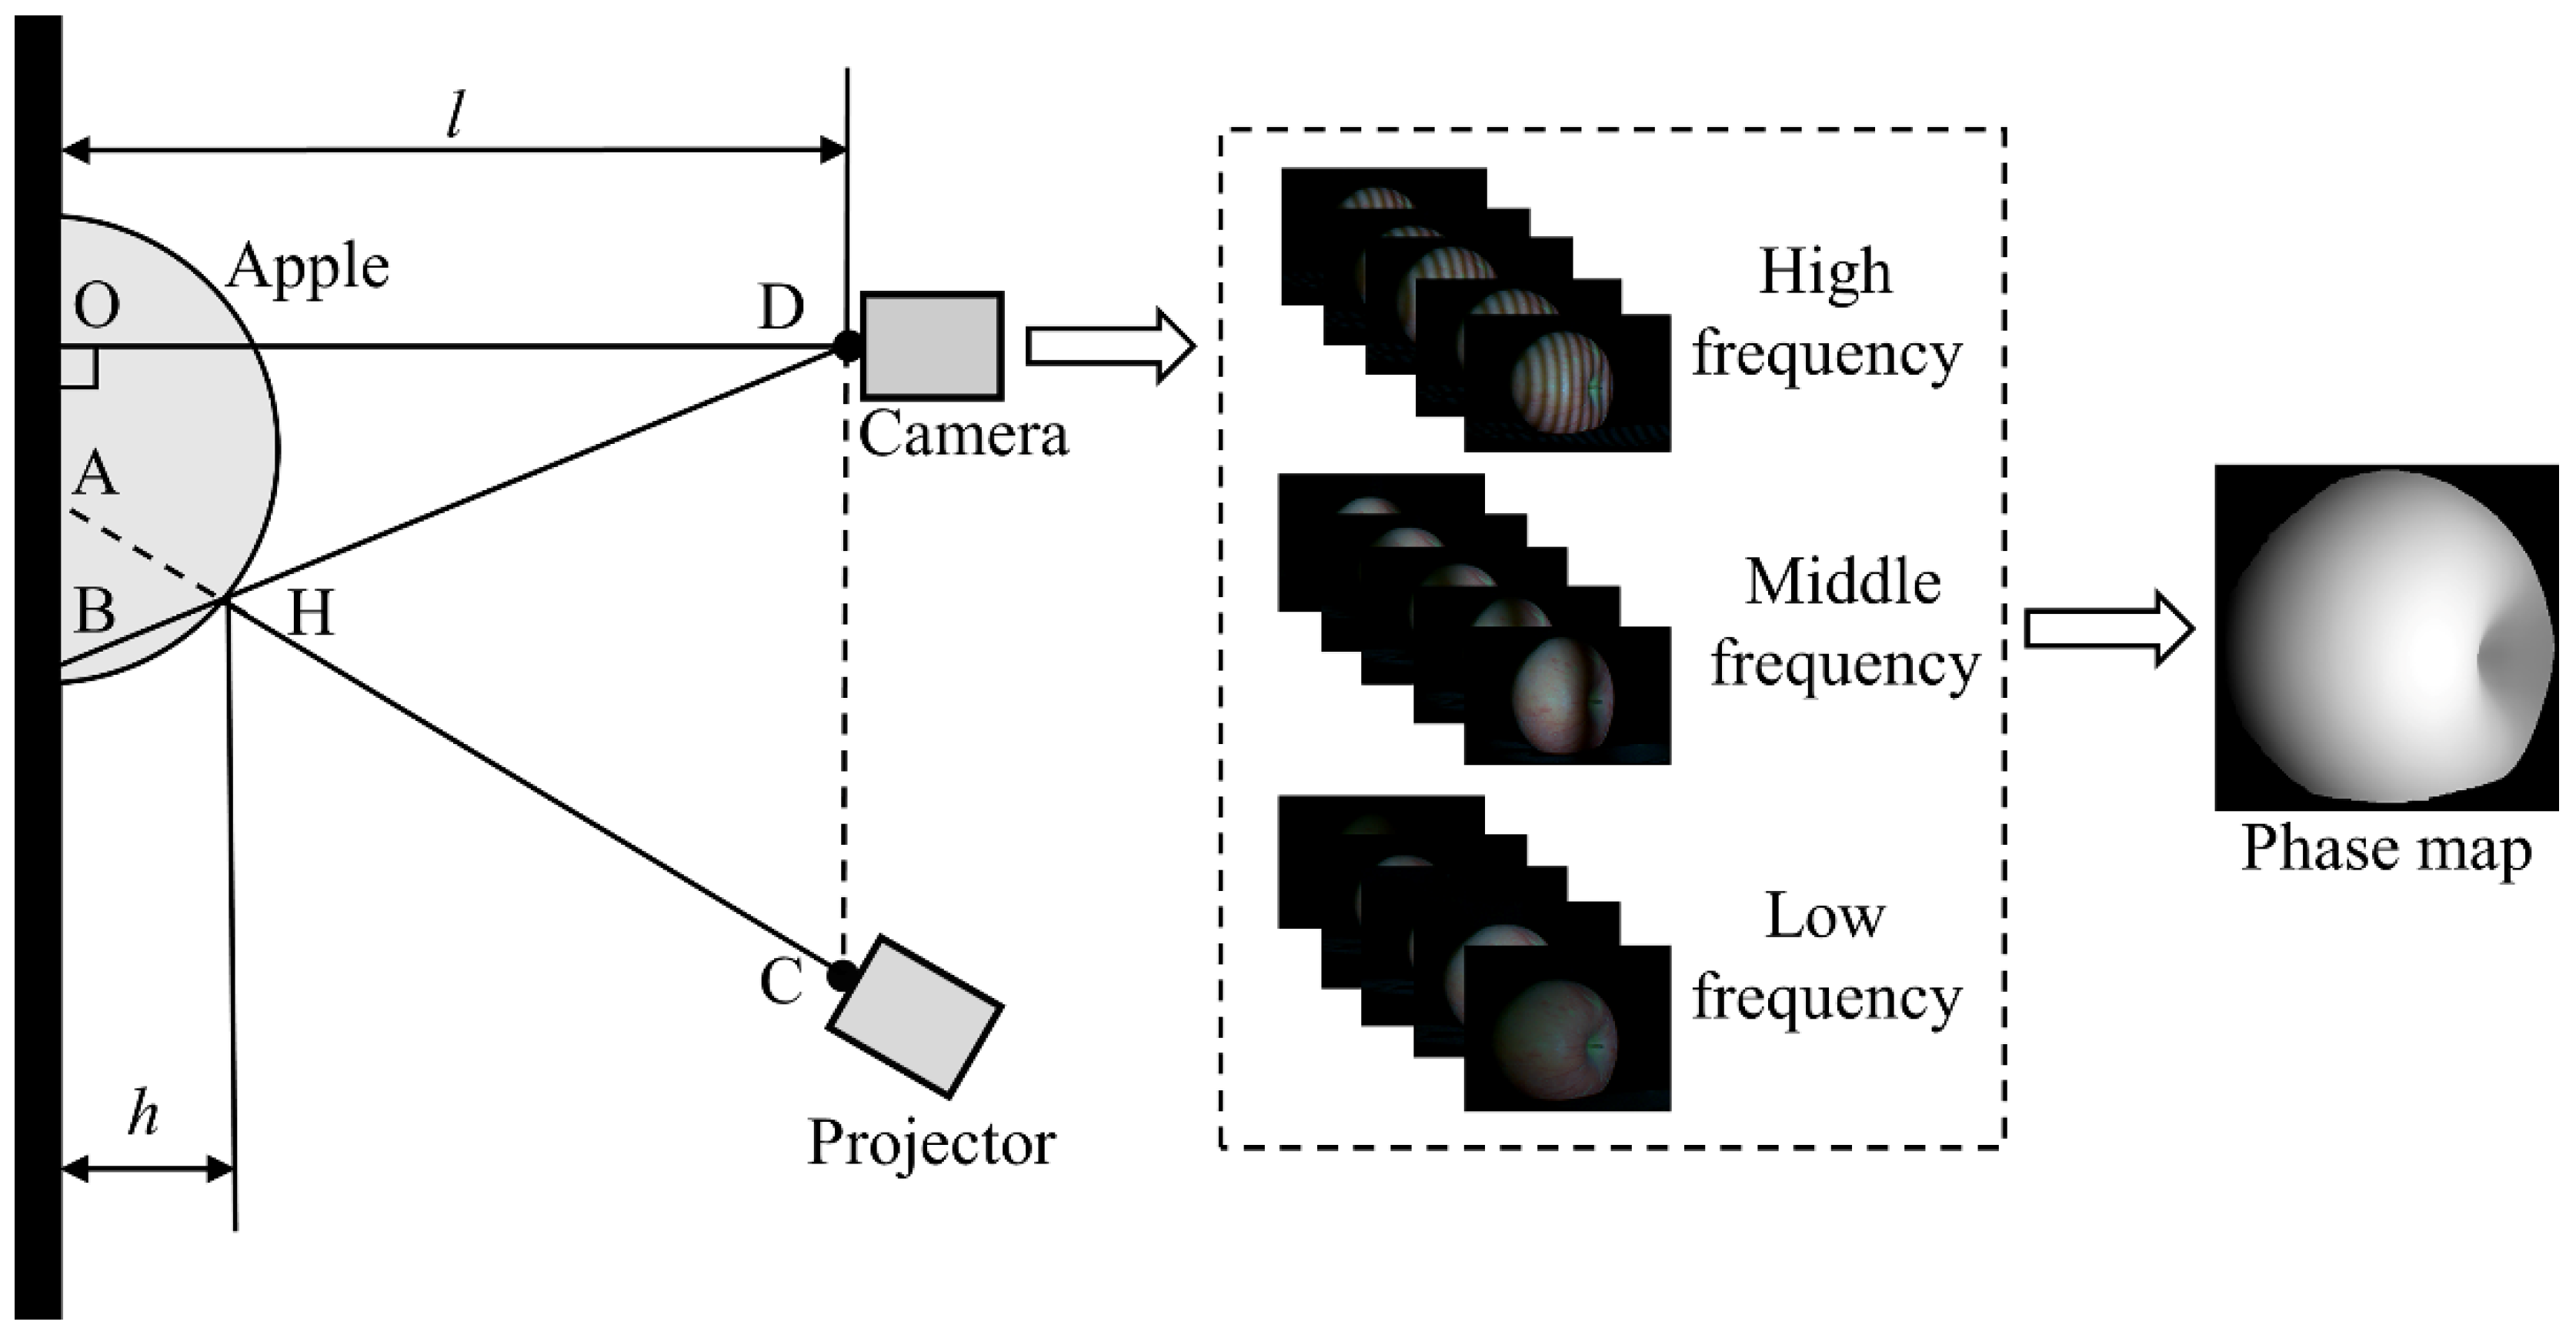
Figure 3.
Demonstration of multi-threshold hierarchical processing. (a) Segmented three-dimensional image; (b) generalized segmented schematic.
Figure 3.
Demonstration of multi-threshold hierarchical processing. (a) Segmented three-dimensional image; (b) generalized segmented schematic.
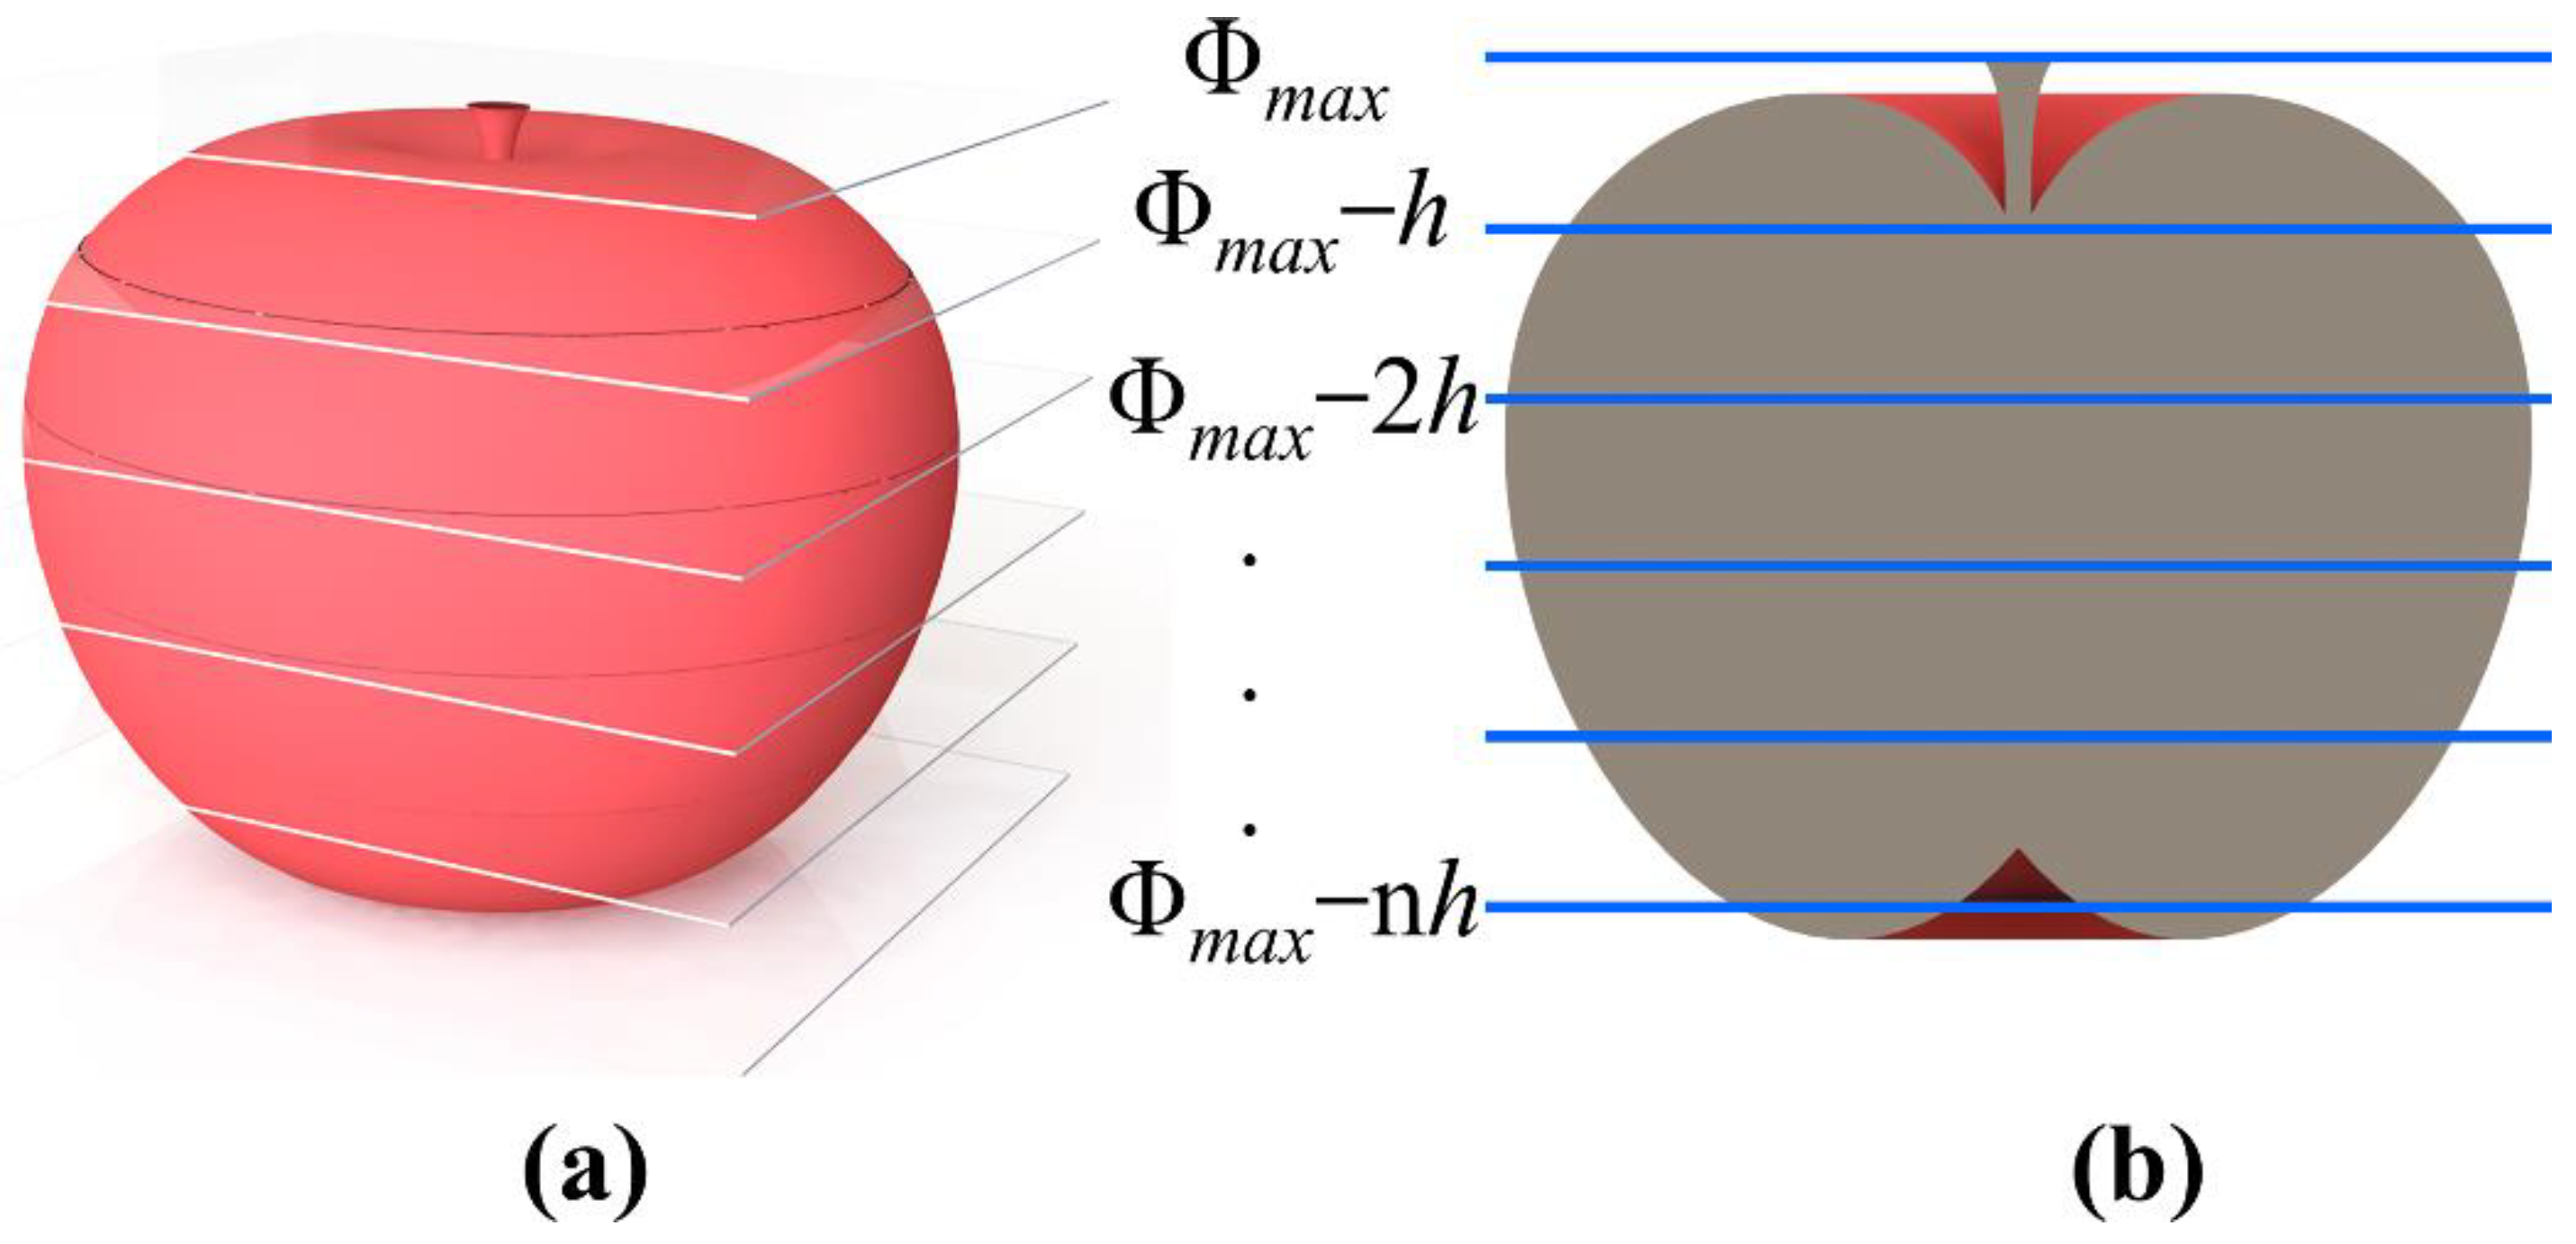
Figure 4.
The principle of solving the 2D convex hull. (a) Results of 2D convex hull results; (b) segmentation of the uncalculated portion of the convex hull; (c) the subtraction result.
Figure 4.
The principle of solving the 2D convex hull. (a) Results of 2D convex hull results; (b) segmentation of the uncalculated portion of the convex hull; (c) the subtraction result.

Figure 5.
Schematic diagram of system to identify the stem and calyx. (a) Three-dimensional reconstruction result; (b) schematic of segmented lines and segmented results; (c) presentation of convex hull wire and 2D convex hull filled result; (d) superimposed results; (e) stem and calyx identification.
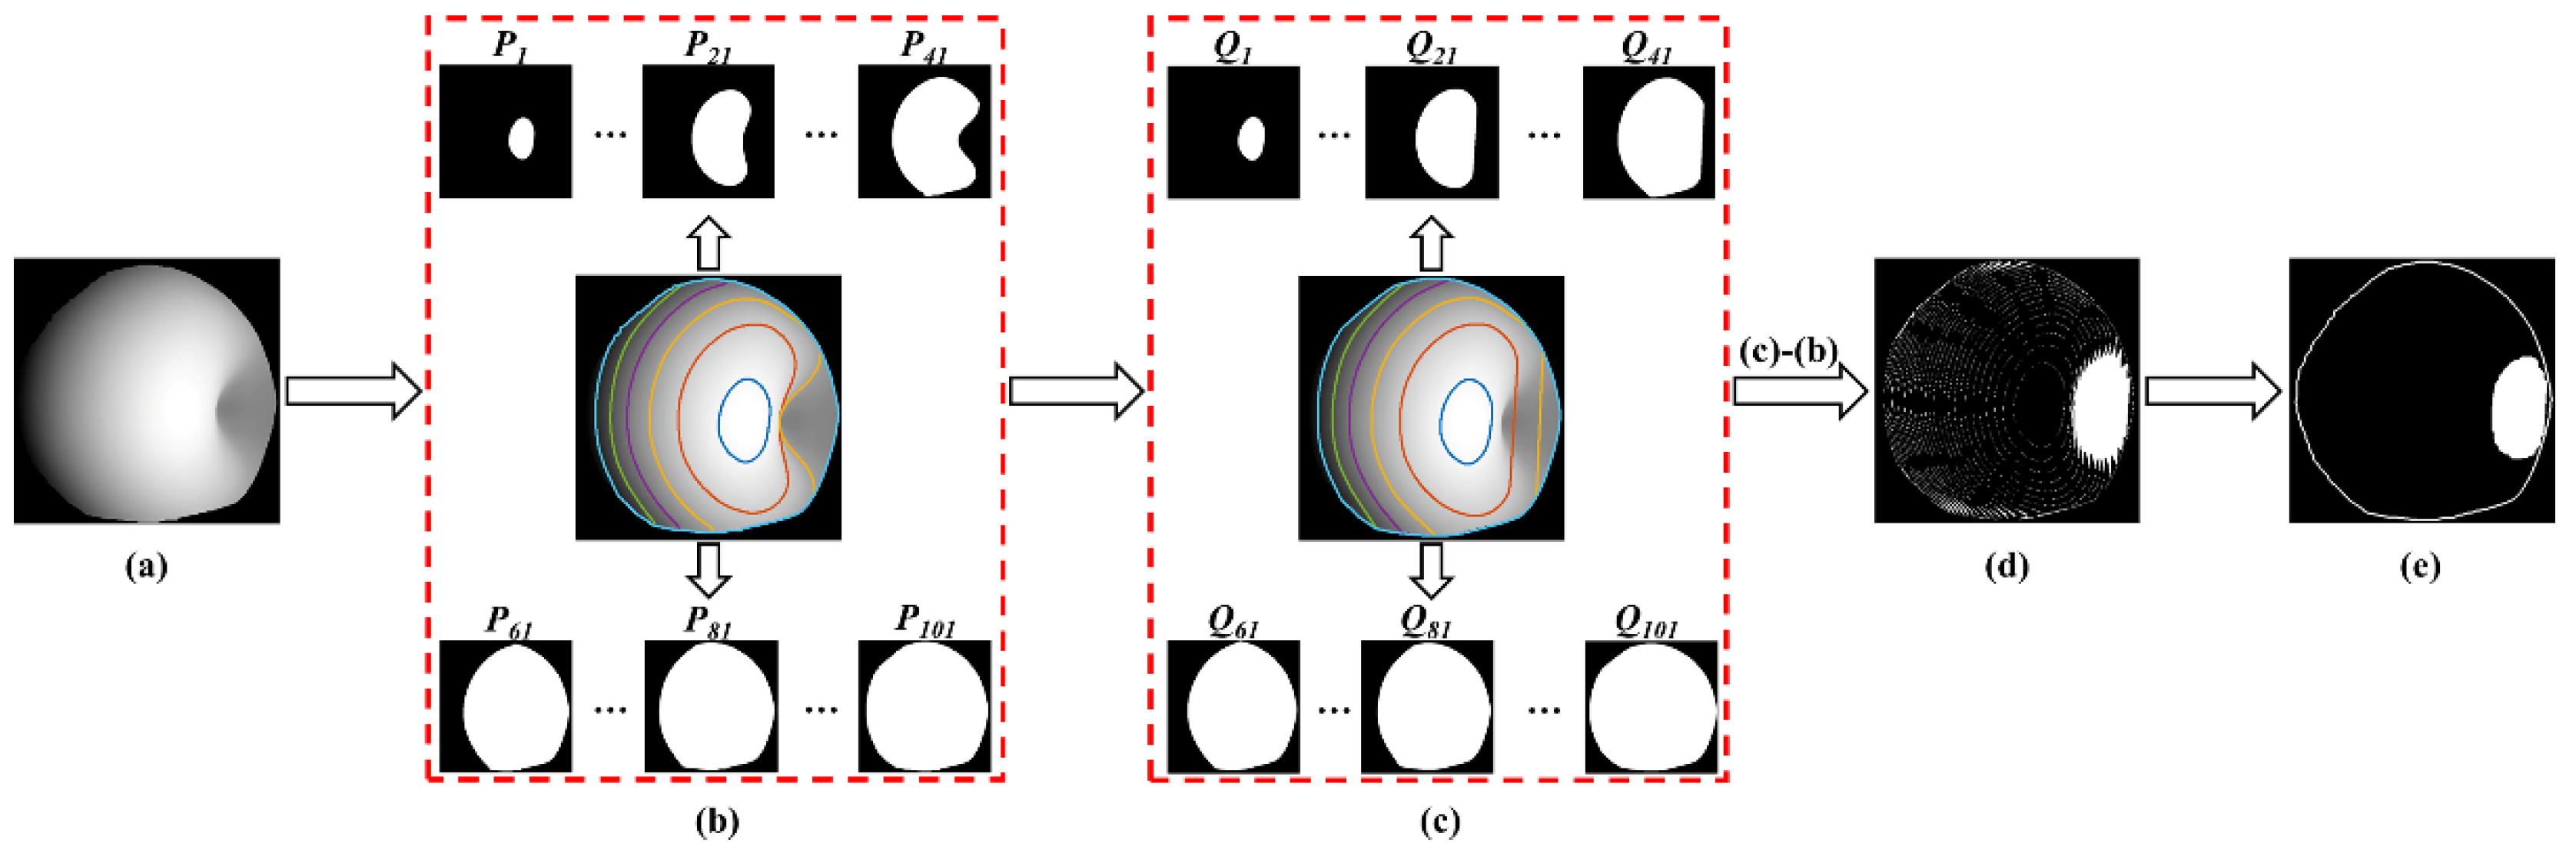
Figure 6.
Stem and calyx recognition results. (a) Apple images with defects but no apparent stem and calyx; (b) apple images with defects and detected stem and calyx; (c) apple images without defects and no apparent stem and calyx; (d) apple images with defects and detected stem and calyx.
Figure 6.
Stem and calyx recognition results. (a) Apple images with defects but no apparent stem and calyx; (b) apple images with defects and detected stem and calyx; (c) apple images without defects and no apparent stem and calyx; (d) apple images with defects and detected stem and calyx.
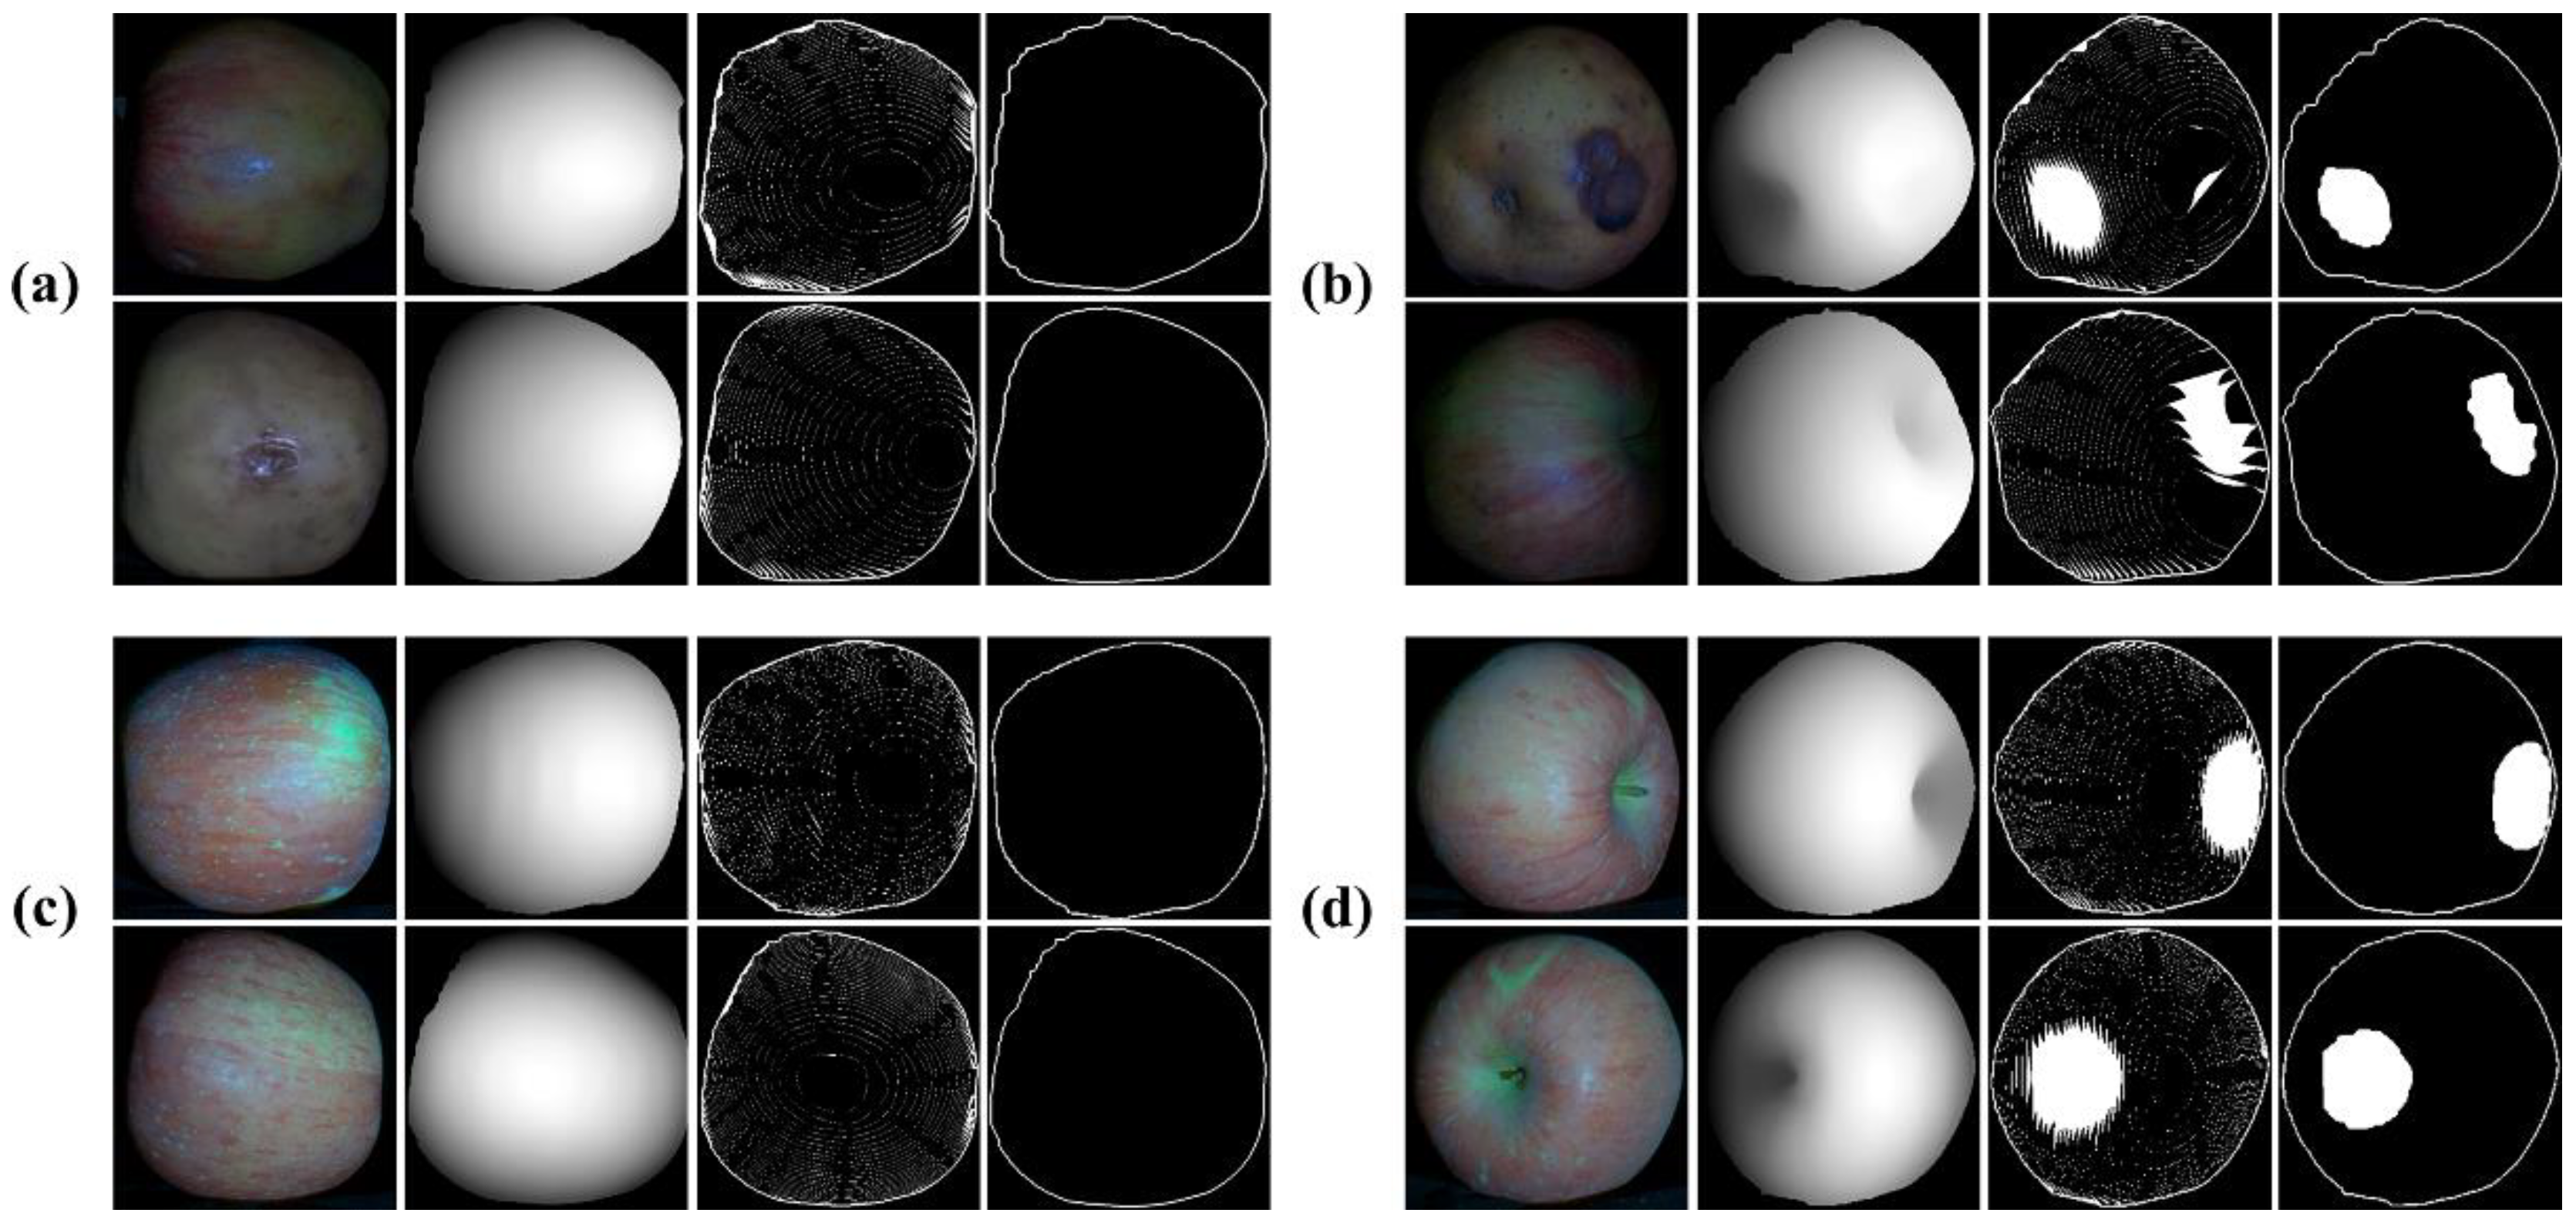
Figure 7.
Identification results under different segmentation schemes. (a) Three-dimensional reconstruction results; (b) identification results for segmentation of 10; (c) identification results for segmentation of 120; (d) identification results for segmentation of 300.
Figure 7.
Identification results under different segmentation schemes. (a) Three-dimensional reconstruction results; (b) identification results for segmentation of 10; (c) identification results for segmentation of 120; (d) identification results for segmentation of 300.

Figure 8.
Identification results when the surface contains shadows. (a) Image of an apple; (b) 3D reconstruction with shadows; (c) identification results when the surface contains shadows; (d) 3D reconstruction result after morphological image processing; (e) identification result after morphological image processing.


Table 1.
Stem and calyx recognition accuracy.
| Category | Number of Samples | Number of Correct Identifications | Identification Rate/% |
|---|---|---|---|
| ① | 34 | 33 | 97.06 |
| ② | 62 | 62 | 100.00 |
| ③ | 36 | 36 | 100.00 |
| ④ | 148 | 146 | 98.65 |
| Total | 280 | 277 | 98.93 |
① Apple images with defects and no apparent stem and calyx; ② apple images with defects and detected stem and calyx; ③ apple images without defects and no apparent stem and calyx; ④ apple images with defects and detected stem and calyx.
Publisher’s Note: MDPI stays neutral with regard to jurisdictional claims in published maps and institutional affiliations. |
© 2022 by the authors. Licensee MDPI, Basel, Switzerland. This article is an open access article distributed under the terms and conditions of the Creative Commons Attribution (CC BY) license (https://creativecommons.org/licenses/by/4.0/).
Share and Cite
MDPI and ACS Style
Xia, M.; Zhu, H.; Wang, Y.; Cai, J.; Liu, L. Stem and Calyx Identification of 3D Apples Using Multi-Threshold Segmentation and 2D Convex Hull. Photonics 2022, 9, 346. https://doi.org/10.3390/photonics9050346
AMA Style
Xia M, Zhu H, Wang Y, Cai J, Liu L. Stem and Calyx Identification of 3D Apples Using Multi-Threshold Segmentation and 2D Convex Hull. Photonics. 2022; 9(5):346. https://doi.org/10.3390/photonics9050346
Chicago/Turabian StyleXia, Man, Haojie Zhu, Yuwei Wang, Jiaxu Cai, and Lu Liu. 2022. "Stem and Calyx Identification of 3D Apples Using Multi-Threshold Segmentation and 2D Convex Hull" Photonics 9, no. 5: 346. https://doi.org/10.3390/photonics9050346
Note that from the first issue of 2016, this journal uses article numbers instead of page numbers. See further details here.