Article

Maximizing the Response of a Helium Atom at the Third Harmonic of an Intense Femtosecond Ultraviolet Pulse

by
Ilias R. Khairulin
1,
Mikhail Yu. Emelin
1,
Maria M. Popova
1,2,3,
Elena V. Gryzlova
1,3,
Mikhail Yu. Ryabikin
1 and
Vladimir A. Antonov
1,*
1
A.V. Gaponov-Grekhov Institute of Applied Physics, Russian Academy of Sciences, 603950 Nizhny Novgorod, Russia
2
Faculty of Physics, Lomonosov Moscow State University, 119991 Moscow, Russia
3
Skobeltsyn Institute of Nuclear Physics, Lomonosov Moscow State University, 119991 Moscow, Russia
*
Author to whom correspondence should be addressed.
Photonics 2023, 10(12), 1387; https://doi.org/10.3390/photonics10121387
Submission received: 9 October 2023 / Revised: 30 November 2023 / Accepted: 6 December 2023 / Published: 18 December 2023
(This article belongs to the Special Issue Atomic and Molecular Processes in Strong Laser Fields)

Abstract

:
The optimal regime of three-photon resonant excitation of a helium atom via a femtosecond ultraviolet (UV) pulse was discovered and numerically studied, at which the maximum power of the third harmonic of the UV field is achieved in the spectrum of dipole acceleration (the second time derivative of the induced dipole moment) of the atom. It is shown that the optimal frequency of the UV field nearly coincides with the frequency of the three-photon transition |1s2⟩–|1s2p⟩, taking into account its shift as a result of the dynamic Stark effect, and the intensity of the UV field is dictated by the condition of maximizing the product of the populations of the |1s2⟩ and |1s2p⟩ states, averaged over the time interval during which the UV field is non-zero. For the considered UV field durations, from 10 to 100 cycles of the carrier frequency (from units to tens of femtoseconds), the optimal intensity lies in the range from 1014 W/cm2 to several units of 1014 W/cm2. It is shown that with an optimal choice of the frequency and intensity of the UV field, the dynamics of excitation of bound and continuum states, as well as the shape of the time envelope of the dipole acceleration of the atom, weakly depend on the duration of the UV field envelope; only their time scale changes significantly. In addition, under optimal conditions, the average power of the third harmonic signal in the dipole acceleration spectrum is practically independent of the duration of the UV field envelope.

1. Introduction

The generation of coherent radiation in the vacuum ultraviolet (VUV) and X-ray ranges is one of the topical problems of modern optics. On the one hand, interest in this problem is due to the short period of field oscillations and the possibility of generating radiation pulses of the shortest (attosecond) duration achievable today. On the other hand, the high frequency of radiation, corresponding to the photon energy comparable to or exceeding the ionization potential of an atom, makes it possible to implement regimes of light–matter interaction that are unattainable in the optical range, such as single-photon excitation or ionization of an atom from both the valence and core electronic shells, triggering Auger decay or single-photon excitation of autoionization states [1,2,3,4,5,6,7,8,9,10]. At the same time, the short wavelength of the radiation allows it to be focused into a spot with dimensions significantly smaller than the wavelength of the field in the visible/infrared (IR) range and thereby achieve record spatial resolution [11].
One of the main methods for generating coherent VUV/X-ray radiation is the high-order harmonic generation (HHG) of an optical laser field in gases or solids [12,13]. Initially, HHG was considered primarily as a method for generating a wide-band spectrum of harmonics with photon energies significantly exceeding the ionization potential of an atom. In this case, HHG occurs in the regime of tunneling ionization of the atom and is the result of a three-step process, including the release of an active electron, its acceleration in the laser field, and subsequent recombination with the parent ion [14,15]. However, in recent years, the generation of harmonics of moderate orders with photon energies lower than or on the order of the ionization potential of the atom has also attracted considerable interest [16,17,18,19,20,21,22,23,24]. In this case, HHG occurs in the process of multiphoton excitation and multiphoton ionization of the atom and is largely due to transitions between bound states. The advantages of this regime are the high efficiency of harmonic generation (compared to the tunnel ionization regime) and less stringent requirements for the intensity of the laser field. In this case, as a rule, the driver for harmonic generation is the field of the near or mid-IR range, and the order of multiphoton resonances (if any) is somewhere around ten.
As in the above-mentioned studies, this work considers the generation of harmonics under conditions of multiphoton excitation and multiphoton ionization of the atom. The main attention is paid to the properties of the lowest-order (and most intense) harmonic of the external field, namely the third harmonic. It is assumed that the fundamental frequency lies in the ultraviolet range, and the multiphoton resonance is of low order (third). This regime has significant advantages over the harmonic generation driven by the visible/IR range field. Firstly, the role of multiphoton resonances increases, and the maximum achievable efficiency of generation of below-threshold and near-threshold harmonics (with photon energies lower than or on the order of the ionization potential of the atom) increases as well. Secondly, with an increase in the fundamental frequency, the phase matching of the driving field with the radiation of its harmonics improves, which makes it possible to achieve a higher efficiency of harmonic generation in an extended medium (note, however, that the analysis of macroscopic effects is beyond the scope of this study).
In the 1970s–1990s, a number of theoretical [25,26,27,28,29] and experimental [30,31,32,33,34,35,36,37] studies were published on the generation of low-order (primarily third) harmonics of ultraviolet radiation in gases. The theoretical models used in these studies were based on (a) a phenomenological description of the nonlinear response of the medium (nonlinear susceptibility formalism), (b) a solution of the Schrödinger equation or equations for the elements of the density matrix for a two-, three-, or four-level system, and (c) on the perturbation theory corresponding to the weak field approximation, as well as a combination of these approaches. In the spectrum of the field and excitation amplitudes of stationary states (or elements of the density matrix), only the lowest-order, often the first, second, and third harmonics of the fundamental frequency, were taken into account.
In this work, the response of an atom to an external field is calculated without using the above approximations: the non-perturbative regime of laser–matter interaction is considered, and all possible harmonics of the fundamental frequency are taken into account in the spectrum of the dipole response of the atom. The harmonic generation process is analyzed using the example of helium atoms by solving the time-dependent Schrödinger equation (TDSE) in a given femtosecond UV field and calculating the induced dipole moment of the atom. Two approaches are used. The first involves the expansion of the wave function in terms of a sufficiently large number of bound states of an unperturbed atom, as well as continuum states into which electric dipole transitions from the bound states taken into account are allowed. The second approach is to numerically solve the TDSE from the first principles in a two-dimensional model using the effective one-electron potential.
The study is organized as follows. The description of the theoretical models used, and an analysis of the results obtained are given in Section 2 and Section 3, respectively. In Section 4, the conclusions are given. A significant part of the analytics, as well as the parameters of the models used, are included in the Appendices.

2. Theoretical Model

The consideration in this article is based on the TDSE solution for a helium atom in a given external field. In the electric dipole approximation, the TDSE has the form
i t Ψ r 1 , r 2 , t = H ^ 0 + d ^ E t Ψ r 1 , r 2 , t ,
where Ψ r 1 , r 2 , t is the wave function, r 1 and r 2 are the radius vectors of electrons in a helium atom, H ^ 0 is the Hamiltonian of an atom in the absence of a field, d ^ is the dipole moment operator, and E t is the external (in this case, UV) field. Here and below, atomic units are used. It is noteworthy that for the considered wavelengths of the fundamental frequency UV field, exceeding 100 nm, the dipole approximation is well satisfied [38]. Moreover, since the wavelengths of the emitted harmonics also greatly exceed the atomic dimensions, the atom can be safely considered a point-like emitter [39]. In what follows, we will assume that the UV field is linearly polarized along the z-axis and has the form
E t = z 0 E U V f ( t ) sin ( Ω t ) ,
where z 0 is the unit vector along the z-axis, E U V and Ω are the amplitude and frequency of the UV field, respectively, and f ( t ) is the trapezoidal envelope:
f ( t ) = 0 , t < 0 , t / 3 T , 0 t 3 T , 1 , 3 T < t < N o s c + 3 T , 1 t N o s c + 3 T / 3 T , N o s c + 3 T t N o s c + 6 T , 0 , t > N o s c + 6 T ,
where T = 2 π / Ω is the UV field oscillation period. In accordance with Equations (2) and (3), the UV field pulse has a constant amplitude in a time interval lasting Nosc field cycles, while turning on and off the UV field is characterized by a linear increase (decrease) in its amplitude over three field cycles. In what follows, the values Nosc = 10, 30, 50, 70, and 100 are considered (most figures are given for Nosc = 30). The choice of the trapezoidal envelope allows one to simplify the interpretation of the results because this makes it possible to analyze the response of an atom to an external field with a constant amplitude over most of the time interval under consideration. In turn, this allows one to associate each combination of frequency and intensity of the UV field with a fixed ionization rate of the atom and a fixed dynamic Stark shift of energy levels (see Section 3). Note that the absolute duration of the UV field envelope is inversely proportional to its carrier frequency Ω.
As mentioned in the Introduction, the results of the calculations presented in this study were obtained using two approaches to solving the TDSE for a helium atom irradiated with a femtosecond pulse of an ultraviolet field.
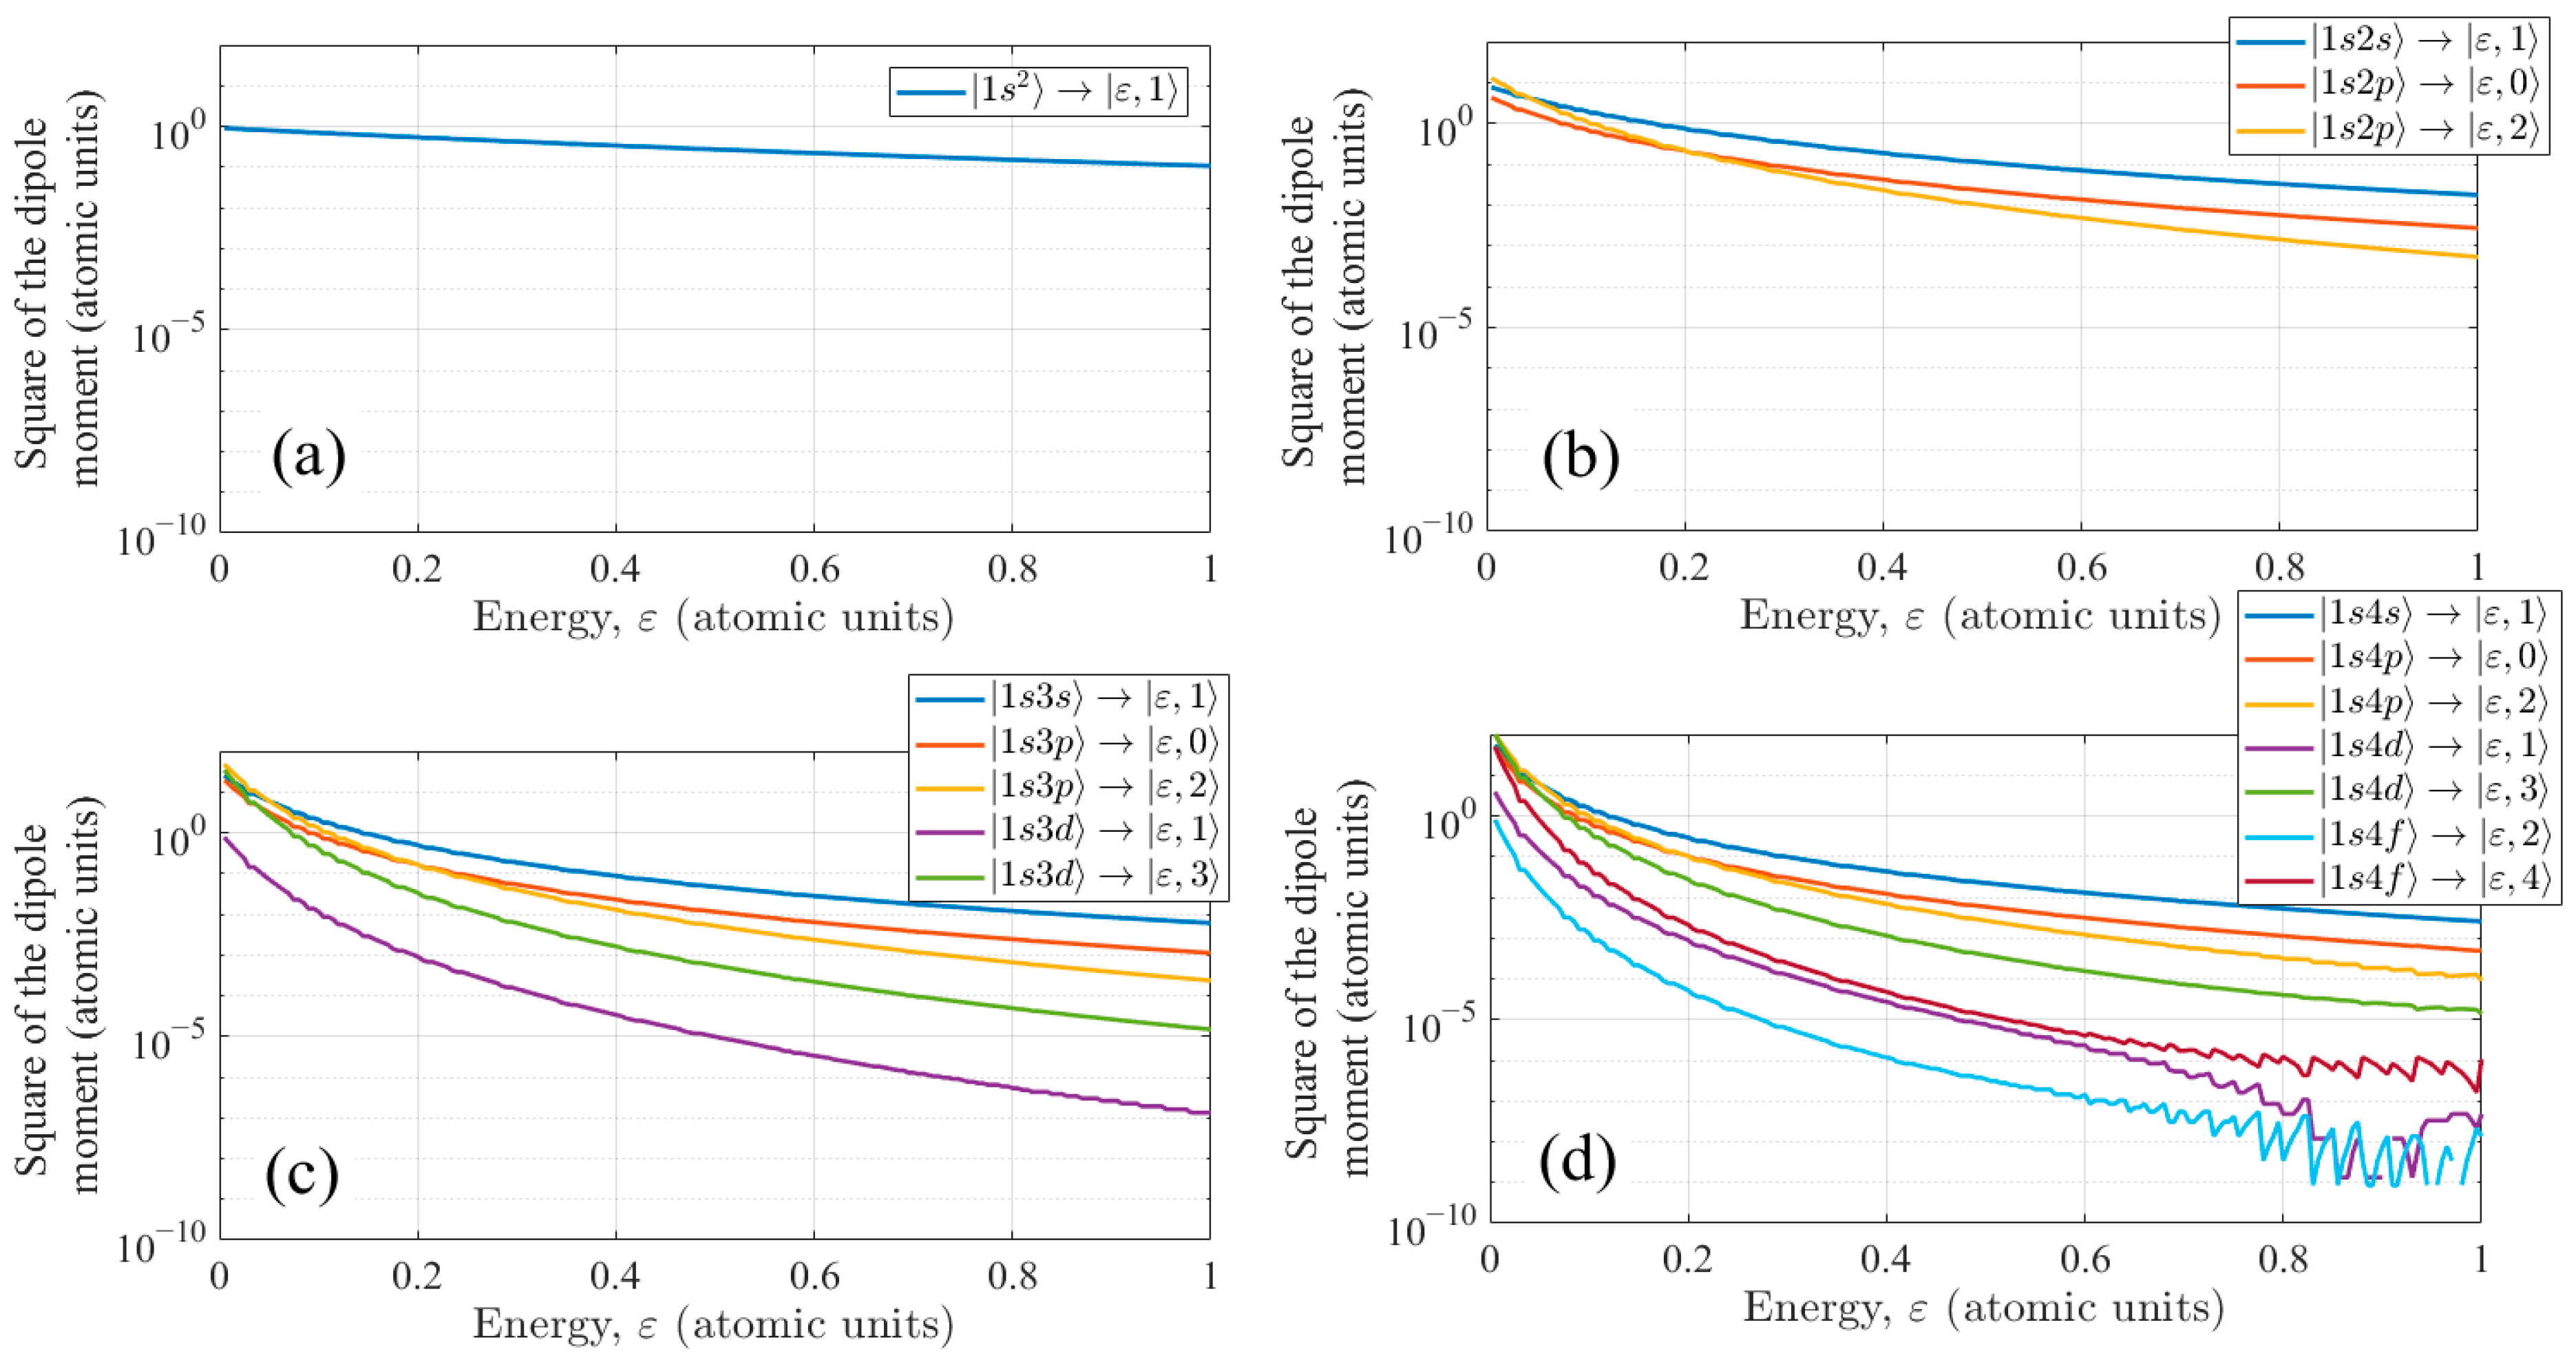
The first approach is based on the expansion of the atomic wave function over a limited (sufficiently large) basis of eigenfunctions corresponding to bound states and continuum states into which electric dipole transitions from the considered bound states are allowed. This expansion has the form
Ψ r 1 , r 2 , t = k = 1 K max a k t k + l = 0 L max 0 d ε b l ε , t ε , l ,
where k ψ k r 1 , r 2 is the spatial part of the wave function of the kth stationary state, a k t is the temporal factor in the same wave function, which we will further call the excitation amplitude of the state k , 1 k K max , and b l ε , t is the excitation amplitude of the continuum state ε , l with energy ε > 0 and orbital momentum l, 0 l L max . In further calculations, the expansion of the wave function takes into account the first 10 bound states of the helium atom (Kmax = 10), corresponding to the values of the principal quantum number n = 1,2,3,4 and the projection of the orbital momentum of the atom onto the field polarization direction m = 0 (electric dipole transitions from ground state into states with m ≠ 0 in a linearly polarized field are prohibited by selection rules). Namely, states 1 s 2 = 1 , 1 s 2 s = 2 , 1 s 2 p = 3 , 1 s 3 s = 4 , 1 s 3 p = 5 , 1 s 3 d = 6 , 1 s 4 s = 7 , 1 s 4 p = 8 , 1 s 4 d = 9 , and 1 s 4 f = 10 are taken into account (for brevity, here and below, the value of the projection of the orbital momentum of the atom m = 0 is not given in the designation of states). Among the continuum states, those with orbital momentum from 0 to Lmax = 4 (s-, p-, d-, f-, and g-waves) are taken into account. This set of states makes it possible to quite accurately consider one-, two-, three-, four-, and five-photon transitions from the ground to lower-bound states 1 s 2 s and 1 s 2 p (transitions to higher-lying states are described with less accuracy). Note that the time dependences a k t take into account oscillations of the phase of the wave function at the natural frequencies of stationary states, which in the atomic system of units are equal to E k , where E k is the energy of the kth stationary state in the absence of a field (state energies and other constants used are given in Appendix A). Accordingly, depending on the ratio of the values of E k and Ω , even in a weak UV field limit, the excitation amplitudes can be fast or slow functions of time on the scale of the UV field cycle.
Further, the excitation amplitudes of bound states are decomposed into harmonics of the UV field:
a k t = n = a k , n t exp i n Ω t ,
where a k , n t is the Fourier component of the excitation amplitude of the kth bound stationary state.
To take into account the multiphoton ionization of an atom from the bound states under consideration, the approximation of the adiabatic exclusion of continuum states is used [40], which primarily corresponds to not taking into account transitions between continuum states. In addition, reverse transitions from continuum states to bound states are also not considered. These approximations make it possible to express the excitation amplitudes of continuum states ε , l through the Fourier components of the excitation amplitudes of bound states a k , n t . Ultimately, a closed system of linear differential equations for a k , n t can be written, which takes into account the decrease in absolute values of a k , n t as a result of ionization. These equations have the form
d a k , n d t = i E k n Ω + γ k , n ( t ) a k , n + 1 2 s = 1 K max f ( t ) E U V d s k ( z ) a s , n 1 a s , n + 1 ,
where d s k ( z ) is the projection of the dipole moment of the transition from state |s〉 to state |k〉 on the z-axis, and γ k , n ( t ) is the ionization rate of the nth Fourier component of the kth state. Using the residue theory, the following expression can be obtained for γ k , n ( t ) :
γ k , n ( t ) = π 4 E U V 2 f 2 ( t ) l = 0 L max k d ^ z E k + ( n 1 ) Ω , l 2 θ E k + ( n 1 ) Ω + + k d ^ z E k + ( n + 1 ) Ω , l 2 θ E k + ( n + 1 ) Ω ,
where d ^ z is the z-projection of the dipole moment operator, and θ ( x ) is the Heaviside unit step function. The derivation of Equations (6) and (7) is given in Appendix B.
Equations (6) and (7) were solved numerically using the fourth order one-step explicit Runge–Kutta method using the following initial conditions:
a 1 , 0 0 = 1 and a k , n 0 = 0 for any k , n 1 , 0 ,
which imply that before exposure to the UV field, the atom is in the ground state 1 s 2 with energy E 1 .
This approach is a simplified and less resource-intensive implementation of the SSEA (state-specific expansion approach) method [41,42]. It makes it possible to quite accurately describe the component of the dipole response of an atom to an external field that dominates in the considered spectral range of below-threshold and near-threshold harmonics (see, for example, [43]) and is caused by transitions between bound states,
d b b t Ψ d ^ z Ψ b b = k , s = 1 K max d s k ( z ) n , m a k , n * ( t ) a s , m ( t ) exp i m n Ω t .
In Formula (9), the index bb of the induced dipole moment of an atom indicates transitions between bound states, the indices k and s number the stationary states taken into account, and the indices n and m number their Fourier components. Note that within the framework of this approach, the response of the atom due to transitions between continuum states, as well as from continuum to bound states, is not taken into account.
As usual in strong-field physics, the response of an atom to an external field will be characterized by dipole acceleration,
d ¨ b b t d 2 d t 2 Ψ d ^ z Ψ b b .
This approach allows one to analyze the contributions of certain stationary states to the generation of harmonics and take into account the properties of a real multielectron atom (through the energies of stationary states and the dipole moments of transitions between them) by choosing the correct basis functions. For this purpose, in this study, we used the spectroscopic characteristics of a three-dimensional two-electron helium atom, calculated using the multi-configuration Hartree–Fock method (see Appendix A). Their calculation error does not exceed several percent relative to experimental data [44].
The second approach used in this article is to solve the TDSE from first principles in a two-dimensional model of a one-electron atom with an effective potential U x , z , reproducing the binding energies of ground state 1 s 2 and lowest-excited bound states 1 s 2 s and 1 s 2 p :
i t Ψ x , z , t = 1 2 2 x 2 1 2 2 z 2 + i c A z t z + U x , z Ψ x , z , t ,
where A z t = c t E t d t is the vector potential of the UV field, c is the speed of light in vacuum, and
U x , z = 1 + 1 + 8.125 r e 8.125 r r 2 + 0.01 + 0.6 r 6 r 8 + 10 4 , r = x 2 + z 2 .
The energies of the lowest stationary states and the dipole moments of transitions between them calculated in this model are given in Appendix A.
This approach has less accuracy in describing the dynamics of the localized part of the atomic wave function but takes into account recombination and all possible transitions between states of the continuum. Accordingly, the dipole response of an atom to an external field and the contribution from transitions between bound states contain components due to transitions from continuum to bound states (recombination) and transitions between continuum states. The dipole acceleration of an atom is calculated using Ehrenfest’s theorem:
d ¨ t E t + Ψ * U z Ψ d x d z ,
where integration is carried out over the entire computational domain.
The purpose of this study is to analyze the physical mechanisms that ensure the maximization of the third harmonic energy in the spectrum of the dipole acceleration of the atom. Both approaches correspond to this goal and provide a qualitatively correct description of the process under study.

3. Calculation Results

As was shown in [45], the approaches to solving the TDSE used in this study give similar time dependences of the probability of ionization of a helium atom in a UV field with an intensity IUV = 1014 W/cm2. In the first approach, based on the expansion of the wave function in terms of the basis of stationary states, the probability of ionization is determined as
W i o n ( 1 ) ( t ) = 1 k = 1 K max a k ( t ) 2 ,
whereas within the framework of the second approach, based on solving a two-dimensional one-electron TDSE from first principles, it has the form
W i o n ( 2 ) ( t ) = 1 A Ψ ( x , z ) 2 d x d z ,
where the integration is carried out inside a square with side A = 100 a.u., in the center of which the core of the He atom is located. In this case, the wave functions of bound states with principal quantum numbers n = 1, 2, 3, 4 are completely contained within the integration region.
As follows from Figure 1, the frequency dependences of the ionization probability are also qualitatively similar. Figure 1 shows the probability of ionization of an atom at the end of a UV field pulse with a peak intensity IUV = 1014 W/cm2 and a constant-amplitude interval duration equal to 30 UV field cycles (Nosc = 30) as a function of its frequency. The frequency of the UV field is scanned in a range 0.18 < Ω < 0.4 that covers resonances with two-, three-, and four-photon transitions from the ground to excited bound states and corresponds to the wavelength range of the UV field from 114 nm to 254 nm. The blue curve shows the solution obtained based on expansion (4), and the red curve is based on the two-dimensional one-electron model.
As follows from Figure 1, multiphoton resonances are reproduced in both models, but their frequencies are slightly different. This is due to (a) the neglect of highly excited bound states and the use of the adiabatic continuum exclusion approximation when expanding the wave function in stationary states and (b) the difference in the dipole moments of the transitions, as well as energies of highly excited bound states, in a two-dimensional one-electron model from the corresponding parameters of a real helium atom. The best agreement in the probability of atomic ionization is achieved for a three-photon transition from state 1 s 2 to state 1 s 2 p , as well as two- and four-photon transitions to state 1 s 2 s , which is explained by the highest accuracy of both models in describing these transitions. The accuracy of the approach based on the expansion of the wave function in stationary states is due to the low probability of transitions from ground state 1 s 2 to disregarded intermediate states with n ≥ 5 during the three-photon excitation of state 1 s 2 p or the two/four-photon excitation of state 1 s 2 s in a real helium atom. At the same time, the two-dimensional model of the helium atom is constructed in such a way as to reproduce the energies of states 1 s 2 , 1 s 2 s , and 1 s 2 p with few percent accuracy. The dipole moments of transitions between them are reproduced with lower, but still reasonable accuracy of tens of percent (see Appendix A). Taken together with the fact that the three-photon transition to state 1 s 2 p predominantly occurs through state 1 s 2 s , while the two- and four-photon transitions to state 1 s 2 s occur through state 1 s 2 p , this determines the accuracy of the two-dimensional model in describing these transitions.
Let us consider in more detail the region of resonances with three-photon transitions from state 1 s 2 to the p- and f-states taken into account, 0.25 < Ω < 0.3, which corresponds to the wavelength range of the UV field from 153 nm to 183 nm. 
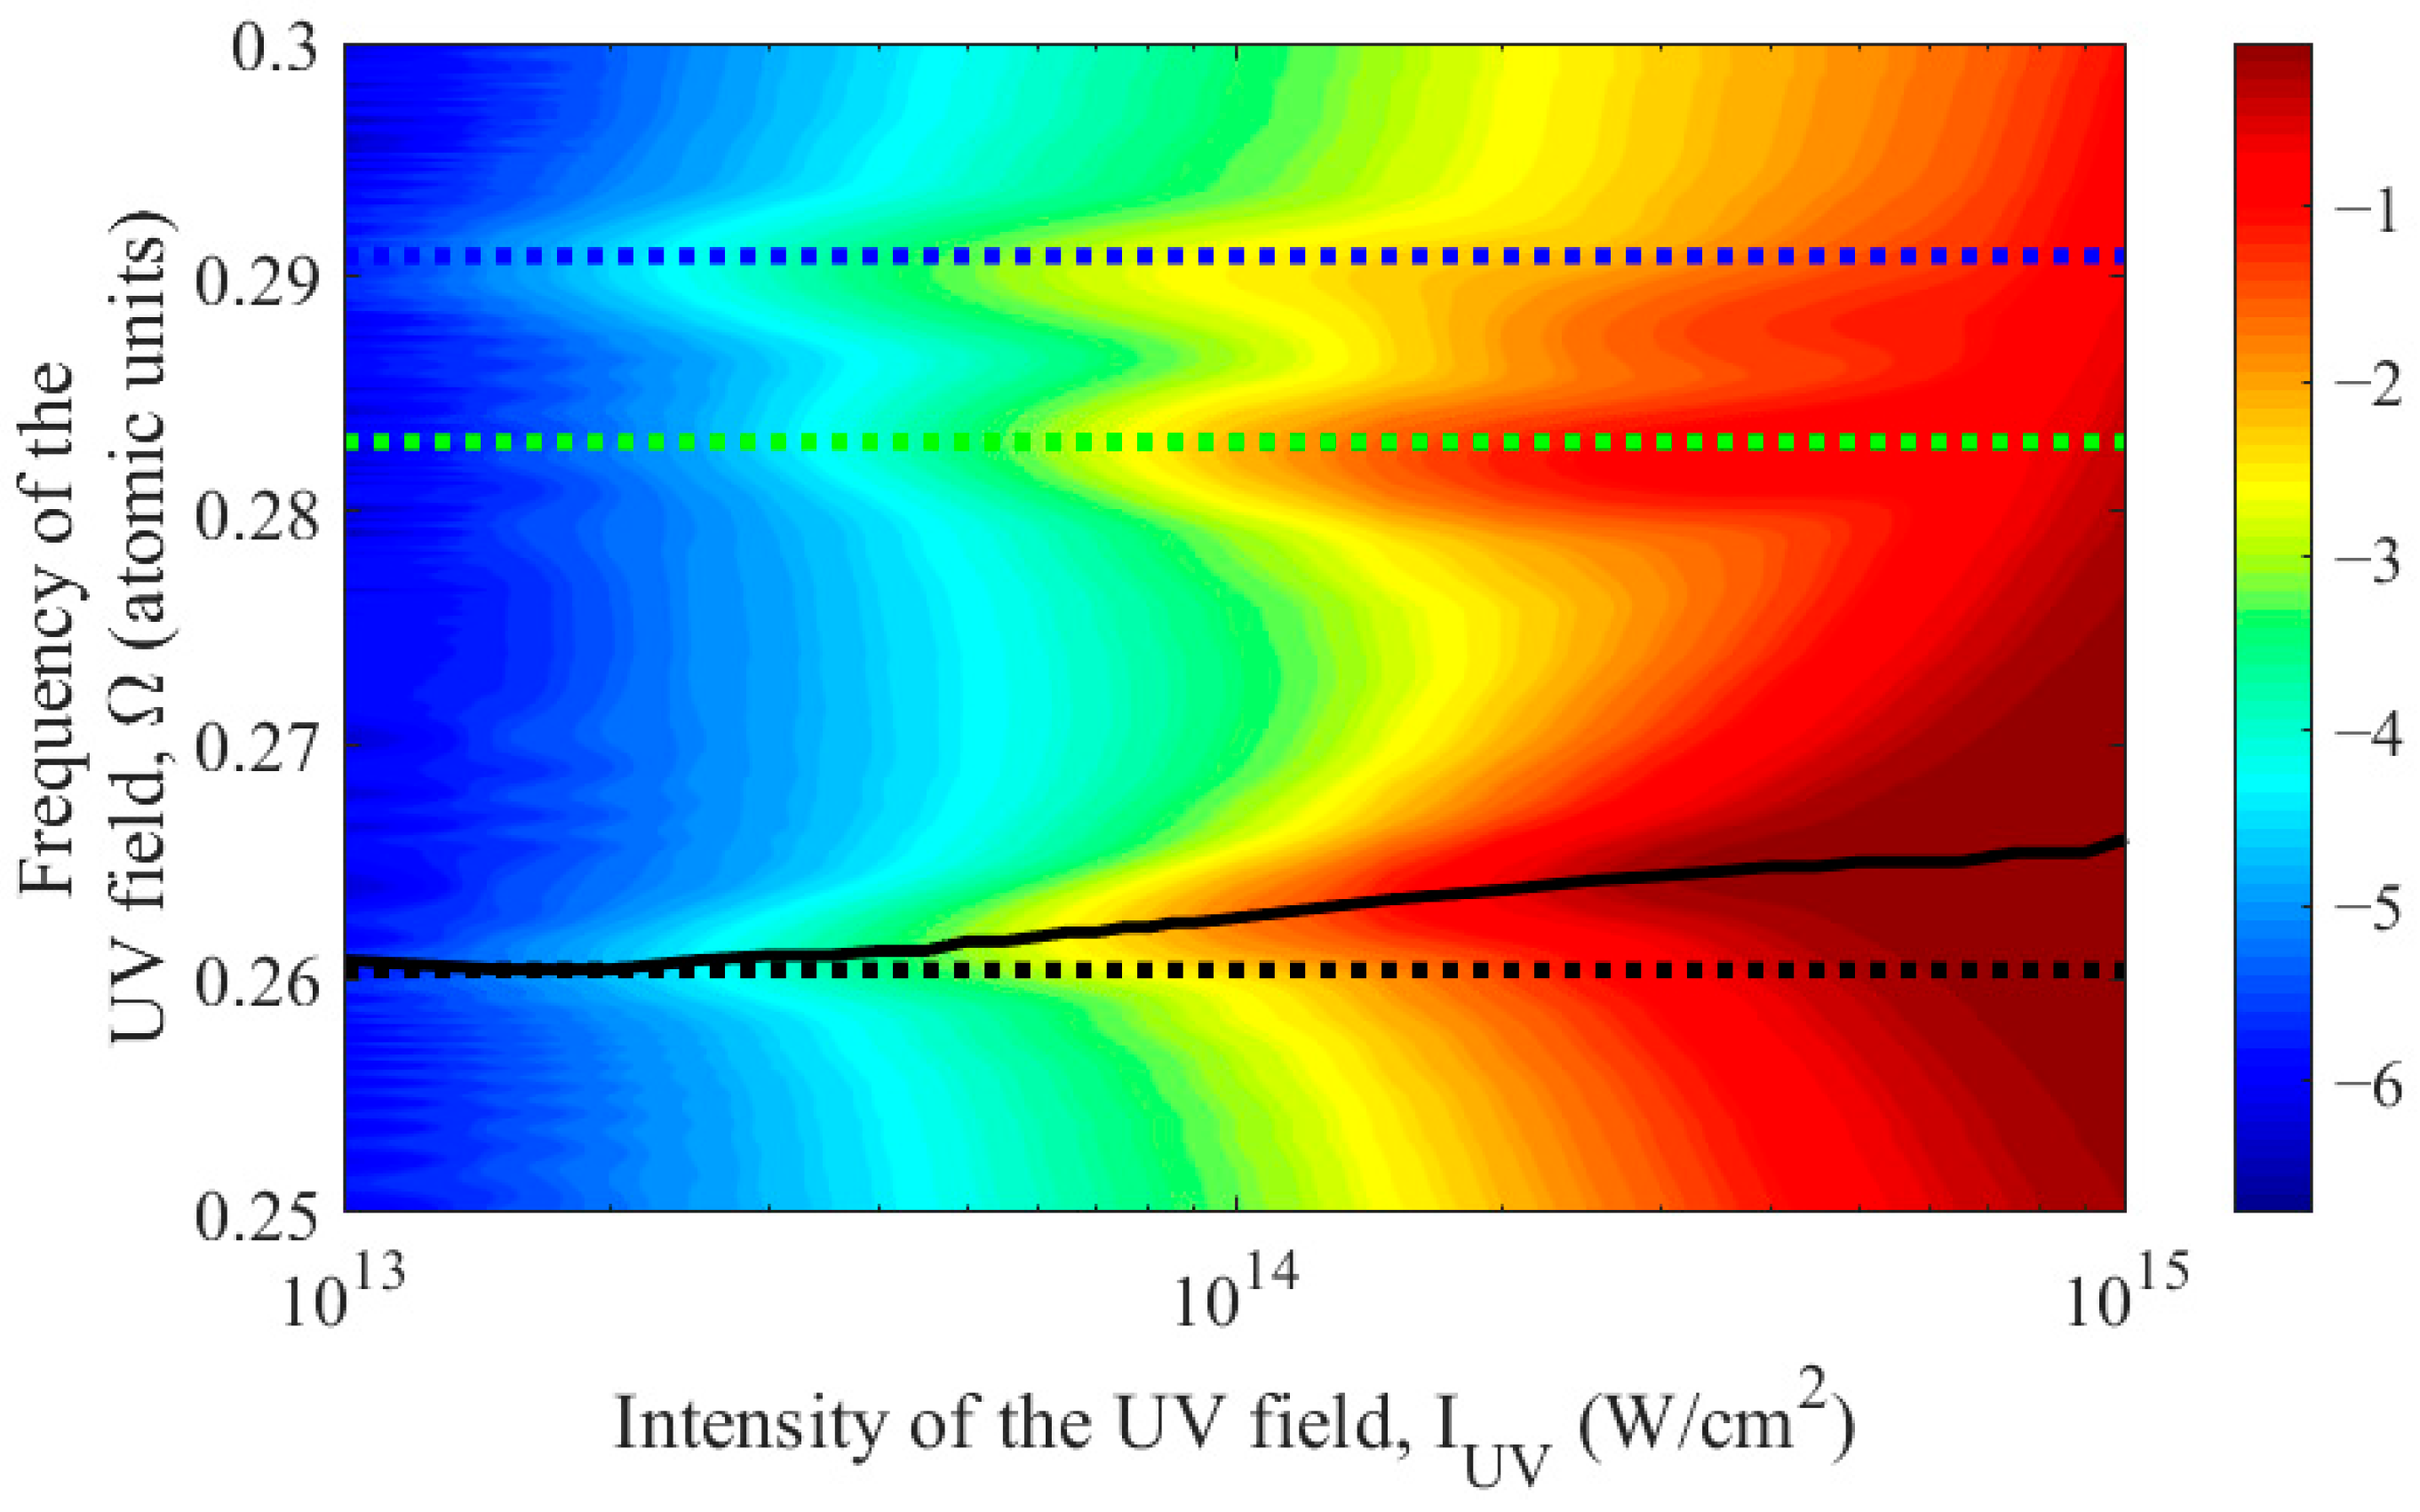
Figure 2 shows the dependence of the probability of ionization of an atom at the end of a UV field pulse on its frequency and peak intensity, calculated by expanding the atomic wave function over stationary states. Similar to Figure 1, this figure is given for UV field pulses with a constant amplitude interval duration equal to 30 carrier cycles (Nosc = 30). Note that the blue curve in Figure 1 in the frequency range 0.25 < Ω < 0.3 represents a cross-section of Figure 2 for an intensity value of 1014 W/cm2. The Keldysh parameter in Figure 2 varies from 1.99 (Ω = 0.3, IUV = 1015 W/cm2) to 23.9 (Ω = 0.25, IUV = 1013 W/cm2); hence, the ionization regime is multiphoton.
As follows from Figure 2, (i) the highest probability of ionization is achieved in the vicinity of the frequencies of three-photon transitions, (ii) the absolute maximum corresponds to the vicinity of the transition |1s2〉–|1s2p〉 frequency; with increasing field intensity, (iii) the probability of ionization increases, and (iv) the resonances broaden and shift in frequency.
Next, we will focus on the resonance with the three-photon transition |1s2〉–|1s2p〉, which is characterized by the highest probability of atomic ionization and is most accurately described within the framework of the models used. For each fixed intensity of the UV field, we determine the resonance frequency using the method of multiphoton photoionization spectroscopy [46] based on the position of the maximum probability of atomic ionization in the vicinity of the frequency of the three-photon transition between the unperturbed states |1s2〉 and |1s2p〉. The dependence of the transition frequency on the UV field intensity obtained in this way is shown in Figure 2 by a black solid curve.
An increase in the probability of atomic ionization with increasing UV field intensity is accompanied by real and virtual excitation of bound states. As a consequence, the response of the atom to the UV field (dipole acceleration) is enriched in harmonics of the fundamental frequency. Figure 3 shows the dependence of the energy concentrated in the spectral component of the dipole acceleration of an atom (10) at the frequency of the third harmonic of the UV field (the method for calculating this quantity is described in Appendix C) on its frequency and intensity. Calculations were made for the duration of the interval of constant amplitude in the UV field envelope equal to 30 carrier cycles (Nosc = 30).
Two remarks should be made here. The energy (time-integrated square of the amplitude) of the third harmonic in the dipole acceleration spectrum was chosen as the parameter under study rather than its peak power spectral density or peak intensity. This is because, under certain conditions, the spectral and time dependences of the harmonic signal may have several maxima of comparable amplitude. In particular, this case is observed under conditions of Rabi oscillations between the resonant states of a multiphoton transition [47]. The second remark concerns the free-induction decay. Under conditions of three-photon resonance, the excited state |1s2p〉 of the atom, coupled with a dipole-allowed transition with the ground state |1s2〉, is effectively populated. As a result, after the end of the UV field pulse, the atom continues to emit at the frequency of transition |1s2〉–|1s2p〉, close to the third harmonic frequency (however, slightly different from it in the absence of a field). This radiation corresponds to free-induction decay (for details, see [48,49]). In order to separate it from the third harmonic radiation, the dipole acceleration of the atom, calculated using Formula (10) or (13), is multiplied by a temporary mask, which is non-zero only in the presence of a UV field (for more details, see Appendix C).
Similar to Figure 2, the dotted lines in Figure 3 indicate the frequencies of three-photon transitions to unperturbed states of the atom, and the solid black curve indicates the resonance frequency of the three-photon transition |1s2〉–|1s2p〉 in the UV field, determined by the maximum probability of ionization. The UV field frequency that maximizes the third harmonic energy in the dipole acceleration spectrum for a given field intensity is plotted in Figure 3 with the dashed cyan curve. As follows from Figure 3, the maximum energy of the third harmonic in the dipole acceleration spectrum is achieved at a UV field intensity IUV = 2 × 10¹⁴ W/cm2 and a frequency Ω = 0.2644 a.u. This frequency is in close proximity to the resonant frequency, Ωres = 0.2638 a.u., of the three-photon transition to the |1s2p〉 state in the presence of a UV field of given intensity (in this case, the detuning from resonance is about 1/3 of the half-width of the resonance curve in the frequency dependence of the probability of ionization of an atom). For the specified optimal parameters, the probability of ionization at the end of the UV field pulse is approximately 24%.
As the UV field intensity decreases, the third harmonic energy (Figure 3) and, in particular, the probability of atomic ionization (Figure 2) quickly decreases. In this case, the frequency that maximizes the harmonic energy practically coincides with the frequency of the resonant three-photon transition |1s2〉–|1s2p〉 in the UV field. At the same time, for a UV field intensity exceeding the optimal value IUV = 2 × 10¹⁴ W/cm2, the value of the maximum achievable energy of the third harmonic decreases, while the detuning of the optimal (for a given intensity) frequency of the UV field from the frequency of the three-photon resonance with the |1s2〉–|1s2p〉 transition increases. With a further increase in the intensity of the UV field, the frequency that maximizes the energy of the third harmonic in the spectrum of the dipole acceleration of the atom shifts to the region of resonances with the transitions |1s2〉–|1s3p〉, |1s2〉–|1s4p〉, and |1s2〉–|1s4f〉, while the harmonic energy continues to decrease.
To explain this dependence, let us analyze additional figures. 
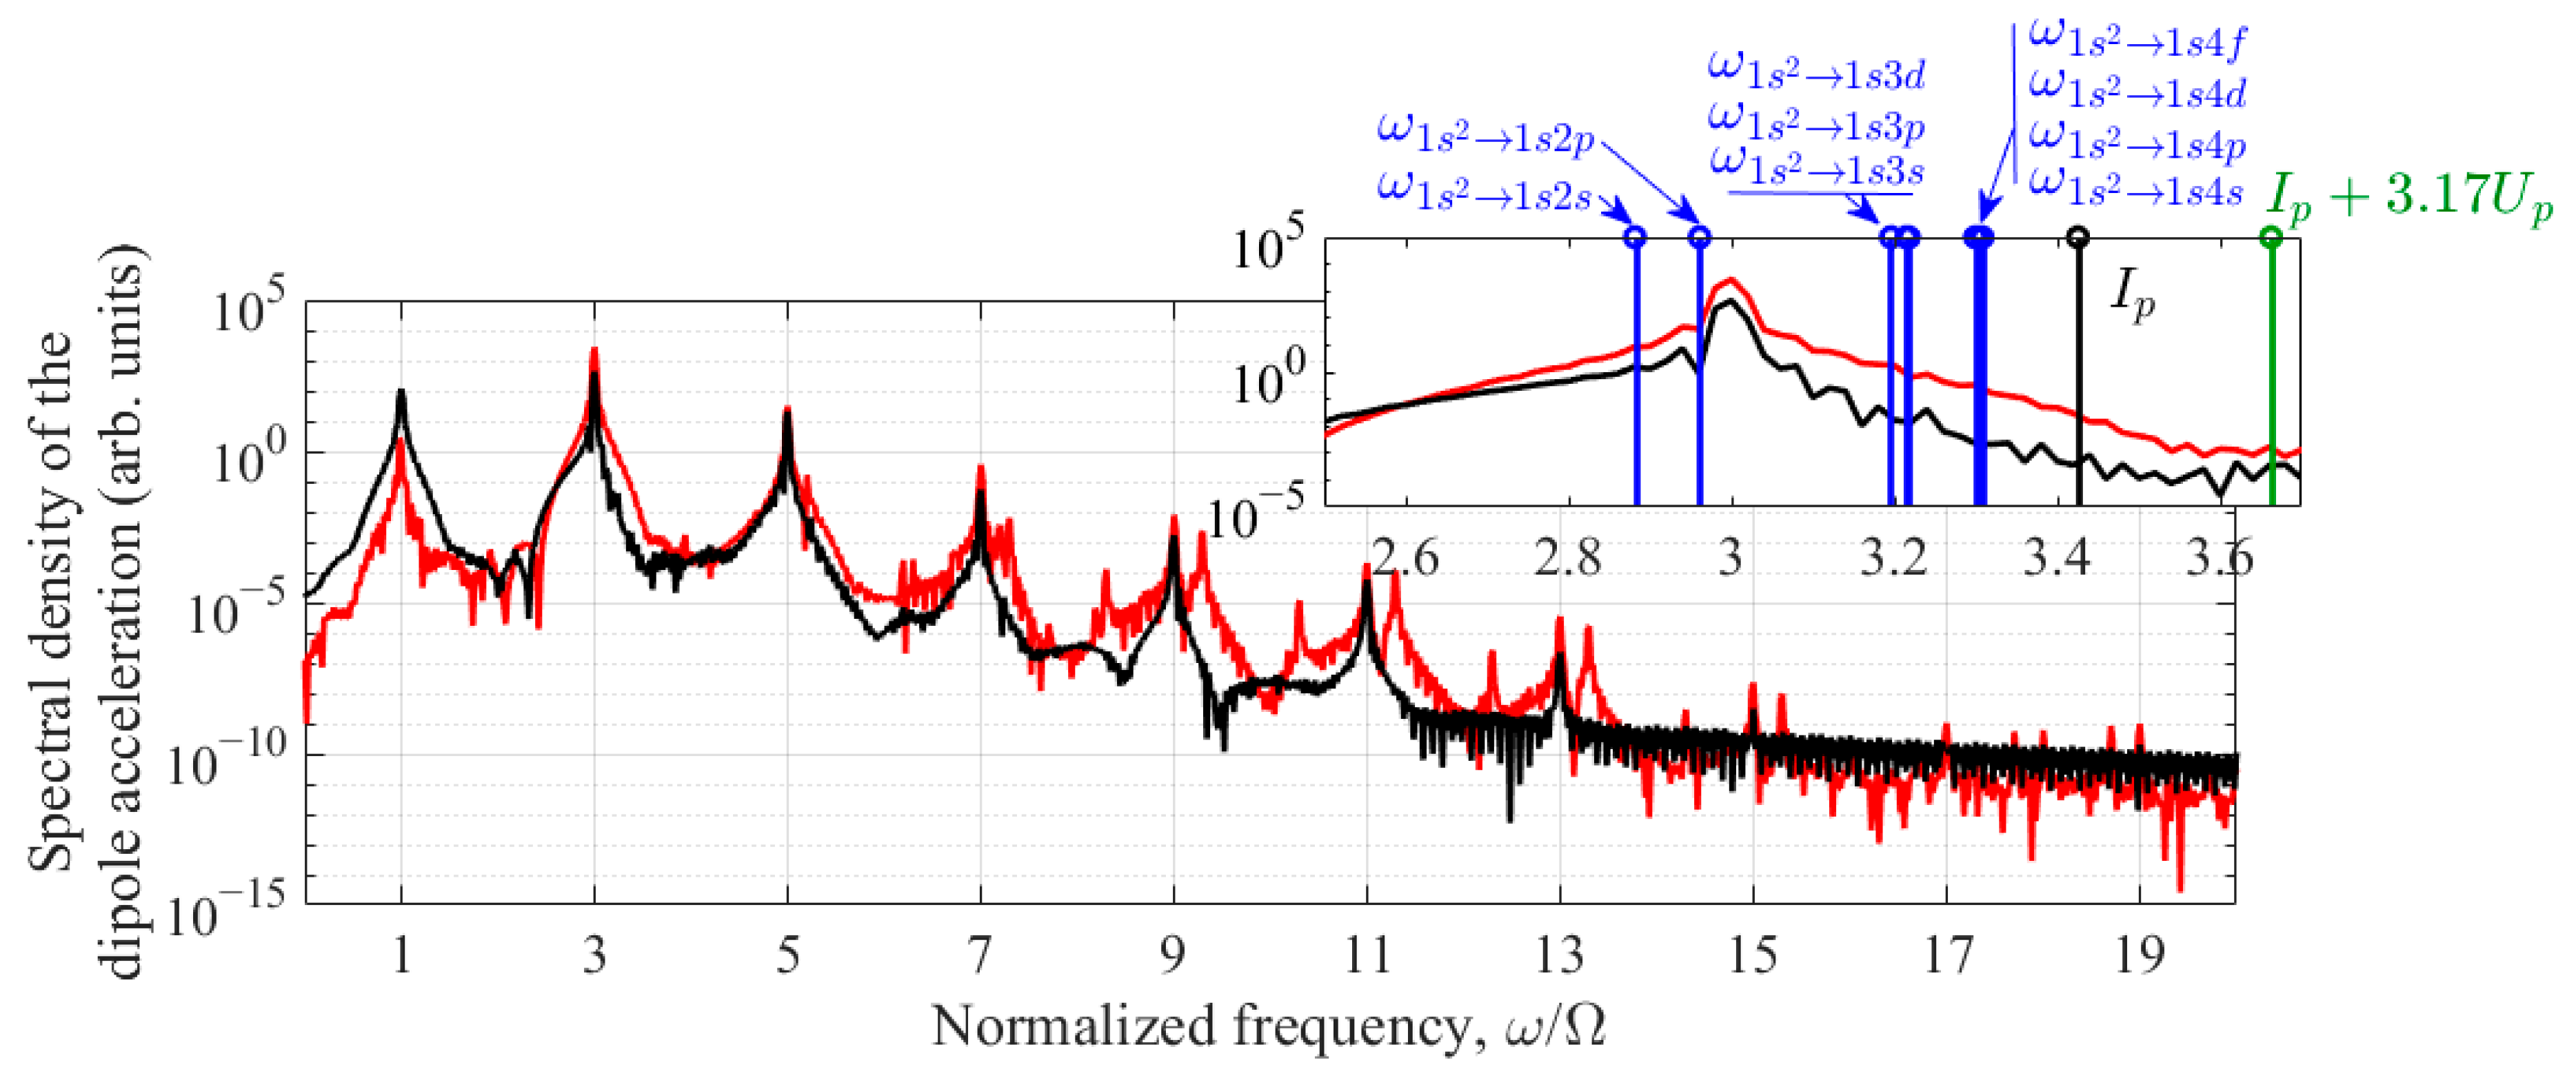
Figure 4 shows the frequency dependence of the power spectral density (the square of the modulus of the spectral amplitude (see Appendix C) of the dipole acceleration of an atom under conditions that maximize the energy of the third harmonic for Nosc = 30. The red curve shows the solution of Equations (6) and (7), corresponding to the expansion of the wave function in terms of the basis of stationary states (4). In this case, the third harmonic energy reaches a maximum at IUV = 2 × 10¹⁴ W/cm2 and Ω = 0.2644 a.u, see Figure 3. The black curve is obtained based on model (11) and (12). In this case, the optimum shifts towards higher UV field intensity, and the maximum is achieved at IUV = 4 × 10¹⁴ W/cm2 and Ω = 0.2730 a.u. The increase in the optimal intensity value in the two-dimensional model is most likely due to the lower probability of multiphoton excitation and the ionization of the atom, see Figure 1. Similar to Figure 3, in this case, the optimal frequency of the UV field, Ω = 0.2730 a.u., turns out to be close to the resonance frequency of the |1s2〉–|1s2p〉 transition in the UV field, which for IUV = 4 × 10¹⁴ W/cm2 in the two-dimensional model is Ωres = 0.2720 a.u. Several conclusions can be drawn from Figure 4. Firstly, the dipole acceleration of an atom is multi-frequency. In addition to the fundamental frequency of the UV field and its third harmonic, the atomic response contains harmonics of higher orders, up to the 13th one. Secondly, for the chosen UV field parameters, the third harmonic in the dipole acceleration spectrum is dominant. In the solution of Equations (6) and (7), it is approximately 90 times more intense than the fifth harmonic, three orders of magnitude more intense than the signal at the fundamental frequency of the UV field, and four orders of magnitude more intense than the seventh harmonic. Thus, the contribution of the third harmonic to the spectrum of dipole acceleration is decisive. Third, as shown in the inset of Figure 4, under the conditions considered, the third harmonic is the only below-threshold harmonic; its frequency is comparable to the frequencies of single-photon transitions to all excited bound states of the atom and the threshold of its photoionization. The fifth and higher harmonics in the case under consideration are above the threshold. Fourthly, as shown in the inset of Figure 4, due to the small ponderomotive energy of a free electron in the UV field, Up ≈ 0.02 a.u. << Ω, the contribution of Corkum’s mechanism of harmonic generation [14,15] under the conditions in consideration is insignificant. In addition, Ip + UpIp (where Ip = 0.9036 a.u. is the ionization potential of an unperturbed atom), and the shift of the energy boundary of the continuum due to the dynamic Stark effect [50] does not play a noticeable role. The fifth and final conclusion from Figure 4 is the qualitative agreement between the dipole acceleration spectra at the third, fifth, and, with less accuracy, the seventh harmonics, calculated (i) using a stationary-state basis and (ii) in a two-dimensional one-electron model of the helium atom, with appropriate (optimal in each model) UV field parameters. The differences in the shape of the spectral lines of higher harmonics are apparently due to the limited basis of the stationary states considered in the expansion (4). In this case (for the seventh and higher harmonics), two-dimensional one-electron TDSE appears to give a more physical result.
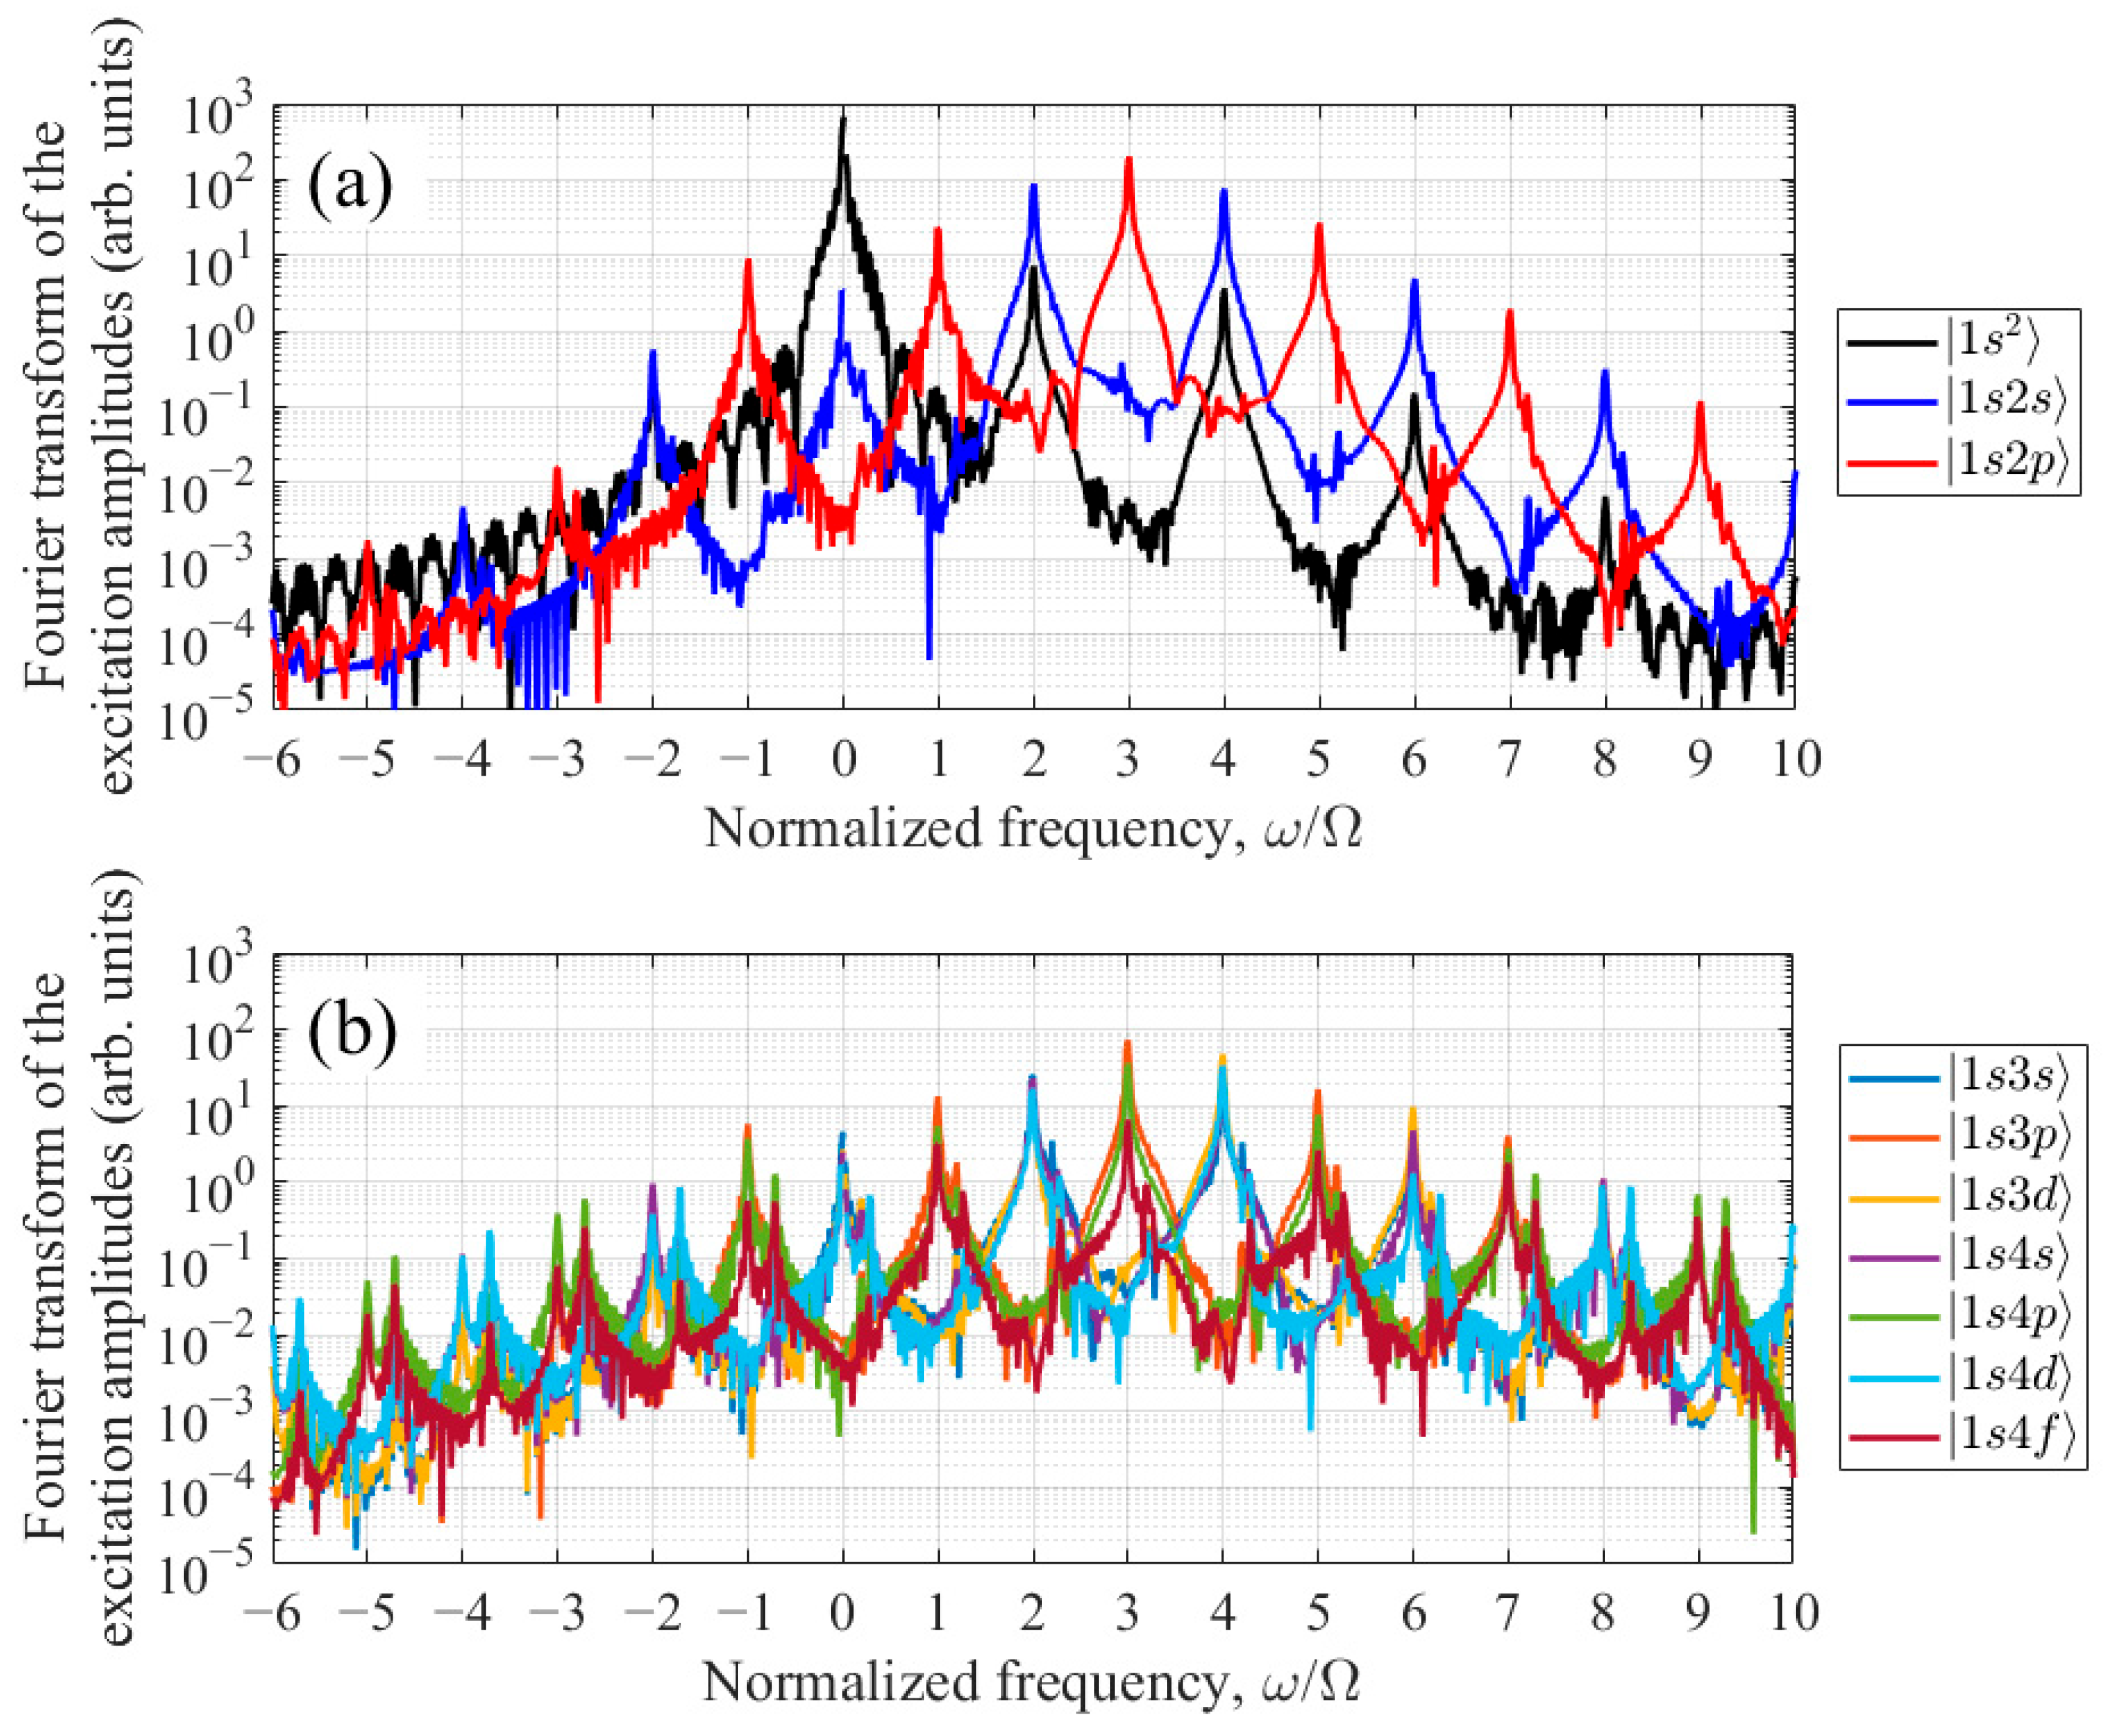
Next, we will analyze the role of various stationary states in the generation of harmonics. When using the expansion of the wave function in stationary states and the adiabatic continuum exclusion approximation, the dipole acceleration of the atom is determined by the excitation amplitudes of bound states (9) and (10). The excitation amplitude spectra of the states taken into account for Nosc = 30 (see (3)) and the optimal UV field parameters, IUV = 2 × 10¹⁴ W/cm2 and Ω = 0.2644 a.u., are shown in Figure 5. The horizontal axis shows the excitation frequency of the atom, measured from the unperturbed frequency of the ground state |1s2〉. As follows from Figure 5, the states |1s2〉, |1s2s〉, and |1s2p〉, shown in Figure 5a, have the largest excitation amplitudes, while the remaining states, Figure 5b, are excited noticeably weaker. In accordance with Equation (9), the complex amplitude of the dipole moment of an atom at the third harmonic frequency is determined by the sum of the products d s k ( z ) a k , n * ( t ) a s , n + 3 ( t ) over all considered states s and k of opposite parity and over the Fourier components of the excitation amplitudes of these states n and n + 3. As can be seen from Figure 5a, in the conditions under consideration of the even parity states, the 0th Fourier component of the excitation amplitude of the state |1s2〉, a 1 , 0 , has the largest amplitude. Of the odd parity states, this is the case for the 3rd Fourier component of the excitation amplitude of the state |1s2p〉, a 3 , 3 , oscillating at a frequency close to the frequency of the single-photon transition |1s2〉–|1s2p〉. Accordingly, the dominant contribution to the amplitude of the third harmonic of the UV field frequency in the spectrum of the induced dipole moment of the atom is made by the product d 31 ( z ) a 1 , 0 * ( t ) a 3 , 3 ( t ) . In this case, the dipole acceleration of the atom at the third harmonic frequency is proportional to Ω 2 d 31 ( z ) a 1 , 0 * ( t ) a 3 , 3 ( t ) , while its energy turns out to be proportional to Ω 4 d 31 ( z ) 2 a 1 , 0 * ( t ) a 3 , 3 ( t ) 2 d t = Ω 4 d 31 ( z ) 2 a 1 , 0 ( t ) 2 a 3 , 3 ( t ) 2 d t , where integration is carried out over the time interval at which the UV field is different from zero (see Appendix C). On the other hand, due to the dominant contribution of the Fourier components a1,0 and a3,3 to the excitation amplitudes of the states |1s2〉 and |1s2p〉, respectively, the approximate equality is valid: a 1 , 0 ( t ) 2 a 3 , 3 ( t ) 2 d t a 1 2 a 3 2 ¯ τ U V , where a 1 2 a 3 2 ¯ denotes the time-averaged product of the populations of the states |1s2〉 and |1s2p〉, while τ U V N o s c T is the duration of the UV field pulse. The resulting equality is easy to interpret; namely, the energy of the third harmonic reaches its maximum under the conditions of the most effective excitation of the coherent superposition of states |1s2〉 and |1s2p〉.
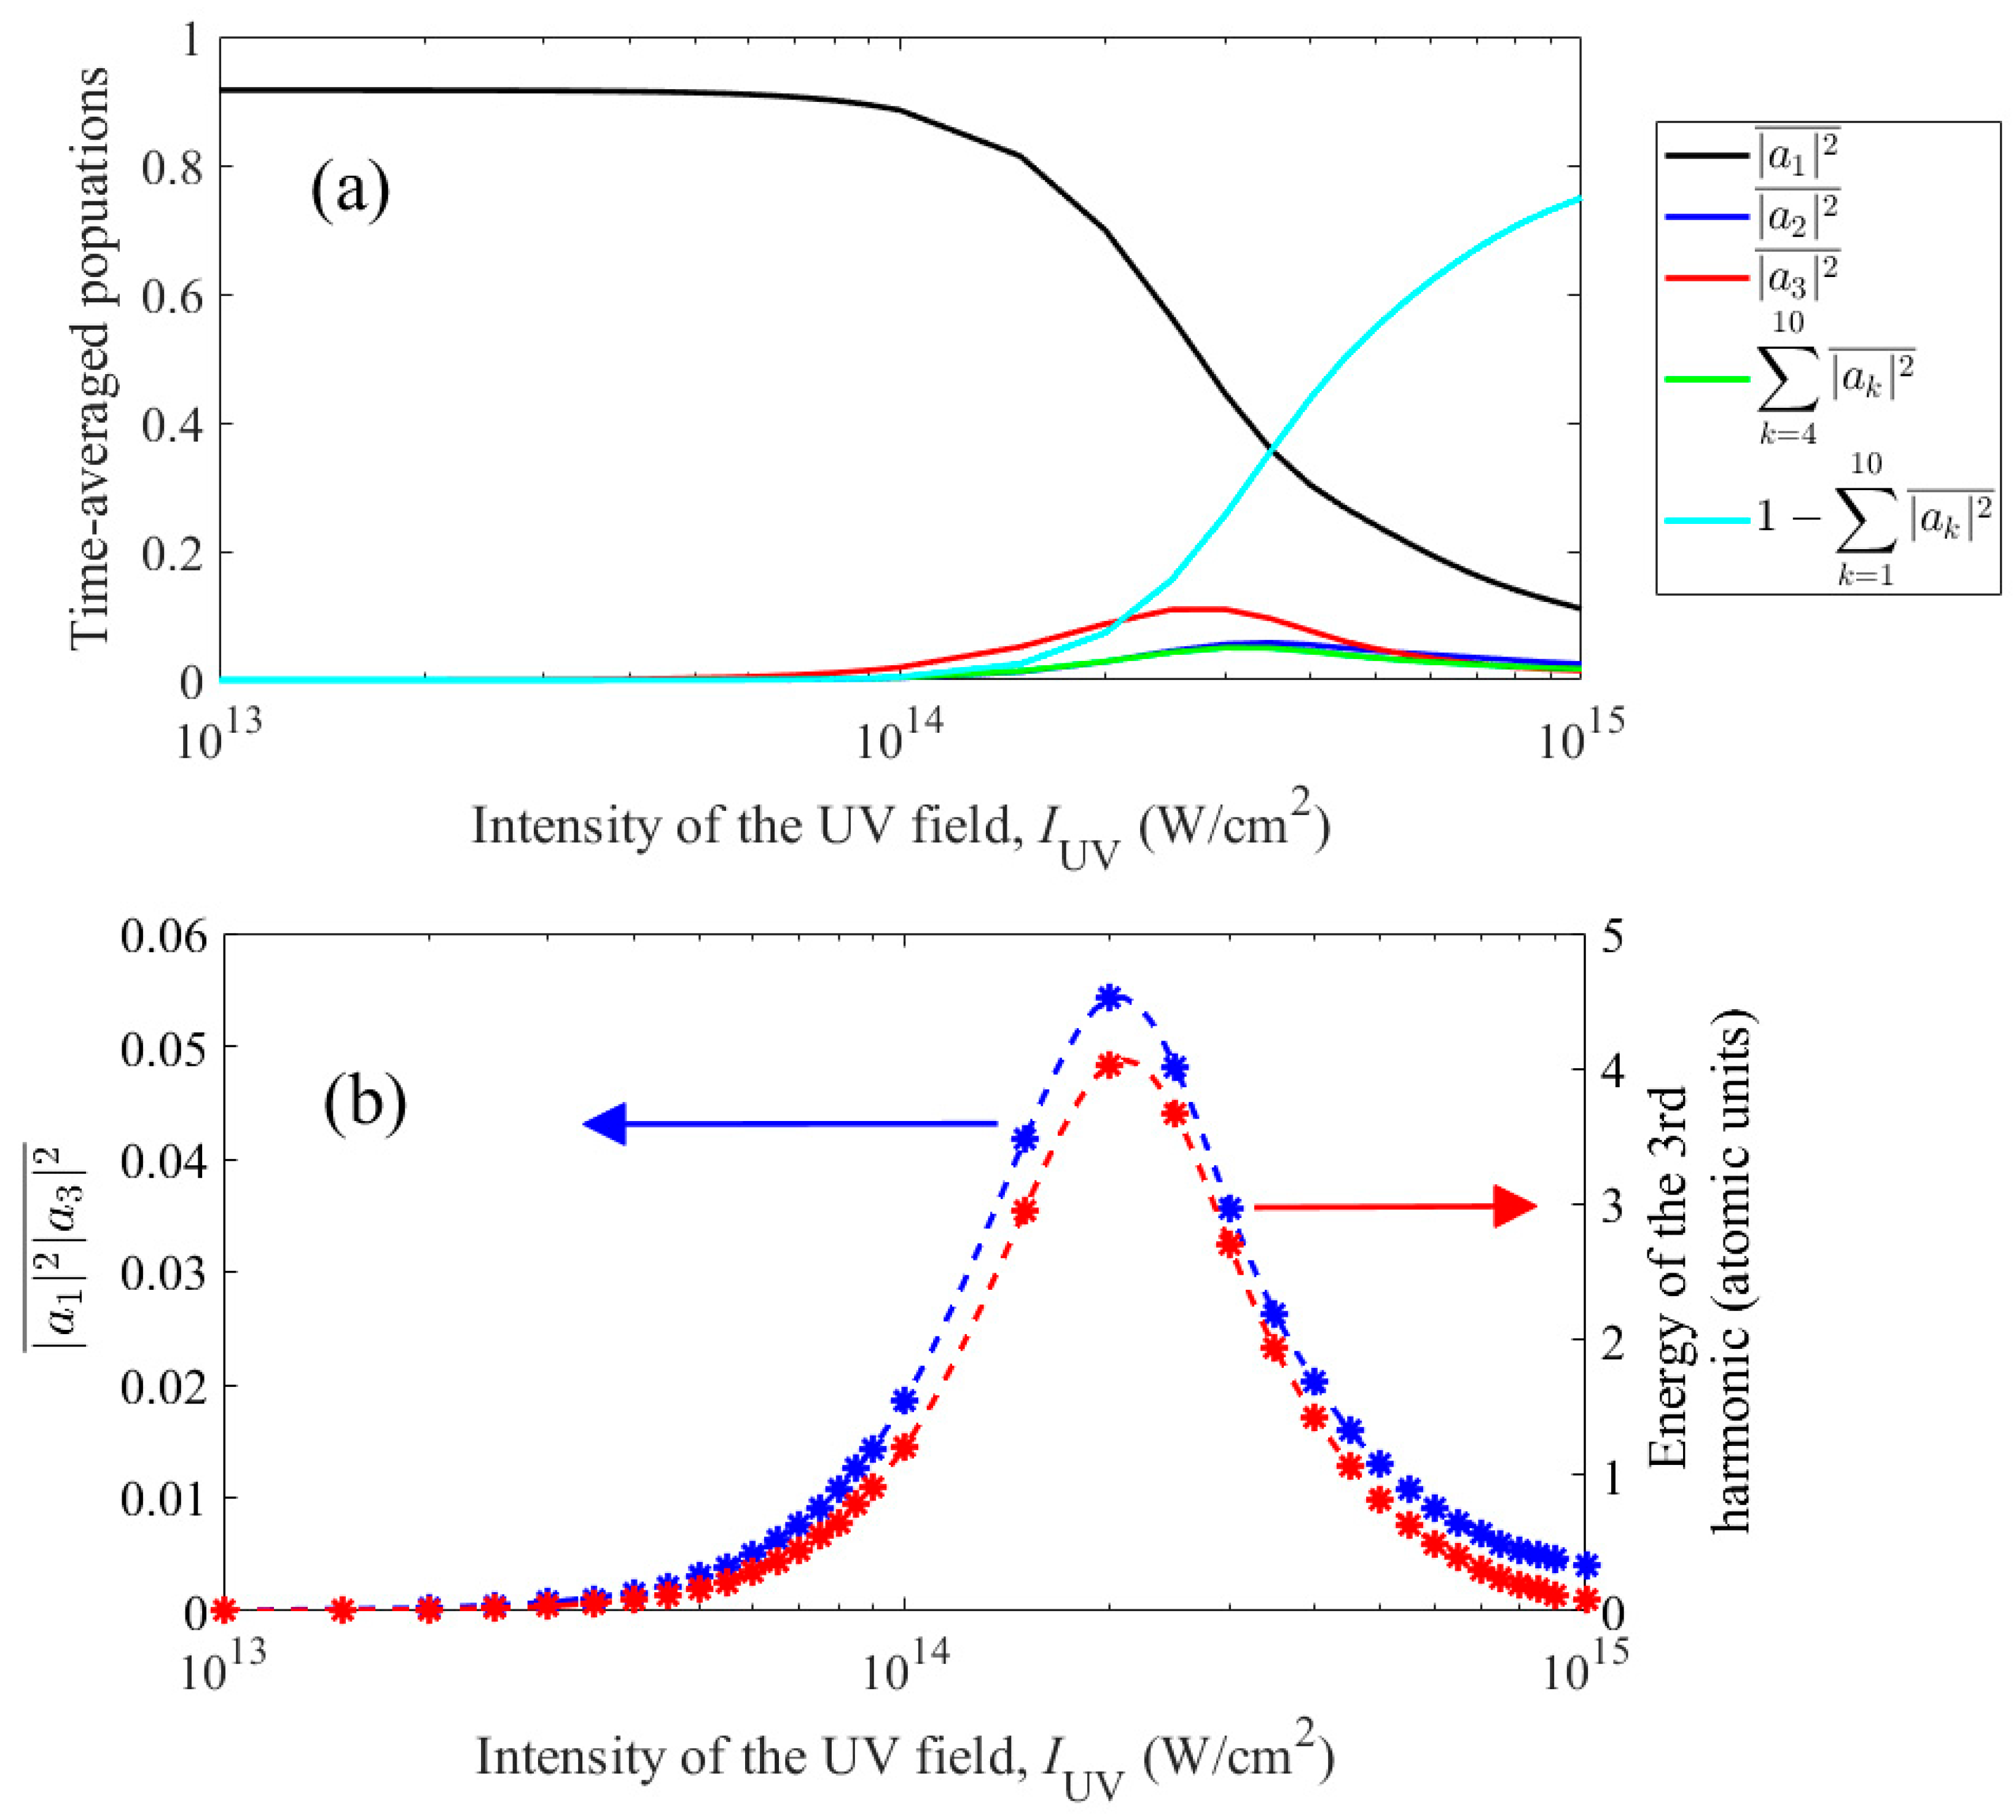
This statement is illustrated in Figure 6. The upper part of the figure (Figure 6a) shows the time-averaged populations of bound states, a k 2 ¯ , and the total population of continuum states, 1 k a k 2 ¯ , as a function of the UV field intensity. In Figure 6, Nosc = 30 (see (3)), and the frequency of the UV field for each intensity is chosen equal to the frequency of the three-photon transition |1s2〉–|1s2p〉 in the field taking into account the dynamic Stark effect (see the black solid curve in Figure 2). The lower part of the figure (Figure 6b) shows (i) the time-averaged product of the populations of the states |1s2〉 and |1s2p〉, a 1 s 2 2 a 1 s 2 p 2 ¯ = a 1 2 a 3 2 ¯ , and (ii) the energy of the third harmonic in the spectrum of the dipole acceleration of the atom as a function of the intensity of the UV field. As can be seen from Figure 6b, up to the dimension factor, these two dependences practically coincide. Thus, to maximize the third harmonic energy, it is necessary to most effectively excite the |1s2p〉 state without excessively depleting the |1s2〉 state.
This conclusion allows us to explain the dependence of the frequency that maximizes the energy of the third harmonic in the spectrum of the dipole acceleration of an atom on the intensity of the UV field in Figure 3. In a relatively weak field, the depletion of the |1s2〉 state is not significant (see Figure 6a), and the optimum is achieved at maximum excitation of the |1s2p〉 state, i.e., when adjusting the frequency of the UV field to three-photon resonance. At the optimal UV field intensity, IUV = 2 × 10¹⁴ W/cm2, a balance is achieved between excitation of the |1s2p〉 state and depletion of the |1s2〉 state, in this case, the optimal frequency of the UV field remains in the immediate vicinity of the resonant transition frequency. With a further increase in the intensity of the UV field during resonant excitation of the |1s2〉–|1s2p〉 transition, both the populations of bound states and the third harmonic energy decrease as a result of the ionization of the atom (see Figure 6a). Accordingly, the optimal frequency of the UV field in Figure 3 moves away from the resonant one, which makes it possible to reduce the probability of ionization and, thereby, maintain a noticeable population of the |1s2〉 and |1s2
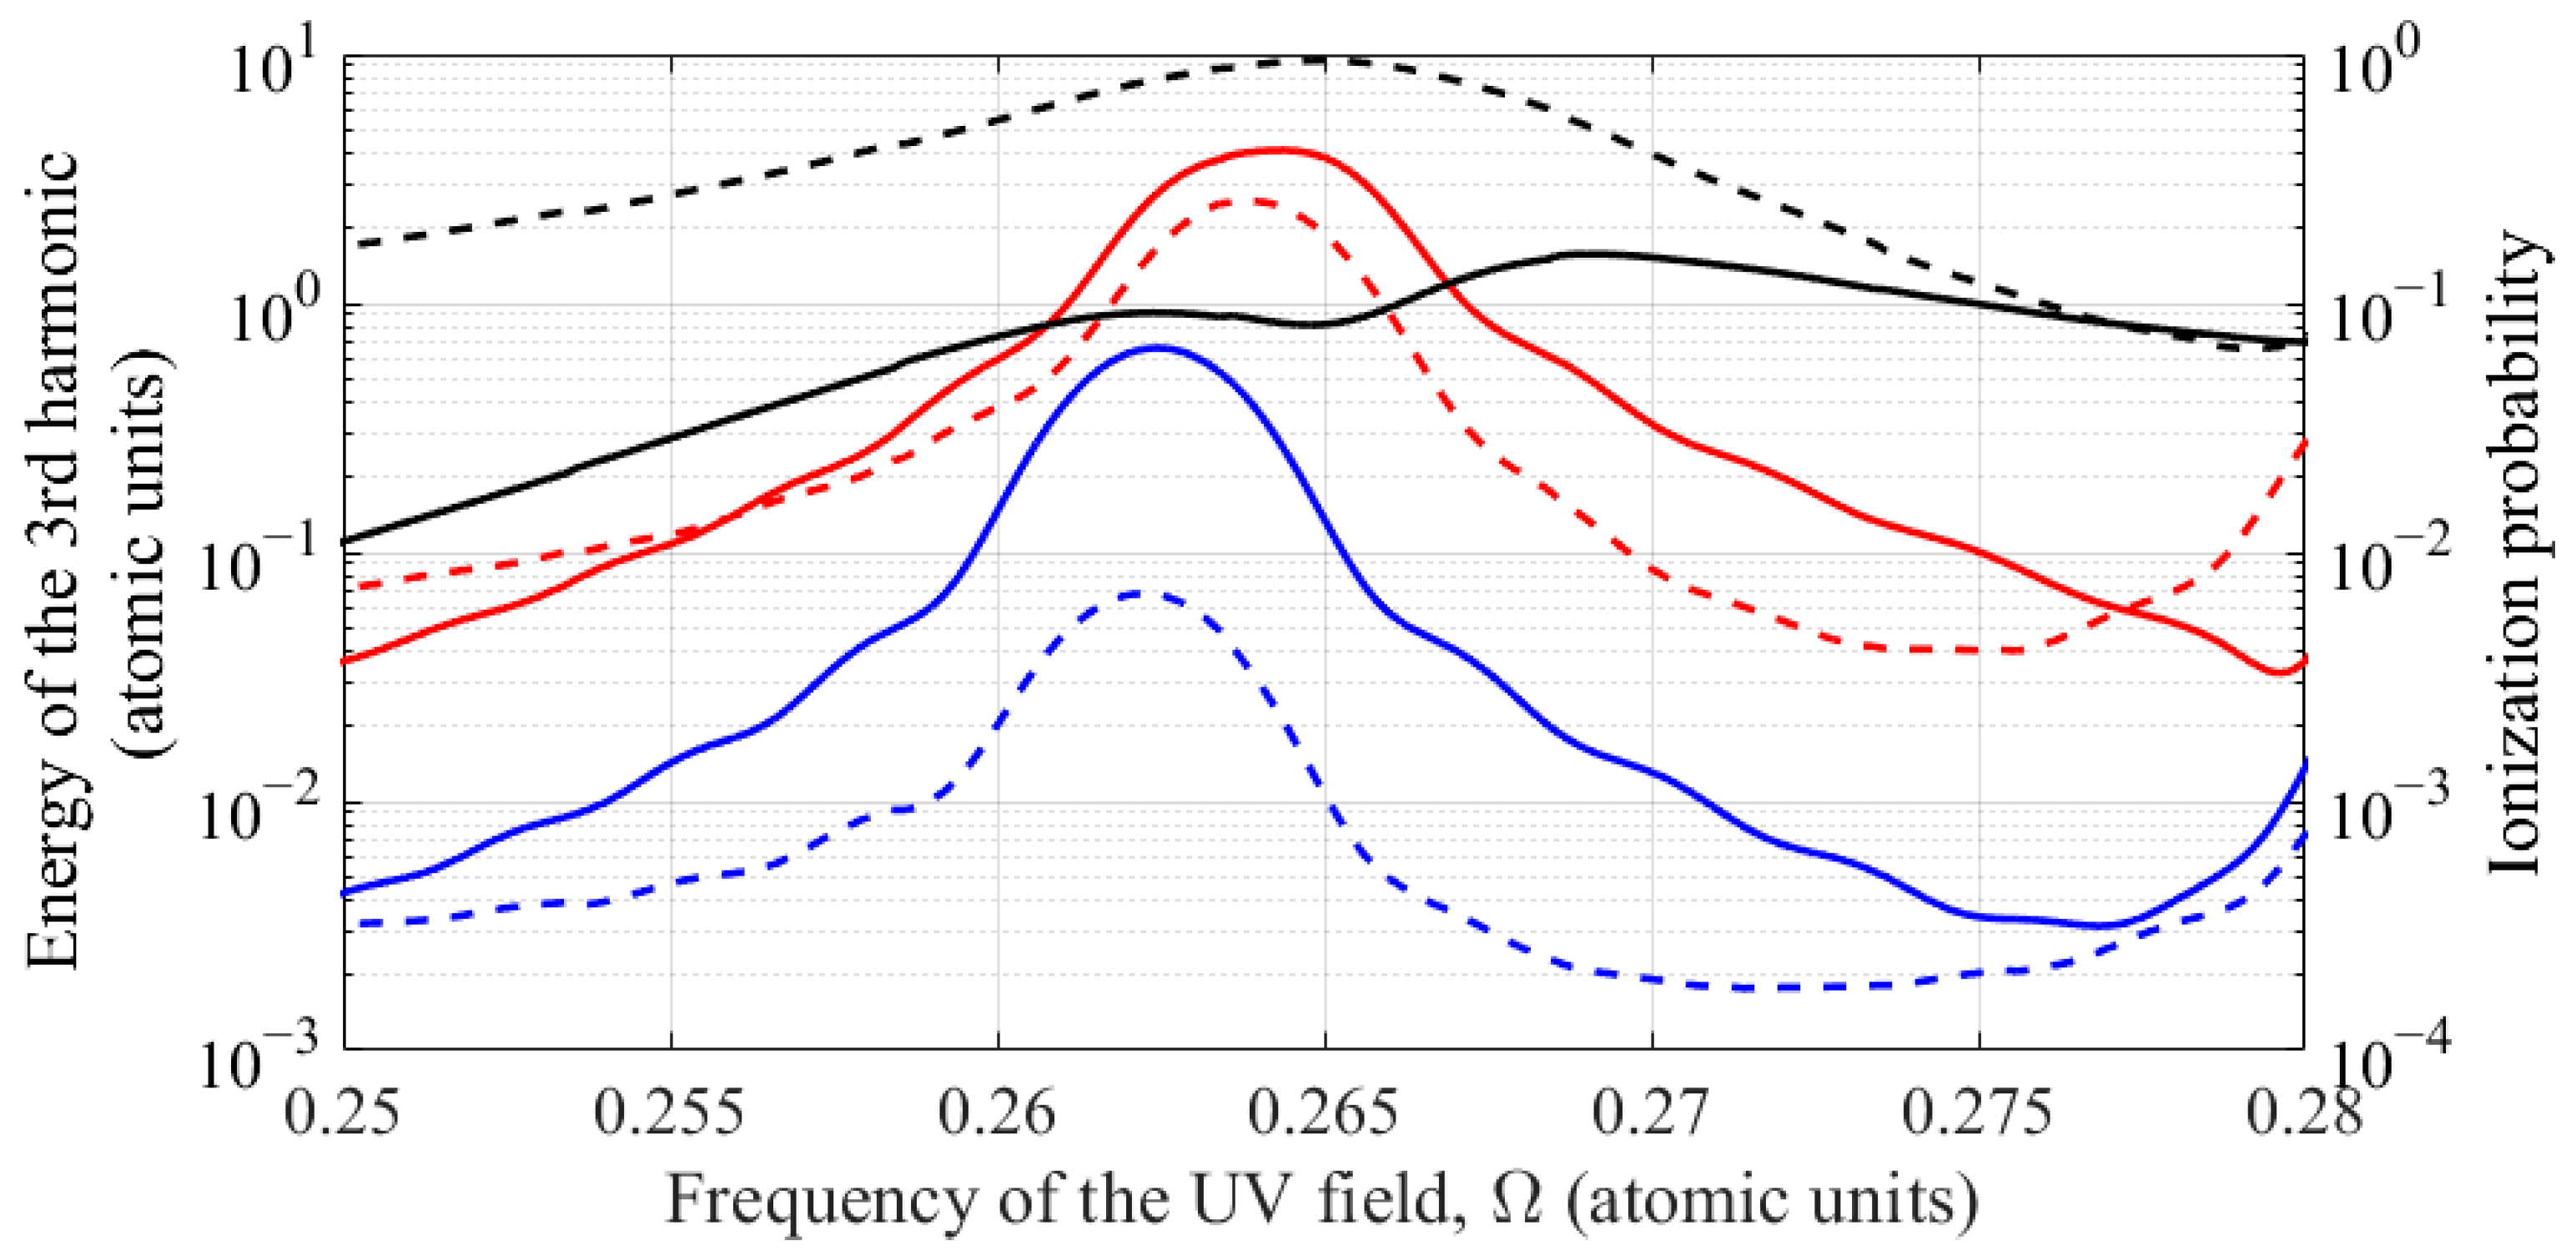
p〉 states. These conclusions are confirmed in Figure 7, showing the frequency dependencies of (i) the energy of the third harmonic in the dipole acceleration spectrum and (ii) the atomic ionization probability for three different values of the UV field intensity: IUV = 8 × 10¹³ W/cm2, IUV = 2 × 10¹⁴ W/cm2, and IUV = 5 × 10¹⁴ W/cm2. While in a relatively weak UV field, the shape and position of maxima of the dependencies (i) and (ii) almost coincide, with growing UV field intensity, the difference in these dependencies increases, and for the highest considered intensity, the maximum in ionization probability coincides with a local minimum in the third harmonic energy.
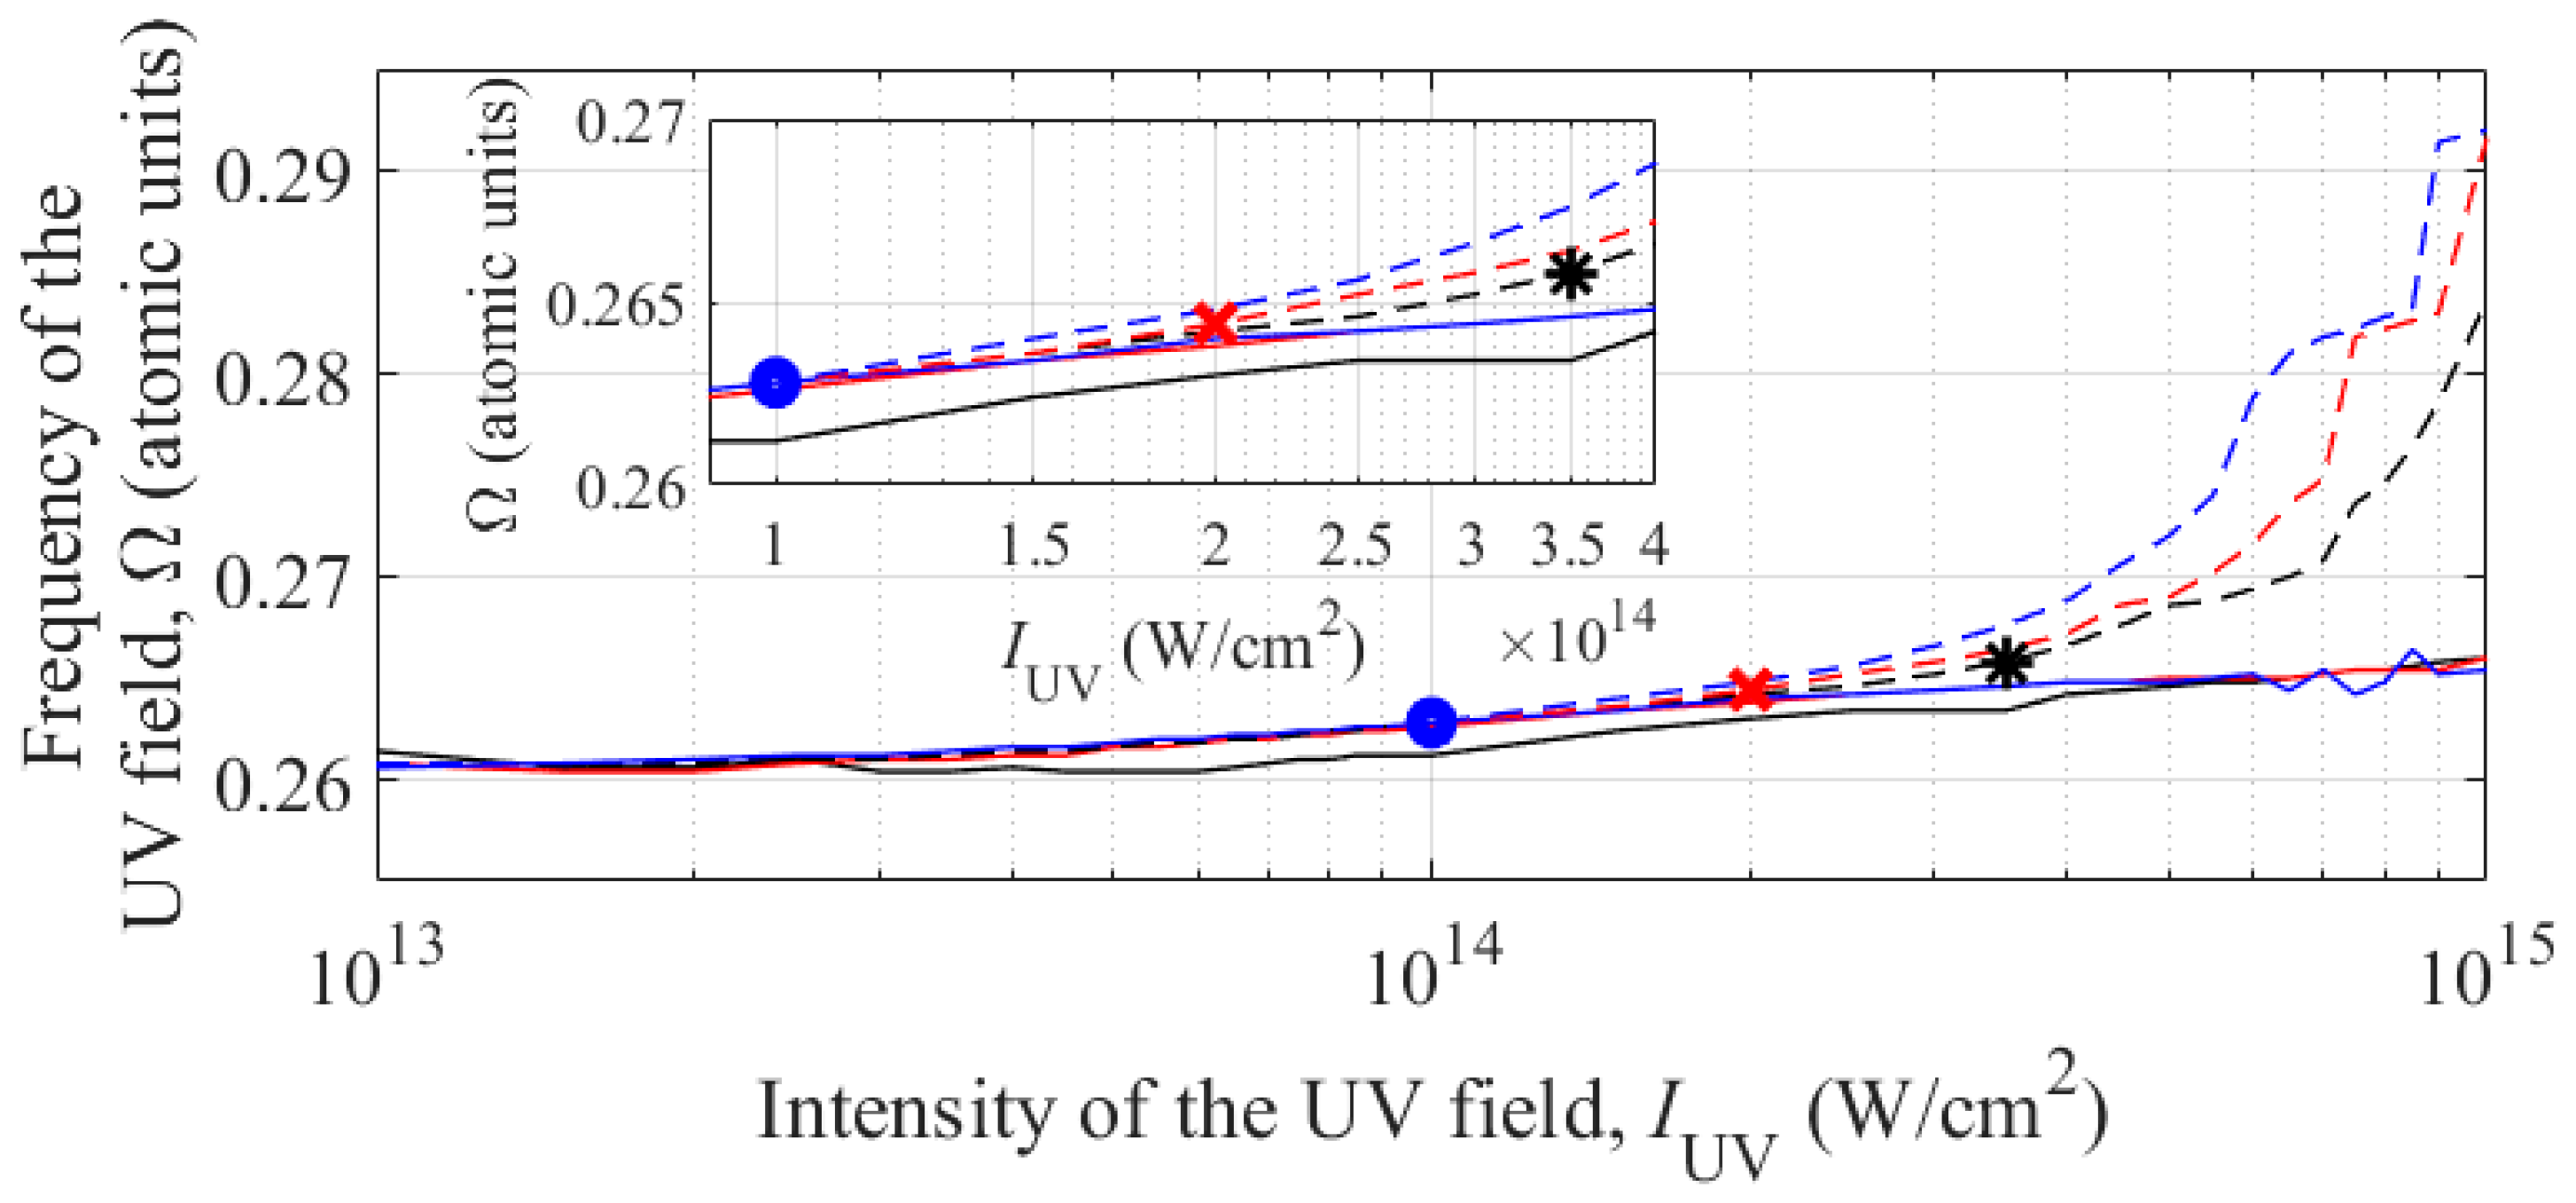
Next, using the expansion of the wave function in terms of the basis of stationary states, we study the dependence of the conditions that maximize the energy of the third harmonic in the spectrum of the dipole acceleration of an atom on the duration of the constant amplitude interval in the UV field envelope (parameter Nosc, see (3)). Figure 8 for three values of Nosc = 10, 30, and 100 shows the dependences of (i) the frequencies of the resonant three-photon transition |1s2〉–|1s2p〉 and (ii) the frequencies of the UV field that maximize the energy of the third harmonic in the dipole acceleration spectrum on the intensity of the UV field.
The resonance frequencies of the three-photon transition |1s2〉–|1s2p〉 for different durations of the UV field envelope practically coincide, which is due to the short establishing time of the dynamic Stark effect [50]. Some difference in the transition frequency is observed for the shortest pulse (Nosc = 10) and is explained by the fact that the total duration of the intervals of turning on and off the UV field (3 + 3 = 6 carrier cycles) in this case is comparable to the duration of the constant amplitude interval (10 carrier cycles). Accordingly, the time-average intensity of the UV field turns out to be noticeably lower than the peak intensity, and the Stark effect at the same peak intensity is weaker than for UV field pulses with a longer duration of the constant amplitude interval. At the same time, jumps in the position of the resonance frequency in the longest pulse (Nosc = 100) with an intensity of the order of 1015 W/cm2 are explained by the extremely high, exceeding 99.99%, probability of single ionization of the atom and the unreliability of the algorithm for determining the resonance frequency under such conditions.
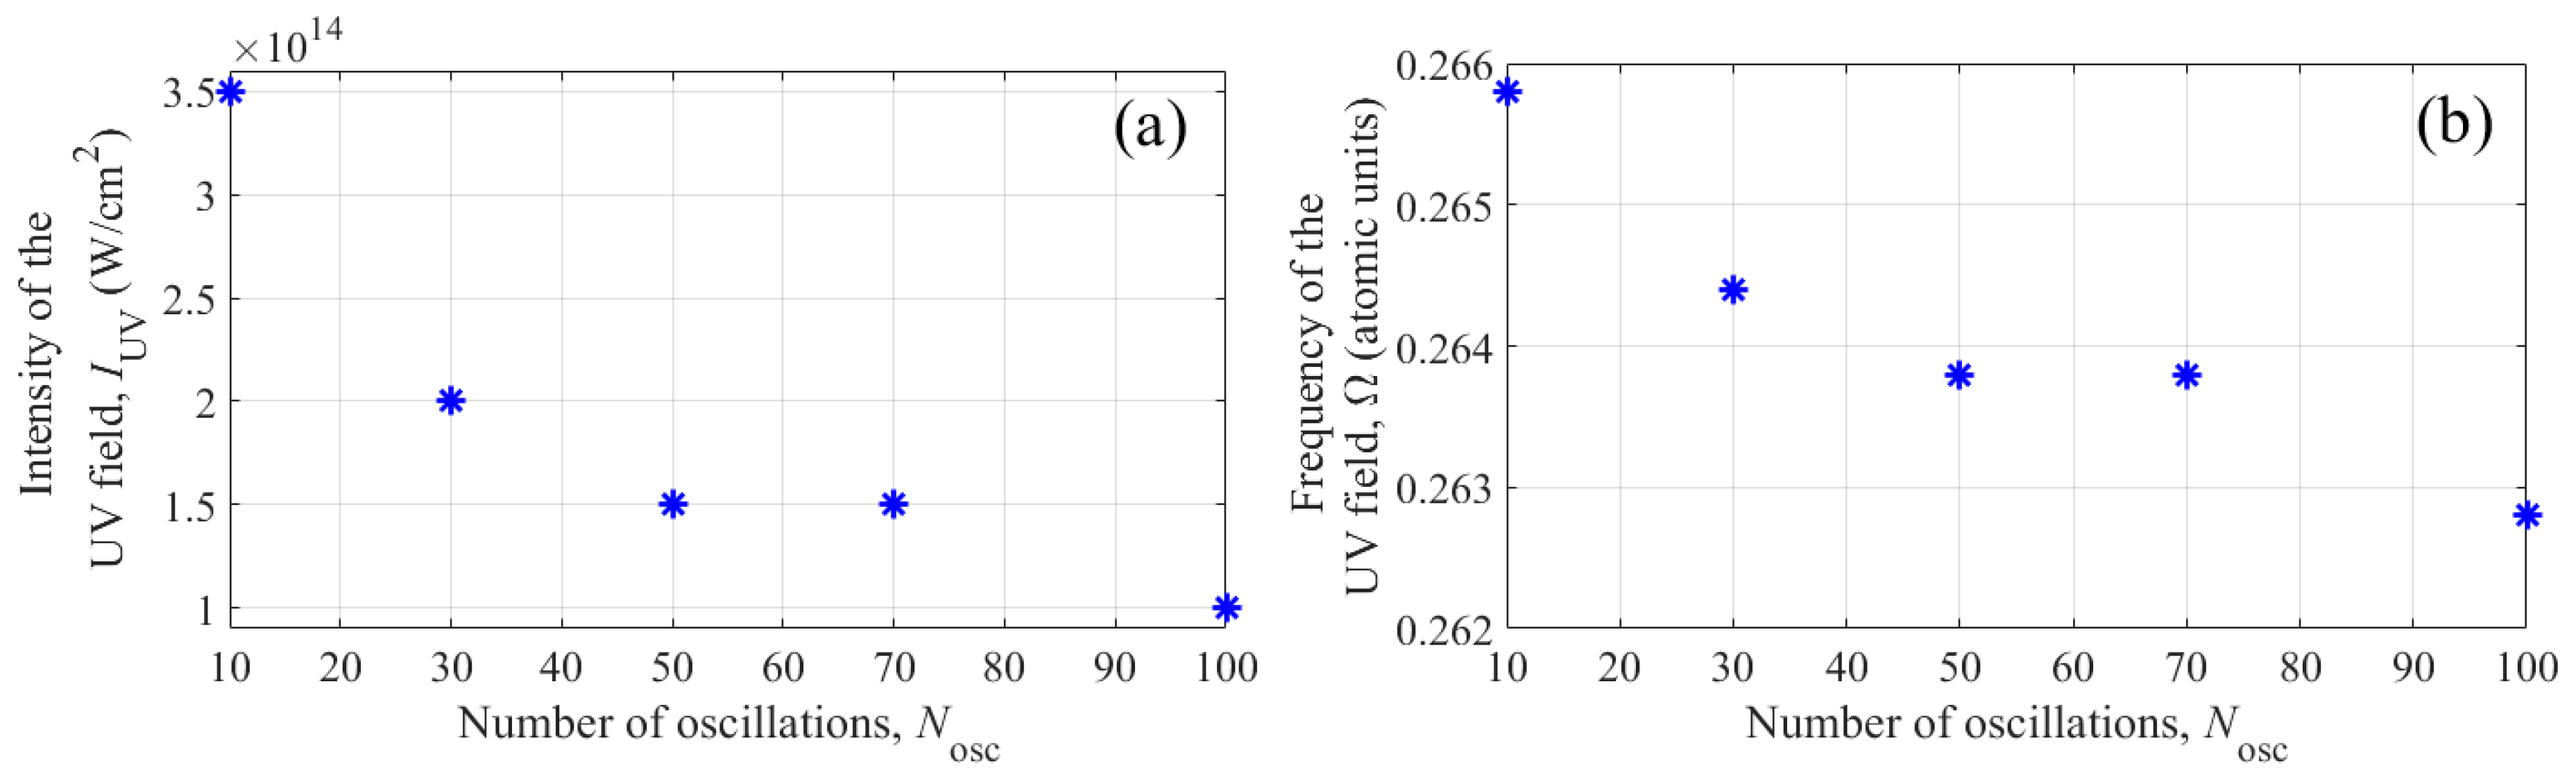
The dependences of the UV field frequencies that maximize the third harmonic energy differ more significantly for different durations of the UV field envelope. At a fixed intensity, with an increasing duration of the UV field pulse, the optimal detuning from the resonance frequency increases. At the same time, the optimal intensity of the UV field decreases with increasing envelope duration; namely, for Nosc =10, 30, and 100, the optimal values are IUV = 3.5 × 10¹⁴ W/cm2, 2 × 10¹⁴ W/cm2, and 1014 W/cm
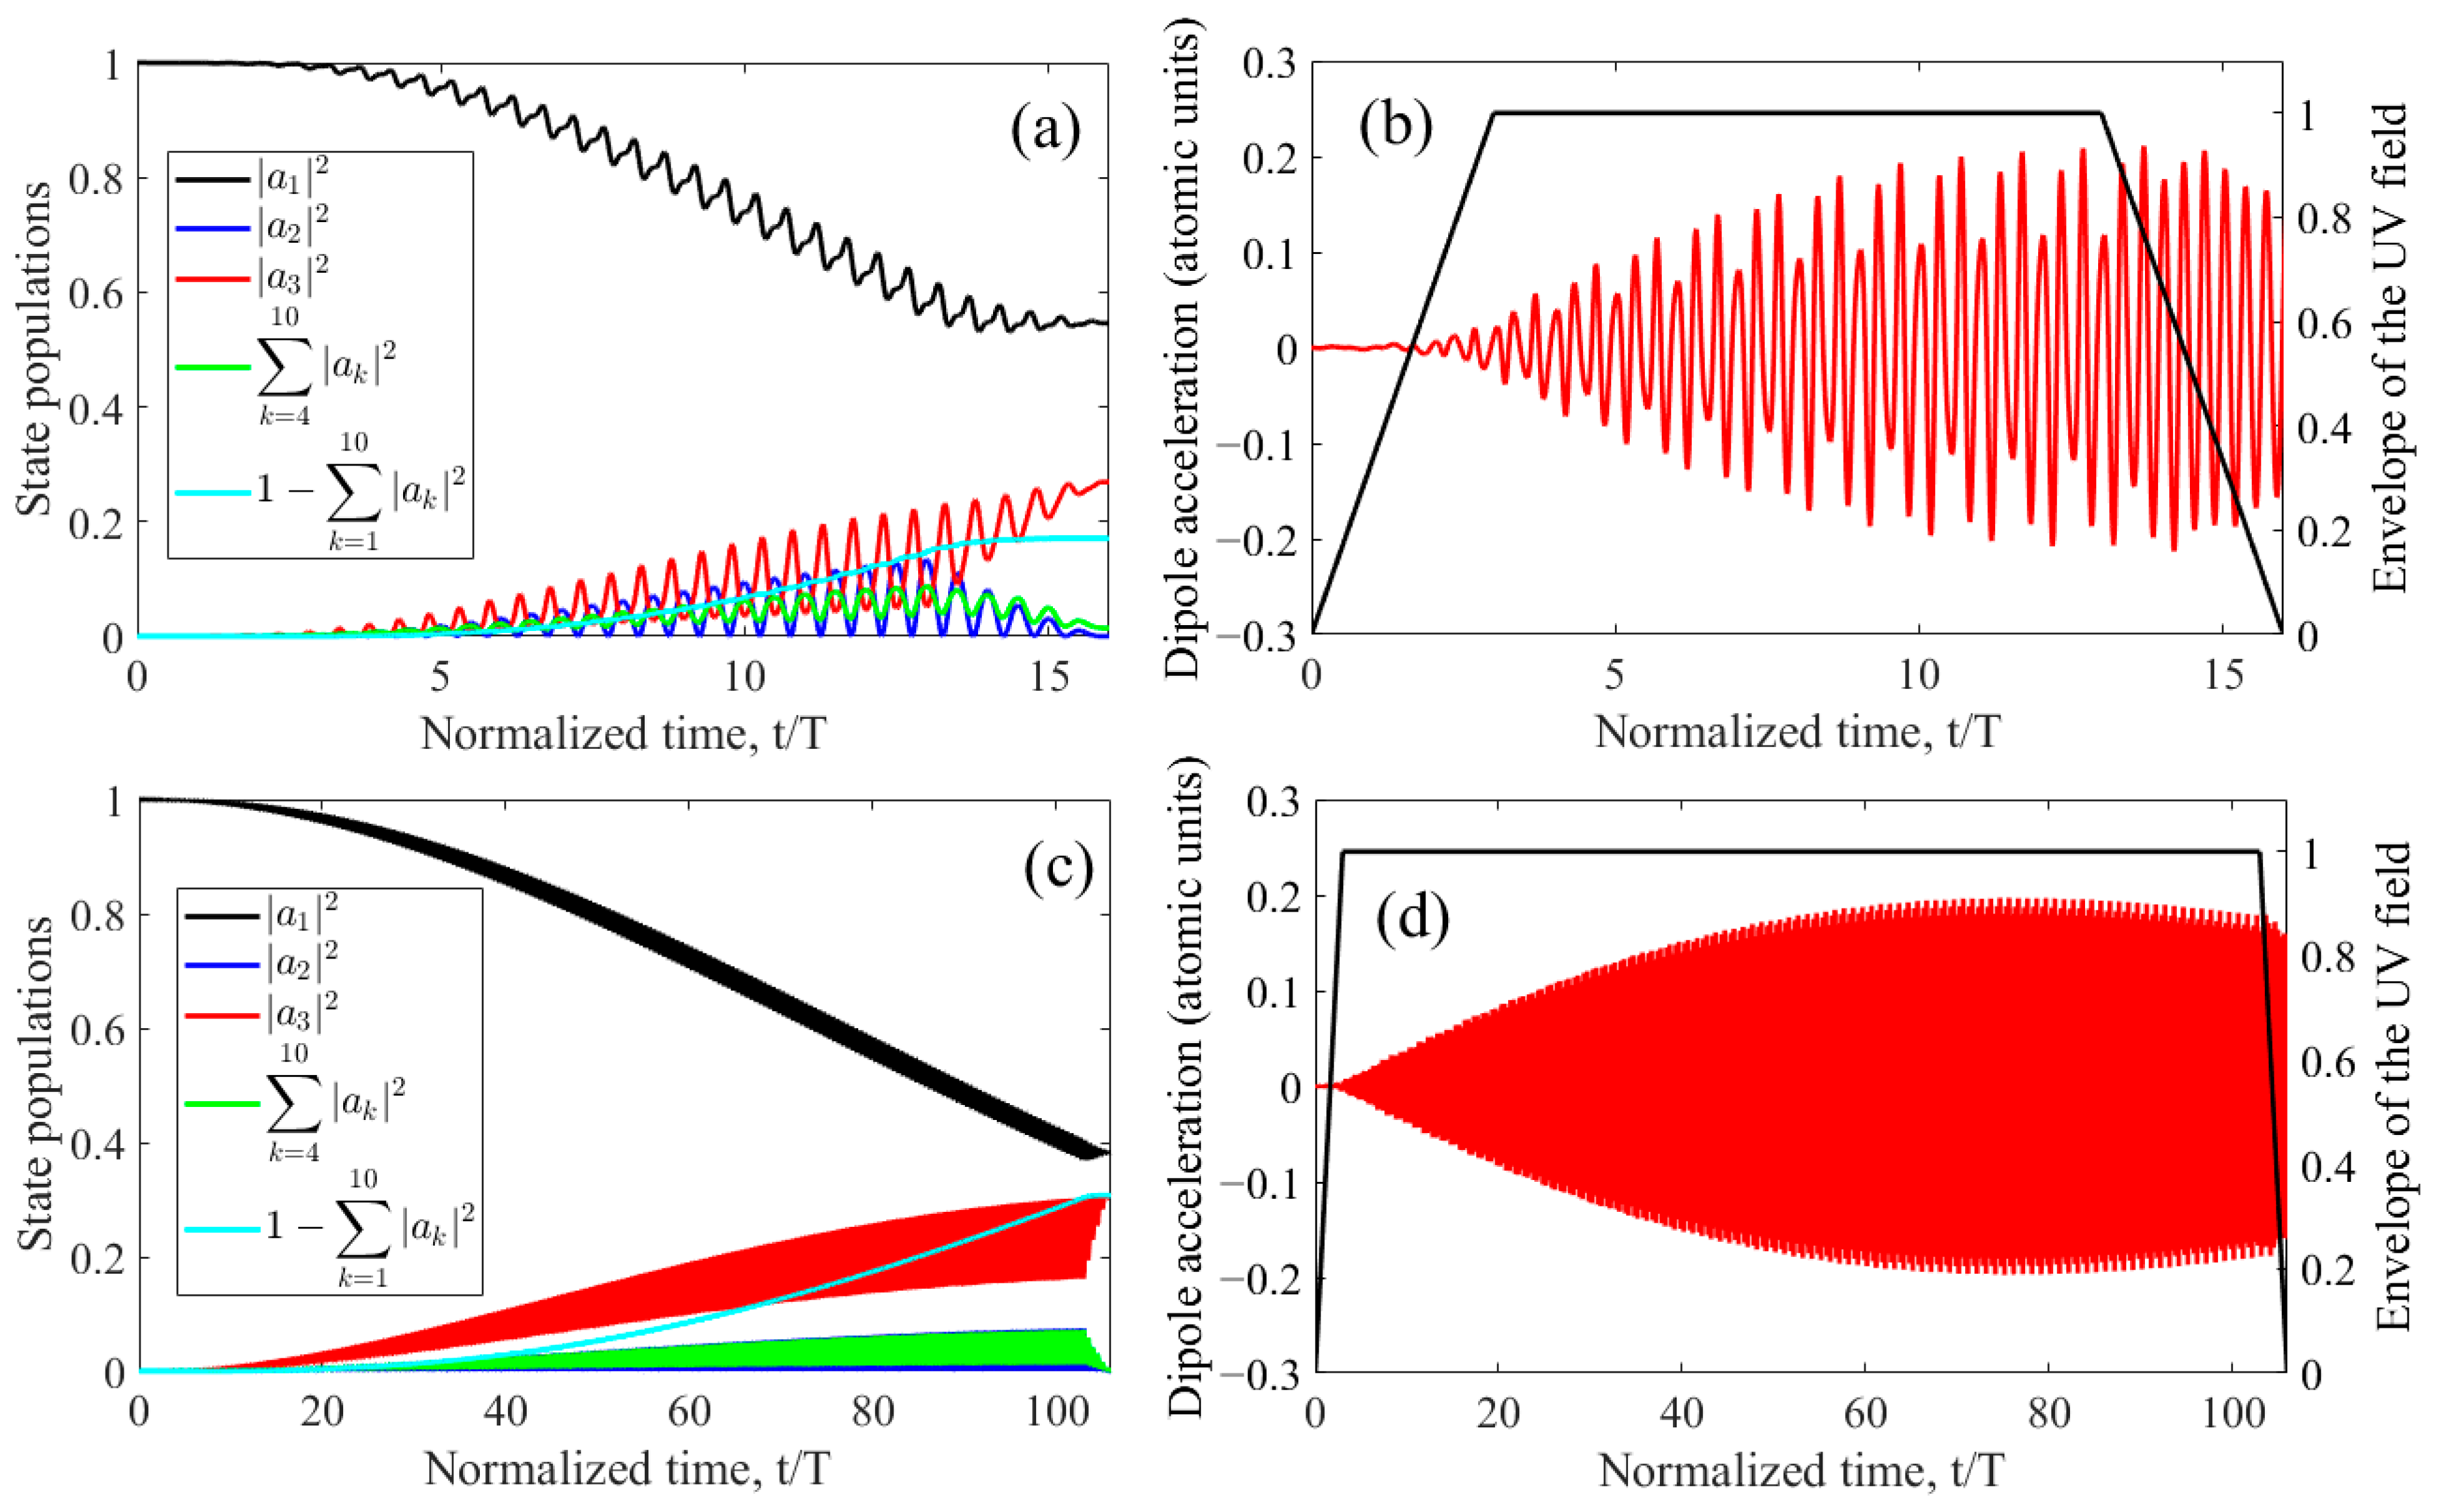
2, respectively. To interpret these data, let us turn to Figure 9, which shows the time dependences of the populations of states |1s2〉, |1s2s〉, and |1s2p〉, as well as the total population of more highly excited bound states and the total population of states of the continuum (a,c) and electron dipole acceleration as a function of time (b,d). Figure 9a,b correspond to the UV field pulse of the shortest duration considered, Nosc = 10, while Figure 9c,d are plotted for the case of Nosc = 100.
As can be seen from a comparison of Figure 9b,d, for the considered UV field parameters, which are optimal for each envelope duration, (i) the time dependences of the dipole acceleration in the interval of the constant amplitude of the UV field are similar to each other, and (ii) the peak amplitude of the dipole acceleration is approximately the same. Similar conclusions follow from 
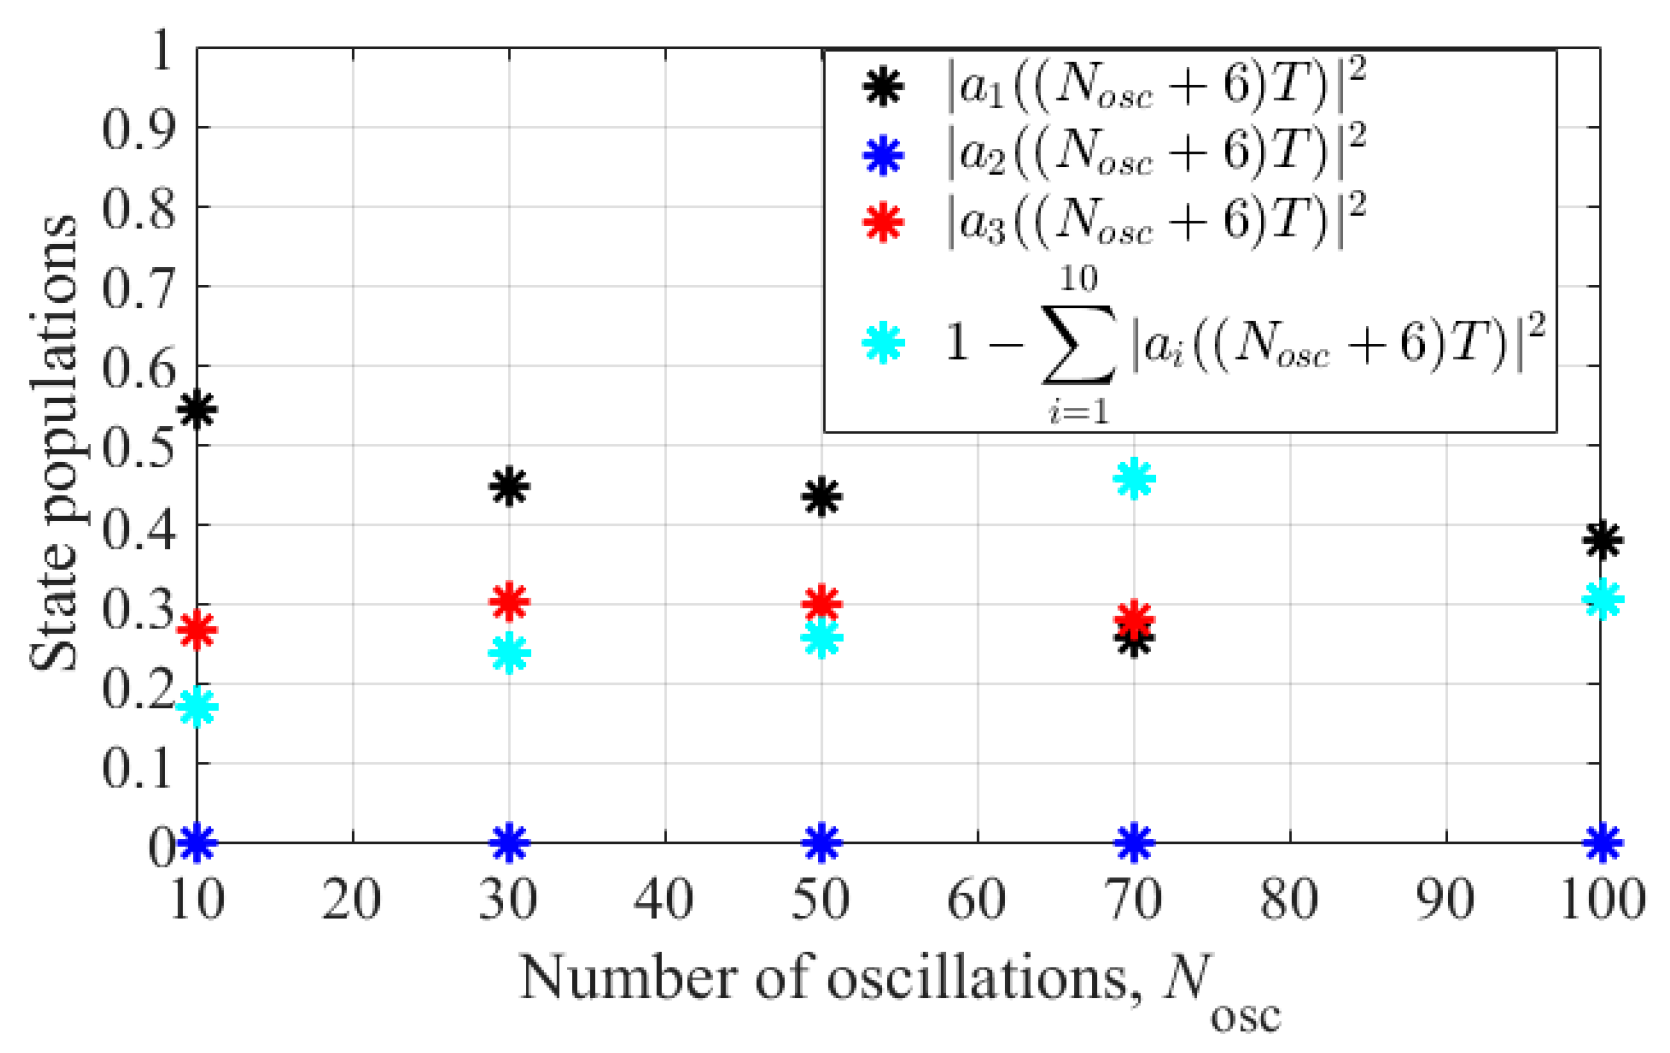
Figure 9a,c, namely, with an optimal choice of UV field parameters, the dynamics of excitation of stationary states weakly depend on the duration of the field envelope, and only the time scale of the process changes significantly (proportional to the duration of the UV field pulse). Under optimal conditions, at the end of the UV pulse, the atom goes into the resonant state |1s2p〉 with a noticeable probability of about 20–30%, ionizes with a comparable probability, and remains in the ground state |1s2〉 with a probability of about 40–50%. Accordingly, the optimal parameters of the UV field are those that, for different envelope durations, provide the same (optimal) character of excitation of the atom during its interaction with the field. Thus, an increase in the optimal intensity of the UV field with a decrease in the duration of its envelope is caused by the need to provide the same (optimal) degree of excitation of the atom in a shorter interaction time.
At the same time, at a fixed intensity of the UV field, the excitation and ionization of the atom increase or decrease as the frequency of the UV field approaches or moves away from the frequency of the three-photon resonance with the |1s2〉–|1s2p〉 transition. Accordingly, with increasing duration of the UV field envelope at a fixed intensity, the optimal detuning of the field frequency from resonance increases, and with decreasing duration, and vice versa, it decreases. Note that some differences in the degree of excitation and ionization of an atom for different durations of the envelope (and, accordingly, different intensities) of the UV field (see Figure 9a,c) are due to differences in the dependences of (i) excitation probabilities and (ii) probabilities of ionization of an atom on the strength of the UV field.
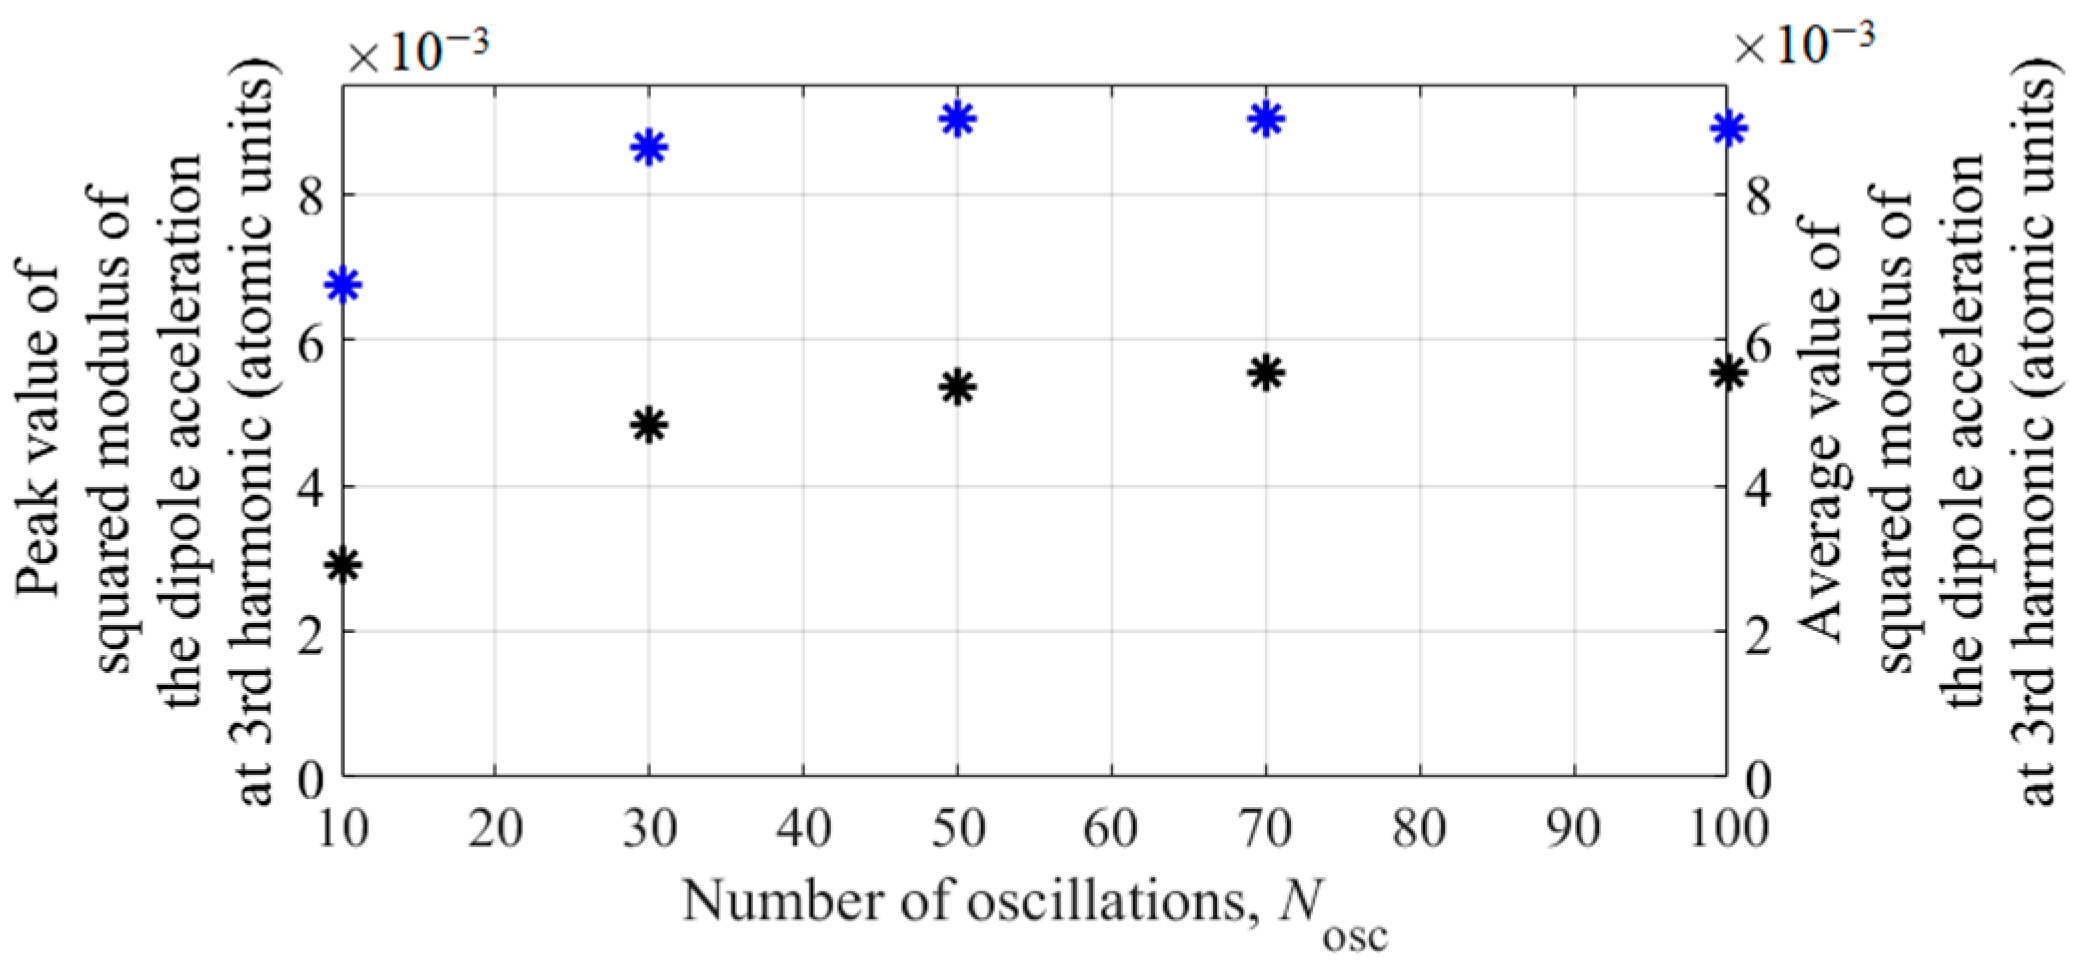
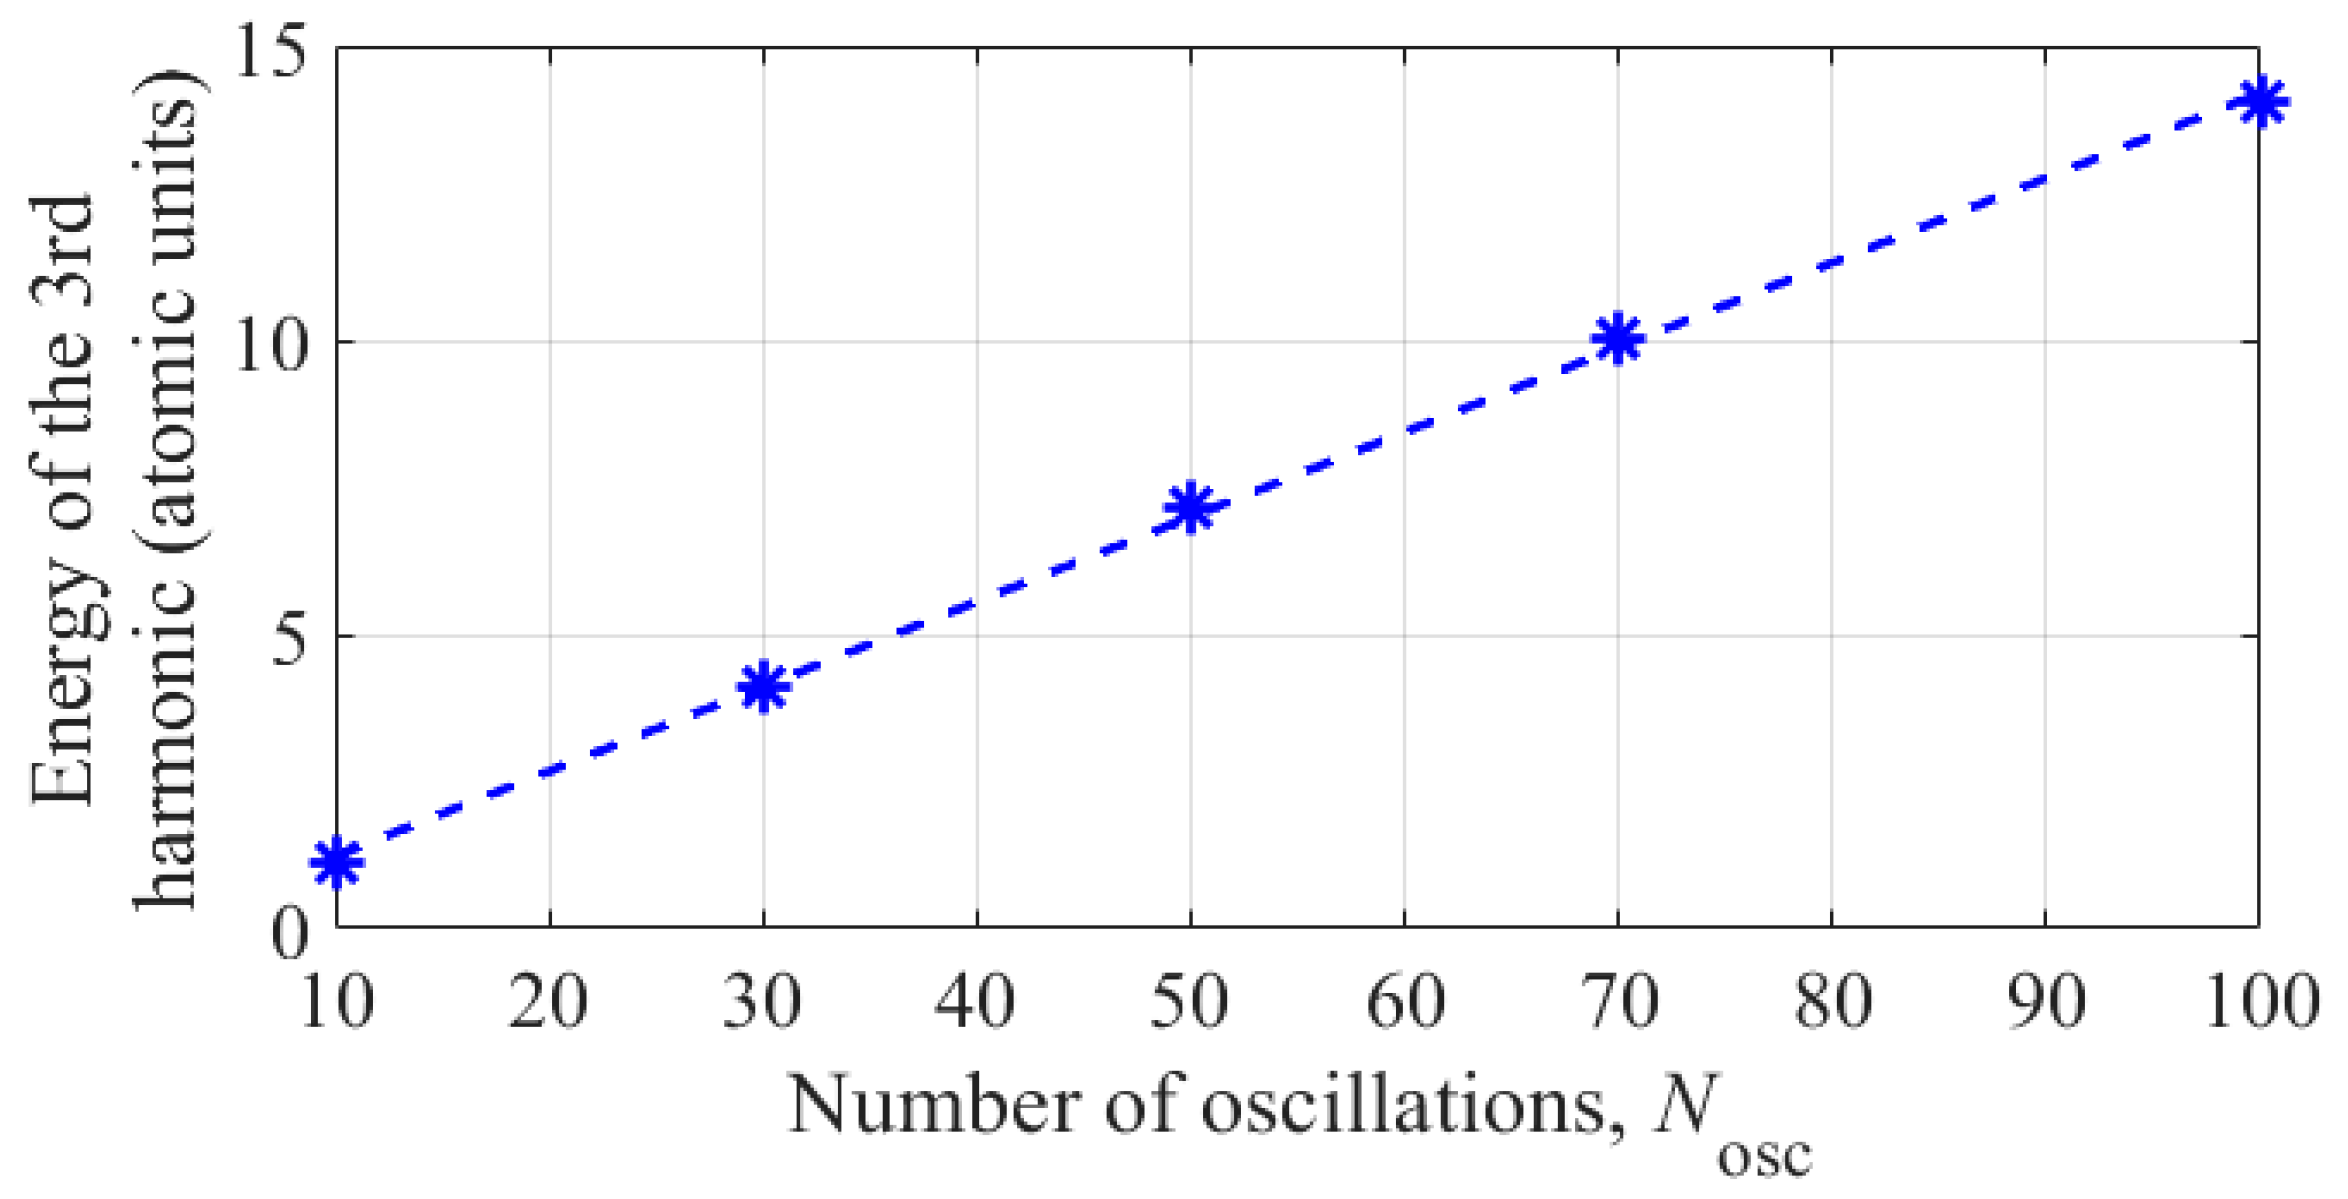
In conclusion of this section, we note that the energy concentrated in the third harmonic of the dipole acceleration of an atom varies approximately in proportion to the duration of the constant amplitude interval in the UV field envelope, see Figure 10. This means that in the conditions under consideration, the average power concentrated in the third harmonic in the spectrum of dipole acceleration of the atom does not depend on the duration of the UV field envelope. Note, however, that with the shortening of the UV field pulse envelope, to achieve the same atomic response power at the third harmonic frequency, an increase (proportional to the optimal intensity value, see Figure 8) in UV radiation power is required.
(i) The optimal parameters of the UV field, (ii) the population of states at the end of the UV field pulse with optimal intensity and frequency, and (iii) the power of the dipole acceleration of an atom at the third harmonic frequency in a UV field as functions of Nosc are given in Appendix D.

4. Conclusions

This study analyzes the conditions under which the energy of the third harmonic of the UV field in the dipole acceleration spectrum (the second time derivative of the induced dipole moment) for a helium atom reaches a maximum. The frequency range of the UV field is addressed, which includes resonances with three-photon transitions from the ground to excited bound states of the atom. It is shown that the optimal frequency of the UV field practically coincides with the frequency of the three-photon transition |1s2〉–|1s2p〉 taking into account its shift due to the dynamic Stark effect. In this case, the highest energy of the third harmonic is achieved under conditions of maximizing the time-averaged (over the duration of the UV field pulse) product of the populations of the states |1s2〉 and |1s2p〉. For the considered UV field pulses with a constant amplitude interval duration from 10 to 100 periods of field oscillations (which, for different frequencies of the UV field, corresponds to from 5 to 60 femtoseconds), the optimal UV field intensity ranges from 1014 W/cm2 to several units of 1014 W/cm2. Under optimal conditions, at the end of the UV pulse, the atom is excited to the resonant state |1s2p〉 with a probability of about 20–30%, ionized with a comparable probability, and remains in the ground state |1s2〉 with a probability of about 40–50%. It is shown that with an optimal choice of the frequency and intensity of the UV field, the dynamics of excitation of bound and continuum states, as well as the shape of the time envelope of the dipole acceleration of the atom, weakly depend on the duration of the UV field envelope; only their time scale changes significantly. In addition, the average power of the third harmonic signal in the dipole acceleration spectrum is also practically independent of the duration of the UV field envelope. Thus, the optimal regime of the resonant three-photon excitation of the helium atom, which maximizes the energy of the third harmonic of the UV field in its spectrum of dipole acceleration, has been found and numerically investigated.

Author Contributions

Conceptualization, V.A.A., I.R.K. and M.Y.R.; methodology, V.A.A., I.R.K., M.Y.E. and E.V.G.; software, I.R.K., M.Y.E. and M.M.P.; validation, V.A.A., E.V.G. and M.Y.R.; investigation, I.R.K., M.Y.E., M.M.P. and V.A.A.; visualization, I.R.K.; writing—original draft, I.R.K. and V.A.A.; writing—review and editing, I.R.K., V.A.A. and M.Y.R.; supervision, V.A.A., E.V.G. and M.Y.R.; funding acquisition, M.Y.R. All authors have read and agreed to the published version of the manuscript.

Funding

This research was funded by the Russian Science Foundation (grant No. 22-12-00389).

Institutional Review Board Statement

Not applicable.

Informed Consent Statement

Not applicable.

Data Availability Statement

Data are contained within the article.

Acknowledgments

The authors are grateful to the Joint Supercomputer Center of RAS for the provided supercomputer sources.

Conflicts of Interest

The authors declare no conflict of interest.

Appendix A. Main Parameters of the Models Used

The energies of bound states taken into account in the expansion of wavefunction (4) are summarized in Table A1. While solving Equations (6) and (7), we used the spectroscopic characteristics of a three-dimensional two-electron helium atom, calculated using the multi-configuration Hartree–Fock approach.
Table A1. The energies of bound states taken into account in the expansion of wavefunction (4). The first and second columns show the state number and the state notation, respectively. The third and fourth columns show the state energies, calculated by the multi-configuration Hartree–Fock approach and used while solving Equations (6) and (7) (third column), and within the single-electron two-dimensional model of a helium atom (11) and (12) (fourth column). The fifth column shows the differences between the values in the fourth and third columns.
State NumberState NotationEn
(Atomic Units)
En(2D)
(Atomic Units)
En(2D)En
(Atomic Units)
1 1 s 2 −0.9036−0.90340.0002
2 1 s 2 s −0.1435−0.1442−0.0007
3 1 s 2 p −0.1224−0.1276−0.0052
4 1 s 3 s −0.0606−0.0607−0.0001
5 1 s 3 p −0.0547−0.0564−0.0017
6 1 s 3 d −0.0555−0.0647−0.0092
7 1 s 4 s −0.0333−0.0334−0.0001
8 1 s 4 p −0.0309−0.0316−0.0007
9 1 s 4 d −0.0312−0.0350−0.0038
10 1 s 4 f −0.0313−0.0366−0.0053
The dipole moments of transitions between the considered states, calculated using the multi-configuration Hartree–Fock approach, are given by the matrix:
d ^ z = 0 0 0.3953 0 0.1961 0 0 0.1235 0 0 0 0 2.9401 0 0.9439 0 0 0.4754 0 0 0.3953 2.9401 0 1.0635 0 2.5508 0.3734 0 0.8901 0 0 0 1.0635 0 7.1828 0 0 1.6045 0 0 0.1961 0.9439 0 7.1828 0 5.2823 2.6373 0 4.1360 0 0 0 2.5508 0 5.2823 0 0 0.5703 0 5.1899 0 0 0.3734 0 2.6373 0 0 13.1144 0 0 0.1235 0.4754 0 1.6045 0 0.5703 13.1144 0 10.8203 0 0 0 0.8901 0 4.1360 0 0 10.8203 0 8.1058 0 0 0 0 0 5.1899 0 0 8.1058 0
The squared values of dipole moments of transitions from the bound states to the continuum states as functions of energy of the continuum state, ε, are shown in Figure A1.
Figure A1. The dependencies of squared dipole moments of transitions from the bound states taken into account to the corresponding continuum states as functions of energy of the continuum state, ε. Panel (a) corresponds to the |1s2〉 state, panel (b) corresponds to the bound states with principal quantum number n = 2, and panels (c,d) correspond to n = 3 and n = 4, respectively.
Photonics 10 01387 g0a1
In turn, the single-electron two-dimensional model of a helium atom (11) and (12) gives the following matrix of dipole moments of transitions between the lowest bound states:
d ^ z ( 2 D ) = 0 0 0.2555 0 0.1261 0 0 0.0793 0 0 0 0 3.4102 0 0.9744 0 0 0.4722 0 0 0.2555 3.4102 0 1.3916 0 2.5114 0.5131 0 0.6679 0 0 0 1.3916 0 8.5435 0 0 1.8924 0 0 0.1261 0.9744 0 8.5435 0 4.2043 3.2214 0 4.7147 0 0 0 2.5114 0 4.2043 0 0 0.0215 0 4.5513 0 0 0.5131 0 3.2214 0 0 15.7657 0 0 0.0793 0.4722 0 1.8924 0 0.0215 15.7657 0 8.8112 0 0 0 0.6679 0 4.7147 0 0 8.8112 0 6.7985 0 0 0 0 0 4.5513 0 0 6.7985 0
The difference in absolute values of the dipole moments, calculated by solving the single-electron two-dimensional TDSE and via the multi-configuration Hartree–Fock approach, is given by the matrix:
d ^ z ( 2 D ) d ^ z = 0 0 0.1398 0 0.07 0 0 0.0442 0 0 0 0 0.4701 0 0.0305 0 0 0.0032 0 0 0.1398 0.4701 0 0.3281 0 0.0394 0.1397 0 0.2222 0 0 0 0.3281 0 1.3607 0 0 0.2879 0 0 0.07 0.0305 0 1.3607 0 1.0780 0.5841 0 0.5787 0 0 0 0.0394 0 1.0780 0 0 0.5488 0 0.6386 0 0 0.1397 0 0.5841 0 0 2.6513 0 0 0.0442 0.0032 0 0.2879 0 0.5488 2.6513 0 2.0091 0 0 0 0.2222 0 0.5787 0 0 2.0091 0 1.3073 0 0 0 0 0 0.6386 0 0 1.3073 0
The corresponding difference in phases of the dipole moments is characterized by the matrix:
arg d ^ z ( 2 D ) arg d ^ z = 0 0 π 0 π 0 0 π 0 0 0 0 π 0 π 0 0 π 0 0 π π 0 π 0 0 π 0 0 0 0 0 π 0 π 0 0 π 0 0 π π 0 π 0 0 π 0 0 0 0 0 0 0 0 0 0 π 0 0 0 0 π 0 π 0 0 π 0 0 π π 0 π 0 π π 0 0 0 0 0 0 0 0 0 0 0 0 0 0 0 0 0 0 0 0 0 0 0

Appendix B. Solving TDSE by Decomposing the Atomic Wave Function into Stationary States: Basic Equations

Substitution of the expansion of the wave function (4) into TDSE (1) and taking the scalar products to the considered stationary states results in the following system of equations:
i d a k d t = E k a k + s E ( t ) d s k ( z ) a s + l 0 d ε E ( t ) k d ^ z ε , l b l ε , t , k = 1 , , K max , i d b l ε , t d t = ε b l ε , t + p E ( t ) ε , l d ^ z p a p , l = 0 , 1 , , L max ,
where the sums over s, l, and p include terms corresponding to dipole-allowed transitions between the considered stationary states of the helium atom, while the influence of transitions between the continuum states on their excitation amplitudes is neglected.
The solution of equations for b l ε , t has a form
b l ε , t = i p ε , l d ^ z p t E ( t ) a p ( t ) e i ε ( t t ) d t , l = 0 , 1 , , L max ,
where it is taken into account that b l ε , t = = 0 . Putting (A6) into Equation (A5) for ak(t) and neglecting the transitions between the bound states through the continuum states, one obtains the following system of integro-differential equations for the amplitudes of excitation of the bound states:
d a k d t = i E k a k i s E ( t ) d s k ( z ) a s l 0 d ε E ( t ) k d ^ z ε , l 2 t E ( t ) a k ( t ) e i ε t t d t , k = 1 , , K max .
Let us consider the integral over time t , included in the third term on the right-hand side of (A7),
I k ( t ) = t E ( t ) a k ( t ) e i ε t t d t
Further, let us use the expansion:
a k ( t ) = n = a ^ k , n ( t ) e i ( E k + n Ω ) t
and suppose that a ^ k , n ( t ) are the slowly varying functions on the time scale of Ω 1 . Then, putting (A9) and (2) in (A8), one obtains
I k ( t ) = E U V 2 i n = e i E k + ( n 1 ) Ω t t f ( t ) a ^ k , n ( t ) e i ε E k ( n 1 ) Ω t t d t e i E k + ( n + 1 ) Ω t t f ( t ) a ^ k , n ( t ) e i ε E k ( n + 1 ) Ω t t d t .
The integral in Equation (A10) can be represented as
t f ( t ) a ^ k , n ( t ) e i ε E k ( n 1 ) Ω t t d t = f ( t ) a ^ k , n ( t ) e i ε E k ( n 1 ) Ω t t i ε E k ( n 1 ) Ω t t d f ( t ) a ^ k , n ( t ) d t e i ε E k ( n 1 ) Ω t t i ε E k ( n 1 ) Ω d t .
Since the product f ( t ) a ^ k , n ( t ) is a slowly varying function of time, we neglect the second term in (A11); see [38]. Thus, Ik(t) takes the form
I k ( t ) = E U V 2 i n = f ( t ) a ^ k , n ( t ) e i E k + ( n 1 ) Ω t i ε E k ( n 1 ) Ω e i E k + ( n + 1 ) Ω t i ε E k ( n + 1 ) Ω .
Substituting (A12) in (A7), after some transformations, one obtains
d a k d t = i E k a k i s E ( t ) d s k ( z ) a s n = γ k , n ( + ) ( t ) + γ k , n ( ) ( t ) a ^ k , n ( t ) e i ( E k + n Ω ) t + + n = γ k , n ( ) ( t ) e i 2 Ω t + γ k , n ( + ) ( t ) e i 2 Ω t a ^ k , n ( t ) e i ( E k + n Ω ) t , k = 1 , , K max ,
where
γ k , n ( ± ) ( t ) = E U V 2 f 2 ( t ) 4 l 0 k d ^ z ε , l 2 i ε E k ( n ± 1 ) Ω d ε .
The integral over energy ε in (A14) can be calculated via residue theory. Thus, (A14) takes the form
γ k , n ( ± ) ( t ) = π E U V 2 f 2 ( t ) 4 l k d ^ z E k + ( n ± 1 ) Ω , l 2 θ E k + ( n ± 1 ) Ω .
Next, let us use an expansion
a k ( t ) = n = a k , n ( t ) e i n Ω t ,
where a k , n ( t ) = a ^ k , n ( t ) exp ( i E k t ) . Substituting (A16) in (A13) and equating the terms with the same n in the exponential functions exp ( i n Ω t ) , we obtain a system of equations for ak,n(t):
d a k , n d t = i E k n Ω + γ k , n ( t ) a k , n + 1 2 s f ( t ) E U V d s k ( z ) a s , n 1 a s , n + 1 + + γ k , n + 2 ( ) ( t ) a k , n + 2 + γ k , n 2 ( + ) ( t ) a k , n 2 , k = 1 , , K max , n = ; ,
where γ k , n ( t ) = γ k , n ( + ) ( t ) + γ k , n ( ) ( t ) (with the substitution of (A15), one obtains Equation (7)). The last two terms on the right-hand side of Equation (A17) correspond to the transitions from the kth bound state through the continuum states to the same state. Neglecting these transitions, we finally obtain the system of Equation (6).

Appendix C. Calculation of the Power Spectral Density of the Dipole Acceleration of an Atom and the Energy of the 3rd Harmonic in Its Spectrum

In order to calculate the power spectral density of the dipole acceleration of an atom within the time interval in which the UV field is non-zero, we used a time mask of the following form
Mask ( t ) = sin 2 π 2 t 3 T , 0 t 3 T , 1 , 3 T < t < ( N o s c + 3 ) T , 1 sin 2 π 2 t ( N o s c + 3 ) T 3 T , ( N o s c + 3 ) T t ( N o s c + 6 ) T , 0 , t > ( N o s c + 6 ) T
with smooth turning on and off and the duration of the interval at which the mask differs from zero is equal to the duration of the UV field pulse. Thus, the frequency dependence of the power spectral density of the dipole acceleration of an atom within the duration of an UV field pulse was calculated using the formula:
S B B ω = s ˜ B B ( ω ) 2 ,
where
s ˜ B B ( ω ) = d ¨ B B ( t ) Mask ( t ) exp ( i ω t ) d t
is the dipole acceleration spectrum calculated within the duration of the UV field pulse. The Fourier transforms of the excitation amplitudes of bound states in the UV field, shown in Figure 5, were calculated in the same way (similarly to (A20)).
To calculate the energy of the third (N = 3) harmonic in the dipole acceleration spectrum within the UV field pulse, the spectrum s ˜ B B ( ω ) was multiplied by a spectral filter of the form:
f N ( ω ) = 0 , 0 ω ( N 1 ) Ω , sin 2 π 2 ω ( N 1 ) Ω Ω / 2 , ( N 1 ) Ω < ω ( N 0.5 ) Ω , 1 , ( N 0.5 ) Ω < ω ( N + 0.5 ) Ω , 1 sin 2 π 2 ω ( N + 0.5 ) Ω Ω / 2 , ( N + 0.5 ) Ω < ω ( N + 1 ) Ω , 0 , ( N + 1 ) Ω < ω < .
Then, the time dependence of the complex amplitude of the dipole acceleration at the frequency of the third (N = 3) harmonic of the UV field was calculated via the inverse Fourier transform of the product s ˜ B B ( ω ) f N ( ω ) . Finally, the energy contained in the third harmonic of the dipole acceleration within the duration of the UV field pulse was calculated using the formula
E N ( d ¨ ) = d t Mask ( t ) 1 2 π d ω s ˜ B B ( ω ) f N ( ω ) exp ( i ω t ) 2 .

Appendix D. Dependencies of the Optimal Parameters of the UV Field, Populations of States, and Power of Dipole Acceleration at the Frequency of the Third Harmonic of the UV Field on the Dimensionless Duration of the Constant Amplitude Interval in the UV Field Envelope Nosc

Figure A2. The dependencies of the optimal values of (a) peak intensity and (b) frequency of the UV field on the duration (in units of the oscillation period) of the constant amplitude interval in the UV field envelope, Nosc (3). The coincidence of the optimal values of intensity and frequency of the UV field for Nosc = 50 and Nosc = 70 is explained by the insufficiently small intensity step used in the optimization (see Figure 3). The solution is obtained by expanding the atomic wave function in stationary states.
Photonics 10 01387 g0a2
Figure A3. The populations of the states |1s2〉 (black asterisks), |1s2s〉 (blue asterisks), and |1s2p〉 (red asterisks), as well as the total population of the considered states of the continuum (cyan asterisks) at the end of the UV field pulse with optimal intensity and frequency (at the moment of time t = (Nosc + 6)T), as functions of the duration (in units of the oscillation period) of the constant amplitude interval in the UV field envelope, Nosc (3).
Photonics 10 01387 g0a3
Figure A4. Peak (blue asterisks) and average (black asterisks) values of the squared dipole acceleration of an atom at the third harmonic frequency in a UV field with optimal intensity and frequency as functions of the duration (in units of the oscillation period) of the constant amplitude interval in the UV field envelope, Nosc (3).
Photonics 10 01387 g0a4

References

  1. Hentschel, M.; Kienberger, R.; Spielmann, C.; Reider, G.A.; Milosevic, N.; Brabec, T.; Corkum, P.; Heinzmann, U.; Drescher, M.; Krausz, F. Attosecond metrology. Nature 2001, 414, 509–513. [Google Scholar] [CrossRef] [PubMed]
  2. Drescher, M.; Hentschel, M.; Kienberger, R.; Uiberacker, M.; Yakovlev, V.; Scrinzi, A.; Westerwalbesloh, T.; Kleineberg, U.; Heinzmann, U.; Krausz, F. Time-resolved atomic inner-shell spectroscopy. Nature 2002, 419, 803–807. [Google Scholar] [CrossRef] [PubMed]
  3. Gagnon, E.; Ranitovic, P.; Tong, X.-M.; Cocke, C.L.; Murnane, M.M.; Kapteyn, H.C.; Sandhu, A.S. Soft X-ray-driven femtosecond molecular dynamics. Science 2007, 317, 1374–1378. [Google Scholar] [CrossRef] [PubMed]
  4. Cavalieri, A.L.; Müller, N.; Uphues, T.; Yakovlev, V.S.; Baltuška, A.; Horvath, B.; Schmidt, B.; Blümel, L.; Holzwarth, R.; Hendel, S.; et al. Attosecond spectroscopy in condensed matter. Nature 2007, 449, 1029–1032. [Google Scholar] [CrossRef]
  5. Chini, M.; Zhao, B.; Wang, H.; Cheng, Y.; Hu, S.X.; Chang, Z. Subcycle ac Stark shift of helium excited states probed with isolated attosecond pulses. Phys. Rev. Lett. 2012, 109, 073601. [Google Scholar] [CrossRef]
  6. Ott, C.; Kaldun, A.; Raith, P.; Meyer, K.; Laux, M.; Evers, J.; Keitel, C.H.; Greene, C.H.; Pfeifer, T. Lorentz meets Fano in spectral line shapes: A universal phase and its laser control. Science 2013, 340, 716–720. [Google Scholar] [CrossRef]
  7. Ott, C.; Kaldun, A.; Argenti, L.; Raith, P.; Meyer, K.; Laux, M.; Zhang, Y.; Blättermann, A.; Hagstotz, S.; Ding, T.; et al. Reconstruction and control of a time-dependent two-electron wave packet. Nature 2014, 516, 374–378. [Google Scholar] [CrossRef]
  8. Kuleff, A.I.; Kryzhevoi, N.V.; Pernpointner, M.; Cederbaum, L.S. Core ionization initiates subfemtosecond charge migration in the valence shell of molecules. Phys. Rev. Lett. 2016, 117, 093002. [Google Scholar] [CrossRef]
  9. Wu, M.; Chen, S.; Camp, S.; Schafer, K.J.; Gaarde, M.B. Theory of strong-field attosecond transient absorption. J. Phys. At. Mol. Opt. Phys. 2016, 49, 062003. [Google Scholar] [CrossRef]
  10. Young, L.; Ueda, K.; Gühr, M.; Bucksbaum, P.H.; Simon, M.; Mukamel, S.; Rohringer, N.; Prince, K.C.; Masciovecchio, C.; Meyer, M.; et al. Roadmap of ultrafast x-ray atomic and molecular physics. J. Phys. B At. Mol. Opt. Phys. 2018, 51, 032003. [Google Scholar] [CrossRef]
  11. Yamauchi, K.; Mimura, H.; Kimura, T.; Yumoto, H.; Handa, S.; Matsuyama, S.; Arima, K.; Sano, Y.; Yamamura, K.; Inagaki, K. Single-nanometer focusing of hard x-rays by Kirkpatrick–Baez mirrors. J. Phys. Condens. Matter. 2011, 23, 394206. [Google Scholar] [CrossRef] [PubMed]
  12. Schoenlein, R.; Elsaesser, T.; Holldack, K.; Huang, Z.; Kapteyn, H.; Murnane, M.; Woerner, M. Recent advances in ultrafast X-ray sources. Philos. Trans. R. Soc. A 2019, 377, 20180384. [Google Scholar] [CrossRef] [PubMed]
  13. Li, J.; Lu, J.; Chew, A.; Han, S.; Li, J.; Wu, Y.; Wang, H.; Ghimire, S.; Chang, Z. Attosecond science based on high harmonic generation from gases and solids. Nat. Commun. 2020, 11, 2748. [Google Scholar] [CrossRef] [PubMed]
  14. Corkum, P.B. Plasma perspective on strong field multiphoton ionization. Phys. Rev. Lett. 1993, 71, 1994–1997. [Google Scholar] [CrossRef]
  15. Lewenstein, M.; Balcou, P.; Ivanov, M.Y.; L’Huillier, A.; Corkum, P.B. Theory of high-harmonic generation by low-frequency laser fields. Phys. Rev. A 1994, 49, 2117–2132. [Google Scholar] [CrossRef] [PubMed]
  16. Yost, D.C.; Schibli, T.R.; Ye, J.; Tate, J.L.; Hostetter, J.; Gaarde, M.B.; Schafer, K.J. Vacuum-ultraviolet frequency combs from below-threshold harmonics. Nat. Phys. 2009, 5, 815–820. [Google Scholar] [CrossRef]
  17. Chini, M.; Wang, X.; Cheng, Y.; Wang, H.; Wu, Y.; Cunningham, E.; Li, P.-C.; Heslar, J.; Telnov, D.A.; Chu, S.-I.; et al. Coherent phase-matched VUV generation by field-controlled bound states. Nat. Photonics 2014, 8, 437–441. [Google Scholar] [CrossRef]
  18. Xiong, W.-H.; Geng, J.-W.; Tang, J.-Y.; Peng, L.-Y.; Gong, Q. Mechanisms of below-threshold harmonic generation in atoms. Phys. Rev. Lett. 2014, 112, 233001. [Google Scholar] [CrossRef]
  19. Spott, A.; Becker, A.; Jaroń-Becker, A. Transition from perturbative to non-perturbative interaction in low-order-harmonic generation. Phys. Rev. A 2015, 91, 023402. [Google Scholar] [CrossRef]
  20. Beaulieu, S.; Camp, S.; Descamps, D.; Comby, A.; Wanie, V.; Petit, S.; Légaré, F.; Schafer, K.J.; Gaarde, M.B.; Catoire, F.; et al. Role of excited states in high-order harmonic generation. Phys. Rev. Lett. 2016, 117, 203001. [Google Scholar] [CrossRef]
  21. Xiong, W.-H.; Peng, L.-Y.; Gong, Q. Recent progress of below-threshold harmonic generation. J. Phys. B At. Mol. Opt. Phys. 2017, 50, 032001. [Google Scholar] [CrossRef]
  22. Guo, Q.-L.; Li, P.-C.; Zhou, X.-X.; Chu, S.-I. Efficient enhancement of below-threshold harmonic generation by laser-driven excited states of Cs atom. Opt. Commun. 2018, 410, 262–268. [Google Scholar] [CrossRef]
  23. Felicio Zuffi, A.V.; Vieira Junior, N.D.; Samad, R.E. Below-threshold-harmonics-generation limitation due to laser-induced ionization in noble gases. Phys. Rev. A 2022, 105, 023112. [Google Scholar] [CrossRef]
  24. Schönberg, A.; Salman, H.S.; Tajalli, A.; Kumar, S.; Hartl, I.; Heyl, C.M. Below-threshold harmonic generation in gas-jets for Th-229 nuclear spectroscopy. Opt. Express 2023, 31, 12880–12893. [Google Scholar] [CrossRef] [PubMed]
  25. Stappaerts, E.A. Harmonic generation at high field strengths. Frequency shifts and saturation phenomena. Phys. Rev. A 1975, 11, 1664–1667. [Google Scholar] [CrossRef]
  26. Georges, A.T.; Lambropoulos, P.; Marburger, J.H. Theory of third-harmonic generation in metal vapors under two-photon resonance conditions. Phys. Rev. A 1977, 15, 300–307. [Google Scholar] [CrossRef]
  27. Diels, J.-C.; Georges, A.T. Coherent two-photon resonant third- and fifth-harmonic vacuum-ultraviolet generation in metal vapors. Phys. Rev. A 1979, 19, 1589–1606. [Google Scholar] [CrossRef]
  28. Poirier, M. Competition between resonant multiphoton ionization and third-harmonic generation: A mean-field model. Phys. Rev. A 1983, 27, 934–943. [Google Scholar] [CrossRef]
  29. Agarwal, G.S.; Tewari, S.P. Theory of four-photon resonant vacuum-ultraviolet generation with reabsorption via resonant two-photon process. J. Opt. Soc. Am. B 1985, 2, 1409–1416. [Google Scholar] [CrossRef]
  30. Slabko, V.V.; Popov, A.K.; Lukinykh, V.F. Generation of coherent radiation at 89.6 nm through two-photon resonant phase-matched tripling of fourth-harmonic Nd:glass laser radiation in Hg vapors. Appl. Phys. 1977, 15, 239–241. [Google Scholar] [CrossRef]
  31. Timmermann, A.; Wallenstein, R. Generation of tunable single-frequency continuous-wave coherent vacuum-ultraviolet radiation. Opt. Lett. 1983, 8, 517–519. [Google Scholar] [CrossRef] [PubMed]
  32. Bokor, J.; Bucksbaum, P.H.; Freeman, R.R. Generation of 35.5-nm coherent radiation. Opt. Lett. 1983, 8, 217–219. [Google Scholar] [CrossRef] [PubMed]
  33. Hilber, G.; Lago, A.; Wallenstein, R. Broadly tunable vacuum-ultraviolet/extreme-ultraviolet radiation generated by resonant third-order frequency conversion in krypton. J. Opt. Soc. Am. B 1987, 4, 1753–1764. [Google Scholar] [CrossRef]
  34. Miyazaki, K.; Sakai, H.; Sato, T. Two-photon resonances in Xe and Kr for the generation of tunable coherent extreme UV radiation. Appl. Opt. 1989, 28, 699–702. [Google Scholar] [CrossRef] [PubMed]
  35. Tünnermann, A.; Mossavi, K.; Wellegehausen, B. Nonlinear-optical processes in the near-resonant two-photon excitation of xenon by femtosecond KrF-excimer-laser pulses. Phys. Rev. A 1992, 46, 2707–2717. [Google Scholar] [CrossRef] [PubMed]
  36. Le Blanc, S.P.; Qi, Z.; Sauerbrey, R. Generation of femtosecond vacuum-ultraviolet pulses. Appl. Phys. B 1995, 61, 439–449. [Google Scholar] [CrossRef]
  37. Ganeev, R.A.; Usmanov, T. Frequency conversion of picosecond radiation in ultraviolet (338–366 nm) and vacuum ultraviolet (113.5–117.0 nm) ranges. J. Opt. A Pure Appl. Opt. 2000, 2, 550–556. [Google Scholar] [CrossRef]
  38. Reiss, H.R. Dipole-approximation magnetic fields in strong laser beams. Phys. Rev. A 2000, 63, 013409. [Google Scholar] [CrossRef]
  39. Khairulin, I.R.; Emelin, M.Y.; Ryabikin, M.Y. Ultrahigh-order harmonic generation in the subnanometer wavelength range: The role of finite atomic size. J. Opt. Soc. Am. B 2021, 38, 2329–2337. [Google Scholar] [CrossRef]
  40. Parker, J.; Stroud, C.R., Jr. Population trapping in short-pulse laser ionization. Phys. Rev. A 1990, 41, 1602–1608. [Google Scholar] [CrossRef]
  41. Mercouris, T.; Komninos, Y.; Dionissopoulou, S.; Nicolaides, C.A. Computation of strong-field multiphoton processes in polyelectronic atoms: State-specific method and applications to H and Li. Phys. Rev. A 1994, 50, 4109–4121. [Google Scholar] [CrossRef] [PubMed]
  42. Mercouris, T.; Komninos, Y.; Nicolaides, C.A. The state-specific expansion approach to the solution of the polyelectronic time-dependent Schrödinger equation for atoms and molecules in unstable states. Adv. Quantum Chem. 2010, 60, 333–405. [Google Scholar]
  43. de Morisson Faria, C.F.; Dörr, M.; Sandner, W. Importance of excited bound states in harmonic generation. Phys. Rev. A 1998, 58, 2990–2999. [Google Scholar] [CrossRef]
  44. Atomic Spectra Database. NIST Standard Reference Database 78. Available online: https://www.nist.gov/pml/atomic-spectra-database (accessed on 1 January 2022).
  45. Khairulin, I.R.; Antonov, V.A.; Emelin, M.Y.; Popova, M.M.; Gryzlova, E.V.; Ryabikin, M.Y. Multilevel model of multiphoton processes in a helium atom in a strong laser field: Ionization description. Opt. Spectrosc. 2023, 131, 128–132. [Google Scholar]
  46. Letokhov, V.S. Laser Photoionization Spectroscopy; Academic Press: Cambridge, MA, USA, 1987. [Google Scholar] [CrossRef]
  47. Avanaki, K.N.; Telnov, D.A.; Chu, S.-I. Harmonic generation of Li atoms in one- and two-photon Rabi-flopping regimes. Phys. Rev. A 2016, 94, 053410. [Google Scholar] [CrossRef]
  48. Bengtsson, S.; Larsen, E.W.; Kroon, D.; Camp, S.; Miranda, M.; Arnold, C.L.; L’Huillier, A.; Schafer, K.J.; Gaarde, M.B.; Rippe, L.; et al. Space-time control of free induction decay in the extreme ultraviolet. Nat. Photon. 2017, 11, 252–258. [Google Scholar] [CrossRef]
  49. Beaulieu, S.; Bloch, E.; Barreau, L.; Comby, A.; Descamps, D.; Géneaux, R.; Légaré, F.; Petit, S.; Mairesse, Y. Phase-resolved two-dimensional spectroscopy of electronic wave packets by laser-induced XUV free induction decay. Phys. Rev. A 2017, 95, 041401(R). [Google Scholar] [CrossRef]
  50. Delone, N.B.; Krainov, V.P. AC Stark shift of atomic energy levels. Phys. Usp. 1999, 42, 669–687. [Google Scholar] [CrossRef]
Figure 1. Dependence of the probability of ionization of a helium atom at time t = 50T on the frequency of the UV field with a peak intensity IUV = 1014 W/cm2. The blue solid curve corresponds to the solution obtained by expanding the atomic wave function in stationary states, W i o n ( 1 ) ( t = 50 T ) , and the red dotted curve corresponds to the solution of the two-dimensional one-electron TDSE from first principles W i o n ( 2 ) ( t = 50 T ) . The vertical axis uses a logarithmic scale. Vertical dashed lines indicate the frequencies of multiphoton transitions between unperturbed bound states of the atom. In this case, multiphoton resonances of odd order are marked in black, and resonances of even order are marked in green.
Photonics 10 01387 g001
Figure 2. Probability of ionization of a helium atom (in a logarithmic scale) after exposure to a UV field pulse depending on its intensity and frequency in the vicinity of three-photon resonances. The dotted lines indicate the frequencies of three-photon transitions between unperturbed atomic states; here, black color corresponds to the transition |1s2〉–|1s2p〉, green is for the transition |1s2〉–|1s3p〉, whereas blue is for the transitions |1s2〉–|1s4p〉 and |1s2〉–|1s4f〉 (on the scale of the figure they coincide). The solid black curve indicates the frequency of the three-photon transition |1s2〉–|1s2p〉 in the UV field. The logarithmic scale is used for the horizontal axis. The solution is obtained by expanding the atomic wave function in stationary states.
Photonics 10 01387 g002
Figure 3. Dependence (in a logarithmic scale) of the third harmonic energy in the spectrum of the dipole acceleration of a helium atom on the intensity and frequency of the UV field in the vicinity of three-photon resonances. The dotted lines indicate the frequencies of three-photon transitions between unperturbed states of the atom; here, black color corresponds to the |1s2〉–|1s2p〉 transition, green is for the |1s2〉–|1s3p〉 transition, whereas blue is for the |1s2〉–|1s4p〉 and |1s2〉–|1s4f〉 transitions (on the scale of the figure they coincide). The solid black curve indicates the frequency of the three-photon transition |1s2〉–|1s2p〉 in the UV field. The cyan dashed curve corresponds to the dependence of the UV field frequency on its intensity, which maximizes the third harmonic energy in the dipole acceleration spectrum. The logarithmic scale is used for the horizontal axis. The solution is obtained by expanding the atomic wave function in stationary states.
Photonics 10 01387 g003
Figure 4. Frequency dependence of the power spectral density of dipole acceleration under conditions that maximize the third harmonic energy. The red curve corresponds to the solution of the system of Equations (6) and (7) at Nosc = 30, IUV = 2 × 10¹⁴ W/cm2, and Ω = 0.2644 a.u. The black curve was obtained based on model (11) and (12) with Nosc = 30, IUV = 4 × 10¹⁴ W/cm2, and Ω = 0.2730 a.u. The inset shows the vicinity of the third harmonic frequency; the vertical blue lines indicate the frequencies of single-photon (both dipole-allowed and dipole-forbidden) transitions into the unperturbed bound states taken into account, the vertical black line indicates the ionization potential Ip of the atom in the absence of a UV field, and the vertical green line indicates the plateau boundary in the spectrum of harmonics due to Corkum’s mechanism, Ip + 3.17 × Up, where Up is the ponderomotive energy of the electron (see [14,15]). The frequency values in the inset to the figure correspond to model (6) and (7) (see Appendix A, Table A1). The logarithmic scale is used for the vertical axis.
Photonics 10 01387 g004
Figure 5. Absolute values of the Fourier transform of the excitation amplitudes of bound states in a UV field with Nosc = 30, IUV = 2 × 10¹⁴ W/cm2, and Ω = 0.2644 a.u. In (a), the black, blue, and red curves show the excitation amplitudes of the |1s2〉, |1s2s〉, and |1s2p〉 states, respectively. In (b), the excitation amplitudes of the remaining states taken into account, |1s3s〉, |1s3p〉, |1s3d〉, |1s4s〉, |1s4p〉, |1s4d〉, and |1s4f〉, are shown in different colors. All values are calculated for a time interval within which the UV field is non-zero (similar to Formula (A20) in Appendix C). The logarithmic scale is used for the vertical axes. The solution is obtained by expanding the atomic wave function in stationary states.
Photonics 10 01387 g005
Figure 6. (a) Dependences of the populations of the states |1s2〉 (black curve), |1s2s〉 (blue curve), and |1s2p〉 (red curve), the total population of the remaining bound states taken into account with n = 3 and n = 4 (green curve), as well as the total population of continuum states (cyan curve), averaged over the duration of the UV field pulse, on the intensity of the UV field under conditions of the resonant three-photon excitation of the |1s2p〉 state. (b) Left axis, blue color: dependence of the product of the populations of the |1s2〉 and |1s2p〉 states averaged over the duration of the UV field pulse on the intensity of the UV field under conditions of the three-photon excitation of the |1s2p〉 state; right axis, red color: similar dependence of the energy of the third harmonic of the UV field in the dipole acceleration spectrum. The asterisks indicate the calculated values; the dashed lines are obtained by interpolating them with a spline. The logarithmic scale is used for the horizontal axes. The solution is obtained by expanding the atomic wave function in stationary states.
Photonics 10 01387 g006
Figure 7. Frequency dependencies of (i) the energy of the third harmonic in the dipole acceleration spectrum (solid curves, left vertical axis) and (ii) the atomic ionization probability (dashed curves, right vertical axis) for three different intensities of the UV field: IUV = 8 × 10¹³ W/cm2 (blue color), the optimal value IUV = 2 × 10¹⁴ W/cm2 (red color), and IUV = 5 × 10¹⁴ W/cm2 (black color). The logarithmic scale is used for the vertical axes. The solution is obtained by expanding the atomic wave function in stationary states.
Photonics 10 01387 g007
Figure 8. Dependence of the frequency of the three-photon transition |1s2〉–|1s2p〉 on the intensity of the UV field (solid curves); dependence of the UV field frequency, which maximizes the energy of the third harmonic in the spectrum of the dipole acceleration of an atom, on the field intensity (dashed curves). Black color corresponds to Nosc = 10, red color is for Nosc = 30, and blue color is for Nosc = 100. The black asterisk, red cross, and blue circle indicate combinations of UV field intensity and frequency at which the absolute maximum energy of the third harmonic in the dipole acceleration spectrum is achieved for Nosc = 10, 30, and 100, respectively. The inset enlarges the area in the vicinity of the optimal UV field parameters. The logarithmic scale is used for the horizontal axis. The solution is obtained by expanding the atomic wave function in stationary states.
Photonics 10 01387 g008
Figure 9. (a,c) Time dependences of the populations of states|1s2〉 (black curve), |1s2s〉 (blue curve), |1s2p〉 (red curve), the total population of the remaining bound states taken into account (green curve), and the total population of continuum states (cyan curve). (b,d) Time dependences of the dipole acceleration (left axis, red curve) and the envelope (in amplitude) of the UV pulse (right axis, black broken curve). (a,b) are plotted for Nosc = 10, IUV = 3.5 × 10¹⁴ W/cm2, and Ω = 0.2658, and (c,d) for Nosc = 100, IUV = 1014 W/cm2, and Ω = 0.2628. The solution is obtained by expanding the atomic wave function in stationary states.
Photonics 10 01387 g009
Figure 10. Dependence of the energy concentrated in the third harmonic of the fundamental frequency in the dipole acceleration spectrum on the duration (in units of the oscillation period) of the constant amplitude interval in the UV field envelope (3). Asterisks are the results of a numerical calculation based on the system of Equations (6) and (7); the energy corresponding to different Nosc is 1.098 a.u. for Nosc = 10, 4.122 a.u. for Nosc = 30, 7.13 a.u. for Nosc = 50, 10.05 a.u. for Nosc = 70, and 14.03 a.u. for Nosc = 100. The dashed line is the result of linear interpolation. The solution is obtained by expanding the atomic wave function in stationary states.
Photonics 10 01387 g010
Disclaimer/Publisher’s Note: The statements, opinions and data contained in all publications are solely those of the individual author(s) and contributor(s) and not of MDPI and/or the editor(s). MDPI and/or the editor(s) disclaim responsibility for any injury to people or property resulting from any ideas, methods, instructions or products referred to in the content.

