Article

Performance Evaluation of Maximum Ratio Combining Diversity Technology and Traditional System Based on Comprehensive Noise Analysis in Underwater Wireless Optical Communication

1
Wuhan National Laboratory for Optoelectronics, School of Optical and Electronic Information, Huazhong University of Science and Technology, Wuhan 430074, China
2
Wuhan Maritime Communication Research Institute, Wuhan 430205, China
*
Author to whom correspondence should be addressed.
Photonics 2023, 10(12), 1388; https://doi.org/10.3390/photonics10121388
Submission received: 31 October 2023 / Revised: 1 December 2023 / Accepted: 13 December 2023 / Published: 18 December 2023
(This article belongs to the Special Issue Optical Communication, Sensing and Network)

Abstract

:
The maximum ratio combining (MRC) diversity technology has shown outstanding performance in overcoming the adverse effects of underwater wireless optical communication (UWOC) systems. However, its actual performance gain will be affected by the detection area and noise, which requires an in-depth analysis. In this paper, on the basis of fully considering the noises in the UWOC system, the performance of the MRC diversity technology is fairly and comprehensively studied by comparing it with two single-input–single-output (SISO) systems using a small aperture detection (SAD) scheme or a large-aperture detection (LAD) scheme through a Monte Carlo simulation and a formula analysis. The results show that the traditional belief that the MRC diversity scheme has consistently outperformed SISO systems may be misleading. When the thermal noise is dominant and the background noise is small, the LAD scheme performs better than the MRC diversity scheme with the same detection area. And in other cases, the MRC diversity scheme with the same detection area is always superior to the SISO systems. The conclusions obtained in this paper have a guiding significance for the practical application of UWOC.

1. Introduction

In recent years, with the growing demand for oceanography studies, offshore oil exploration, sea floor surveys, and monitoring, the development of underwater wireless communication technologies (UWCTs) has been promoted [1,2]. Among them, underwater wireless optical communication (UWOC), which uses the light transmission window of water in the 400–600 nm (blue/green) wavelength band, has gradually emerged and spread as a new trend to carry out underwater real-time communication due to its characteristics of high bandwidth, low power consumption, and low latency [3,4,5,6,7,8,9]. However, the UWOC system is subject to great challenges since the optical beam is attenuated significantly by the scattering and absorption effects of water’s molecular and suspending particles, such as chlorophyll, water-soluble salts, and minerals. In addition, the UWOC system also suffers from serious underwater optical turbulence, which is physically the refractive index fluctuation of water with random variations in temperature and pressure [10,11]. These adverse effects will increase the path loss, expand the impulse response, and cause multipath fading.
To overcome these destructive effects mentioned above, maximum ratio combining (MRC), an excellent diversity combining algorithm, is introduced into the UWOC system to improve the quality of the received signal [12,13]. In MRC, the individually received branch signals are weighted and combined to maximize the instantaneous output signal-to-noise ratio (SNR) [14,15]. Therefore, the performance of a communication system with MRC diversity technology is recognized as consistently superior to that of single-input–single-output (SISO) communication system [16]. However, the implementation of MRC diversity technology requires multiple detectors and complex control circuits, which will introduce more noise into the communication system. The noises considered in the UWOC system mainly include background light noise (including the noise from solar radiations and other light sources), thermal noise, shot noise, and laser intensity noise [17,18]. Different noises have different effects on the received signal. At present, existing studies on the performance of MRC diversity technology mostly focus on comparing it with the performance of an SISO system [13,16]. Obviously, this performance comparison is unfair due to insufficient consideration of the detector area, received signal strength, noise impact, and so on. Therefore, it is necessary to fairly and comprehensively explore whether MRC diversity technology has advantages over other detection and signal processing technologies under the premise of fully considering the noise in a communication system.
In this paper, we conduct an in-depth analysis and research on the performance of MRC diversity technology based on a comprehensive consideration of noises in UWOC systems for the first time. To obtain a more convincing conclusion, two SISO systems, using a small-aperture detection (SAD) scheme or a large-aperture detection (LAD) scheme, are selected for a fair comparison. Notably, the SAD scheme has the same detection area as one detector of the detector array used in the MRC diversity scheme, and the LAD scheme has the same detection area as the whole detector array used by the MRC diversity scheme. We first demonstrated and simulated the UWOC systems combined with the MRC diversity scheme with a 2 × 2 detector array (single-input–multiple outputs, SIMO) or the SAD/LAD scheme (single-input–single-output, SISO). Based on the Monte Carlo (MC) simulation method, the performances of the SAD scheme, the LAD scheme, and the MRC diversity scheme with a 2 × 2 detector array are compared in terms of their bit-error rate (BER). Subsequently, the mathematical expression of noise spectral density is introduced to further compare the abilities of the different detection and signal processing technologies to improve the quality of the received signals in different noise conditions. The results show that the traditional belief that the MRC diversity scheme has consistently outperformed SISO systems may be misleading when the noise in UWOC systems is fully considered. When thermal noise is dominant and the background noise is small, the LAD scheme is superior to the MRC diversity scheme with a 2 × 2 detector array. In other cases, the MRC diversity scheme with a 2 × 2 detector array is always superior to SISO systems. Generalized to general cases, the above conclusions are also applicable to MRC diversity schemes using an M1 × M2 detector array.

2. Model and Methods

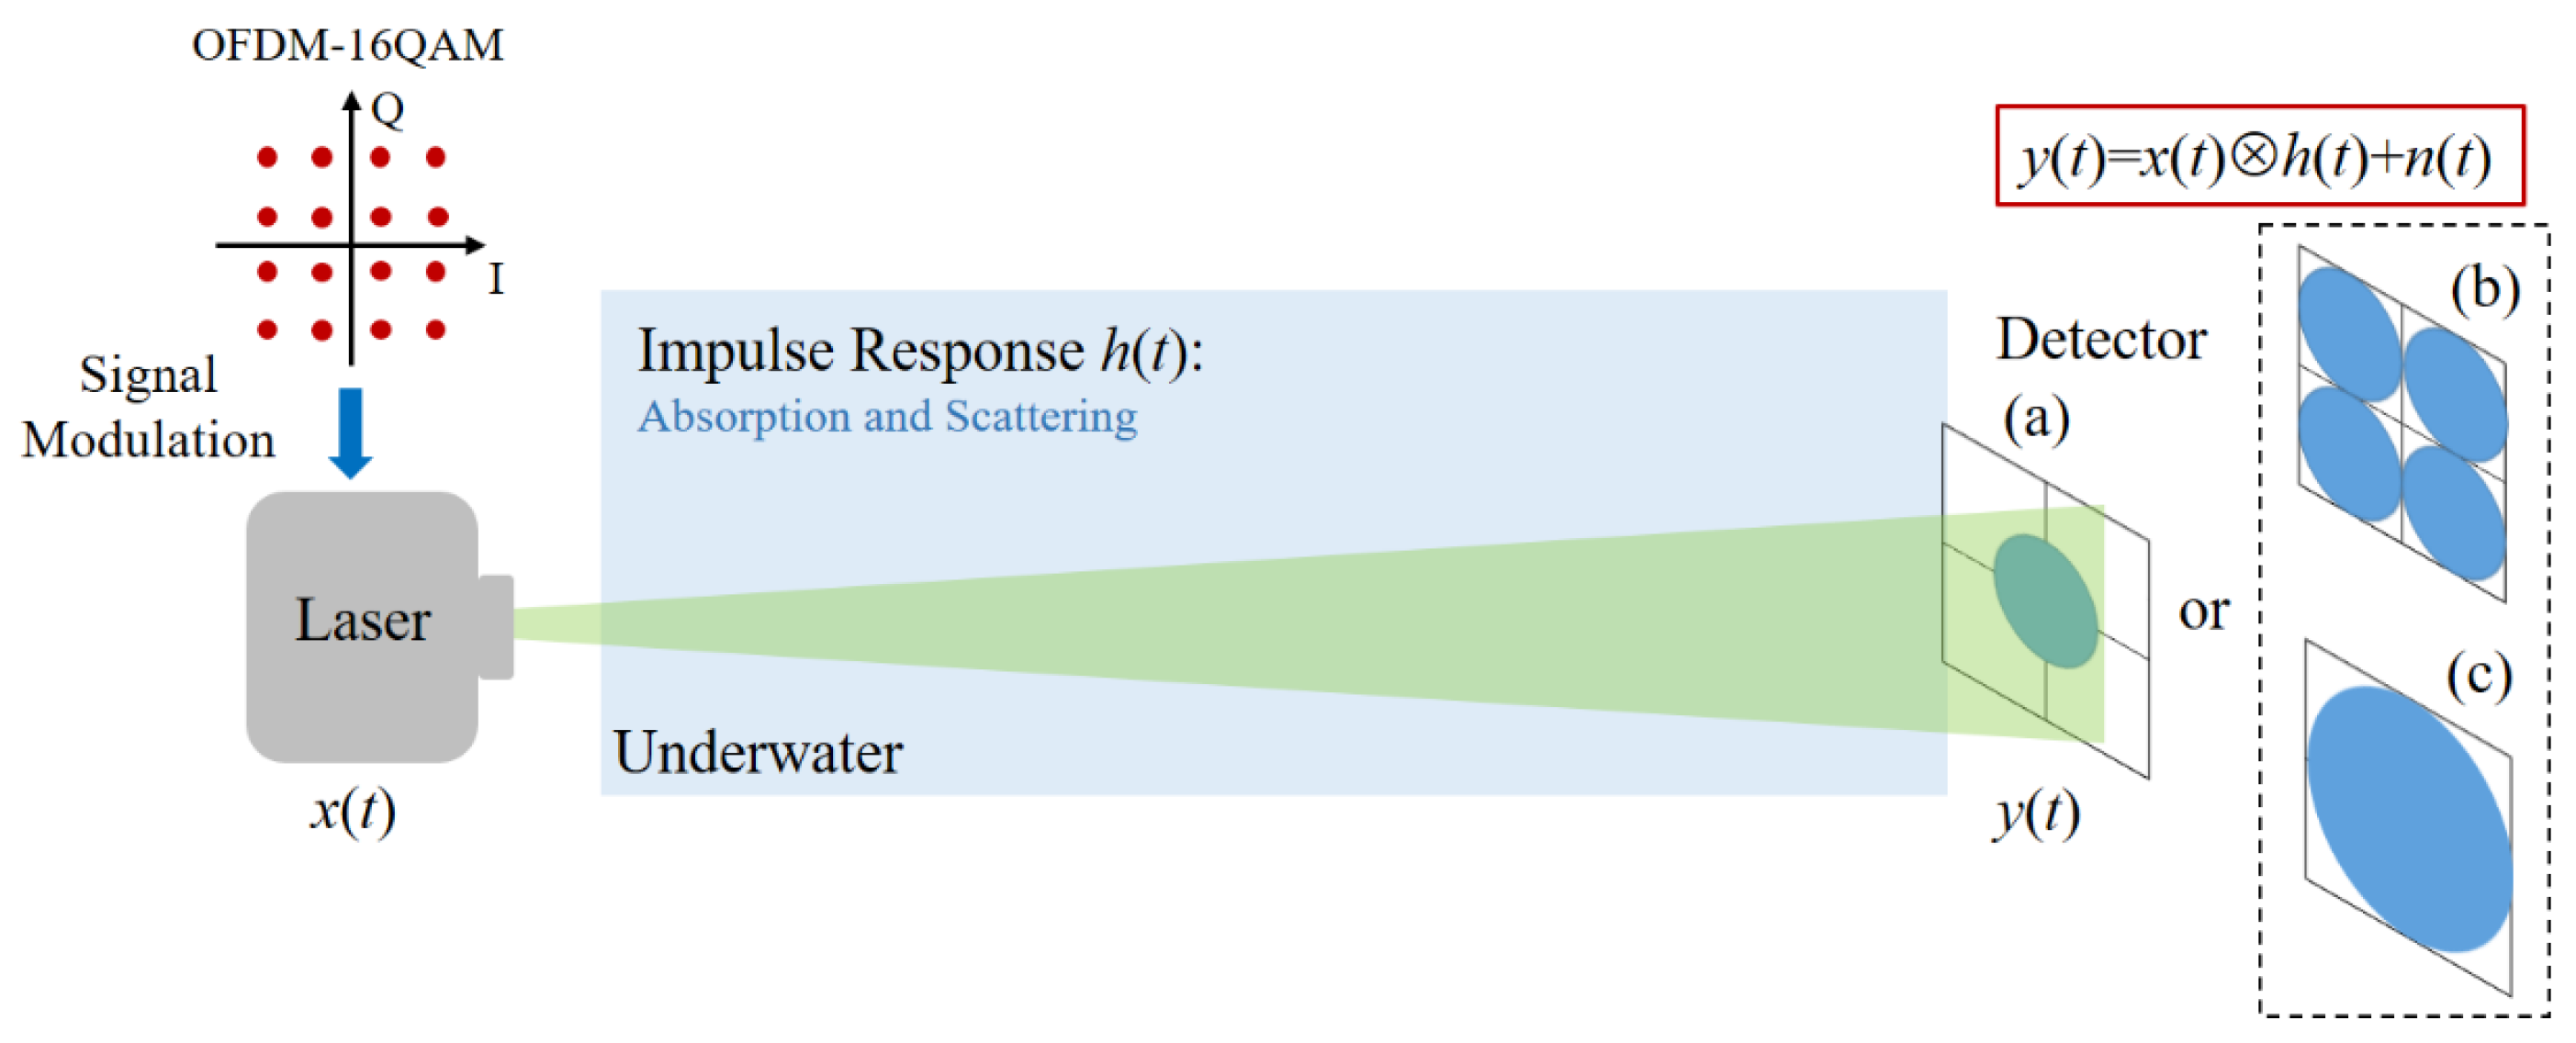
2.1. Underwater Channel Model
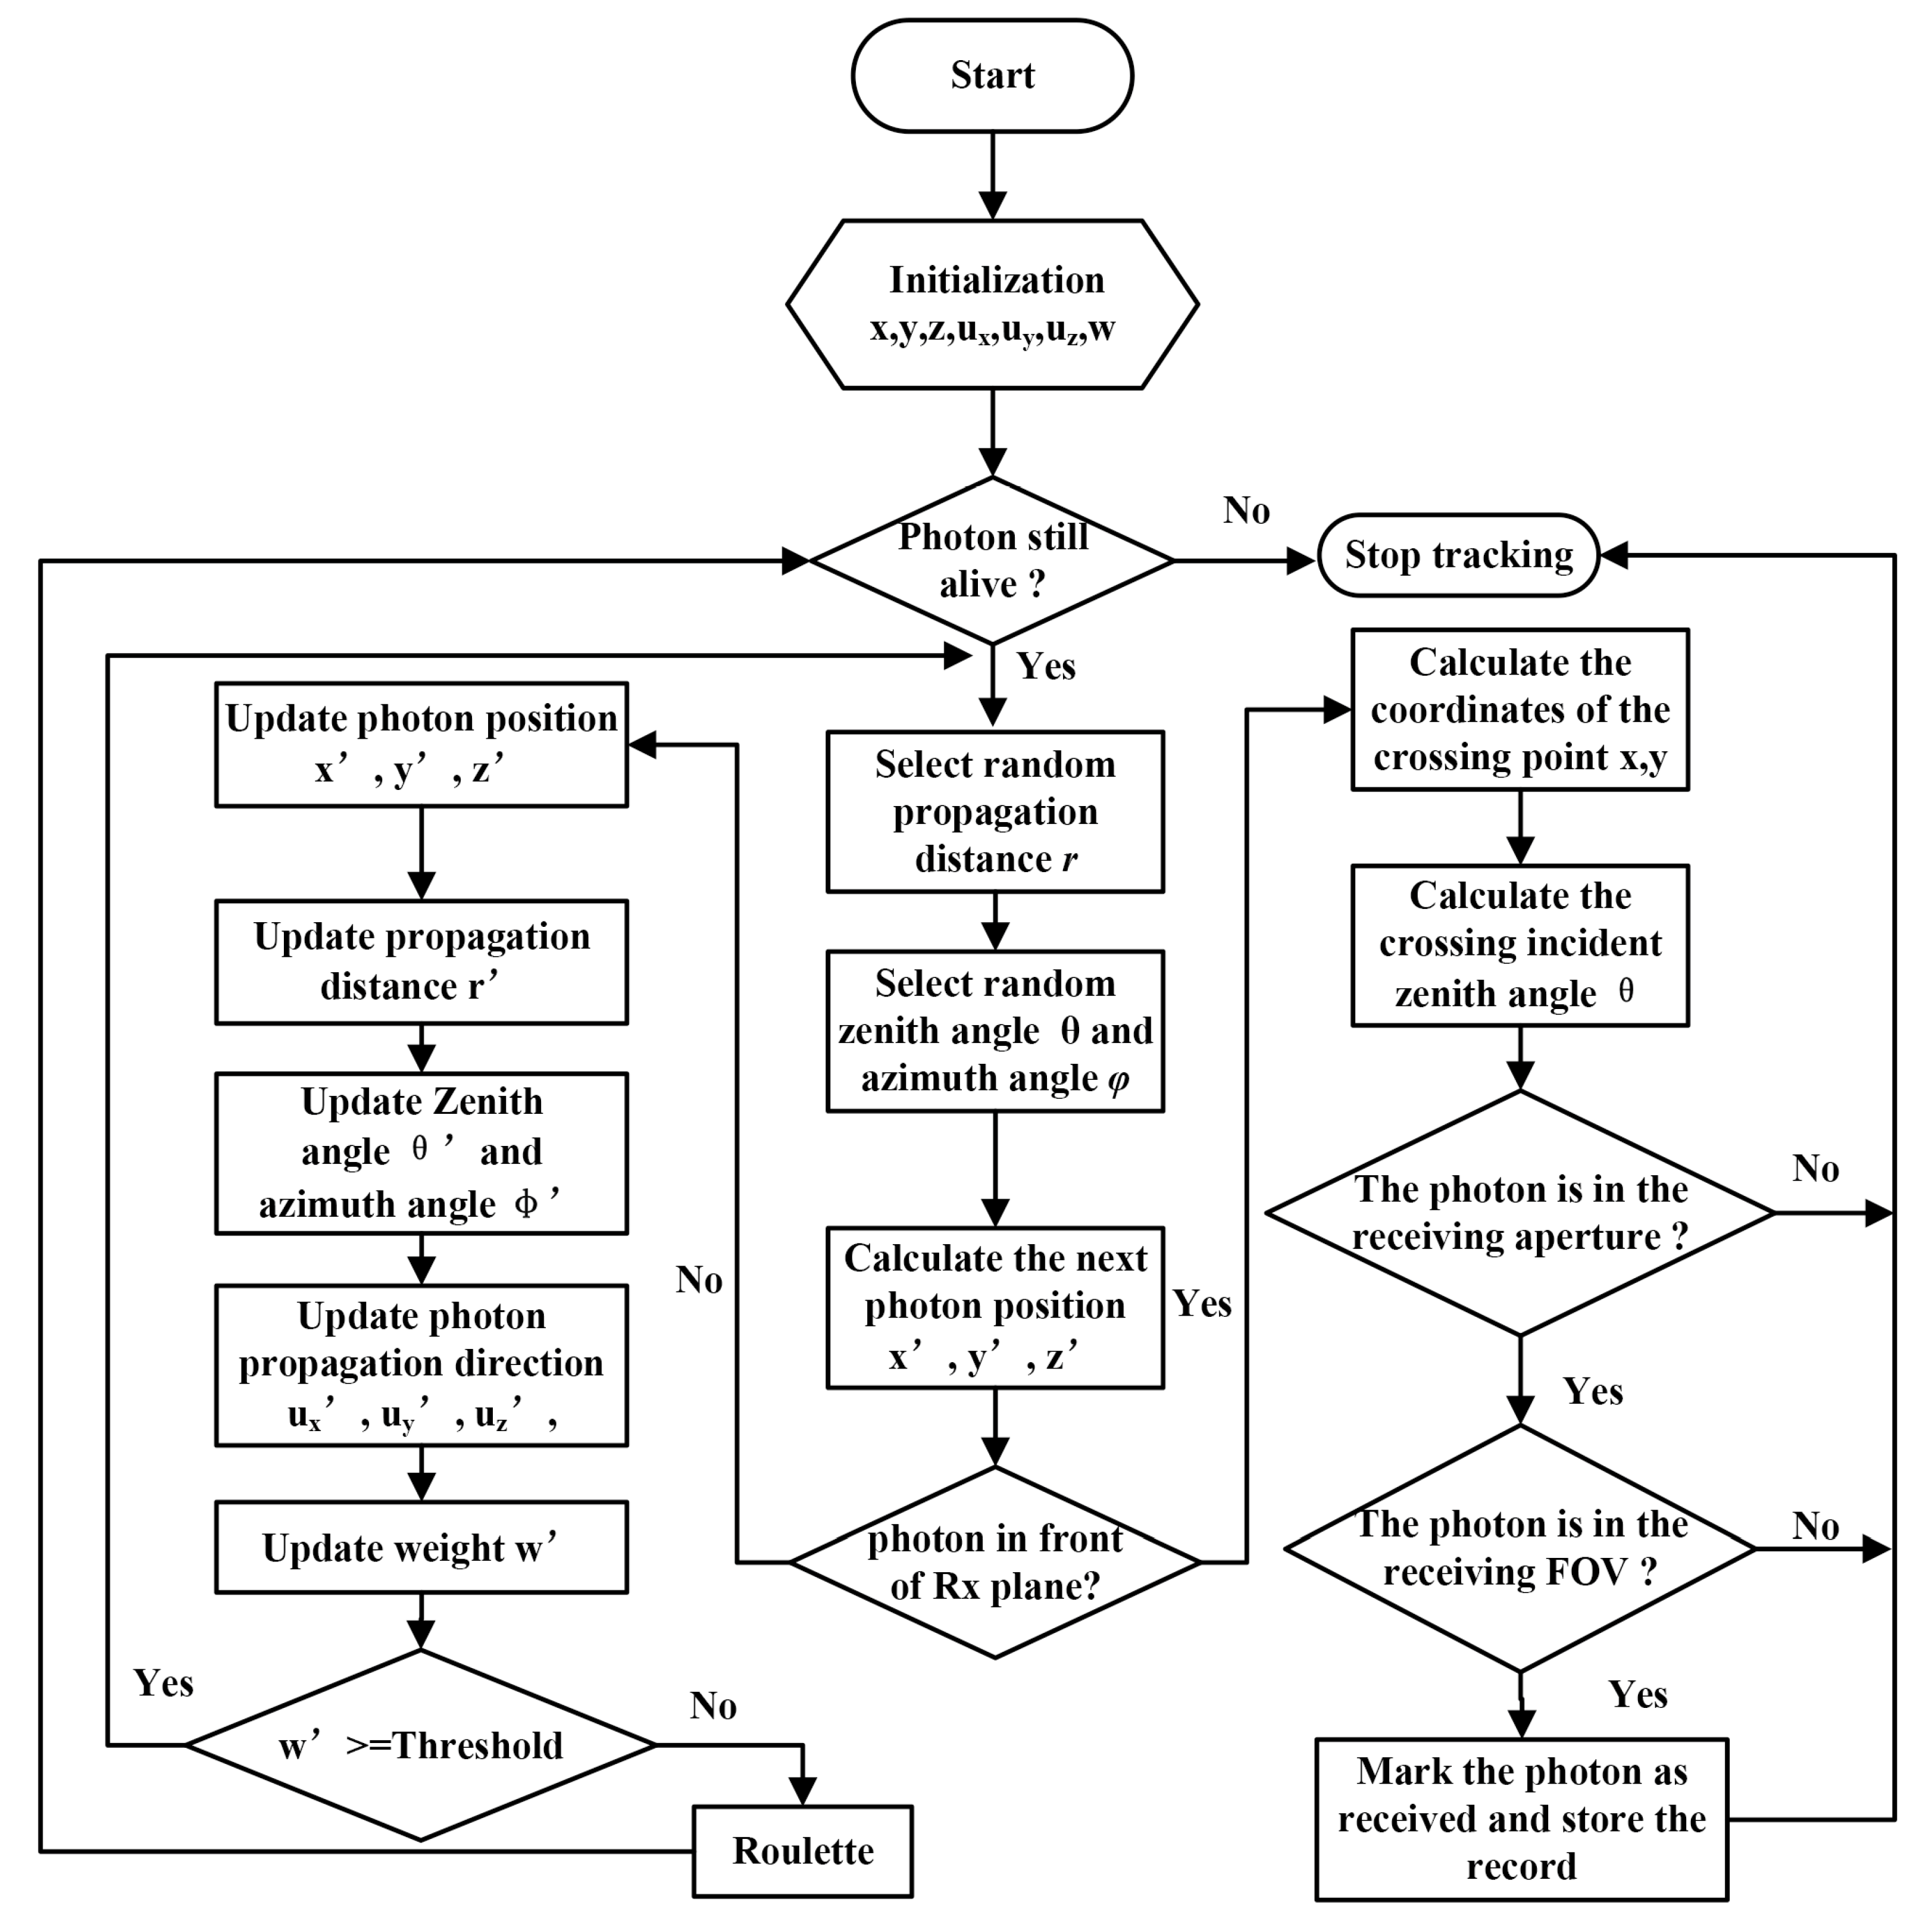
Note that an actual underwater optical channel is more complex when we consider the temporal correlation of irradiance caused by medium flowing as well as fading effects induced by both turbulence and the random distribution of particles. Here, in order to facilitate simulations and analyses, only a precisely aligned line-of-sight (LOS) link and a detector perpendicular to the beam are considered. In the meantime, the underwater environment is assumed to be an ideal isotropic and homogeneous medium without flowing or turbulence [19,20,21,22]. Therefore, an underwater wireless optical channel can be treated as a linear time-invariant system. Figure 1 shows an UWOC system model with different detection schemes.
In the transmitter, a green laser is modulated by an orthogonal frequency-division multiplexing (OFDM) 16-quadrature amplitude modulation (QAM) digital signal. As we all know, OFDM has been proven to be an effective technique for the UWOC system due to its high spectral efficiency and potential resistance to channel instability when transmitting signals over multiple orthogonal sub-carriers simultaneously. The data transmission in underwater optical wireless channels is achieved through intensity modulation and direct detection (IM/DD) techniques, which make it possible to realize the signal transmission and reception by using a simple light modulator and a photodiode. Here, Square 16QAM is used. Every four bits of data are mapped to a 16QAM symbol according to a certain mapping relationship. Then, the beam carrying the information enters the underwater channel. In the UWOC system, the absorption and scattering of seawater are the main factors affecting the propagation of the underwater light signals. Absorption can be interpreted as a process where the energy of photons is lost thermally through their interaction with water molecules and other particles. Scattering can be interpreted as an interaction of a photon with other suspended particles, which changes the direction of the optical beams, resulting in temporal dispersion and a reduction in the available bandwidth. The energy loss of the non-scattered light caused by the absorption and scattering processes can be evaluated with the absorption coefficient, a, and the scattering coefficient, b, whose summation is defined as the attenuation coefficient, c = a + b. Table 1 shows the parameters of various water types for blue/green light [23]. The effects of underwater channels on the optical signal can be described by the impulse response, h(t), which is related to the absorption coefficient and scattering coefficient of water, the transmission distance, and the parameters of the transmitter and receiver. The noise, n(t), of a UWOC system depends on the type of receiver and mainly includes the background optical noise and electrical noise. The received signal can be expressed as y(t) = x(t)⊗h(t) + n(t). Figure 1 displays three common detection schemes, including the SAD scheme, the MRC diversity scheme with a 2 × 2 detector array, and the LAD scheme. As far as we know, the MRC diversity scheme is recognized to perform better than the SISO schemes. However, this conclusion lacks a fair comparison and sufficient theoretical analysis to support it. Thus, to further study the performance of the MRC diversity scheme in the UWOC system, the UWOC system should be simulated, and the noise characteristics should be fully considered.

2.2. MC Simulation

In the UWOC system, the optical signal transmitted in the underwater channel can be regarded as the process of mass amounts of photons arriving at the receiving end through the absorption and scattering of water molecules and particles. The MC method is proposed as a numerical calculation method guided by probability theory, which is very suitable for modeling the underwater channel’s characteristics [24].
The MC simulation starts by generating numerical photons. Each photon is assigned a basic set of attributes, including its position, transmit direction, propagation distance, and weight. The position is denoted in the Cartesian coordinate system (x, y, z) and initialized according to the coordinate of the corresponding light source to which the desired photon belongs. The direction of each photon is represented by the zenith angle, θ, and azimuth angle, φ, in the spherical coordinate system and initially confined to the divergence angle of the corresponding light source. The weight, ω, has an initial value of unity and stands for the intensity of each photon. The propagation distance, r, represents the step size of photons traveling and interacting with the medium and is typically set with an initial value of zero. In addition, there are some parameters that need to be considered in the MC simulation process, including the light source type, wavelength, λ, beam width, D, and divergence angle, σ, of the transmitter; the distance, Z, between the transmitter and the receiver; the absorption coefficient, a, the scattering coefficient, b, and the attenuation coefficient, c, of the underwater channel; and the aperture size and the field of view (FOV) of the receiver. The simulation flow chart for each photon’s motion for the MC method is displayed in Figure 2.
First, the parameters of each photon are initialized according to the selected light source type. Here, a Gaussian beam is considered, and the initial photon locations can be randomly chosen to match the Gaussian distribution. In this case, the beam is uniform along a fixed radius from the beam center. The location and direction of each photon are initially defined as:
x 0 = r 0 cos α 0 y 0 = r 0 sin α 0 z 0 = 0 , u x 0 = cos φ 0 sin θ 0 u y 0 = cos φ 0 sin θ 0 u z 0 = cos θ 0
r 0 = D 2 ln ( R r 0 ) α 0 = 2 π R α 0 φ 0 = 2 π R φ 0 θ 0 = σ 2 ( 2 R θ 0 1 )
where (ux0, uy0, uz0) are the direction cosines which present the propagation direction of the initial photon. (r0, α0) are the polar coordinates of the initial photon in the z = 0 plane, and α0 is randomly chosen to lie in the interval [0, 2π]. R( ) is a uniform random variable in the unit interval from 0 to 1.
Subsequently, the state renewal of a photon after scattering can be briefly divided into three steps: the propagation distance and a position update; a photon weight update; and a scattering angle update.
  • Propagation distance and position update
The propagation distance between two scattering events can be determined by
r = ln ( R r ) c
where c is the attenuation coefficient, and Rr is a random variable with a uniform distribution in the interval [0, 1]. By combining the current direction cosine and the new propagation distance of the photon, the new position coordinate information of the photon after a single scattering event is updated to
x = x + u x r y = y + u y r z = z + u z r
2.
Photon weight update
In an MC simulation, each photon is usually treated as a photon packet whose weight is reduced by the albedo of the water. The new photon weight is calculated as
w = w · w a l b e d o
where w is the previous weight before the scattering event. walbedo is the albedo of the water, which is defined as walbedo = b/c. After a photon packet has been scattered many times, its weight can drop to a threshold where it will no longer have a significant impact on the final value of the simulation. Here, in addition to the carefully selected lower weight threshold, the “rouletting” method is introduced to ensure the conservation of energy. Specifically, for each subsequent scattering event, once this threshold is reached, a uniform random variable is compared against an arbitrary rouletting threshold, 1/η, (1/η = 0.1 in Photonator), and the photon weight is set according to Equation (6).
w = 0 R > 1 / η η w R 1 / η
In the equation, R is a random number chosen from a uniform distribution on [0, 1]. η is the rouletting threshold, and the experience value is 10. This means that when the photon packet weight is less than the weight threshold, there is a 90% probability that the photon will be terminated and a remaining 10% probability that the photon weight will be boosted by a factor 10, thereby preserving the total system energy. This method reduces the amount of unnecessary calculations that the system has to perform.
3.
Direction angle update
After the interaction happens, the direction of the photon’s trajectory is also changed in terms of the zenith angle, θ, and azimuth angle, φ. The zenith angle, θ, is chosen according to a volume scattering function (VSF), including the actual seawater phase function measured by Petzold, the HG function, and so on. The zenith angle is chosen from the VSF via the equation
R θ = 0 θ β ˜ ( θ ) sin θ d θ
here, Rθ is a random number chosen in the interval [0, 1]. θ’ is the chosen zenith angle, and β ˜ ( θ ) is the VSF. The scattering azimuth angle can be computed by
φ = 2 π R φ
here, Rφ is a random number chosen in the interval [0, 1].
After the new zenith angle, θ’, and azimuth angle, φ’, are chosen, the direction cosines need to be updated. The direction cosines are calculated as
u x = sin θ ( u x u z cos φ u y sin φ ) / 1 u z 2 + u x cos θ u y = sin θ ( u y u z cos φ + u x sin φ ) / 1 u z 2 + u y cos θ u z = sin θ cos φ 1 u z 2 + u z cos θ
When the current propagation direction is close to the z axis, that is, abs(uz) = 1, the new direction cosines are calculated as
u x = sin θ cos φ u y = sin θ cos φ u z = s i g n ( u z ) cos θ
After multiple updates, a photon should be no longer tracked when its weight is lower than a certain threshold or it reaches the receiver plane. In the former case, the photons should be excluded from the simulations. In the latter case, the photons are detected when they are located within the aperture and FOV of the receiver. Finally, the four parameters of position, direction, propagation distance, and weight of the detected photon are recorded. The impulse response, h(t), can be achieved by creating a histogram of the weights of the received photons versus the propagation time, and the propagation time is obtained from the total propagation distance [25,26,27].

3. Simulation and Results

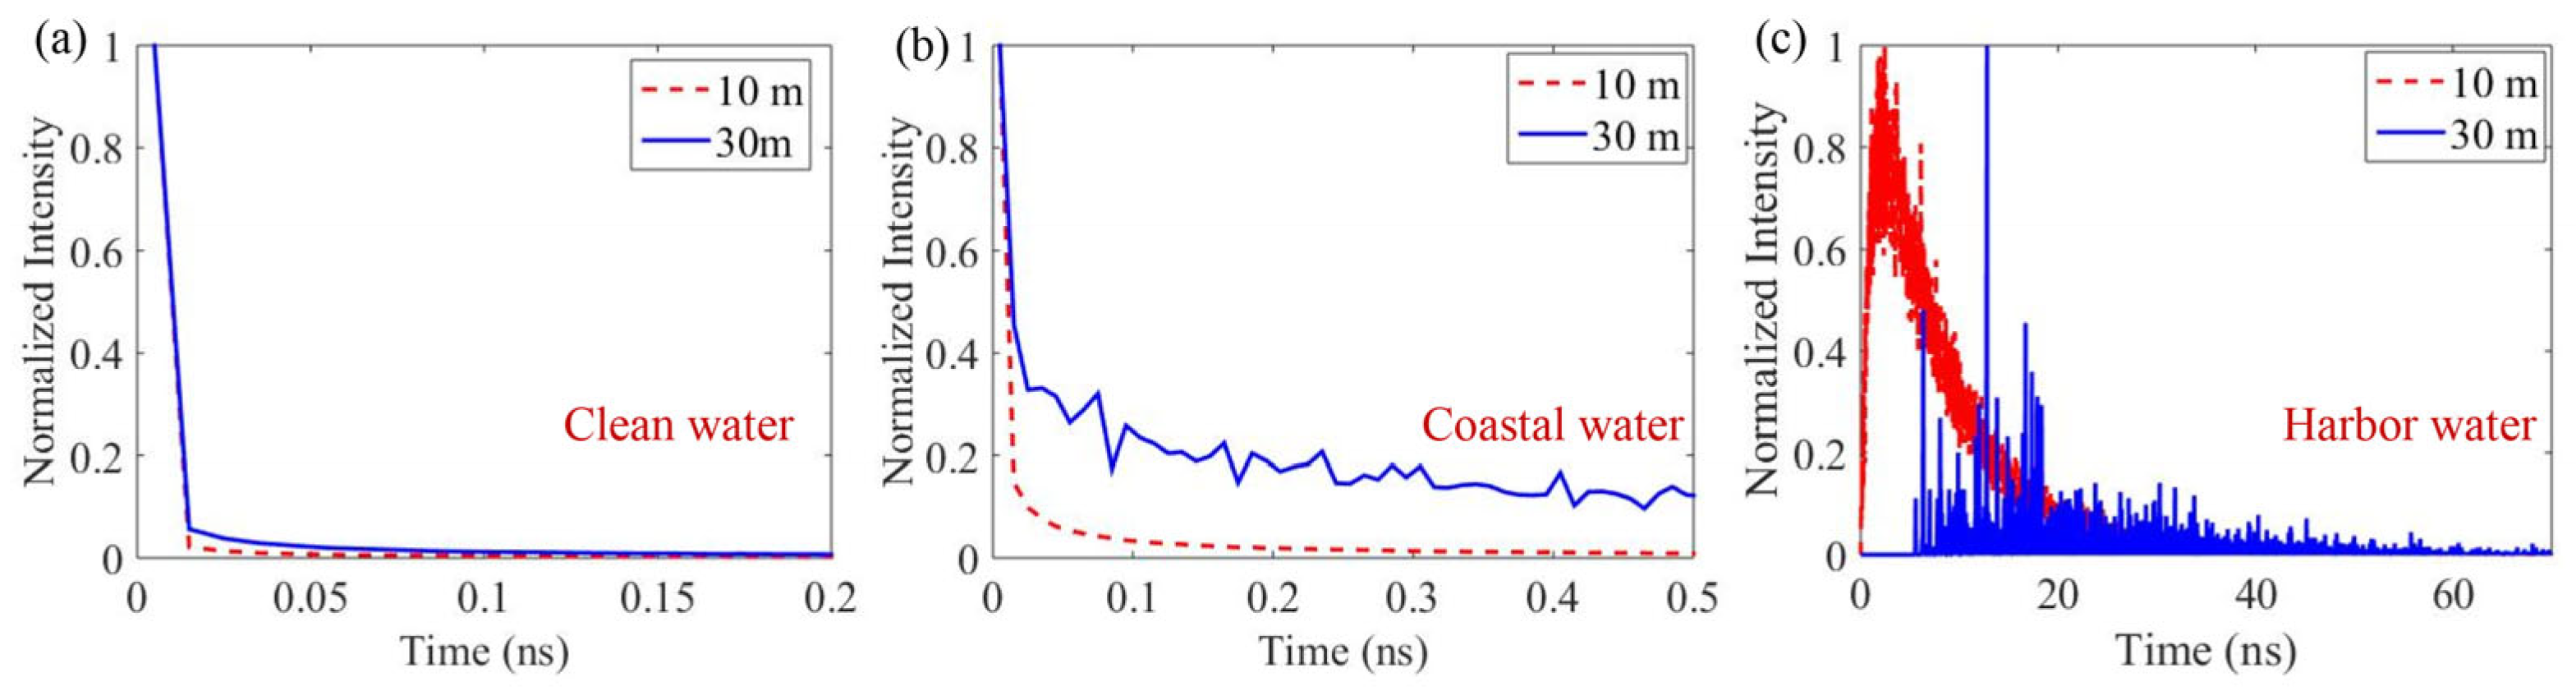
3.1. UWOC Channel Impulse Response

Here, a precisely aligned UWOC system with an LOS in various water types is considered and simulated. In the transmitter, a 532 nm laser diode (LD) with a 1 mrad divergence angle is employed. The light source is a Gaussian beam, and its beam width is set to 2 mm. For a smooth channel impulse response curve, 106 photons are involved in the simulation at one time. However, due to the strict limitations of the practical FOV and the lens aperture, most photons cannot satisfy the receiving requirements even when a large quantity is used in the simulation, i.e., only a very small portion of the photons will contribute to the strength of the received signal. Hence, to better understand the scattering properties of photons in the water channel, the FOV is set to 180°, and the receiver’s aperture is set as infinite. Based on the parameters set above, the MC method can be used to simulate and track the absorption and scattering of each emitted photon that interacts with the medium. And the tracking should be terminated when the photon reaches the receiver plane or the photon’s weight is lower than a threshold value of 10−9. The photons are repeatedly tracked until the last photon’s tracking is completed. Finally, the four parameters of position, direction, propagation distance, and weight of each received photon are recorded. Among them, the propagation distance can be converted to the propagation time from the transmitter to the receiver considering the constant speed of light in water (≈2.26 × 10⁸ m/s). The accumulated weight of the received photons with the same propagation time is normalized by the total propagation weight, which is used to present the curve of the normalized intensity versus the propagation time, and it is equivalent to the channel impulse response. The time resolution is designated as 10−11 s in this work. By this method, the normalized channel impulse response of clean water, coastal water, and harbor water with propagation distances of 10 m and 30 m is obtained, as shown in Figure 3.

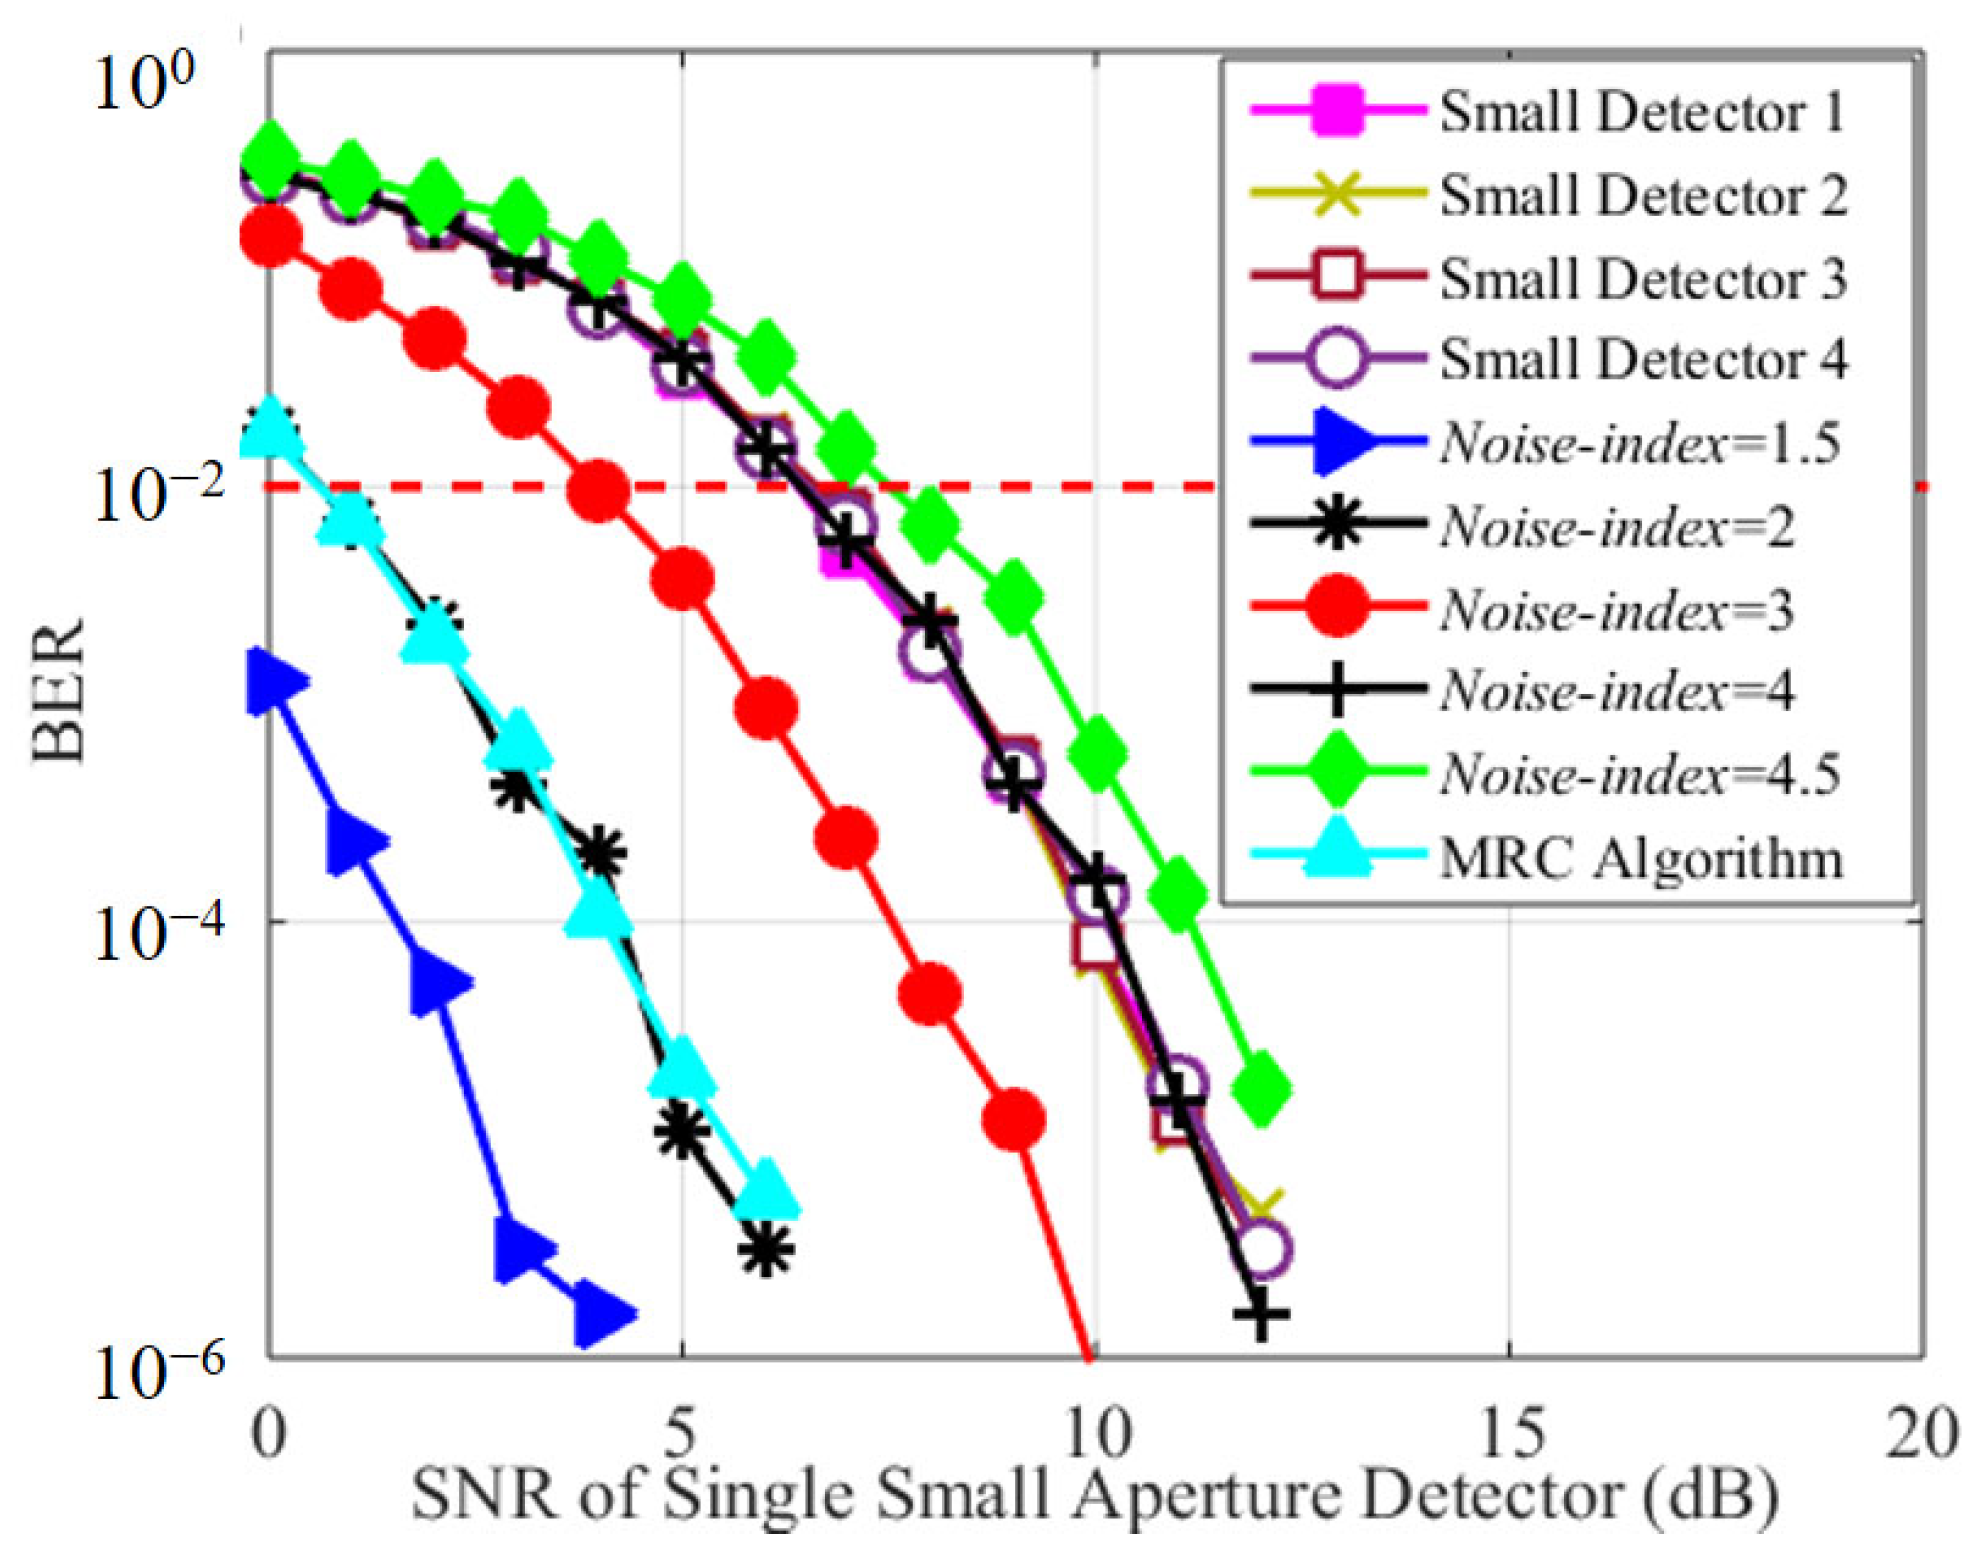
3.2. MRC Diversity Scheme

In the MRC diversity scheme, the estimated SNR of each branch signal is usually used as the weight for the linear combination of each branch signal, which produces the output signal with the maximum SNR. If N branch signals have the same SNR before combining, the combined SNR gain will be increased by N times. Therefore, to verify the performance of the MRC diversity scheme, the channel impulse response of 10 m of coastal water is used to construct an SIMO–UWOC simulation system. In the system, a 532 nm LD carrying the OFDM-16QAM signal is received by a 2 × 2 photoelectric detection array after propagating over a 10 m underwater channel. The electrical signals received after transmission through a 10 m coastal underwater channel are added with additive white Gaussian noise (AWGN) according to the set SNR. Four branch signals with the same SNR are received by the 2 × 2 detector array and processed by the MRC diversity algorithm.
The simulation results are shown in Figure 4. Figure 4a displays the relationship between the BER and SNR for the MRC diversity scheme with a 2 × 2 detector array when the four branch signals have the same SNR. One can see clearly that the MRC diversity scheme with a 2 × 2 detector array has significant SNR gain compared to single-detector reception, and the SNR gain is about 6 dB at a BER of 10−2. At the same time, the SNR estimation algorithm is used to track the SNR of the combined signals in real time. Figure 4b shows the SNR of a single-branch signal set during the simulation process and the corresponding estimated SNR of the combined signals. The red dotted line is the SNR gain of the MRC diversity scheme with a 2 × 2 detector array. The numerical value is stable at about 6 dB, which is consistent with the theoretical value. In addition, the extreme case where the SNR of one branch signal is 9 dB higher than that of the other three branch signals is considered. The simulation results in Figure 4c indicate that the performance of the combined signals with the MRC algorithm is still better than that of the optimal one-branch signal in terms of the BER.

3.3. The LAD Scheme

Large-aperture detectors can receive more light by increasing the effective detection area, which makes them a useful method to improve the signal quality. However, with an increase in the detection optical power, the received background noise and the electrical noise of the system inevitably increase. The LAD scheme will not always work well. Therefore, a simulation needs to be built to study the performance of the LAD scheme under different noise conditions. As shown in Figure 1, the effective detection area of the LAD scheme is equal to that of the detector array used for the MRC diversity scheme and is four times that of the SAD scheme. In the simulation, Noise-index is defined to describe the ratio of noise received by two detection schemes.
N o i s e i n d e x = N L A D N S A D = 4 n 0 + n 1 n 0 + n 1
where n0 and n1 are the background noise and the electrical noise of the SAD scheme. n1 is the electrical noise of the LAD scheme, which is related to the input light power. Here, based on the noise of the SAD scheme, the AWGN to be added to the LAD scheme is set according to the selected Noise-index. The cases of the LAD scheme with different Noise-index values in a 10 m coastal water channel are simulated, and the variation curves of the BER with the SNR are shown in Figure 5. In the meantime, the simulated BER performances of the SAD scheme and the MRC diversity scheme with a 2 × 2 detector array are also displayed for comparison.
As you can see from Figure 5, there are three scenarios that need to be discussed:
  • Noise-index < 2, i.e., 2n0 < 2n1−n1. In this case, the performance of the LAD scheme is better than that of the MRC diversity scheme with a 2 × 2 detector array;
  • 2 < Noise-index < 4, i.e., 2n0 < 2n1−n1 and n1 > 4n1. In this case, the performance of the MRC diversity scheme with a 2 × 2 detector array is better than that of the LAD scheme;
  • Noise-index > 4, i.e., n1 > 4n1. In this case, the performance of the SAD scheme is better than that of the LAD scheme.
Due to the fact that the relation between n1 and n1 cannot be determined in the simulation, it is still uncertain which detection scheme is the best in a certain situation. Therefore, it is necessary to introduce mathematical formulas to analyze the noise characteristics of the UWOC system and study the relationship between the noise and the incident light power.

4. Analysis

After being detected by the photoelectric detector, the background light is converted into background noise, which, together with the electrical noise of the device, constitutes the total noise of the UWOC system. It is worth mentioning that when the photoelectric detector works in the linear region, the intensity of the received optical signal is directly proportional to the current of the converted electrical signal. The total noise power spectral density (PSD) of the UWOC system is expressed as [28].
S t o t a l = S 0 + k B T + 2 q I R + R I N I 2 R
In the equation, the first term is the PSD of the background noise from the sun or other light sources. The second term is the PSD of the thermal noise, which is related to Boltzmann’s constant, kB, and the temperature, T. The last two items are the PSD of the shot noise and the laser intensity noise. Here, q is the elementary charge. I is the DC current output of the signal by the detector, and R is the matching impedance. RIN is the relative intensity noise (RIN) constant of the laser, and the RIN of the same laser remains unchanged. According to Equation (12), the PSD of the shot noise is proportional to I, and the PSD of the laser intensity noise is proportional to I2. When the environmental temperature is constant, the PSD of the thermal noise can be regarded as constant.
According to the relationship between Stotal and I, the expression for the SNR of signals received by the SAD scheme is
S N R 1 = P s P n I 2 I + I 2 + N t h e r m a l + N 0

4.1. MRC Diversity Scheme with a 2 × 2 Detector Array

Here, the constant coefficients of the variables are temporarily ignored, and only important parameters that affect the SNR are considered. Nthermal is a constant that represents the power of the thermal noise. N0 is the background noise, which depends on the surrounding ambient light. Referring to the simulation results of MRC performance mentioned above, the SNR of the combined signal after MRC diversity reception with a 2 × 2 detector array is four times that of the SAD scheme.
S N R 2 = S N R 1 × 4
In the LAD scheme, the effective detection area is four times larger than that of the SAD scheme. Thus, the SNR of the signals received by the LAD scheme is
S N R 3 = P s P n ( 4 I ) 2 4 I + ( 4 I ) 2 + N t h e r m a l + 4 2 N 0
By comparing Equations (13) and (15), it can be easily found that the LAD scheme has consistently outperformed the SAD scheme in terms of the SNR. And for the performance of the LAD scheme and the MRC diversity scheme with a 2 × 2 detector array, the relationship between the SNRs needs to be further analyzed. The ratio of the SNR between the two schemes is
S N R 3 S N R 2 ( 4 I ) 2 4 I + ( 4 I ) 2 + N t h e r m a l + 4 2 N 0 / 4 ( I 2 I + I 2 + N t h e r m a l + N 0 )    = 1 12 I 2 3 N t h e r m a l + 12 N 0 4 I + 16 I 2 + N t h e r m a l + 16 N 0
According to Equation (16), when the thermal noise is dominant and the background noise is small, the LAD scheme is superior to the MRC diversity scheme with a 2 × 2 detector array. In other cases, the MRC diversity scheme with a 2 × 2 detector array is always superior to the LAD scheme.

4.2. MRC Diversity Scheme with an M1 × M2 Detector Array

Extending the above analysis to a general situation, when the MRC diversity scheme uses an M1 × M2 detector array for signal reception, the SNR of the received signal is
S N R 2 _ M 1 M 2 = S N R 1 × M 1 M 2
The LAD scheme has the same detection area as the detector array used for the MRC diversity scheme, and the detection area is M1 × M2 times larger than that of the SAD scheme. Hence, the SNR of the signals received by the LAD scheme is
S N R 3 _ M 1 M 2 = P s P n ( M 1 M 2 I ) 2 M 1 M 2 I + ( M 1 M 2 I ) 2 + N t h e r m a l + ( M 1 M 2 ) 2 N 0
By considering the ratios of Equations (13) and (18), we can clearly find that the performance of the LAD scheme was always better than that of the SAD scheme. To further compare the performances of the LAD scheme and the MRC diversity scheme with an M1 × M2 detector array, the SNR ratios of the two schemes are displayed as
S N R 3 _ M 1 M 2 S N R 2 _ M 1 M 2 ( M 1 M 2 I ) 2 M 1 M 2 I + ( M 1 M 2 I ) 2 + N t h e r m a l + ( M 1 M 2 ) 2 N 0 / M 1 M 2 ( I 2 I + I 2 + N t h e r m a l + N 0 )    = 1 M 1 M 2 ( M 1 M 2 1 ) I 2 ( M 1 M 2 1 ) N t h e r m a l + M 1 M 2 ( M 1 M 2 1 ) N 0 M 1 M 2 I + ( M 1 M 2 ) 2 I 2 + N t h e r m a l + ( M 1 M 2 ) 2 N 0
By analyzing Equation (19), we can find that the LAD scheme is superior to the MRC diversity scheme with an M1 × M2 detector array when the thermal noise is dominant and the background noise is small. And in other cases, the MRC diversity scheme with an M1 × M2 detector array is always superior to the LAD scheme. The above conclusions, based on fully considering the noise in UWOC systems, are scientific and universal, so they can effectively guide the selection of detection and signal processing technologies in practical underwater communication application scenarios.

5. Discussion

As we all know, the real UWOC system is a complex time-variant system. The parameters of a channel are affected by the temperature, salinity, velocity fields, and turbidity of the seawater in real time. The real underwater channel system is difficult to simulate and calculate. In our simulation, the underwater environment is assumed to be an ideal isotropic and homogeneous medium without flowing or turbulence. Therefore, an underwater wireless optical channel can be treated as a linear time-invariant system. At present, a large amount of work in studying underwater channel models mainly considers absorption and scattering while ignoring turbulence effects [19,20,21,22]. Any assumptions made here are chosen not from convenience but from necessity—whether this is a computational complexity necessity or simply based on the numerical method chosen. On the basis of these assumptions, our simulation can be very close to the real UWOC system.
The effects of an underwater channel on optical signals can be described by the impulse response, h(t), which is related to the absorption coefficient and scattering coefficient of water; the transmission distance; and the parameters of the transmitter and receiver. In this paper, the MC simulation algorithm is used to obtain the impulse response, h(t), of clean water, coastal water, and harbor water with propagation distances of 10 m and 30 m. During an MC simulation, the receiver’s aperture is set to infinite, just to reflect the characteristics of an underwater channel. The received signal can be expressed as y(t) = x(t)⊗h(t) + n(t). The noise, n(t), of a UWOC system mainly includes background light noise, thermal noise, shot noise, and laser intensity noise. Among them, the background light noise considered in this paper includes noise from solar radiations and other light sources (lighthouses, fishing lamps, underwater bioluminescence, and so on). By considering the complexity of the actual background light noise in a UWOC system, we define the total noise effect caused by solar radiation and other light sources as the background light noise and will use it for simulations and theoretical analyses in the following paper.
At present, the existing papers on the performance of MRC diversity technology mostly focus on comparing it with the performance of an SISO system [13,16], and the detectors used in the two schemes have different detection areas. Obviously, this performance comparison is unfair due to insufficient consideration of the detector area, received signal strength, noise impact, and so on. Therefore, in this paper, on the basis of fully considering the noises in the UWOC system, the performance of the MRC diversity technology is fairly and comprehensively studied by comparing it with two SISO systems using a SAD scheme or a LAD scheme through an MC simulation and formula analysis.
In the transmitter, a green laser is modulated by the OFDM-16QAM digital signal. As we all know, OFDM has been proven to be an effective technique for the UWOC system due to its high spectral efficiency and potential resistance to channel instability when transmitting signals over multiple orthogonal sub-carriers simultaneously. Data transmission in underwater optical wireless channels is achieved through intensity modulation and direct detection (IM/DD) techniques, which make it possible to realize the signal transmission and reception by using a simple light modulator and a photodiode. Here, Square 16QAM is used. Every four bits of data are mapped to a 16QAM symbol according to a certain mapping relationship. In order to obtain an accurate estimate of the BER, 1.28 million pseudo-random binary sequences are generated as the transmission information to calculate the BER. It is worth mentioning that when the photodiode at the receiver side works in the linear region, the intensity of the received optical signal is directly proportional to the current of the converted electrical signal. Based on the above relationship, we process the electrical signals received after transmission through a 10 m coastal underwater channel to simulate a focused beam with various detection areas using the SAD scheme, the MRC diversity scheme with a 2 × 2 detector array, and the LAD scheme.

6. Conclusions

On the basis of fully considering noise in the UWOC system, this paper conducts a comprehensive study and analysis of the performance of MRC diversity technology by comparing it with SISO schemes. With the help of the MC method, UWOC systems with the SAD scheme, the MRC diversity scheme, and the LAD scheme are simulated. In a 10 m coastal seawater environment, we first build an SIMO–UWOC simulation system to verify the performance of the MRC diversity scheme with a 2 × 2 detector array. The simulation results show that the MRC diversity scheme with a 2 × 2 detector array has a significant SNR gain compared to the SAD scheme, and the SNR gain is about 6 dB at a BER of 10−2. Second, a simulation of a UWOC system with the LAD scheme is built to study its detection performance under different noise conditions. Without determining the change in detector noise, the simulation results contain three possible scenarios that make it impossible to definitively determine the performance of the LAD scheme compared to the other two schemes. Third, to further compare the three detection schemes of the UWOC system, the total noise PSD is introduced to analyze the noise characteristics of the UWOC system. The results show that the LAD scheme consistently outperformed the SAD scheme in terms of the SNR. When the thermal noise is dominant and the background noise is small, the LAD scheme is superior to the MRC diversity scheme with a 2 × 2 detector array. In other cases, the MRC diversity scheme with a 2 × 2 detector array is always superior to the LAD scheme. Finally, by analyzing the performance of the MRC diversity scheme with an M1 × M2 detector array, it is further demonstrated that the above conclusion is universal.

Author Contributions

Conceptualization, W.Z. and L.W.; methodology, L.W. and L.F.; software, L.W.; validation, W.Z. and H.P.; formal analysis, K.W. and Y.Z.; investigation, L.W.; resources, L.F.; data curation, W.Z.; writing—original draft preparation, L.W.; writing—review and editing, L.W.; project administration, X.W. All authors have read and agreed to the published version of the manuscript.

Funding

This research received no external funding.

Institutional Review Board Statement

Not applicable.

Informed Consent Statement

Not applicable.

Data Availability Statement

Data underlying the results presented in this paper are not publicly available at this time but may be obtained from the authors upon reasonable request.

Conflicts of Interest

The authors declare no conflict of interest.

References

  1. Zhao, M.; Li, X.; Chen, X.; Tong, Z.; Lyu, W.; Zhang, Z.; Xu, J. Long-reach underwater wireless optical communication with relaxed link alignment enabled by optical combination and arrayed sensitive receivers. Opt. Express 2020, 28, 34450–34460. [Google Scholar] [CrossRef] [PubMed]
  2. Oubei, H.M.; Li, C.; Park, K.H.; Ng, T.K.; Alouini, M.S.; Ooi, B.S. 2.3 Gbit/s underwater wireless optical communications using directly modulated 520 nm laser diode. Opt. Express 2015, 23, 20743–20748. [Google Scholar] [CrossRef] [PubMed]
  3. Zeng, Z.; Fu, S.; Zhang, H.; Dong, Y.; Cheng, J. A survey of underwater optical wireless communications. IEEE Commun. Surv. Tutor. 2016, 19, 204–238. [Google Scholar] [CrossRef]
  4. Kaushal, H.; Kaddoum, G. Underwater optical wireless communication. IEEE Access 2016, 4, 1518–1547. [Google Scholar] [CrossRef]
  5. Li, J.; Yang, B.; Ye, D.; Wang, L.; Wang, Y. A real-time, full-duplex system for underwater wireless optical communication: Hardware structure and optical link model. IEEE Access 2020, 8, 109372–109387. [Google Scholar] [CrossRef]
  6. Doniec, M.W.; Rus, D.L. BiDirectional optical communication with AquaOptical II. In Proceedings of the IEEE International Conference on Communication Systems (ICCS), Singapore, 17–19 November 2010; pp. 390–394. [Google Scholar]
  7. Doniec, M.; Detweiler, C.; Vasilescu, I.; Chitre, M.; Hoffmann-Kuhnt, M.; Rus, D. AquaOptical: A lightweight device for high-rate long-range underwater point-to-point communication. Mar. Technol. Soc. J. 2010, 44, 55–65. [Google Scholar] [CrossRef]
  8. Anguita, D.; Brizzolara, D.; Parodi, G. Building an Underwater Wireless Sensor Network Based on Optical: Communication: Research Challenges and Current Results. In Proceedings of the IEEE 2009 Third International Conference on Sensor Technologies and Applications, Athens, Greece, 18–23 June 2009; pp. 476–479. [Google Scholar]
  9. Ali, M.F.; Jayakody, D.N.K.; Gamage, P.T.P.; Dinis, R. Dual-Hop Underwater Wireless Optical Communication System. In Proceedings of the IEEE 95th Vehicular Technology Conference, Helsinki, Finland, 19–22 June 2022; pp. 1–6. [Google Scholar]
  10. Wang, T.; Yu, X.; Zhao, B.; Pang, D. Error Characterization of Differential Detection and Non-Differential Detection for MIMO UWOC Systems in Seawater Turbulent Channels. Photonics 2023, 10, 859. [Google Scholar] [CrossRef]
  11. Ali, M.F.; Jayakody, D.N.K.; Beko, M.; Correia, S. Performance Evaluation of Vertical VLC Link in Mixed Water Mediums. In Proceedings of the 6th Conference on Cloud and Internet of Things (CIoT), Lisbon, Portugal, 20–22 March 2023; pp. 195–199. [Google Scholar]
  12. Chen, X.; Lyu, W.; Yu, C.; Qiu, Y.; Chen, L.K. Diversity-reception UWOC system using solar panel array and maximum ratio combining. Opt. Express 2019, 27, 34284. [Google Scholar] [CrossRef] [PubMed]
  13. Wang, F.; Liu, Y.; Jiang, F.; Chi, N. High speed underwater visible light communication system based on LED employing maximum ratio combination with multi-PIN reception. Opt. Commun. 2018, 425, 106–112. [Google Scholar] [CrossRef]
  14. Al-Qahtani, F.S.; Zummo, S.A.; Gurung, A.K.; Hussain, Z.M. Spectral efficiency of maximum ratio combining (MRC) over slow fading with estimation errors. Digit. Signal Process. 2010, 20, 85–96. [Google Scholar] [CrossRef]
  15. Ahn, K.S.; Heath, R W. Performance analysis of maximum ratio combining with imperfect channel estimation in the presence of cochannel interferences. IEEE Trans. Wireless Commun. 2009, 8, 1080–1085. [Google Scholar] [CrossRef]
  16. Liu, W.; Xu, Z.; Yang, L. SIMO detection schemes for underwater optical wireless communication under turbulence. Photonics Res. 2015, 3, 48–53. [Google Scholar] [CrossRef]
  17. Boucouvalas, A.C.; Peppas, K.P.; Yiannopoulos, K.; Ghassemlooy, Z. Underwater optical wireless communications with optical amplification and spatial diversity. IEEE Photonics Technol. Lett. 2016, 28, 2613–2616. [Google Scholar] [CrossRef]
  18. Jamali, M.V.; Salehi, J.A. On the BER of Multiple-Input Multiple-Output Underwater Wireless Optical Communication Systems. In Proceedings of the IEEE 4th International Workshop on Optical Wireless Communications (IWOW), Istanbul, Turkey, 7–8 September 2015; pp. 26–30. [Google Scholar]
  19. Dong, F.; Xu, L.; Jiang, D.; Zhang, T. Impulse response modeling for underwater wireless optical communication links. IEEE Trans. Commun. 2014, 62, 226–234. [Google Scholar]
  20. Zhang, J.; Gao, G.; Li, J.; Ma, Z.; Guo, Y. Experimental demonstration and simulation of bandwidth-limited underwater wireless optical communication with MLSE. Photonics 2022, 9, 182. [Google Scholar] [CrossRef]
  21. Boluda-Ruiz, R.; Rico-Pinazo, P.; Castillo-Vazquez, B.; Garcia-Zambrana, A.; Qaraqe, K. Time-dispersion and signal attenuation analysis of underwater optical wireless communication links. In Proceedings of the IEEE Global Communications Conference (GLOBECOM), Waikoloa, HI, USA, 9–13 December 2019. [Google Scholar]
  22. Chen, D.; Liu, Y.; Ai, F.; Cao, M. Modeling and analysis of channel impulse response for underwater wireless optical communication. Opt. Eng. 2022, 61, 036102. [Google Scholar] [CrossRef]
  23. Petzold, T.J. Volume Scattering Functions for Selected Ocean Waters; Scripps Institution of Oceanography: La Jolla, CA, USA, 2007. [Google Scholar]
  24. Gabriel, C.; Khalighi, M.A.; Bourennane, S.; Léon, P.; Rigaud, V. Monte-Carlo-based channel characterization for underwater optical communication systems. J. Opt. Commun. Netw. 2013, 5, 1–12. [Google Scholar] [CrossRef]
  25. Cox, W.C., Jr. Simulation, Modeling, and Design of Underwater Optical Communication Systems; North Carolina State University: Raleigh, NC, USA, 2012. [Google Scholar]
  26. Li, J.; Ma, Y.; Zhou, Q.; Zhou, B.; Wang, H. Monte Carlo study on pulse response of underwater optical channel. Opt. Eng. 2012, 51, 066001. [Google Scholar] [CrossRef]
  27. Jaruwatanadilok, S. Underwater wireless optical communication channel modeling and performance evaluation using vector radiative transfer theory. IEEE J. Sel. Areas Commun. 2008, 26, 1620–1627. [Google Scholar] [CrossRef]
  28. Urick, V.J.; Bucholtz, F.; McKinney, J.D.; Devgan, P.S.; Campillo, A.L.; Dexter, J.L.; Williams, K.J. Long-haul analog photonics. J. Light. Technol. 2011, 29, 1182–1205. [Google Scholar] [CrossRef]
Figure 1. The UWOC system model with (a) the SAD scheme. (b) the MRC diversity scheme with a 2 × 2 detector array, and (c) the LAD scheme.
Photonics 10 01388 g001
Figure 2. Flow chart for MC simulation in UWOC system.
Photonics 10 01388 g002
Figure 3. The normalized channel impulse response with different link ranges in (a) clear water; (b) coastal water; and (c) harbor water.
Photonics 10 01388 g003
Figure 4. Simulated BER and SNR performance for MRC diversity scheme with a 2 × 2 detector array. (a) Four branch signals that have the same SNR. (b) The SNR gain for the MRC diversity scheme with a 2 × 2 detector array. (c) One of the branches has a 9 dB higher SNR than the other three branches.
Photonics 10 01388 g004
Figure 5. Simulated BER performance of the LAD scheme with different Noise-index values.
Photonics 10 01388 g005
Table 1. Representative absorption, scattering, and total attenuation coefficients [23].
Water Typea (m−1)b (m−1)c (m−1)
Pure water0.0530.0030.056
Clean water0.1140.0370.151
Coastal water0.1790.2190.398
Harbor water0.3661.8242.19
Disclaimer/Publisher’s Note: The statements, opinions and data contained in all publications are solely those of the individual author(s) and contributor(s) and not of MDPI and/or the editor(s). MDPI and/or the editor(s) disclaim responsibility for any injury to people or property resulting from any ideas, methods, instructions or products referred to in the content.

