Article

Research on Tip Characterization Techniques Based on Two-Dimensional Self-Traceable Nano-Gratings

1
Institute of Precision Optical Engineering, Tongji University, Shanghai 200092, China
2
MOE Key Laboratory of Advanced Micro-Structured Materials, Tongji University, Shanghai 200092, China
3
Shanghai Frontiers Science Center of Digital Optics, Tongji University, Shanghai 200092, China
4
Shanghai Professional Technical Service Platform for Full-Spectrum and High-Performance Optical Thin Film Devices and Applications, Tongji University, Shanghai 200092, China
5
School of Physics Science and Engineering, Tongji University, Shanghai 200092, China
6
Shanghai Institute of Measurement and Testing Technology, Shanghai 201203, China
7
Zhejiang University of Water Resources and Electric Power, Hangzhou 310018, China
*
Author to whom correspondence should be addressed.
Photonics 2023, 10(11), 1272; https://doi.org/10.3390/photonics10111272
Submission received: 15 October 2023 / Revised: 3 November 2023 / Accepted: 7 November 2023 / Published: 17 November 2023
(This article belongs to the Special Issue Optical Devices/Components/Coatings for Ultra-Precision Equipment)

Abstract

:
The characterization of scanning tip morphology is crucial for accurate linewidth measurements. Conventional rectangular characterizers are affected by lateral distortion caused by the nonlinearities in AFM scanning, leading to errors between the actual characterization results and the true values. In this study, we innovatively developed self-traceable two-dimensional nano-gratings using chromium atomic deposition technology and extreme ultraviolet interference lithography. We used this structure as a characterizer for conducting scanning tip characterizations.This paper analyzed the periodic stability of the grating sample during scanning and corrected the lateral distortion of atomic force microscopy (AFM) at scan scales of 0.5 µm and 1 µm based on its self-traceable characteristics. Additionally, we extracted the angle information of the scanning tip in the X direction and Y direction within a scan scale of 0.5 µm. The results demonstrate that the two-dimensional grating sample exhibited excellent periodic stability during scanning. The characterization errors for the tip’s X direction and Y direction angles are within ±2°, showing high consistency. This study highlights that self-traceable two-dimensional grating samples have the capability for in situ bidirectional characterization of tip information, providing a creative solution for the development of new-style tip characterizers.

1. Introduction

According to the International Technology Roadmap for Semiconductors (ITRS) and Moore’s law, semiconductor critical dimensions are projected to break the 2 nm scale by the year 2024. The development of the semiconductor manufacturing industry is a primary driving force behind the advancement of cutting-edge technology. The precise measurement of critical dimensions will directly impact the development of the semiconductor manufacturing industry.
Hybrid metrology [1,2,3] is a commonly used method for measuring critical dimensions in which samples are jointly characterized by utilizing two or more micro-nano characterization devices in current times. In linewidth measurements, we often use techniques such as atomic force microscopy (AFM) [4,5], scanning electron microscopy (SEM) [6,7,8], transmission electron microscopy (TEM) [9,10], or scatterometry to measure linewidth values. Each of these devices has its own technical limitations based on their measurement principles. The advantages of one device can, to some extent, compensate for the limitations of others. For example, AFM’s three-dimensional measurements can complement SEM’s two-dimensional imaging limitations. Therefore, a combination of measurement methods can effectively enhance the accuracy of linewidth measurements.
AFM provides high-precision, three-dimensional characterization of samples with minimal sample damage and is widely used in practical measurements. However, when the tip size approaches that of the sample under measurement, the AFM characterization result tends to exceed the actual value, which is attributed to the non-negligible size of the tip itself. This is known as the tip’s inflation effect [11,12,13,14]. Therefore, obtaining the morphology of the tip to correct size discrepancies caused by the inflation is particularly crucial. Common methods for obtaining the tip’s shape include direct SEM characterization, blind reconstruction algorithms, and tip characterizers. However, all three methods have their own set of drawbacks. Direct SEM characterization cannot provide in situ characterization of the scanning tip, and the tip can easily be contaminated during transfer. Blind reconstruction algorithms require the sample surface to have sharp features, demanding precise sample preparation, and they are susceptible to environmental noise during subsequent processing, resulting in poor stability. Tip characterizers have advantages such as a simple fabrication process, in situ measurements, and good stability. Many leading institutions internationally have conducted in-depth research on characterizers and produced stable linewidth-type characterizers, such as PTB’s IVSP-100 from Germany [15] and NIST’s SCCDRM from the USA [16].
The commonly used rectangular characterizers often suffer from the following issues: (1) Nonlinear effects during scanning with AFM can lead to differences in sample characterization results at different scan scales, affecting the accuracy of characterizer tip characterization [8,17]. (2) Analysis of the linewidth in discrete-type characterizers relies on the linear relationship between theoretical and measured linewidth values. The tip’s full width at half maximum is commonly characterized using the intercept, as practiced by organizations like Germany’s PTB. However, this approach may introduce errors due to the limited availability of experimental data for discrete linewidths. Finally, (3) samples for linewidth-type characterizers are typically arranged in a one-dimensional layout, allowing for single-direction (X direction or Y direction) characterization in a single scan. To characterize in the other direction, the tip must be lifted with the sample rotated clockwise (or counterclockwise), the tip lowered again, and the scanning direction changed. Simultaneous two-way measurements in situ are not possible.
To address the issues mentioned above, our research group fabricated a two-dimensional grating sample using chromium atomic deposition technology and extreme ultraviolet lithography. This sample possesses excellent self-traceability characteristics, featuring a two-dimensional periodic array of hole structures with protrusions between adjacent holes which is equivalent to a continuous-width characterizer and providing solutions to the three issues mentioned above.
Based on this, we conducted a systematic study of the two-dimensional grating sample and developed a tip characterization method utilizing it. Leveraging the sample’s excellent periodic self-traceability characteristics, we calibrated the lateral distortion of the AFM at different scan scales. We also performed lateral and vertical scans within the same frame image, characterizing the tip’s X direction and Y direction angle information based on the imaging of different cross-sectional positions between holes. The experimental results demonstrate that the two-dimensional grating sample exhibited reliable periodic accuracy during scanning. The calibration coefficients for lateral distortion of the AFM, used by our research group at scan scales of 0.5 µm and 1 µm, were 1.0054 nm/pixel and 1.0078 nm/pixel, respectively. The calibrated AFM’s tip characterization results for the tip angles also exhibited good consistency. Within a height range of 15 nm below the tip, the tip’s forward angle (FA) was 41°, the backward angle (BA) was 51°, and the lateral angle (SA) was 40° and 51°, with characterization errors maintained within 2°.

2. Materials and Methods

2.1. Fabrication of 2D Gratings

Traceability is a prerequisite for all metrological behaviors. In 2018, the International Metrology Conference adopted the reproduction of the secondary definition of the meter, using the silicon lattice constant [18,19,20] as its core. Afterward, a traceability chain centered around the silicon lattice constant was established. The rectangular tip characterizers are made from silicon, where its linewidth values can be directly traced back to the silicon lattice constant. However, their calibration process often requires the use of destructive methods, such as TEM. One-dimensional gratings, prepared using chromium atomic deposition technology, can trace their grating pitch back to the inherent constant of the chromium atomic resonance frequency, and this constant is physically represented in the form of a grating pitch. Whether in subsequent measurement transfer or measurement detection, it can be carried out in a nondestructive manner. Similarly, two-dimensional grating samples, prepared using atomic deposition chromium gratings as masks through extreme ultraviolet interference lithography, also exhibit traceability characteristics. We consider the tip characterization process, based on these grating samples, to be traceable characterization.
Building on the above ideas, the research group employs a laser-induced stepwise deposition of Cr atoms to prepare the masks required for interference exposure. Subsequently, extreme ultraviolet interference lithography and ICP etching, based on the Shanghai Synchrotron Radiation Source, are performed to obtain the two-dimensional grating samples needed for the experiments. The grating samples have a uniform distribution of approximately circular hole structures in both the X and Y directions. The specific preparation process is as follows.

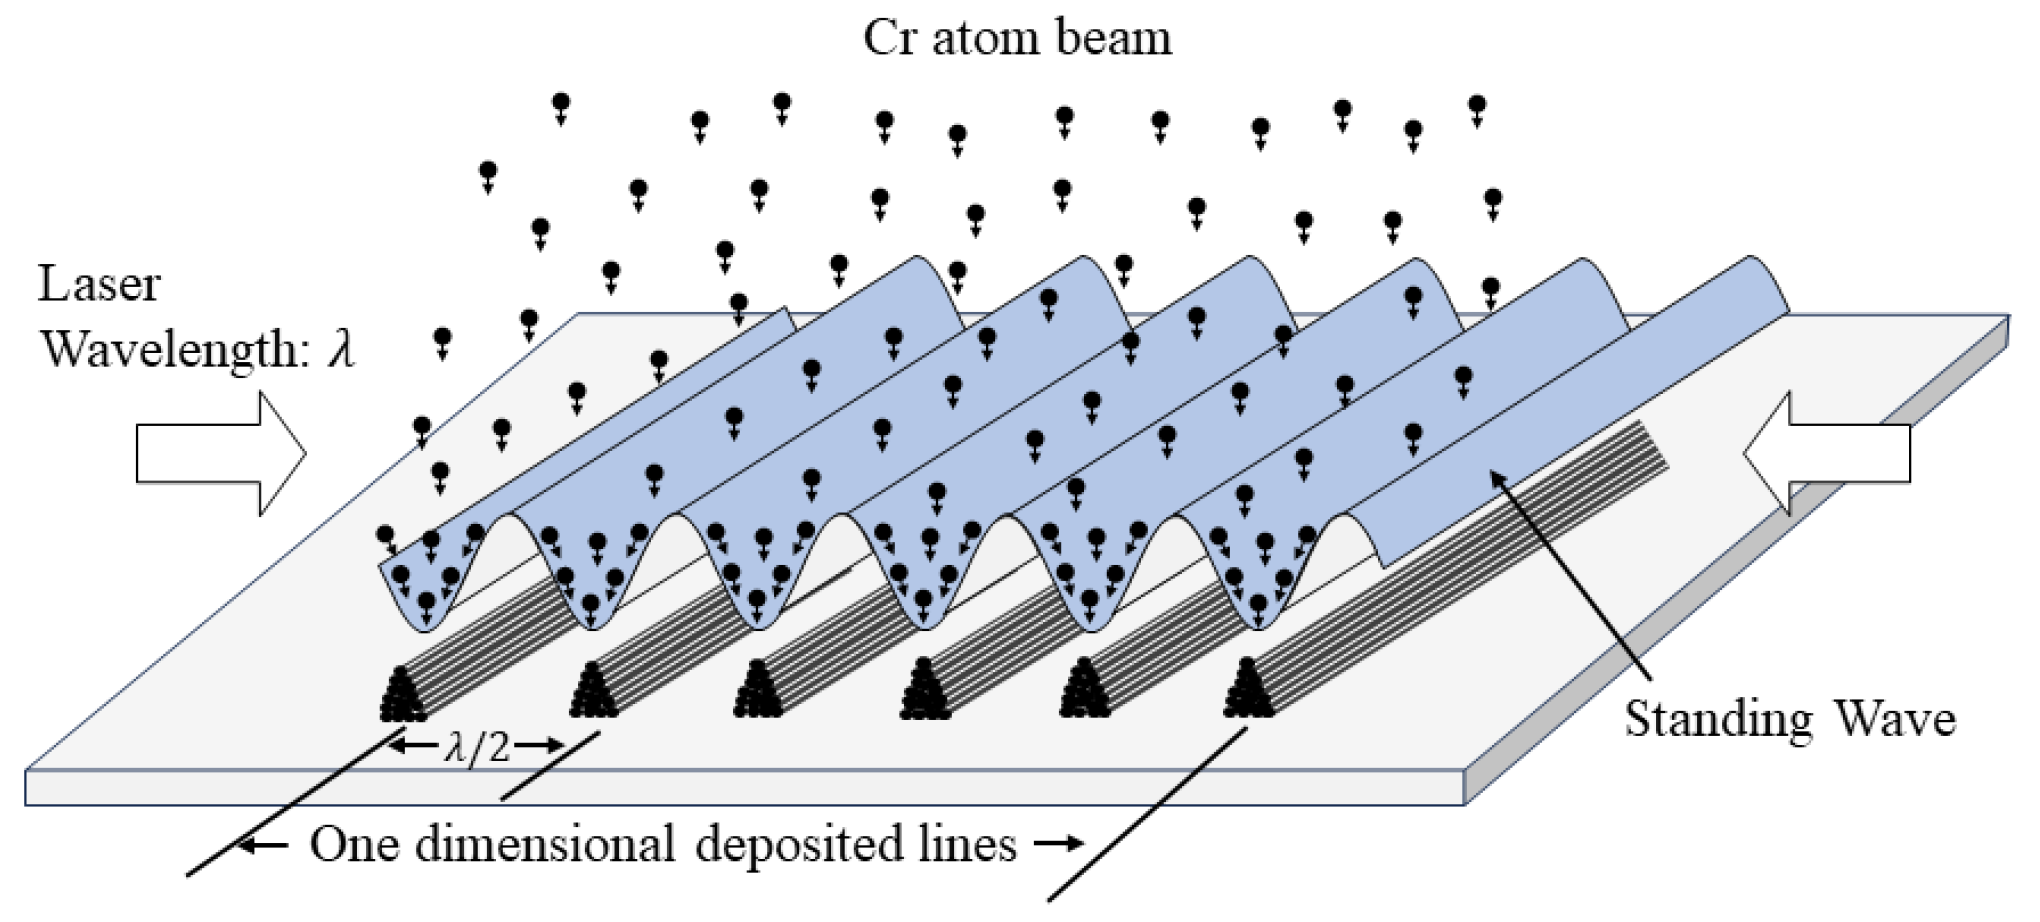
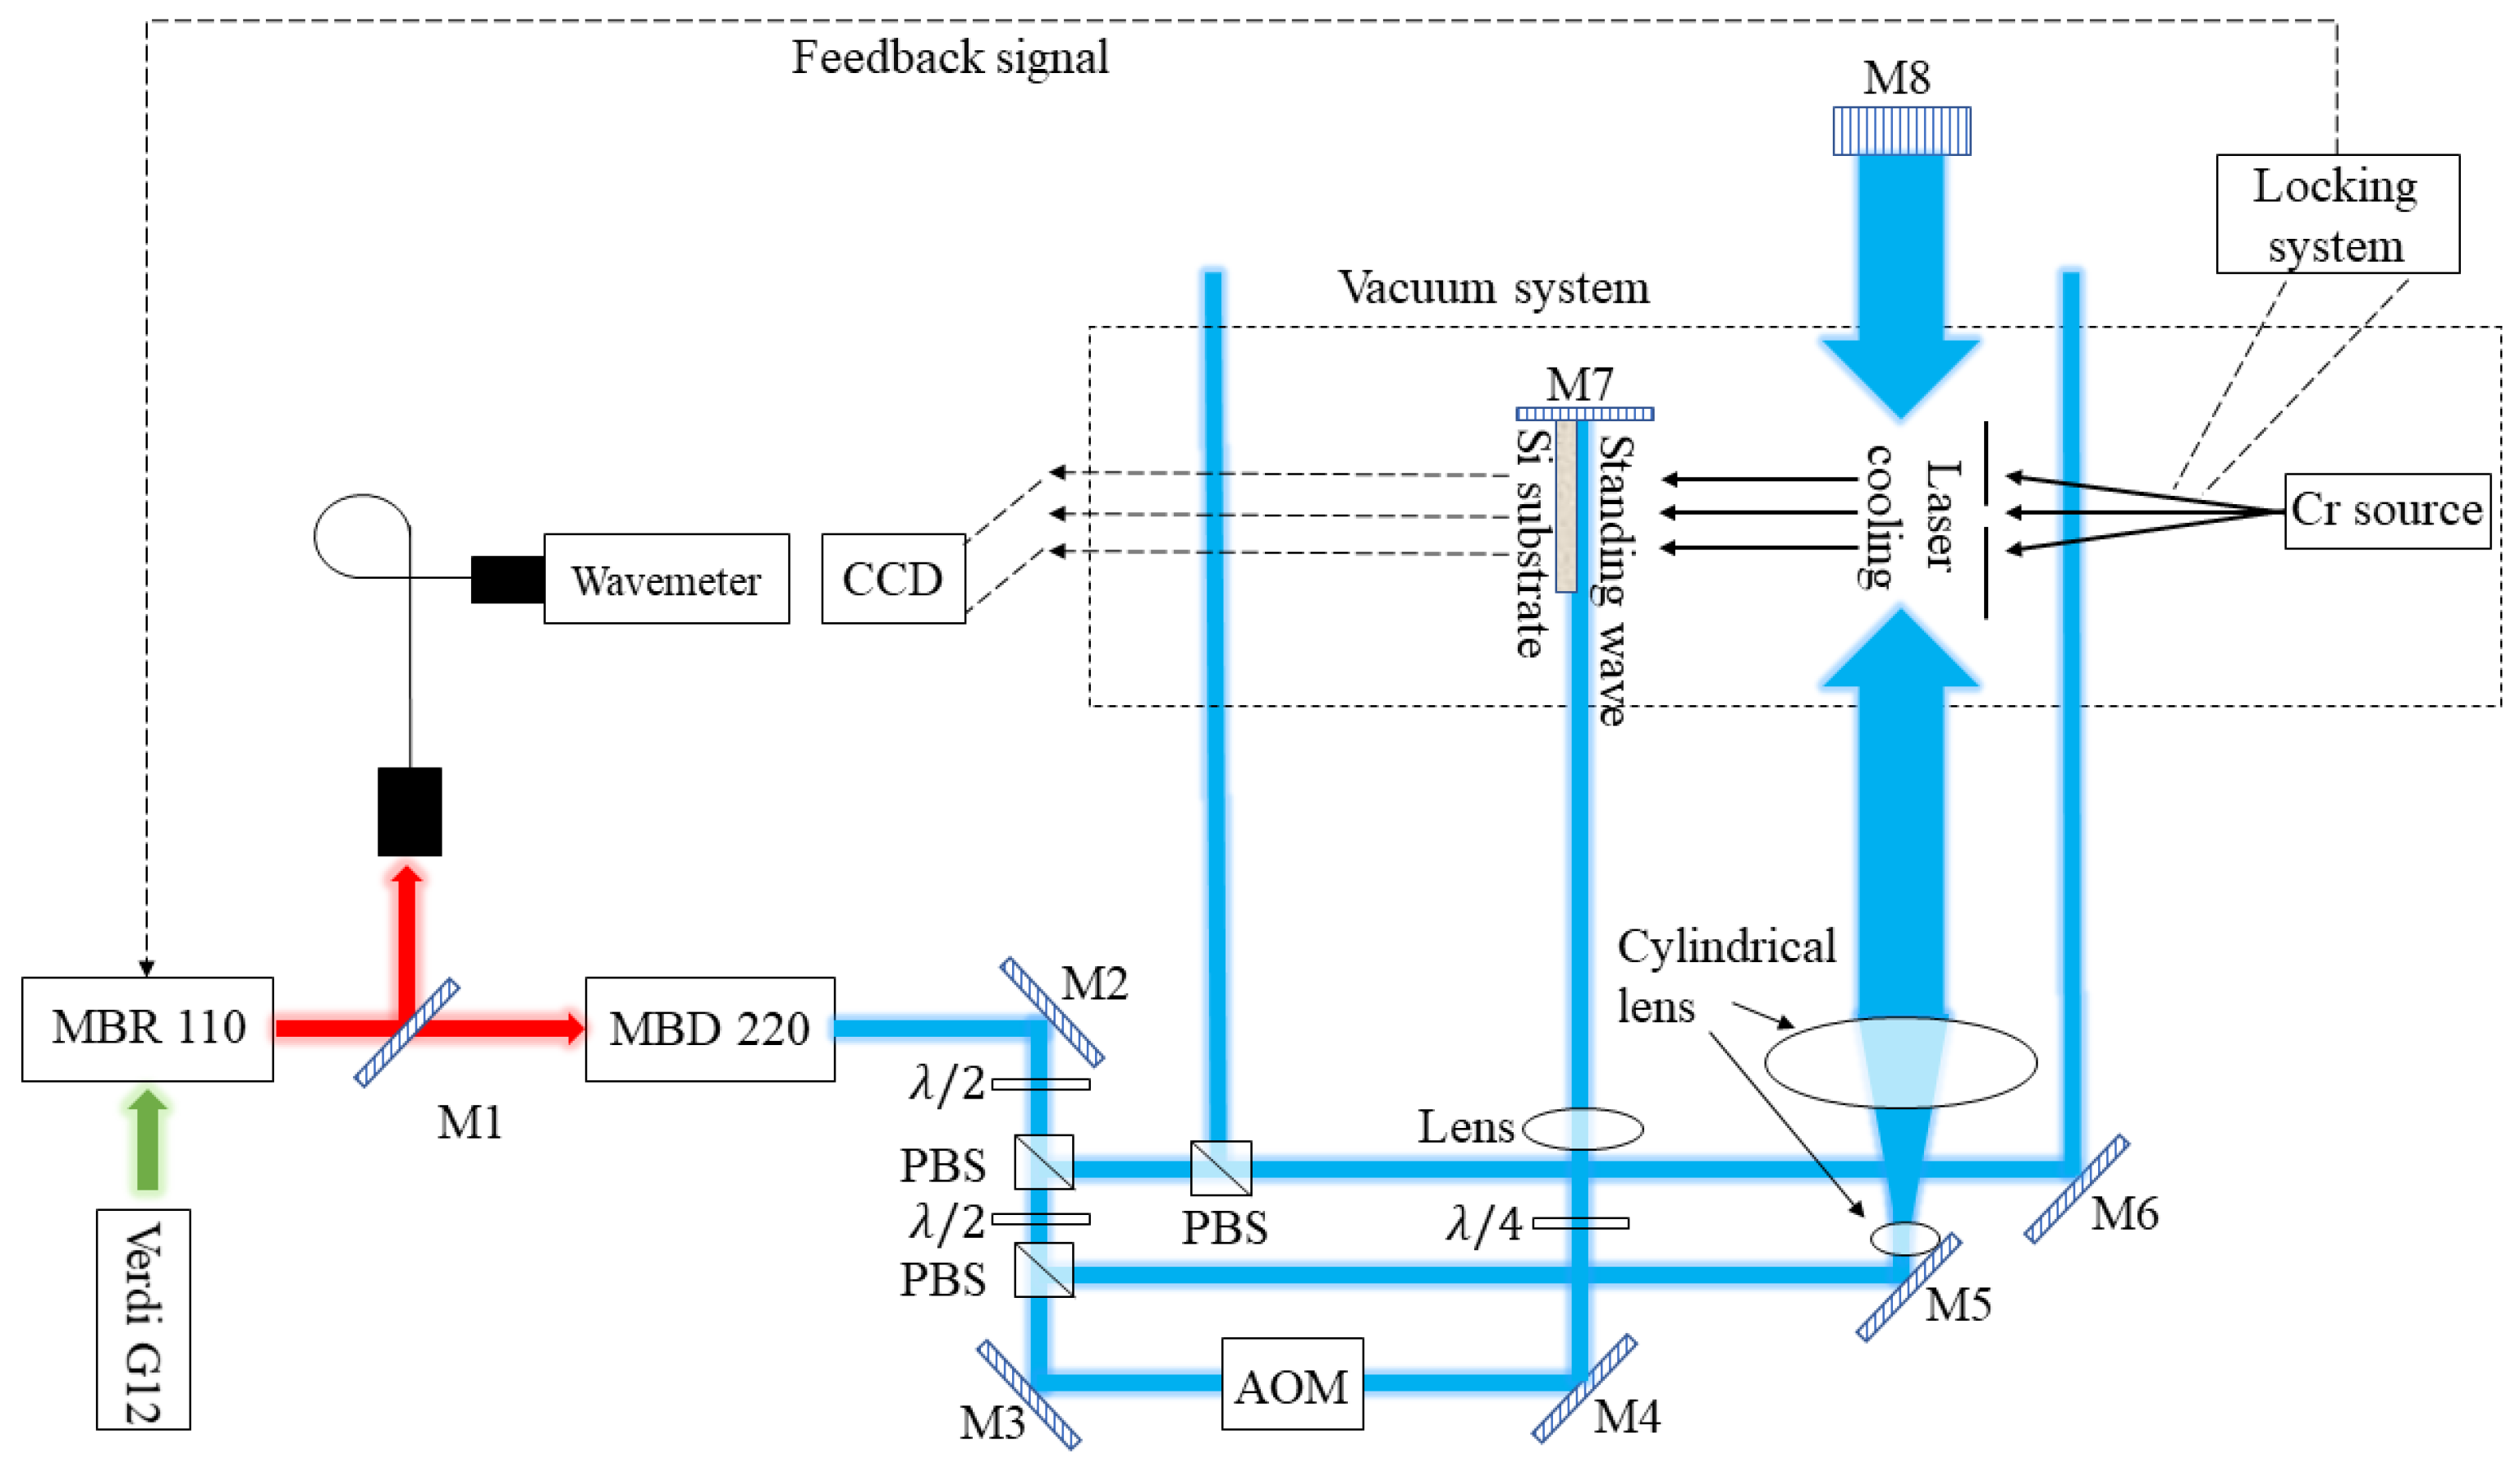
2.1.1. Laser-Focused Chromium Atom Deposition

Laser-focused chromium atom deposition technology is a novel approach to fabricating one-dimensional gratings. It primarily leverages the dipole force exerted on atoms by a laser standing wave field to manipulate the motion of atoms. This manipulation results in the formation of a periodic grating structure on a substrate when a cooled atomic beam passes through the laser standing wave field. The laser wavelength is precisely locked at λ = 425.55 nm, corresponding to the energy level transition of Cr atoms from the ground state 7 S 3 to the excited state 7 P 4 0 [21,22]. Consequently, the pitch of the one-dimensional Cr atom grating prepared using this method strictly equals half of the laser wavelength, which is 212.78 nm, as illustrated in Figure 1.
The Atomic Lithography Research Group at Tongji University has developed its own experimental system, enabling autonomous fabrication of self-traceable one-dimensional gratings. A schematic diagram of the experimental system is illustrated in Figure 2. A detailed description of the system can be found in [23].

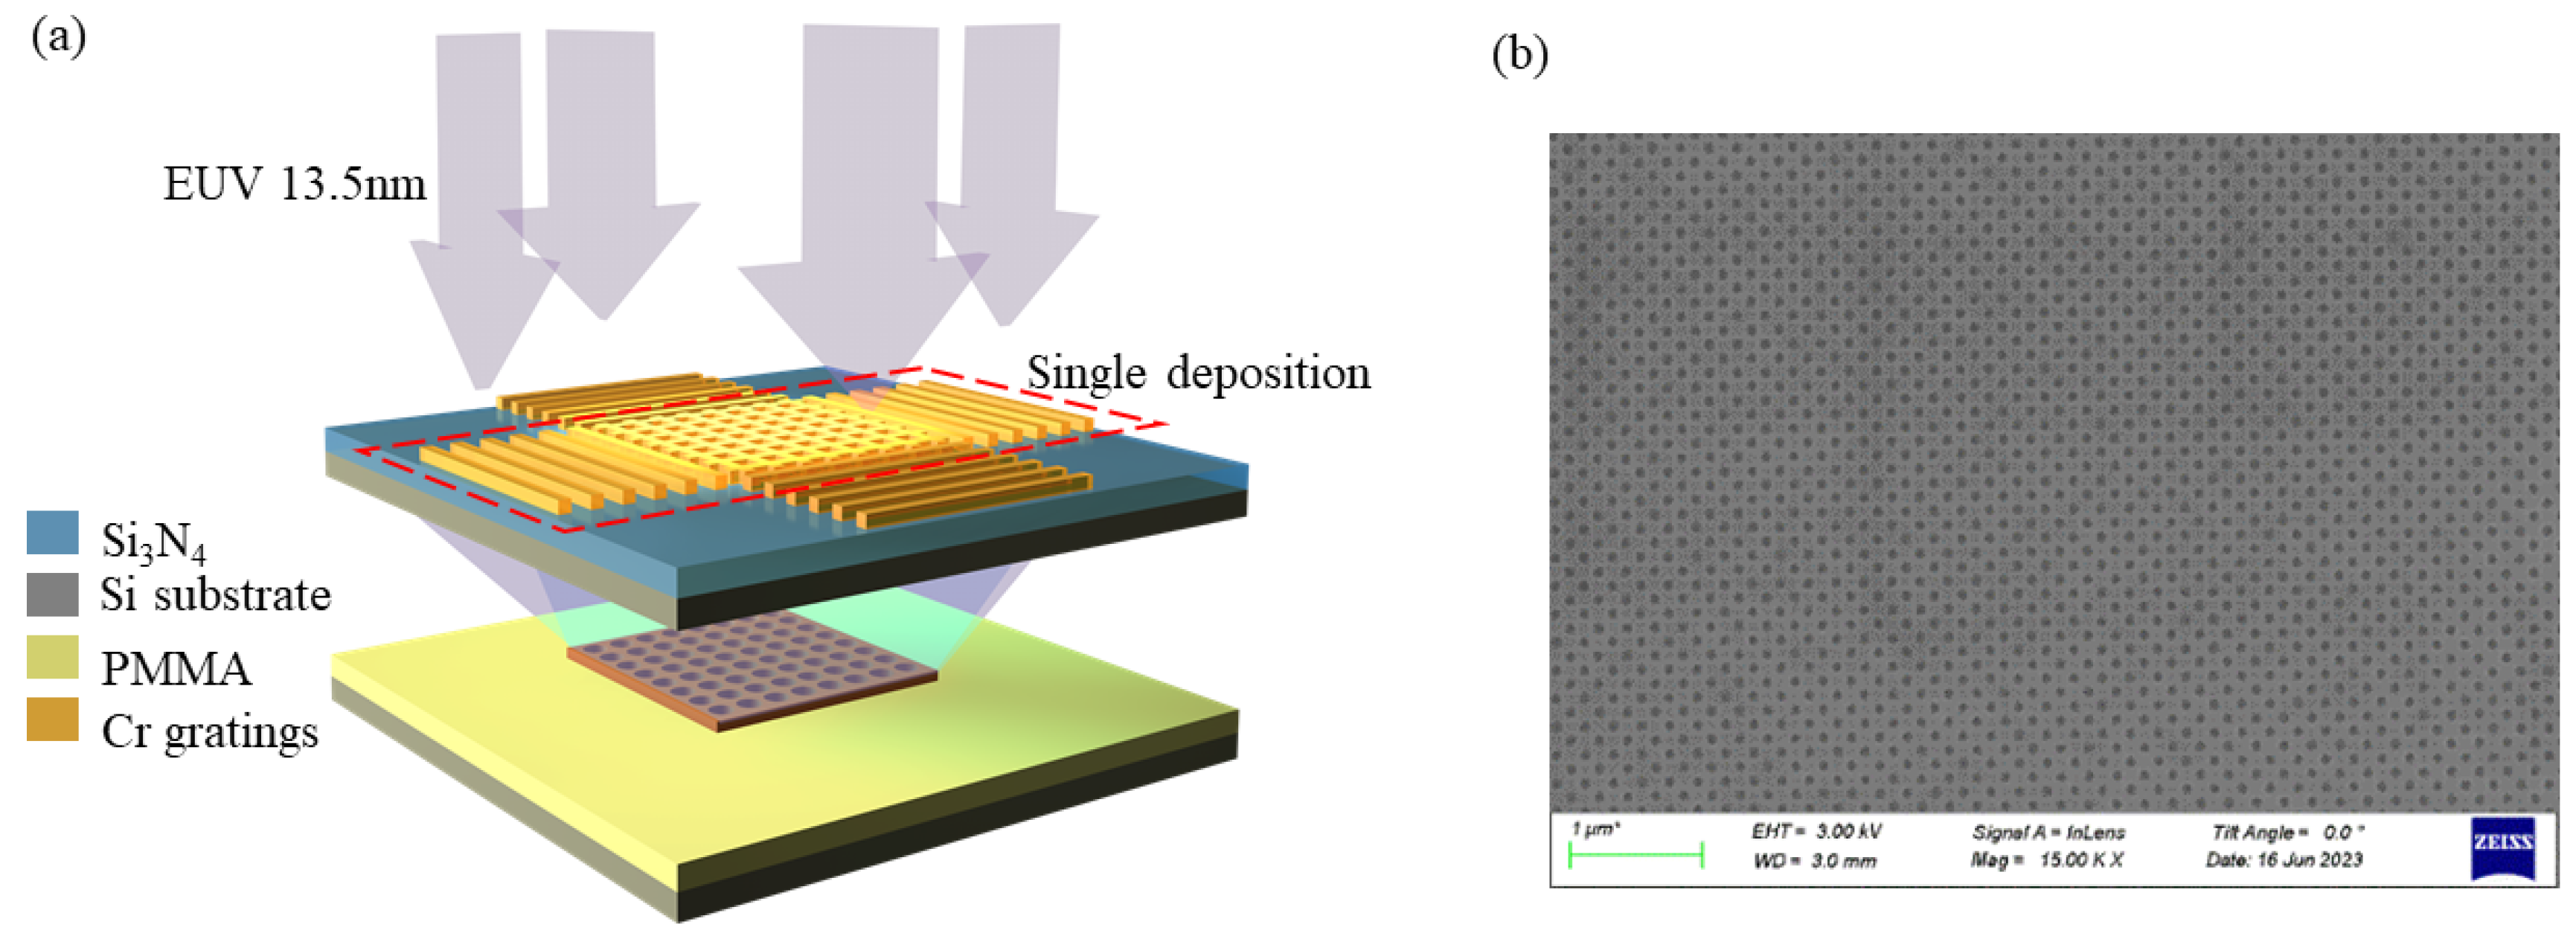
2.1.2. Extreme Ultraviolet Interference Lithography

Building upon the one-dimensional grating formed by laser-focused chromium atom deposition, we performed a secondary deposition orthogonally to create a mask. The mask comprised a film layer and a substrate. The primary materials in the film layer include silicon nitride and silicon, while the substrate primarily provides support for the film layer. Wet etching was employed to selectively remove the silicon substrate, leaving only the silicon nitride film layer intact.The remaining silicon nitride film layer is referred to as the “window” through which X-rays can pass, while the unetched substrate does not permit X-ray transmission. A schematic representation of the silicon nitride window is shown in Figure 3a.
Based on the design of the aforementioned mask substrate and film layer, uniform grating deposition was carried out along both the horizontal and vertical window alignment directions to complete the fabrication of the mask. A schematic diagram illustrating the fabrication process is provided in Figure 3b. The incident laser beam was directed perpendicularly toward the plane mirror M1, forming a standing wave field in that direction with the reflected light and thus completing the first deposition. Subsequently, the entire deposition frame was rotated by 90° within the substrate’s plane to achieve the second atomic deposition in the orthogonal direction.
After completion of mask fabrication, extreme ultraviolet (EUV) exposure was conducted at the soft X-ray interference lithography beamline of the Shanghai Synchrotron Radiation Source. As depicted in the schematic diagram below, extreme ultraviolet (EUV) light passed through the windows from the top, bottom, left, and right, forming orthogonal interference patterns beneath the mask. After prolonged exposure, a two-dimensional grating sample with a hole structure was formed on a silicon substrate. Following exposure, the grating sample underwent etching using inductively coupled plasma (ICP) etching. This method yields good verticality for the sample sidewalls. Using multiple types of plasmas (gas mixtures), nearly vertical profiles were achieved. Scanning electron microscope images of the samples after exposure and etching are shown in Figure 4 below.

2.2. Inflation Effect

The imaging process of an atomic force microscope is fundamentally an interaction between the sample and the scanning tip. When the sample size is relatively large, the scanning path of the tip approximates the surface contour of the sample. However, when the linewidth of the sample is close to the size of the tip, the tip size becomes non-negligible. The result of this interaction is the superposition of the tip and sample surface information, leading to a measurement value that is larger than the actual value of the sample. This phenomenon is referred to as the tip’s inflation effect. The schematic diagram shown in Figure 5 highlights the orange and purple portions as the inflation effect.
Accurate characterization of the scanning tip structure is crucial for correcting the inflation effect. The characterization principle of the tip characterizer is shown in Figure 5. When the scanning tip, labeled BAC, scans the sample surface, the contour information of AB is retained on the left side of the scanning profile, and similarly, that of AC is retained on the right side of the profile. By subtracting a flat profile from the top of the rectangular linewidth sample scan, we can obtain angle information from both sides of the tip. The length subtracted from the profile corresponds to the theoretical value of the linewidth. Based on this approach, the characterized tip is symmetric about the center of the tip compared with the actual tip.

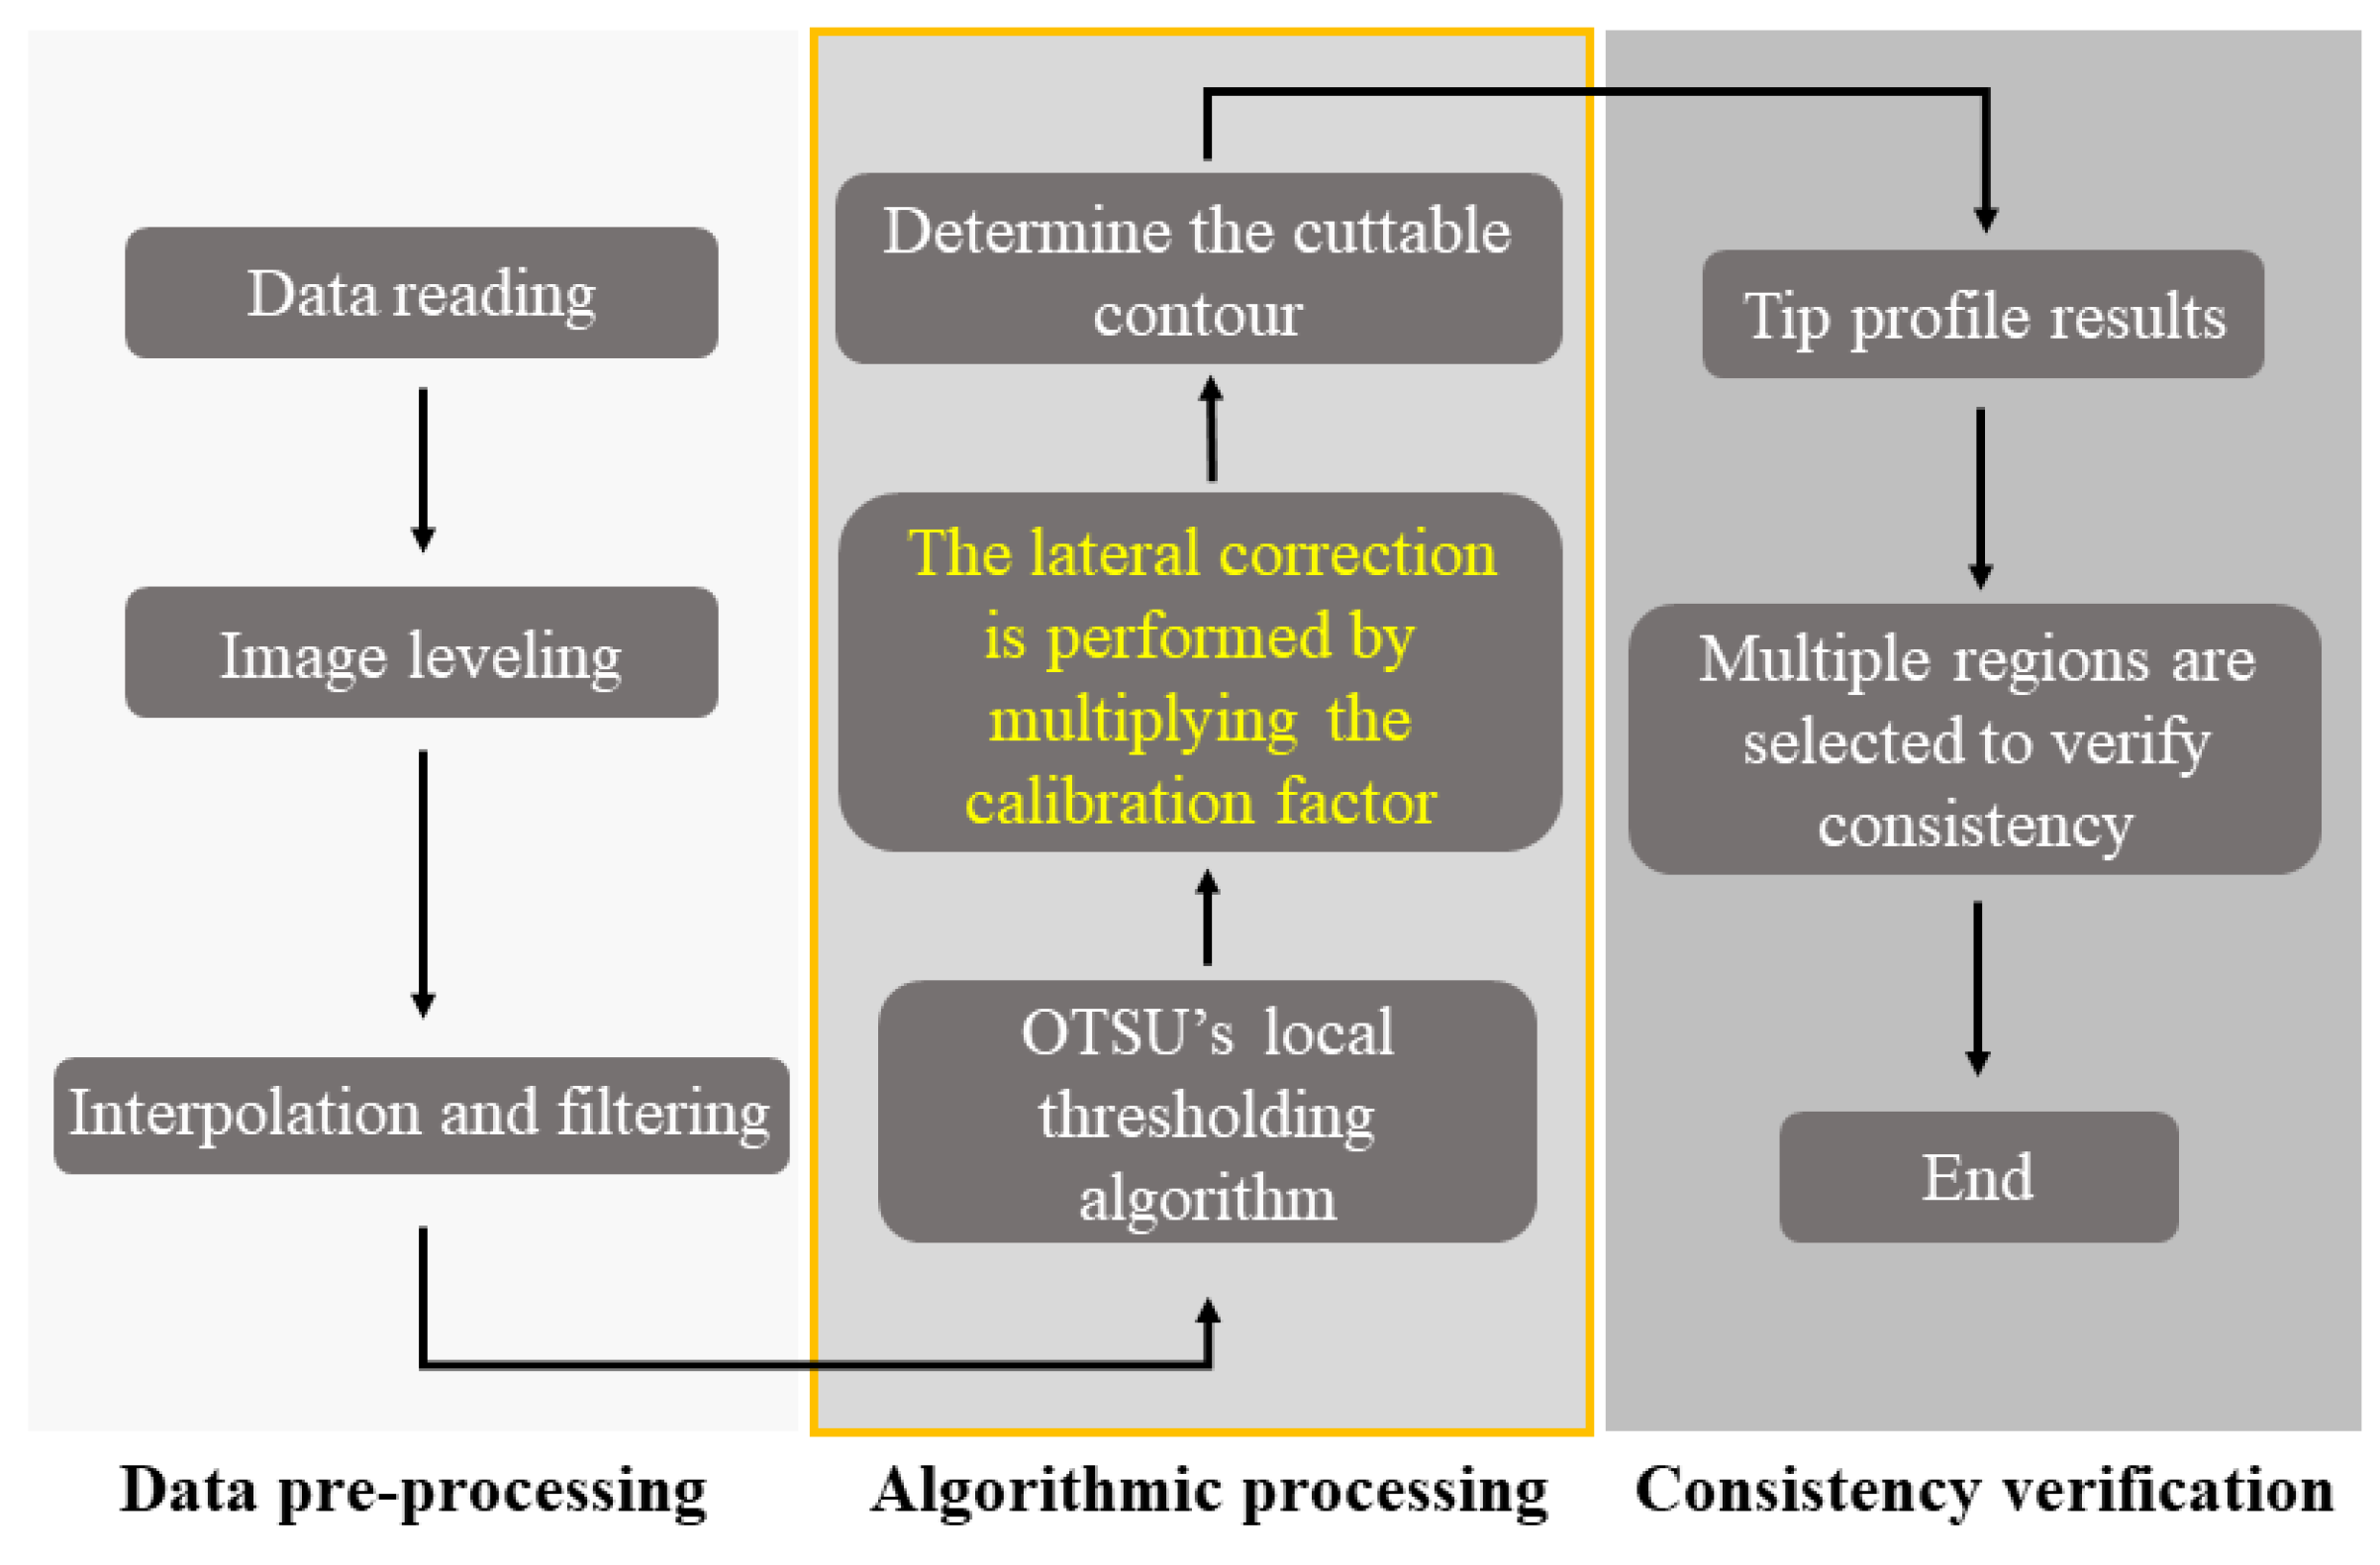
2.3. Characterization Process

The self-traceable nature of the two-dimensional grating sample’s pitch value is the core foundation of tip characterization. The distribution of holes in the grating sample is relatively uniform, and the periodic value of the contour in each frame image remains stable during scanning. This ensures that the self-traceable characteristics can be propagated backward throughout the entire scanning process.
Based on the methods described in Section 2.2, when we extract scan data from different cross-sections of the two-dimensional grating sample, we obtain scan cross-sections with varying degrees of inflation. Using different cross-sections, we employed the OTSU algorithm to automatically identify contour segments that met the cropping requirements. These identified contours were then cropped, and the cropped left and right parts were stitched together to obtain a simulated scanning probe pattern that exhibited center symmetry concerning the probe tip. It is important to note that the final representation of the scanning tip is almost unaffected in the Z direction, which corresponds to the vertical height. However, the representation of the tip in the X or Y direction may experience varying degrees of distortion due to the nonlinearity of lateral scanning in an atomic force microscope. Therefore, after the initial characterization is completed, it is essential to calibrate the entire coordinate axis based on the self-traceable periodicity of the two-dimensional grating sample. This calibration is necessary to eliminate the characterization errors introduced by lateral distortion. The specific operational details are described below.
The scanning parameters of the atomic force microscope were set to 256 × 1024 pixels, with a scanning frequency of 0.5 Hz. After importing the initial scanning data into MATLAB, it was observed that the initial scan pattern was tilted, which posed significant challenges for subsequent data processing. To address this issue, the scan pattern was leveled. The initial scanning pattern and the leveled scanning pattern are shown in Figure 6 below.
The units for both the horizontal and vertical axes are pixel counts. In the subsequent data processing steps, they would be converted to nanometer (nm)-length units based on calibration factors.
After leveling the scanning data, interpolation was performed on the data. A 1:10 ratio interpolation was applied to the horizontal axis, resulting in an interpolated scanning pattern with a pixel matrix size of 256 × 10,240. This interpolation increased the data points in the horizontal direction and enhanced the resolution and detail of the scanned image.Finally, a simple filtering process was applied. With this step, all the preprocessing procedures were completed.
For the identification of contour segments in the two-dimensional grating sample between adjacent holes, we employed the OTSU thresholding algorithm [24]. The OTSU algorithm is a commonly used thresholding method that effectively stratifies the scanning results of the two-dimensional grating sample. It converts the scanning results into a binary image and extracts the regions suitable for cropping, highlighting the structures between the holes. Subsequently, based on the self-traceable characteristics of the two-dimensional grating sample, the nonlinear effects at various AFM scanning scales were calibrated to eliminate lateral distortion errors within those scales. Finally, each tip’s scanning profile was cropped and stitched using a cropping and stitching method, resulting in the ultimate tip morphology information. The specific characterization process is illustrated in Figure 7.

3. Results

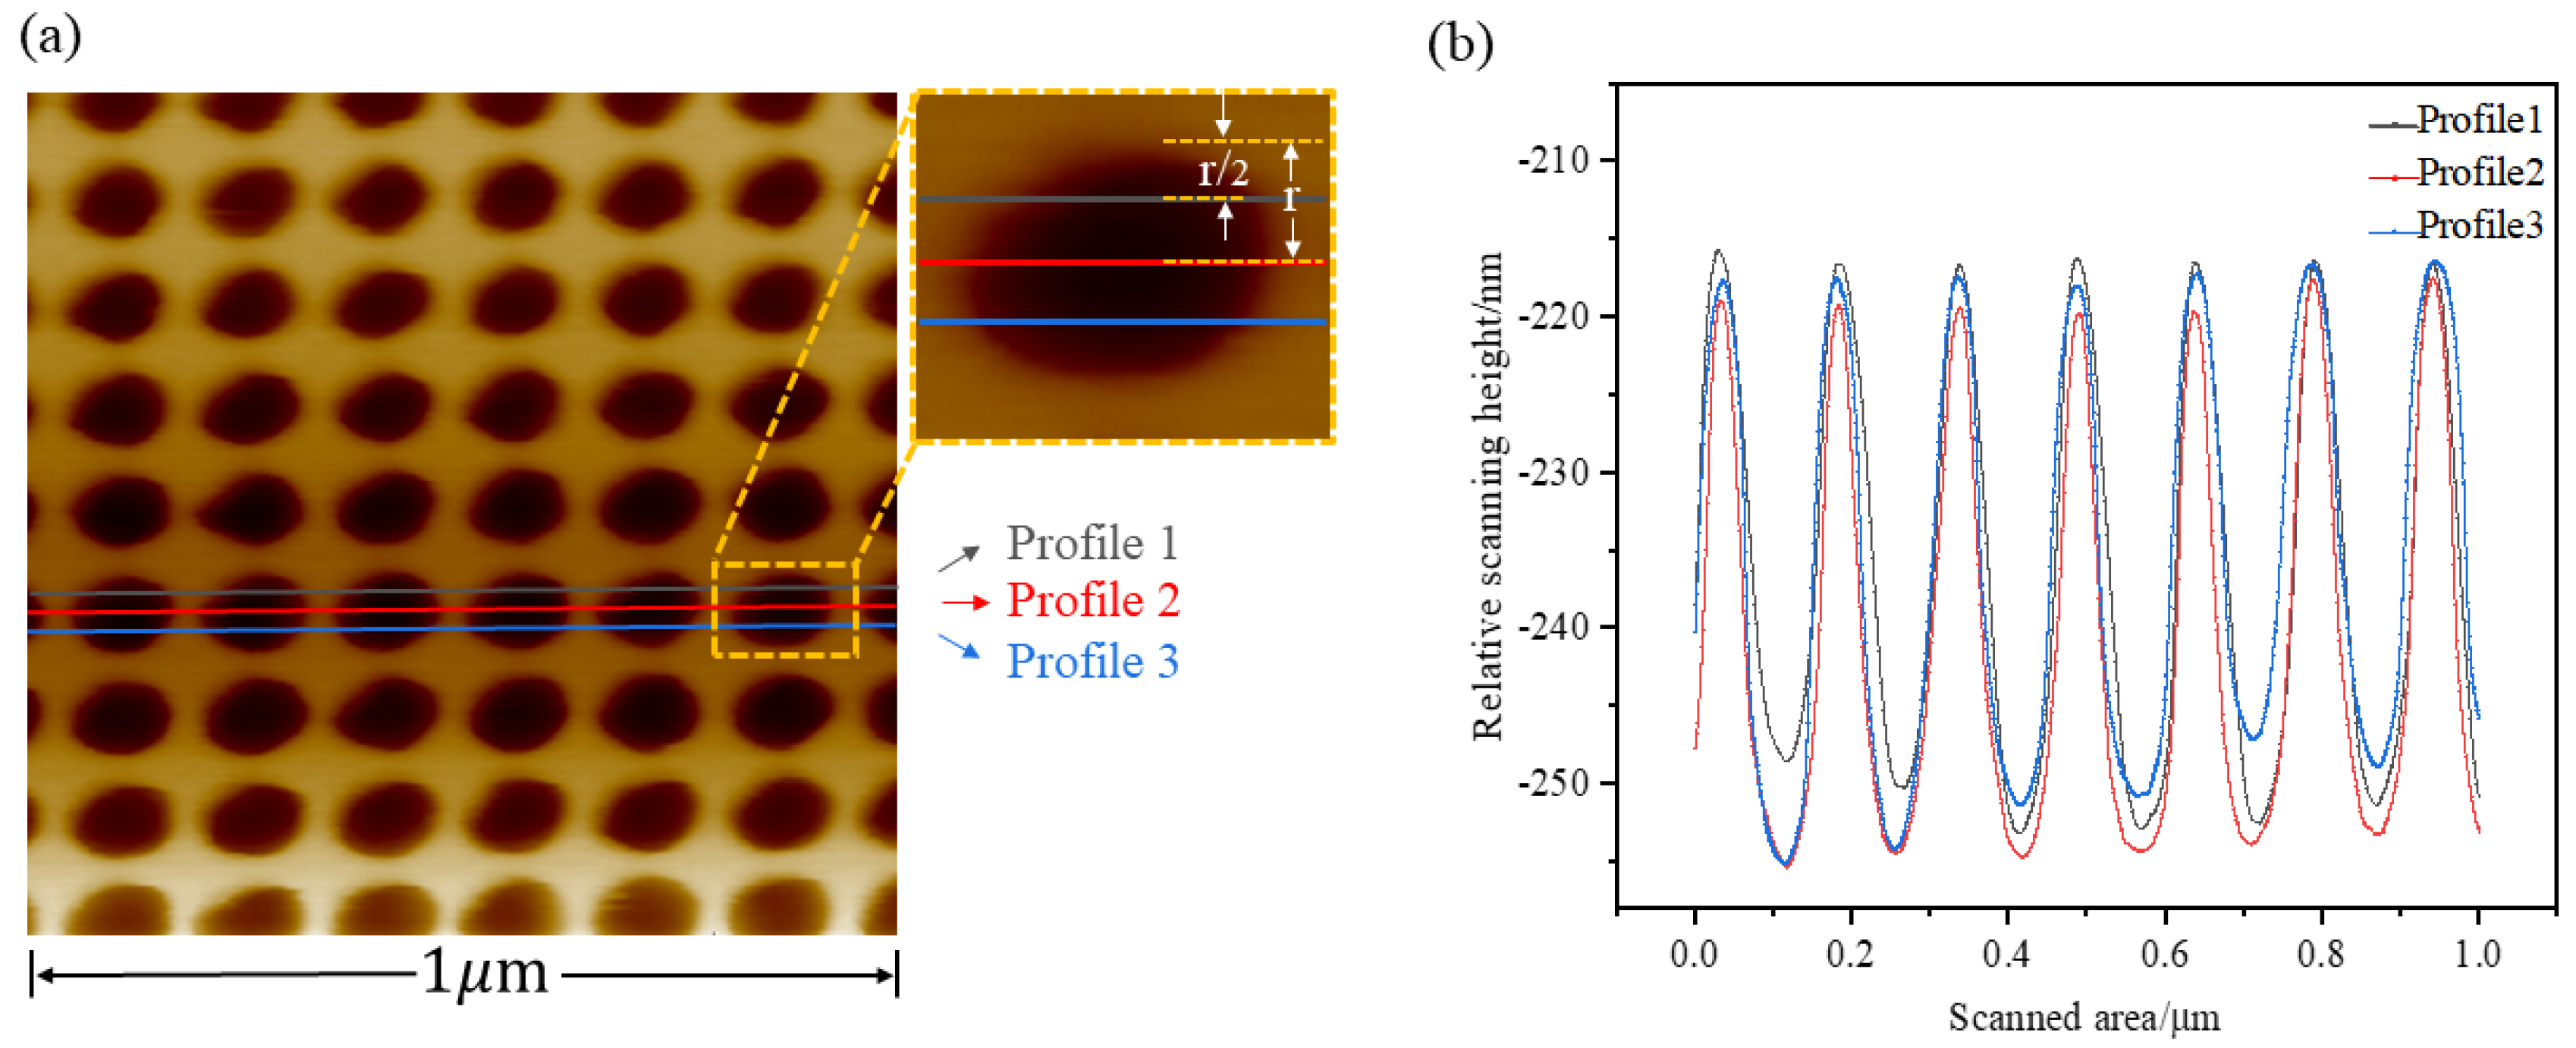
3.1. Periodic Stability Analysis of the Samples

This section validates the periodic stability of the grating sample during scanning at a 1 µm scanning scale. Starting from the middle of a hole as the initial sampling point, three scanning profiles selected horizontally at the starting point and at 1/2 the radius both above and below it were calculated for these three sampled profiles, with the average from the three being utilized as the sample’s period values within that scale, serving to calibrate the lateral distortion at a 1 µm scanning scale. Based on the grating sample fabrication process described in the third section, when the mask was perfectly vertical during preparation, the spacing of the two-dimensional grating was equal to the one-dimensional self-traceable chromium grating intercept. This intercept corresponds to the radiation wavelength of the chromium atomic transition, which was 2 / 4 times the wavelength [25], resulting in P 0 = 150.46 nm. The period calculations for the three sampled profiles within the same scale were compared, and the results of the sampled profiles are as shown in Figure 8.
After calculation, the period values for the three sampled profiles were P 1 = 151.76 nm/pixel, P 2 = 151.61 nm/pixel, and P 3 = 151.57 nm/pixel. The periodic error values between them were less than 1‰, indicating that the sample exhibited good periodic stability at this scanning scale. The scanning nonlinearity calibration factor within this scanning scale was η = ( P 1 + P 2 + P 3 ) / ( 3 × P 0 ) = 1.0079 nm/pixel. Multiple rows of hole structures were taken in the vertical scanning direction, and the calibration factor was calculated multiple times using the method shown in Figure 8. Finally, the calculated results were averaged, and the calibration factor obtained at the 1 µm scale was 1.0078 nm/pixel.

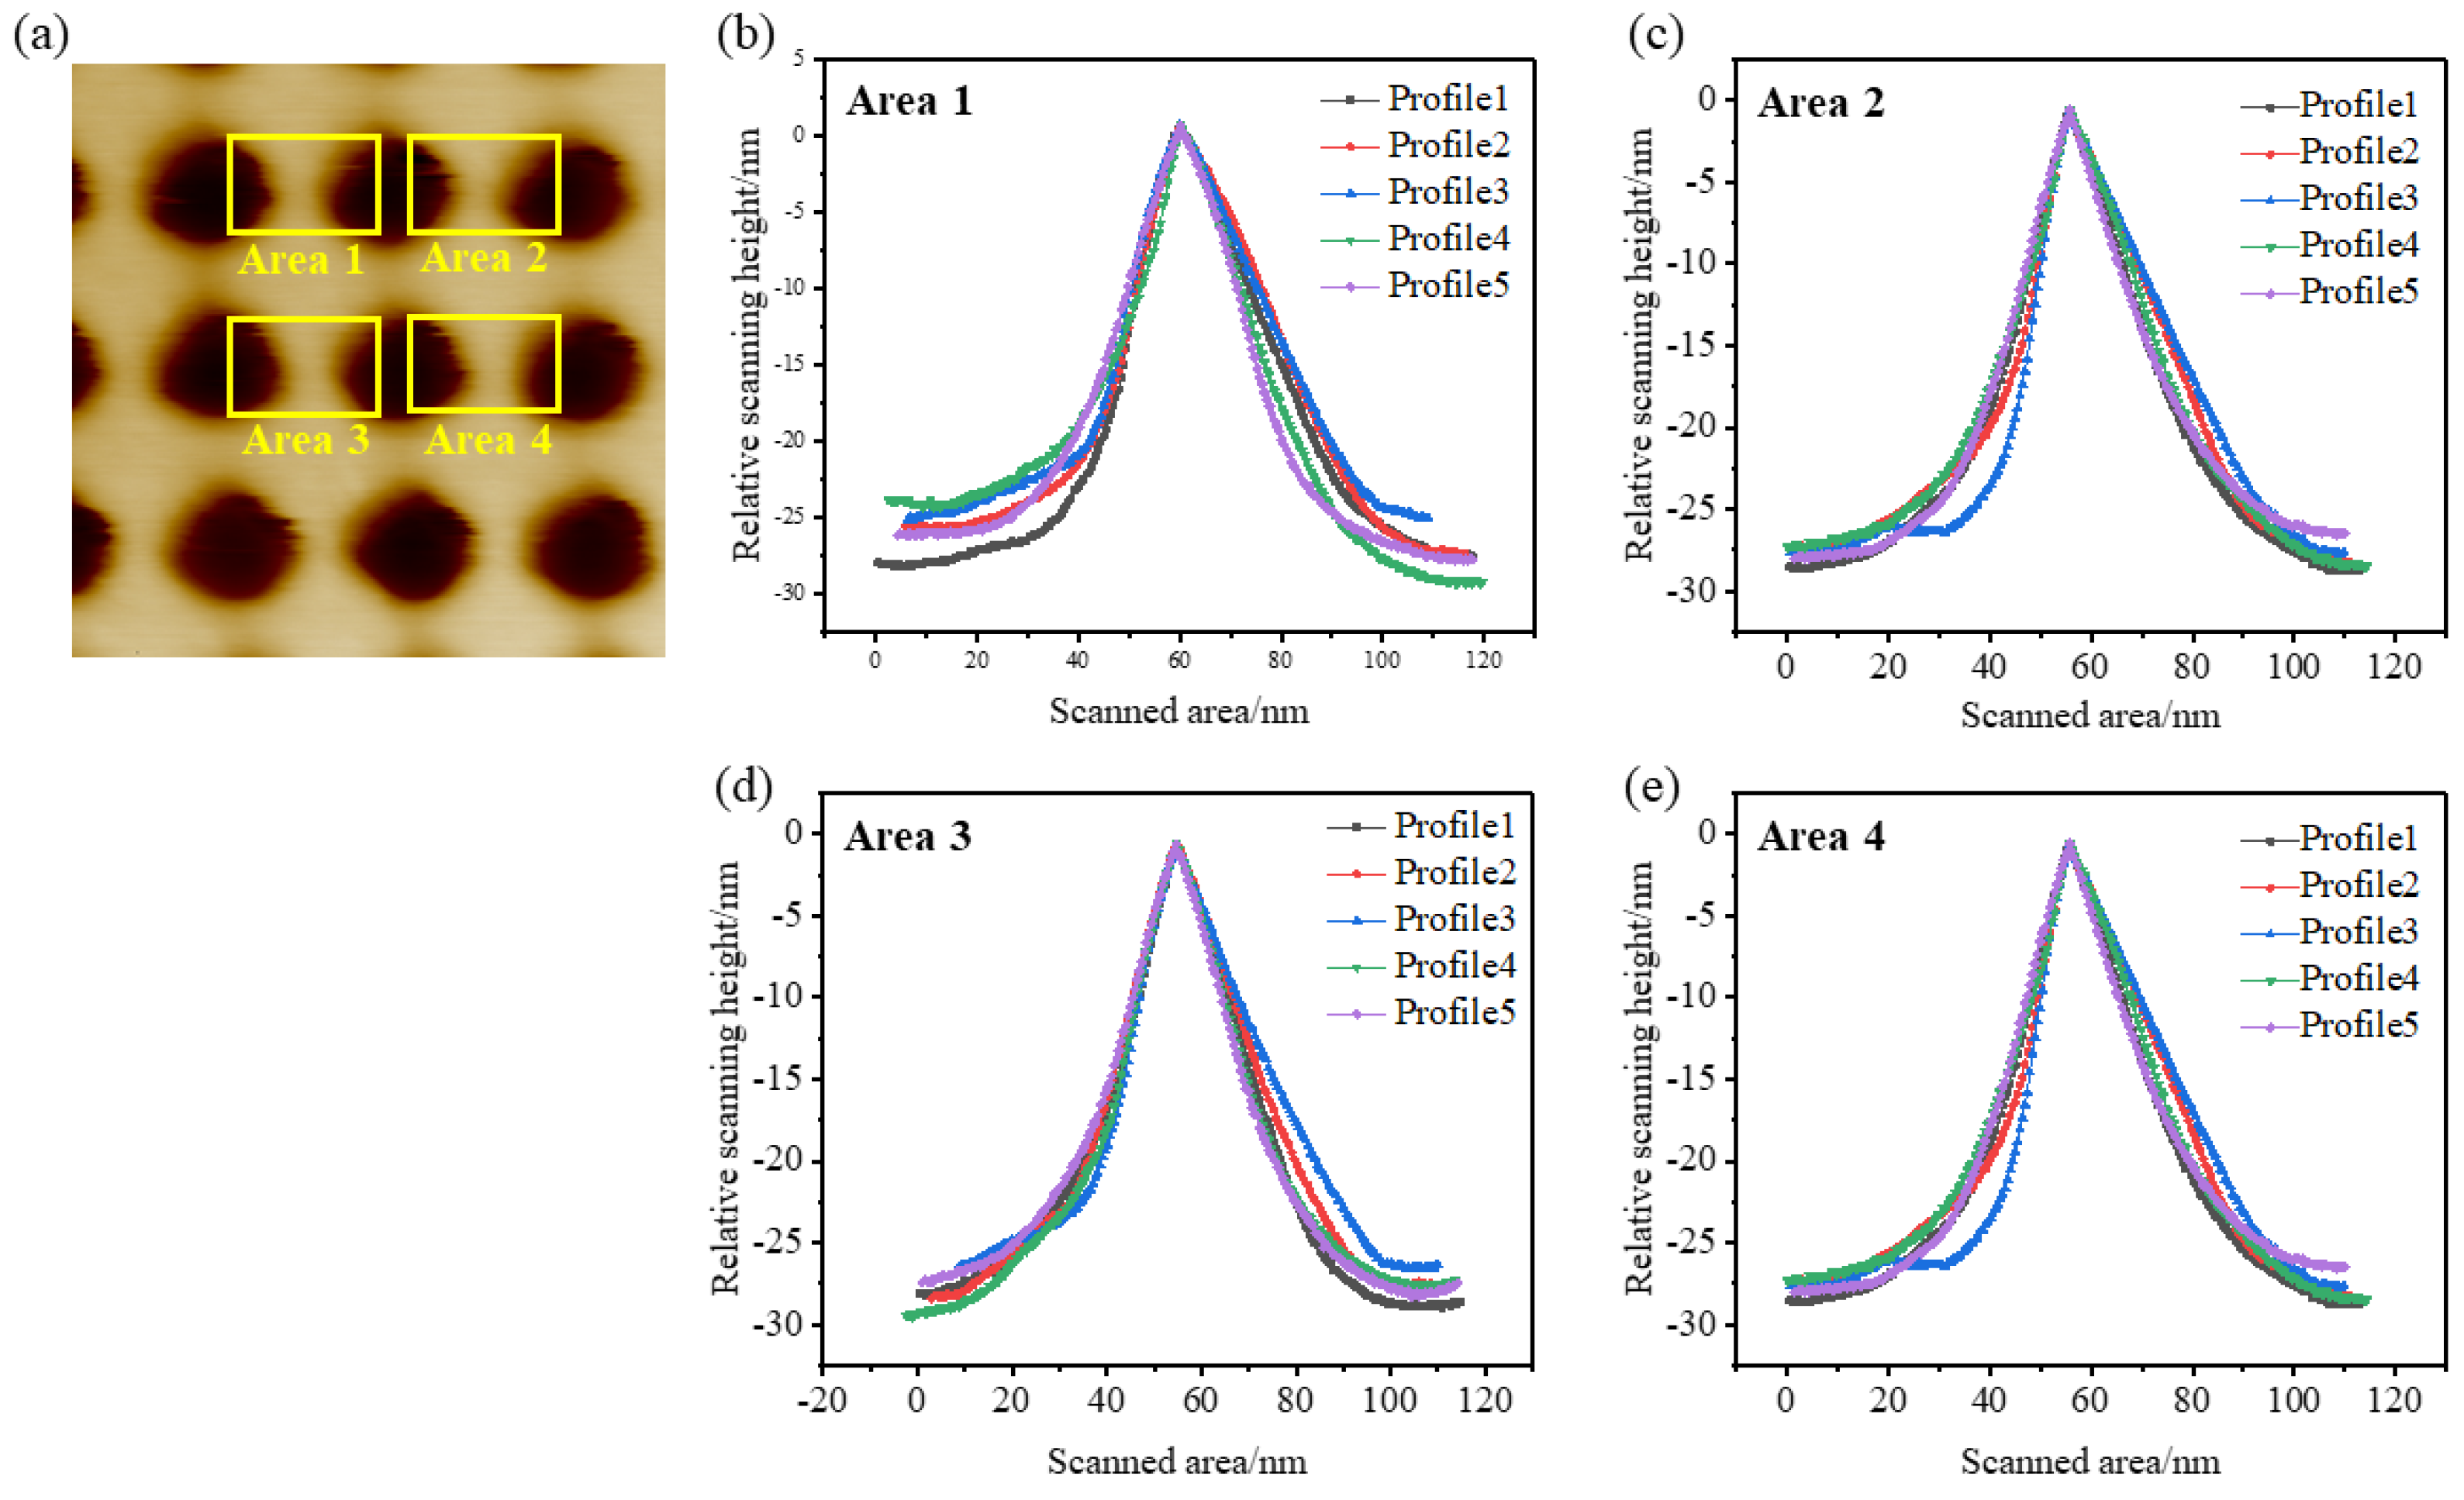
3.2. Tip Characterization Results

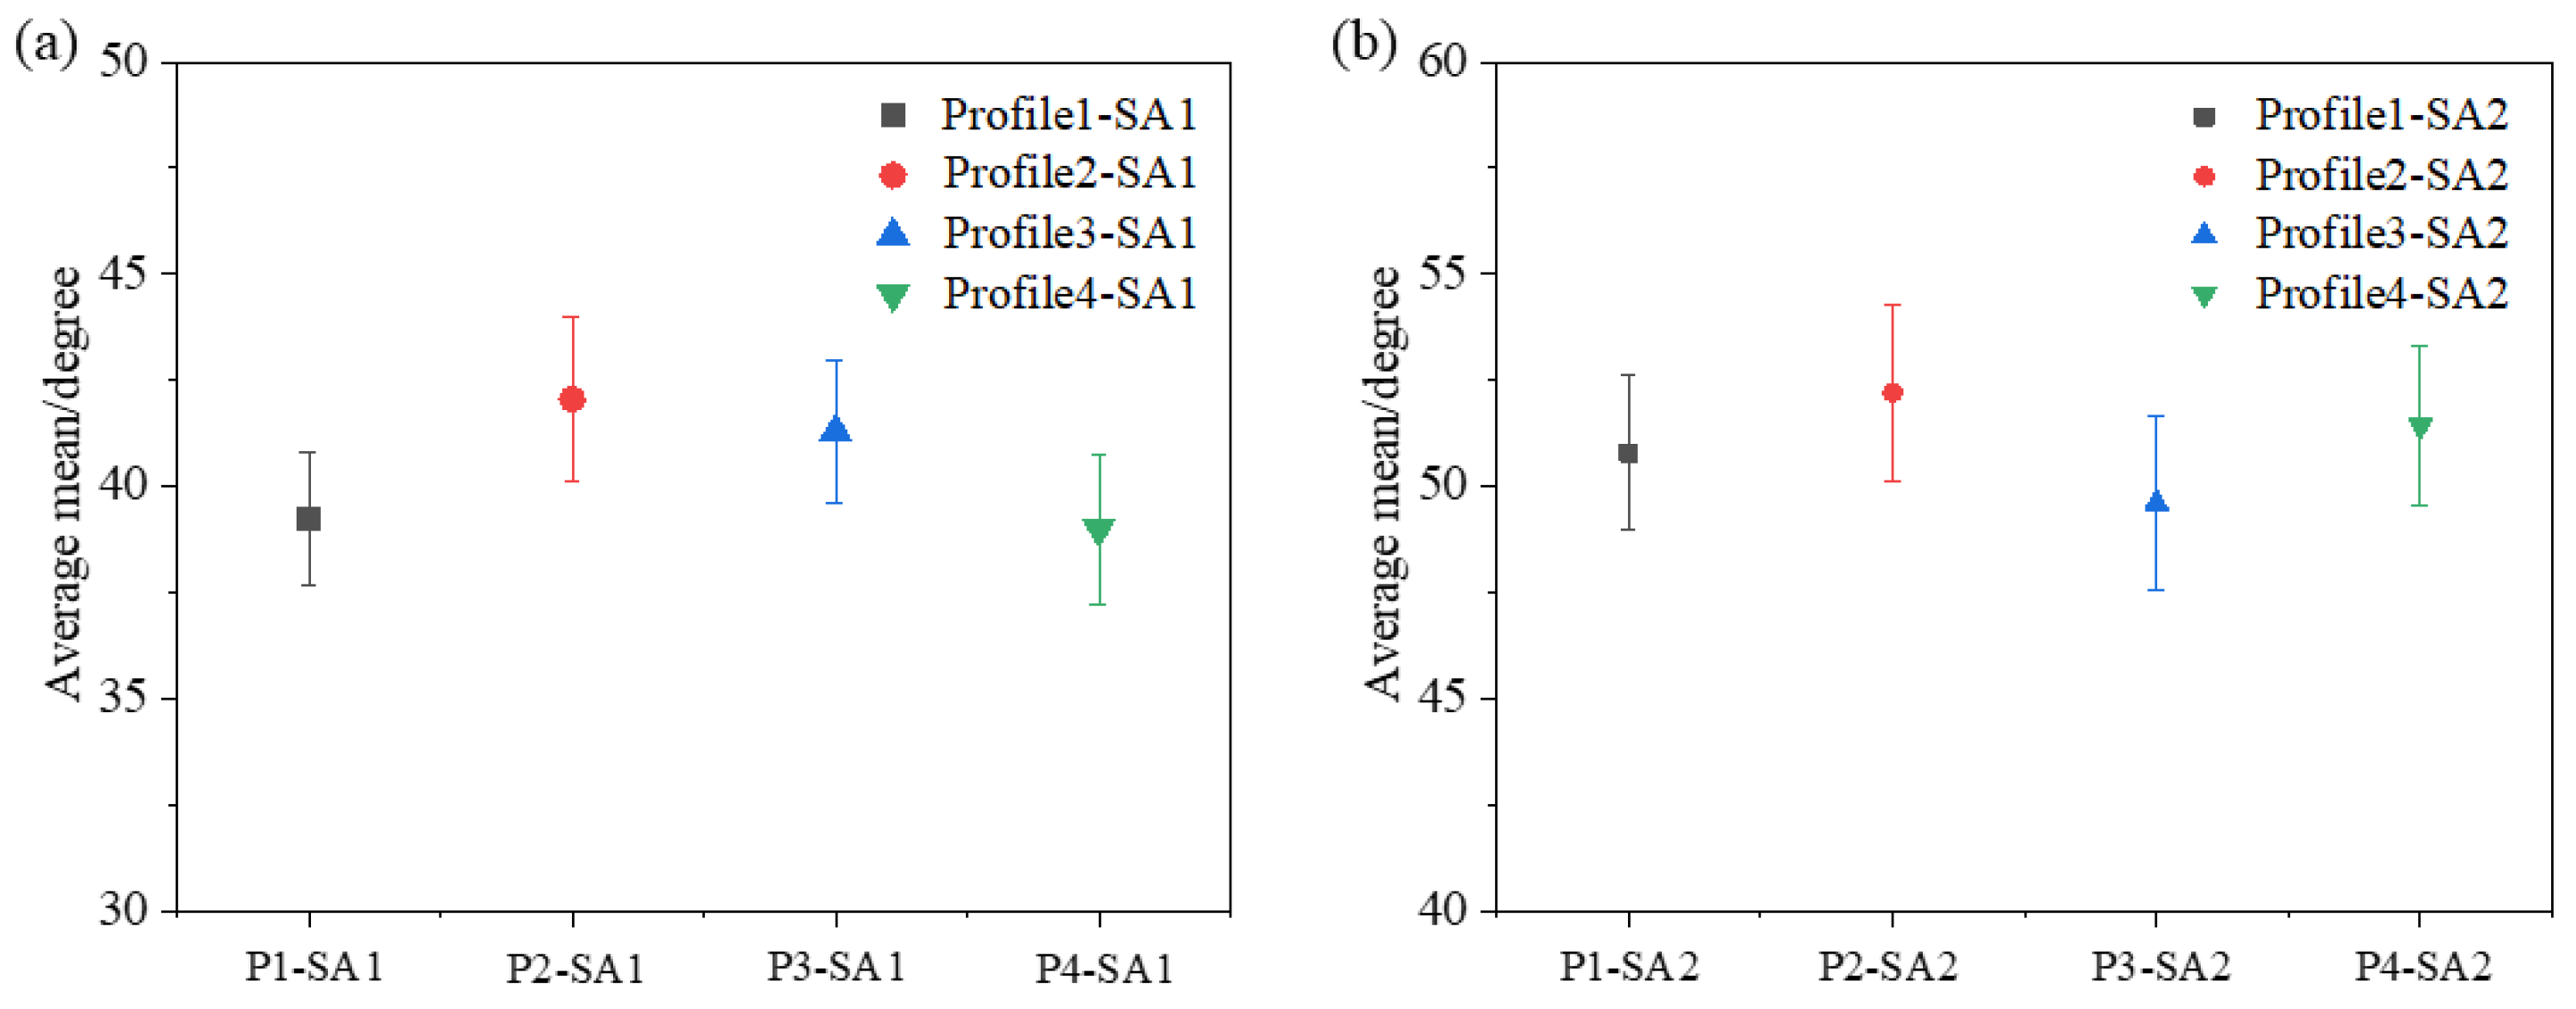
3.2.1. The Tip’s X Direction Characterizes the Results

When the scanning range was smaller, the characterization results of the hole portion were more accurate. We continued with the tip characterization work at a scanning scale of 0.5 µm. Based on the AFM lateral distortion calibration factor calculation scheme detailed in Section 3.1, we also calibrated the lateral scanning distortion of AFM within the 0.5 µm scanning scale. The schematic diagram for contour line sampling within this scale is shown in Figure 8a.
The scanning nonlinearity calibration factor within this scanning scale was calculated to be 1.0054 nm/pixel. In the subsequent tip traceability characterization process, this calibration factor would be used as the basis for correcting the lateral distortion in tip characterization.
The raised area between the two holes in the lateral direction of the two-dimensional grating sample can be regarded as a characterizer with continuously changing line width values. The tip’s X direction inclination information could be extracted from the scanning profile at this location. The extraction approach was as follows: divide the grating sample into four regions, extract the tip profile information following the characterization process in Section 2.3, and take the average of the results from each characterization point, using five tip profiles as a reference value. The final lateral information of the tip was obtained by averaging the reference values from the four regions. The characterization results for each region are shown in Figure 9c–f.
As shown in Figure 10, the characterization results for the tip’s inclination information on both sides of the X direction of the two-dimensional grating sample were consistent. The measurement data for the front and back inclinations (FA and BA, respectively) of 20 profiles from the 4 images were as follows. The average measurement value of the tip’s front inclination (FA) was approximately 41 , and the average measurement value of the back inclination (BA) was 51 , with measurement errors within ± 2 .

3.2.2. The Tip’s Y Direction Characterizes the Results

The characterization process for the tip’s Y direction was similar to that for the X direction. By keeping the sample orientation unchanged and setting the AFM scanning direction to 90°, the characterization of the tip’s Y direction could be performed in situ. The characterization results for the tip’s Y direction are shown in Figure 11.
The characterization results for the tip’s Y direction are shown in Figure 12. The measured mean values for the tip’s side tilt angle (SA) were 40 and 51 , both with measurement errors within ± 2 .

4. Discussion

In summary, the two-dimensional grating nanostructure fabricated using chromium atomic deposition and extreme ultraviolet interference lithography technology maintained excellent periodic stability during scanning. Furthermore, the grating sample had the capability to characterize the tip angle information in situ. Nonetheless, there are certain areas that require improvement in subsequent research:
(1)
Sample preservation is an urgent issue to address. Given that the primary material of the grating sample is silicon, it is prone to oxidation when exposed to air. This results in the formation of an oxide film approximately 1–2 nm thick on the surface. While the presence of an oxide layer theoretically has a minimal impact on the characterization of the tip sample, it may reduce the surface consistency of the sample and can potentially affect the periodic stability during scanning.
(2)
When AFM characterizes in the Y direction, the scanning direction of the tip results in distortion in the vertical direction after a 90° rotation, meaning that the vertical holes are no longer perpendicular. Whether this distortion, resulting from the altered scanning direction of the AFM tip, affects the lateral characterization outcomes will be a significant point of discussion in future studies.
(3)
The possibility of performing probe characterization on a two-dimensional chromium grating is worth exploring, despite the challenges posed by the non-uniform energy distribution of extreme ultraviolet (EUV) light and variations in diffraction efficiency within the grating structure. It is worth noting that the fabrication of the two-dimensional chromium grating is achieved through direct deposition, which results in minimal morphological differences between individual grating structures. Additionally, the grating exhibits self-traceable properties. Given these characteristics, the feasibility of a combined characterization of the scanning tip on both the two-dimensional chromium grating and the two-dimensional silicon grating is a topic worthy of investigation.

5. Conclusions

This paper presents the innovative fabrication technique of a novel two-dimensional grating sample using chromium atomic deposition technology and extreme ultraviolet interference lithography technology. Leveraging the self-traceable properties of the grating sample, we corrected the nonlinear errors in atomic force microscopy (AFM) scanning, analyzed the periodic consistency during the scanning process, and characterized the tilt angles in the X and Y directions of the scanning tip based on the AFM scanning results of the grating sample. The experimental results demonstrate that the two-dimensional grating sample exhibited excellent periodic accuracy during scanning. At scanning scales of 0.5 µm and 1 µm, the calibration coefficients for the AFM’s lateral distortion stood at 1.0054 nm/pixel and 1.0078 nm/pixel, respectively. The calibrated AFM provided consistent characterization results for the tip tilt angles. Within a height range of 15 nm below the tip, the tip’s forward angle (FA) was 41°, the backward angle (BA) was 51°, and the side angle (SA) was 40° and 51°, with characterization errors controlled within 2°. This study demonstrates the potential of self-traceable two-dimensional grating samples in the in situ characterization of tip data across both axes, thereby providing a solid experimental foundation for the development of new styles of tip characterizers.

Author Contributions

Conceptualization, Y.X. and X.D.; methodology, Y.X. and X.D.; software, Y.X. and J.G.; validation, X.D., L.L. and X.C.; formal analysis, X.D.; investigation, Y.X.; resources, X.D.; data curation, Z.T., J.G. and G.X.; writing—original draft preparation, Y.X.; writing—review and editing, X.D. and S.S.; visualization, S.S., Z.T. and G.X.; supervision, X.D.; project administration, X.D.; funding acquisition, X.D. All authors have read and agreed to the published version of the manuscript.

Funding

This research was funded by Special Development Funds for Major Projects of Shanghai Zhangjiang National Independent Innovation Demonstration Zone (Grant No. ZJ2021-ZD-008), the National Natural Science Foundation of China (Grant No. 62075165), the Program of Shanghai Academic Research Leader (Grant No. 21XD1425000), and the National Key Research and Development Program of China (Grant No. 2022YFF0605501).

Institutional Review Board Statement

Not applicable.

Informed Consent Statement

Not applicable.

Data Availability Statement

The data that support the findings of this study are available from the corresponding author upon reasonable request.

Conflicts of Interest

The authors declare no conflict of interest.

References

  1. Foucher, J.; Figueiro, N.G.S.; Rouxel, J.; Therese, R. Hybrid Metrology for Critical Dimension based on Scanning Methods for IC Manufacturing. In Proceedings of the Conference on Scanning Microscopies-Advanced Microscopy Technologies for Defense, Homeland Security, Forensic, Life, Environmental and Industrial Sciences, Baltimore, MD, USA, 24–26 April 2012; Volume 8378. [Google Scholar]
  2. Deng, X.; Dai, G.L.; Liu, J.; Hu, X.K.; Bergmann, D.; Zhao, J.; Tai, R.Z.; Cai, X.Y.; Li, Y.; Li, T.B.; et al. A new type of nanoscale reference grating manufactured by combined laser-focused atomic deposition and x-ray interference lithography and its use for calibrating a scanning electron microscope. Ultramicroscopy 2021, 226, 5. [Google Scholar] [CrossRef] [PubMed]
  3. Levi, S.; Schwarzband, I.; Weinberg, Y.; Cornell, R.; Adan, O.; Cohen, G.M.; Gignac, L.; Bangsaruntip, S.; Hand, S.; Osborne, J. CDSEM AFM hybrid metrology for the characterization of gate-all-around silicon nano wires. In Proceedings of the Metrology, Inspection, and Process Control for Microlithography XXVIII, San Jose, CA, USA, 24–27 February 2014. [Google Scholar]
  4. Orji, N.G.; Itoh, H.; Wang, C.; Dixson, R.G.; Walecki, P.S.; Schmid, S.W.; Irmer, B. Tip characterization method using multi-feature characterizer for CD-AFM. Ultramicroscopy 2016, 162, 25–34. [Google Scholar] [CrossRef] [PubMed]
  5. Thiesler, J.; Tutsch, R.; Fromm, K.; Dai, G.L. True 3D-AFM sensor for nanometrology. Meas. Sci. Technol. 2020, 31, 11. [Google Scholar] [CrossRef]
  6. Orji, N.G.; Badaroglu, M.; Barnes, B.M.; Beitia, C.; Bunday, B.D.; Celano, U.; Kline, R.J.; Neisser, M.; Obeng, Y.; Vladar, A.E. Metrology for the next generation of semiconductor devices (vol 1, pg 532, 2018). Nat. Electron. 2018, 1, 662. [Google Scholar] [CrossRef]
  7. Yamaguchi, A.; Steffen, R.; Kawada, H.; Iizumi, T. Bias-free measurement of LER/LWR with low damage by CD-SEM. In Proceedings of the Conference on Metrology, Inspection, and Process Control for Microlithography XX, San Jose, CA, USA, 19–24 February 2006; Volume 6152. [Google Scholar]
  8. Dai, G.L.; Zhu, F.; Heidelmann, M.; Fritz, G.; Bayer, T.; Kalt, S.; Fluegge, J. Development and characterisation of a new line width reference material. Meas. Sci. Technol. 2015, 26, 115006. [Google Scholar] [CrossRef]
  9. Takamasu, K.; Okitou, H.; Takahashi, S.; Konno, M.; Inoue, O.; Kawada, H. Sub-nanometer line width and line profile measurement for CD-SEM calibration by using STEM. In Proceedings of the Conference on Metrology, Inspection, and Process Control for Microlithography XXV, San Jose, CA, USA, 28 February–3 March 2011; Volume 7971. [Google Scholar]
  10. Takamasu, K.; Okitou, H.; Takahashi, S.; Konno, M.; Inoue, O.; Kawada, H. Sub-nanometer calibration of line width measurement and line edge detection by using STEM and sectional SEM. In Proceedings of the Conference on Metrology, Inspection, and Process Control for Microlithography XXVI, San Jose, CA, USA, 13–16 February 2012; Volume 8324. [Google Scholar]
  11. Mingxia, H.; Yan, M. Simulation of surface reconstruction of the one-dimensional rectangle grating AFM images by blind reconstructed tip. Opt. Instrum. 2018, 40, 52–59. [Google Scholar]
  12. Villarrubia, J.S. Algorithms for scanned probe microscope image simulation, surface reconstruction, and tip estimation. J. Res. Natl. Inst. Stand. Technol. 1997, 102, 425–454. [Google Scholar] [CrossRef] [PubMed]
  13. Ziruo, W.; Yanni, C.; Xingrui, W.; Longfei, Z.; Xiao, D.; Xinbin, C.; Tongbao, L. Investigation of AFM tip characterization based on multilayer gratings. Infrared Laser Eng. 2020, 49, 229–234. [Google Scholar] [CrossRef]
  14. Dai, G.L.; Xu, L.Y.; Hahm, K. Accurate tip characterization in critical dimension atomic force microscopy. Meas. Sci. Technol. 2020, 31, 12. [Google Scholar] [CrossRef]
  15. Dai, G.L.; Hahm, K.; Bosse, H.; Dixson, R.G. Comparison of line width calibration using critical dimension atomic force microscopes between PTB and NIST. Meas. Sci. Technol. 2017, 28, 12. [Google Scholar] [CrossRef]
  16. Dixson, R.G.; Allen, R.A.; Guthrie, W.F.; Cresswell, M.W. Traceable calibration of critical-dimension atomic force microscope linewidth measurements with nanometer uncertainty. J. Vac. Sci. Technol. B 2005, 23, 3028–3032. [Google Scholar] [CrossRef]
  17. Kwak, G.Y.; Chang, H.J.; Na, M.Y.; Ryu, S.K.; Kim, T.G.; Woo, J.C.; Kim, K.J. Calibration of high magnification in the measurement of critical dimension by AFM and SEM. Appl. Surf. Sci. 2021, 565, 150481. [Google Scholar] [CrossRef]
  18. Wei, L.; Yushu, S.; Qi, L.; Lu, H.; Shi, L.; Sitian, G. Progress and Application on the Measurement Technique of Single Crystal Silicon Lattice Spacing. J. Synth. Cryst. 2021, 50, 151–157+178. [Google Scholar]
  19. Cai, Y.N.; Deng, X.; Wang, X.P.; Yang, F. The effects of thermocompression bonding on Si/SiO2 multilayer thin-film based critical dimension structures. In Proceedings of the International Conference on Optoelectronic and Microelectronic Technology and Application, Nanjing, China, 20–22 October 2020; Volume 11617. [Google Scholar]
  20. Wu, Z.; Cai, Y.; Wang, X.; Zhang, L.; Deng, X.; Cheng, X.; Li, T. Amorphous Si critical dimension structures with direct Si lattice calibration. Chin. Phys. B 2019, 28, 030601. [Google Scholar] [CrossRef]
  21. Tang, Z.; Zhao, J.; Deng, X.; Tan, W.; Wu, Y.; Tai, R.; Cheng, X.; Li, T. Fabrication of 53.2 nm pitch self-traceable gratings by laser-focused atomic deposition combined with extreme ultraviolet interference lithography. Optik 2023, 279, 170735. [Google Scholar] [CrossRef]
  22. Tan, W.; Tang, Z.; Xiao, G.; Yao, Y.; Lei, L.; Li, Q.; Jin, T.; Deng, X.; Cheng, X.; Li, T. Calibrate the non-orthogonal error of AFM with two-dimensional self-traceable grating. Ultramicroscopy 2023, 249, 113734. [Google Scholar] [CrossRef] [PubMed]
  23. Deng, X.; Tan, W.; Tang, Z.; Lin, Z.; Cheng, X.; Li, T. Scanning and Splicing Atom Lithography for Self-traceable Nanograting Fabrication. Nanomanuf. Metrol. 2022, 5, 179–187. [Google Scholar] [CrossRef]
  24. Bhandari, A.K.; Kumar, A.; Singh, G.K. Modified artificial bee colony based computationally efficient multilevel thresholding for satellite image segmentation using Kapur’s, Otsu and Tsallis functions. Expert Syst. Appl. 2015, 42, 1573–1601. [Google Scholar] [CrossRef]
  25. Tang, Z.; Zhao, J.; Deng, X.; Xiao, G.; Yin, Z.; Wu, Y.; Tai, R.; Cheng, X.; Li, T. Two-dimensional sub-200 nm pitch Si gratings with natural orthogonality. Appl. Phys. Express 2023, 16, 106501. [Google Scholar] [CrossRef]
Figure 1. Schematic of one-dimensional chromium atomic deposition grating preparation.
Photonics 10 01272 g001
Figure 2. One-dimensional chromium atomic deposition system schematic. A detailed description of the system’s principle and optical path can be found in [2].
Photonics 10 01272 g002
Figure 3. Schematic diagram of the mask. (a) Schematic diagram of silicon nitride window preparation. The blue part represents the silicon substrate, while the membrane layer is made of silicon nitride. The structure after wet etching of the substrate is referred to as the window. (b) Illustration of the mask preparation process. After primary deposition, the substrate and the deposition frame are rotated 90 degrees within the plane of the substrate for the secondary deposition. The region where the two depositions overlap creates a two-dimensional grating.
Photonics 10 01272 g003
Figure 4. Schematic of 2D grating sample preparation. (a) Schematic of EUV exposure. (b) SEM scan pattern of sample.
Photonics 10 01272 g004
Figure 5. Schematic diagram of the inflation effect. The orange and purple areas represent inflation regions, and their boundaries correspond to the left and right contours of the tip, respectively. The horizontal plane on the upper surface of the sample is not affected by the inflation effect.
Photonics 10 01272 g005
Figure 6. The scanning patterns of the two-dimensional nano-grating sample at a 0.5 µm scale. (a) The initial scanning result. (b) The leveled scanning result.
Photonics 10 01272 g006
Figure 7. Schematic diagram of the specific process of tip characterization. The entire process is divided into data preprocessing, algorithm processing, and consistency verification.
Photonics 10 01272 g007
Figure 8. (a) Schematic of sampling profile. The three sampling profiles are the central plumb (in red), the plumb located r/2 above the central plumb (in dark green), and the plumb situated r/2 below the central plumb (in blue) of the hole. (b) Sampling profile scan.
Photonics 10 01272 g008
Figure 9. Schematic of scanning tip sampling in X direction and characterization results. (a) Sample collection for 0.5 µm scale lateral distortion correction. (b) Schematic of sampling for X direction tilt information characterization of scanning tip. (cf) Results of tip’s X direction tilt characterization in areas 1–4, respectively.
Photonics 10 01272 g009
Figure 10. Scanning tip’s X direction characterization result error plots. (a) Front angle error plot. (b) Back angle error plot.
Photonics 10 01272 g010
Figure 11. Scanning tip’s Y direction characterization result error plots. (a) Schematic of sampling for Y direction tilt information characterization of scanning tip. (be) Results for tip’s Y direction tilt characterization in areas 1–4, respectively.
Photonics 10 01272 g011
Figure 12. Scanning tip’s Y direction characterization result error plots. (a) Side angle 1 error plot. (b) Side angle 2 error plot.
Photonics 10 01272 g012
Disclaimer/Publisher’s Note: The statements, opinions and data contained in all publications are solely those of the individual author(s) and contributor(s) and not of MDPI and/or the editor(s). MDPI and/or the editor(s) disclaim responsibility for any injury to people or property resulting from any ideas, methods, instructions or products referred to in the content.

