Upscaling Customer Access Network Using Spectrum Conversion–Slicing–Duplication Technique

 , and
, and
Abstract
:1. Introduction
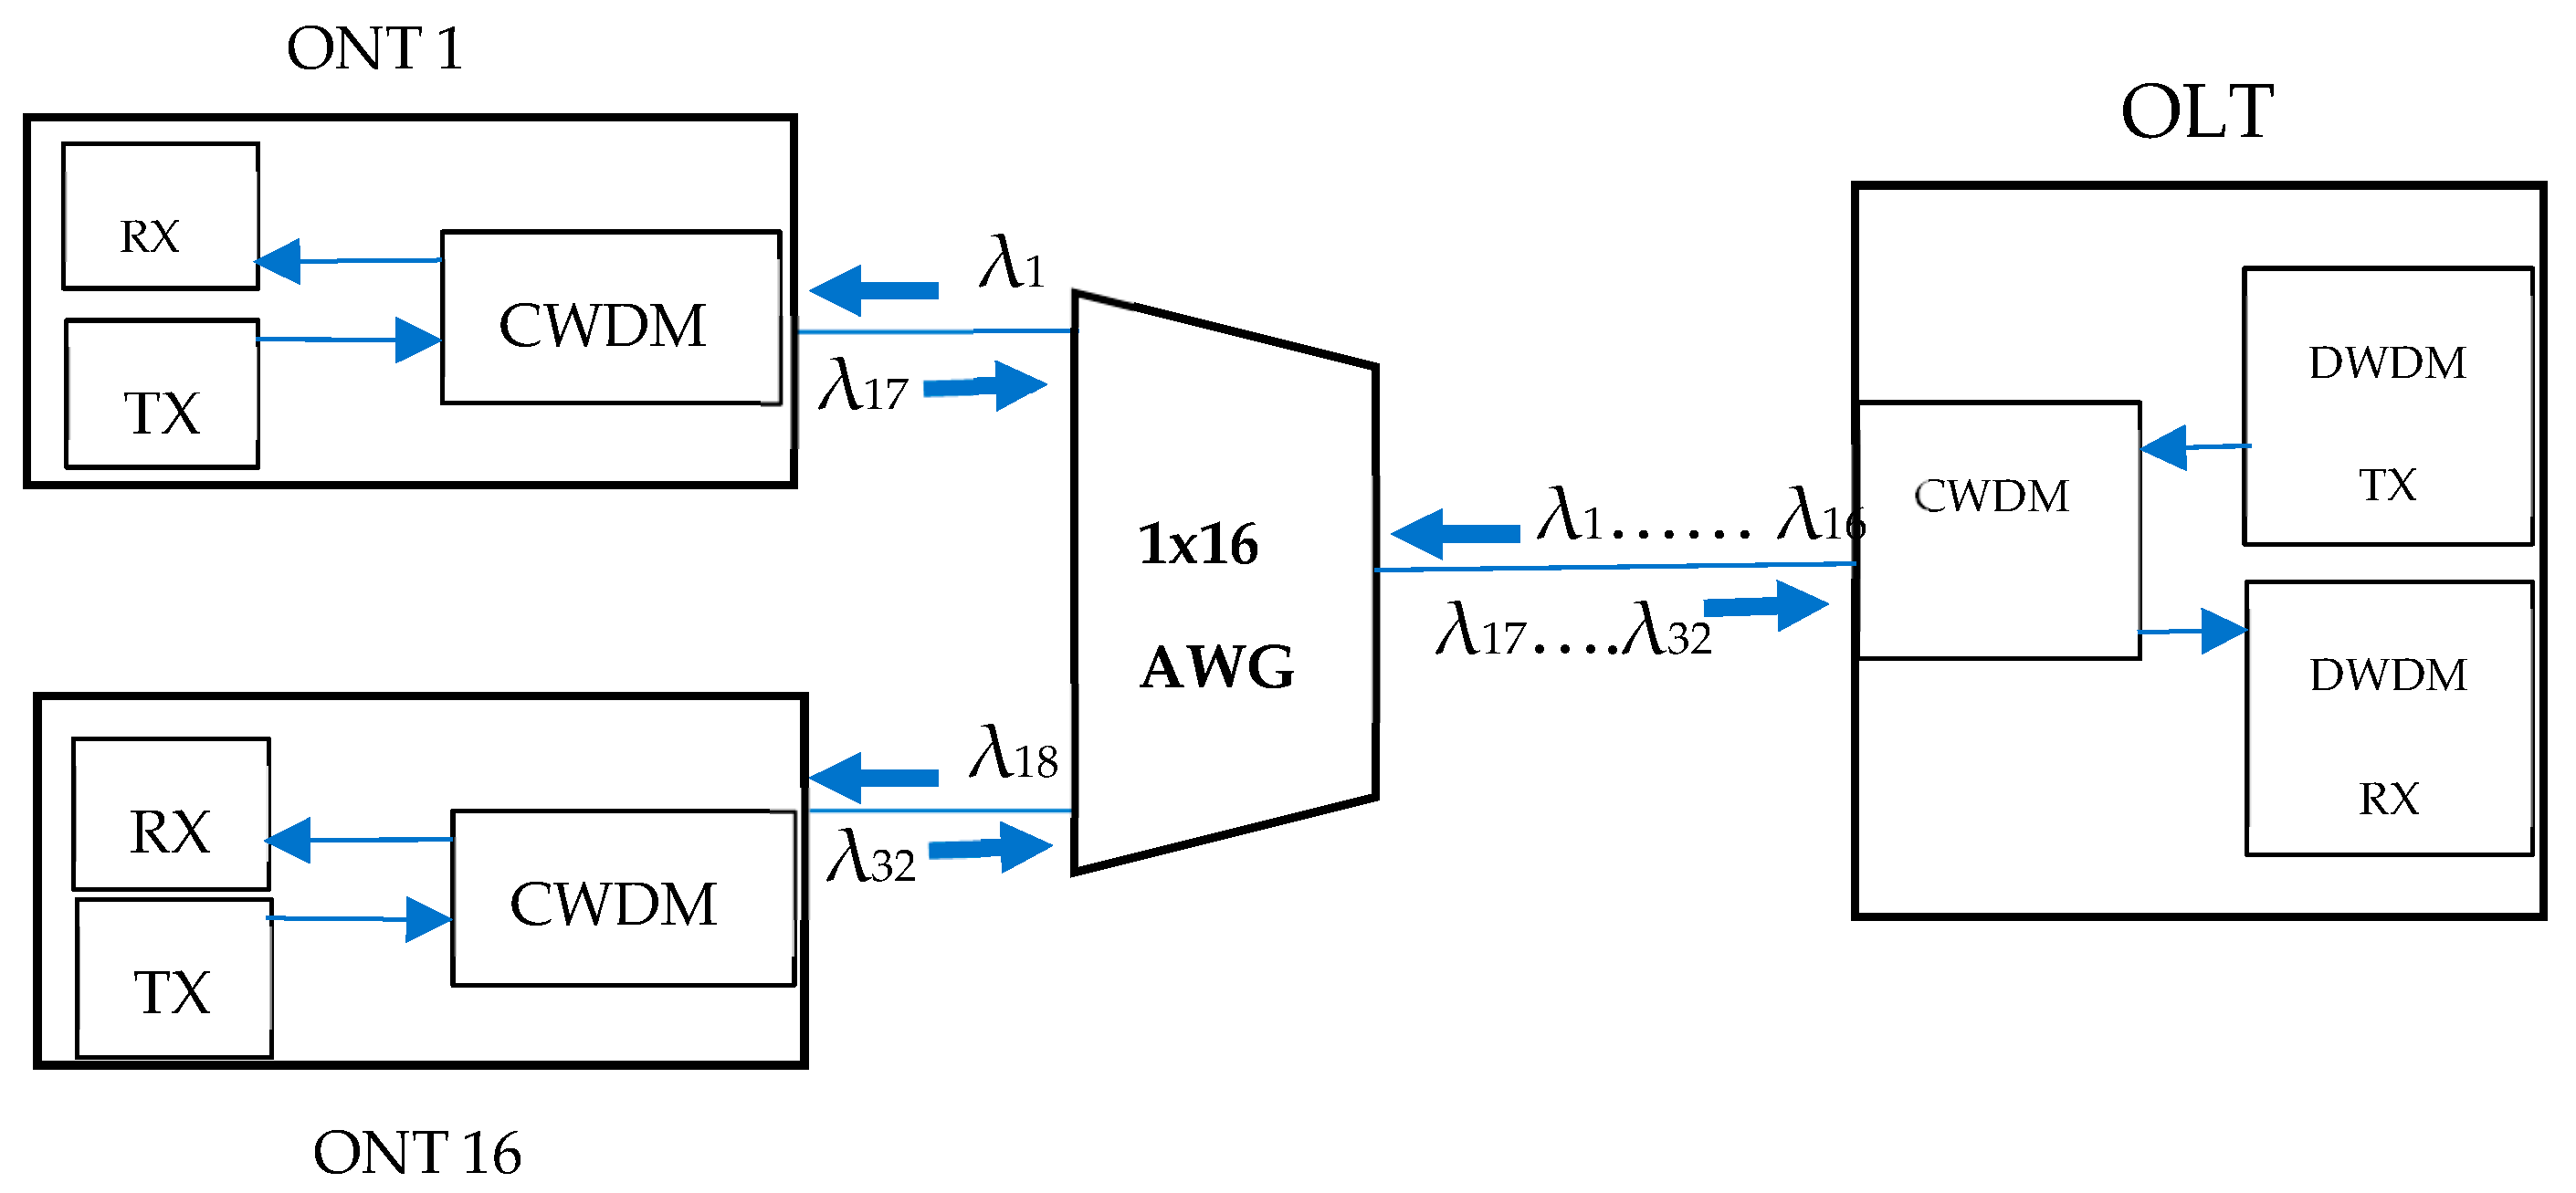
1.1. AWG-Based Technique
1.2. EDFA-Based Technique
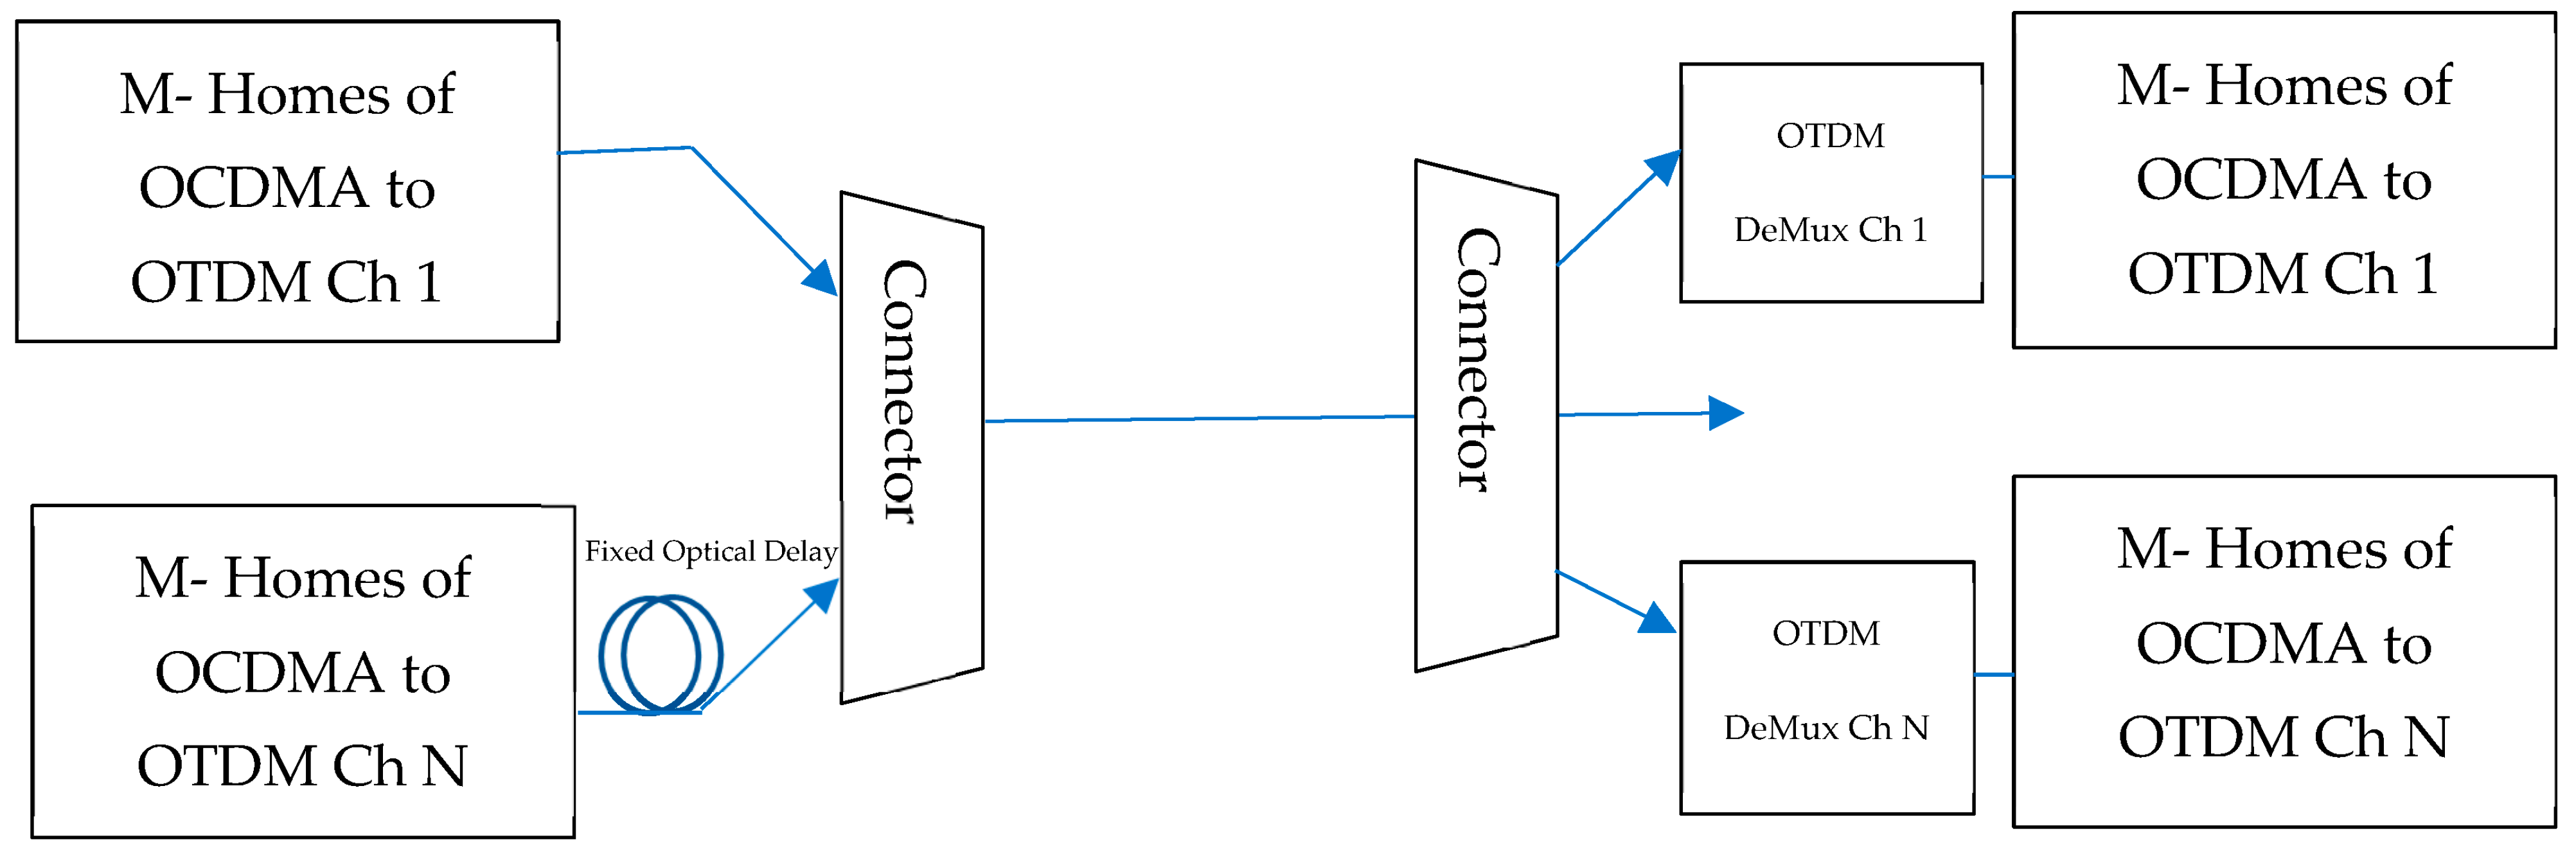
1.3. Hybrid System—OCDMA
1.4. Hybrid System—10G-TDM-OCDMA-PON
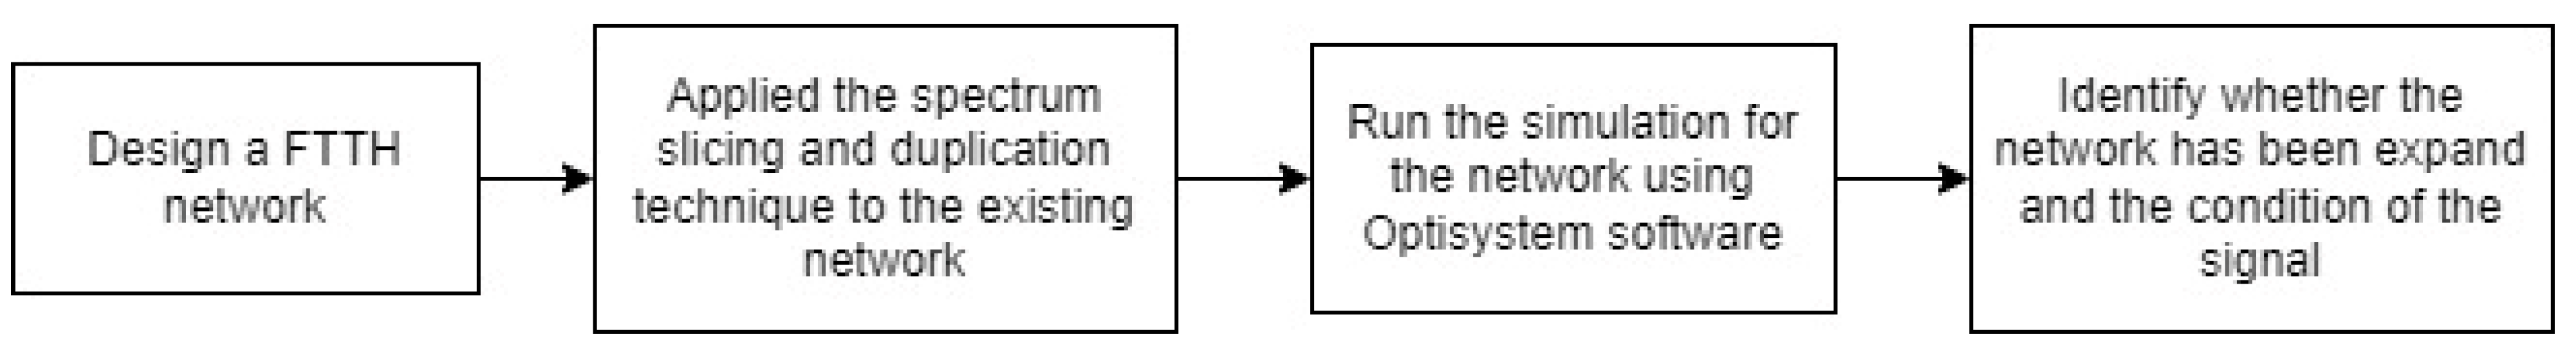
2. Methodology
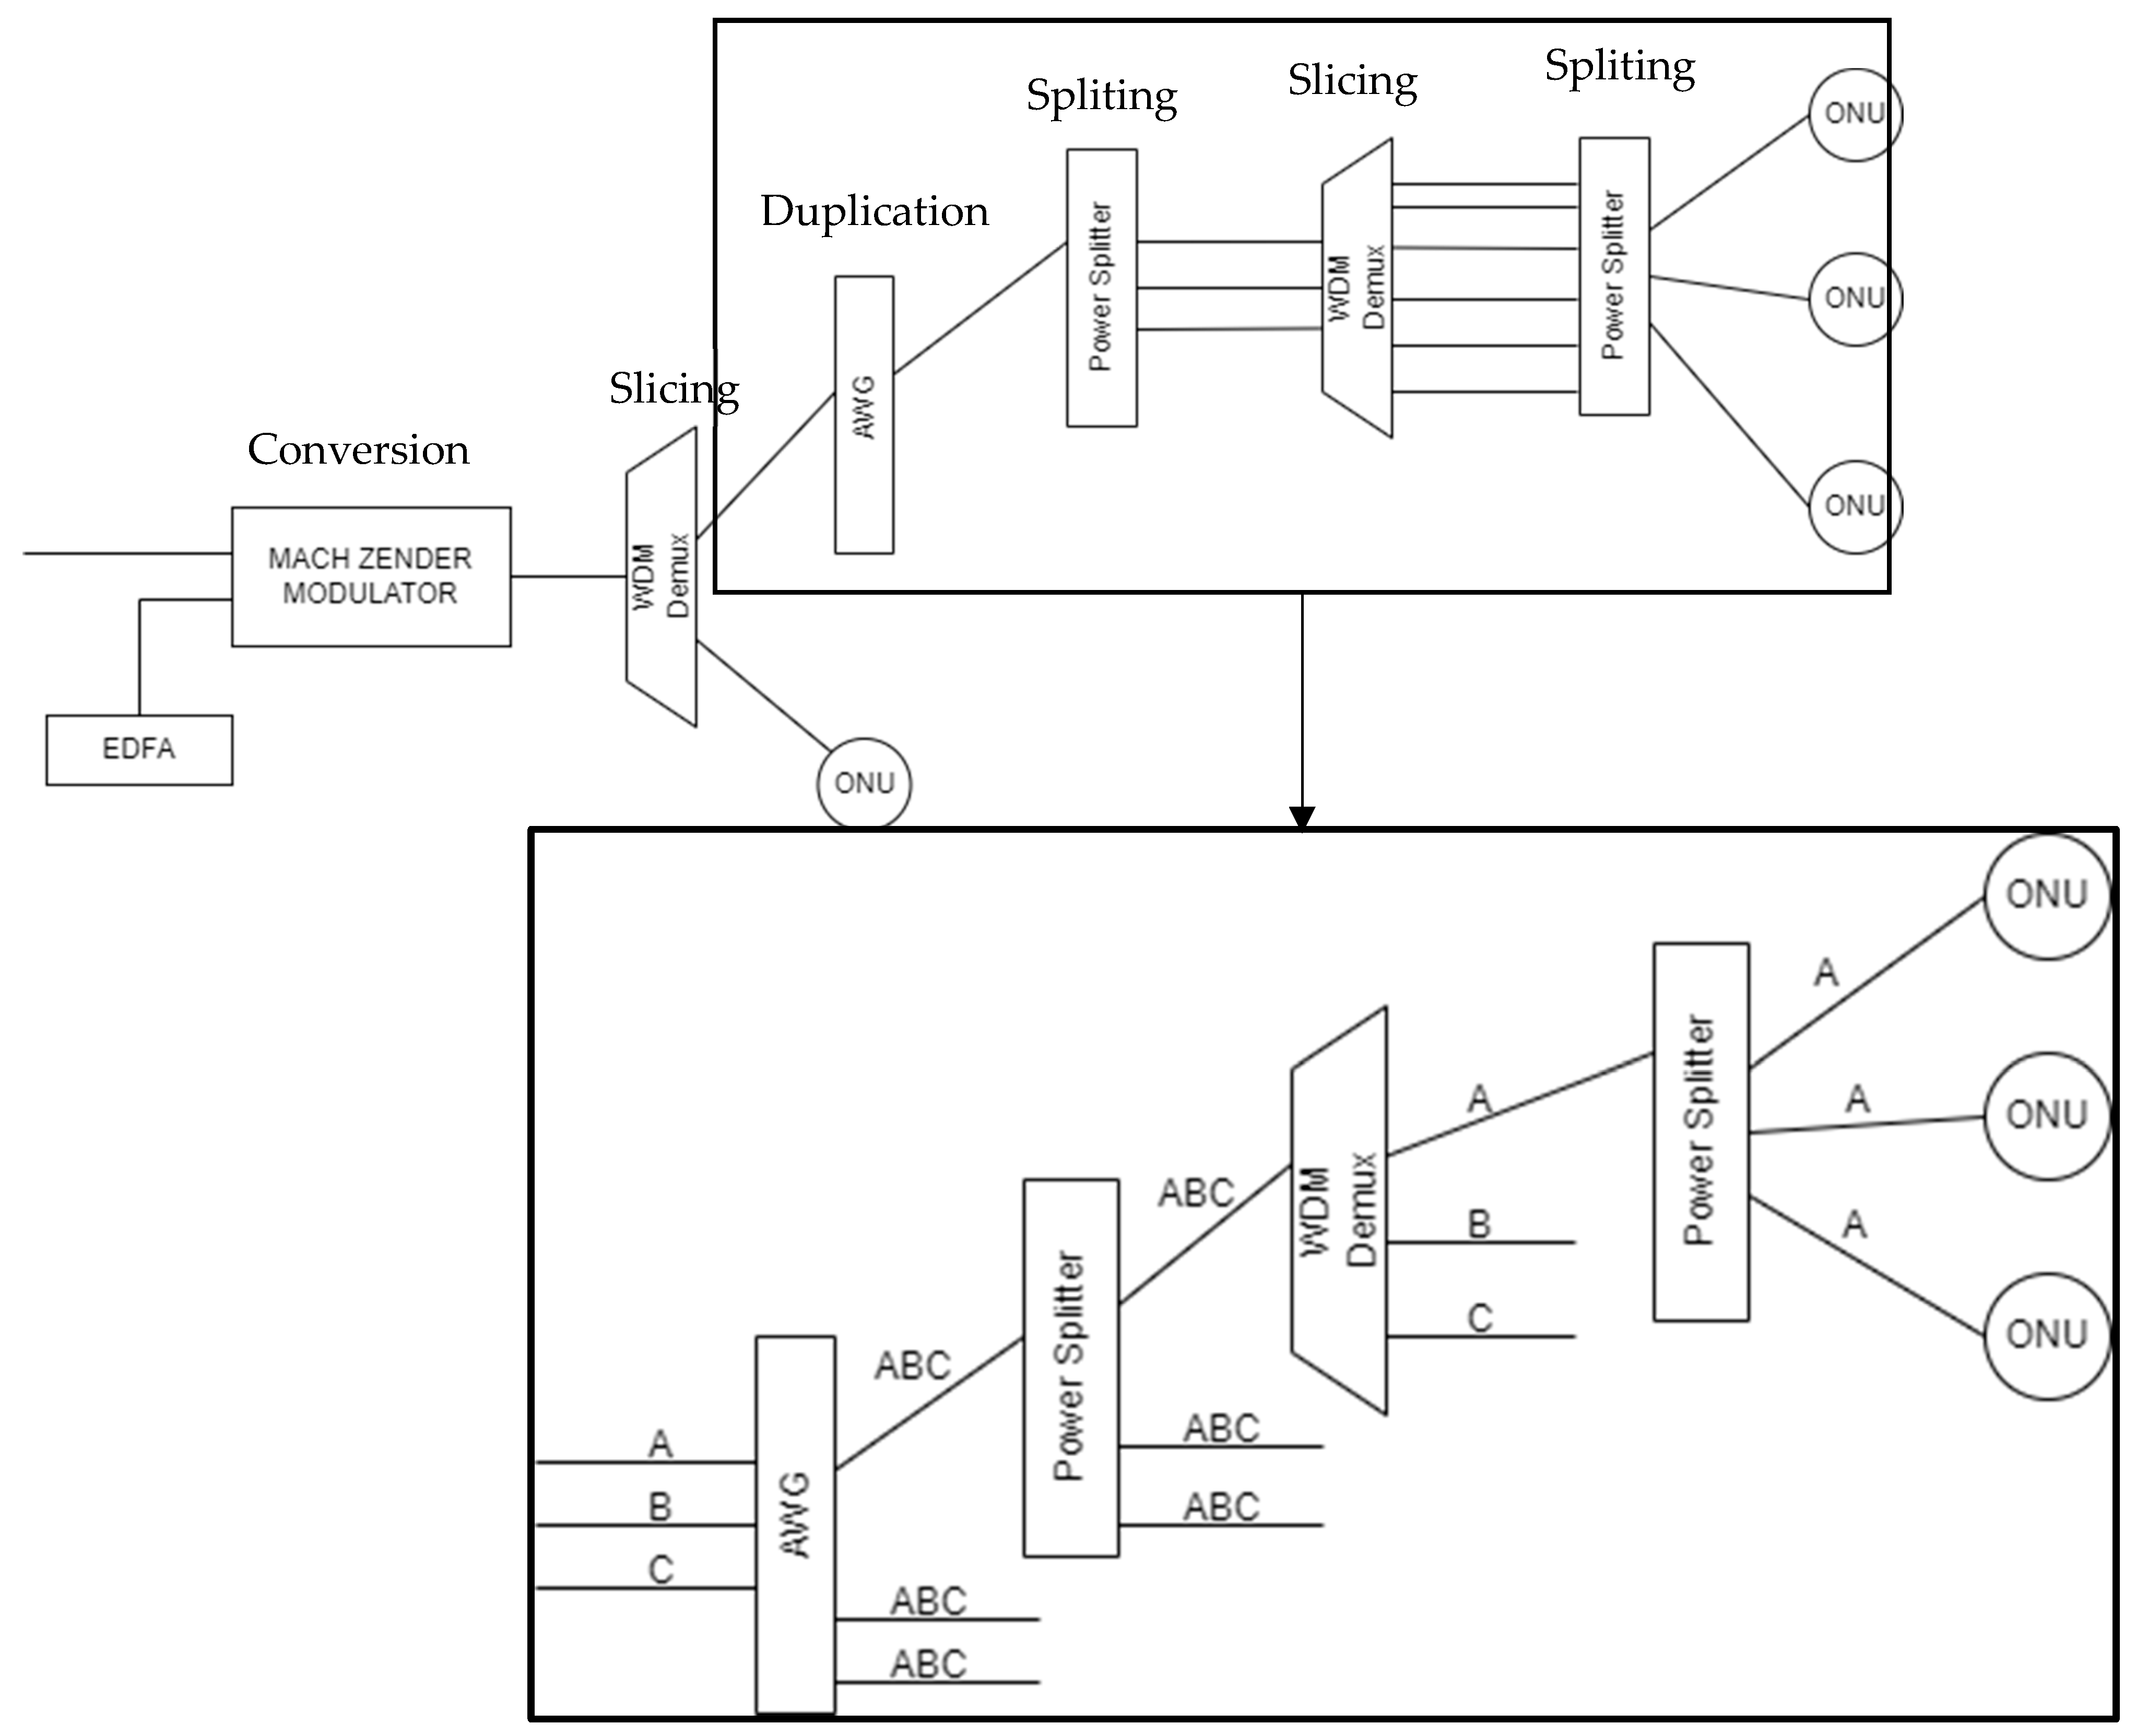
Network Design
3. Results and Discussion
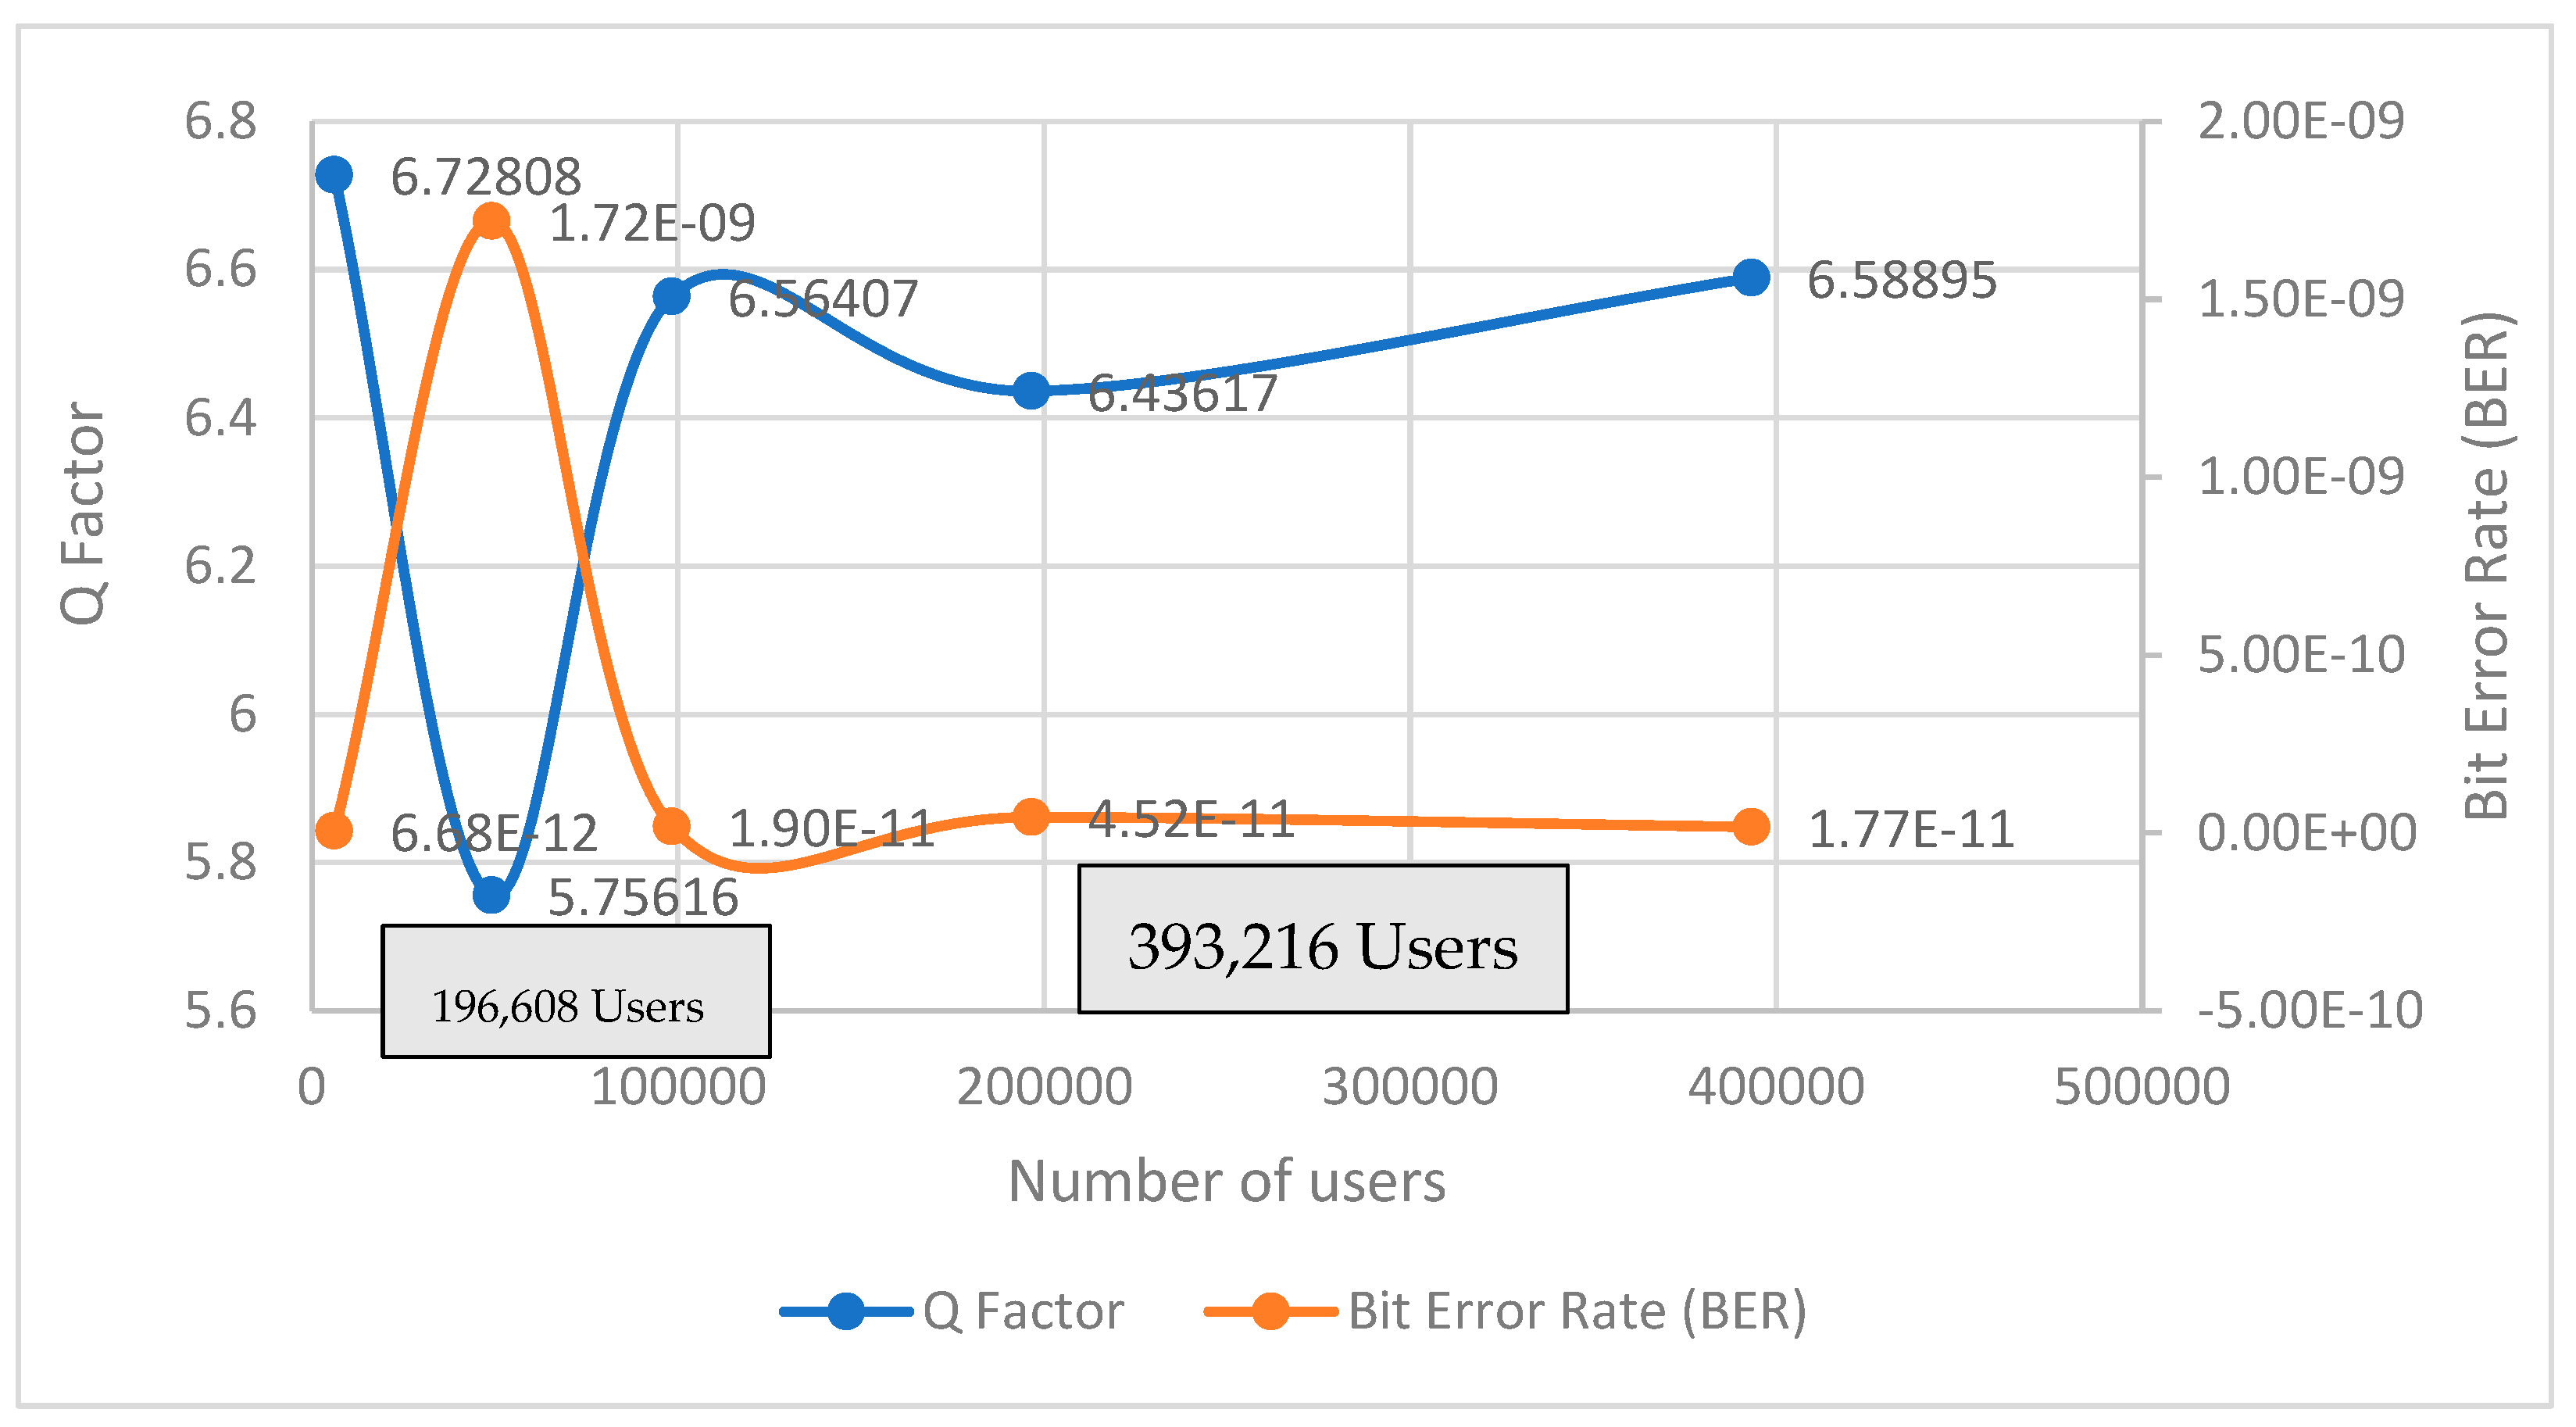
3.1. Eye Diagram, Q Factor and Bit Error Rate (BER)
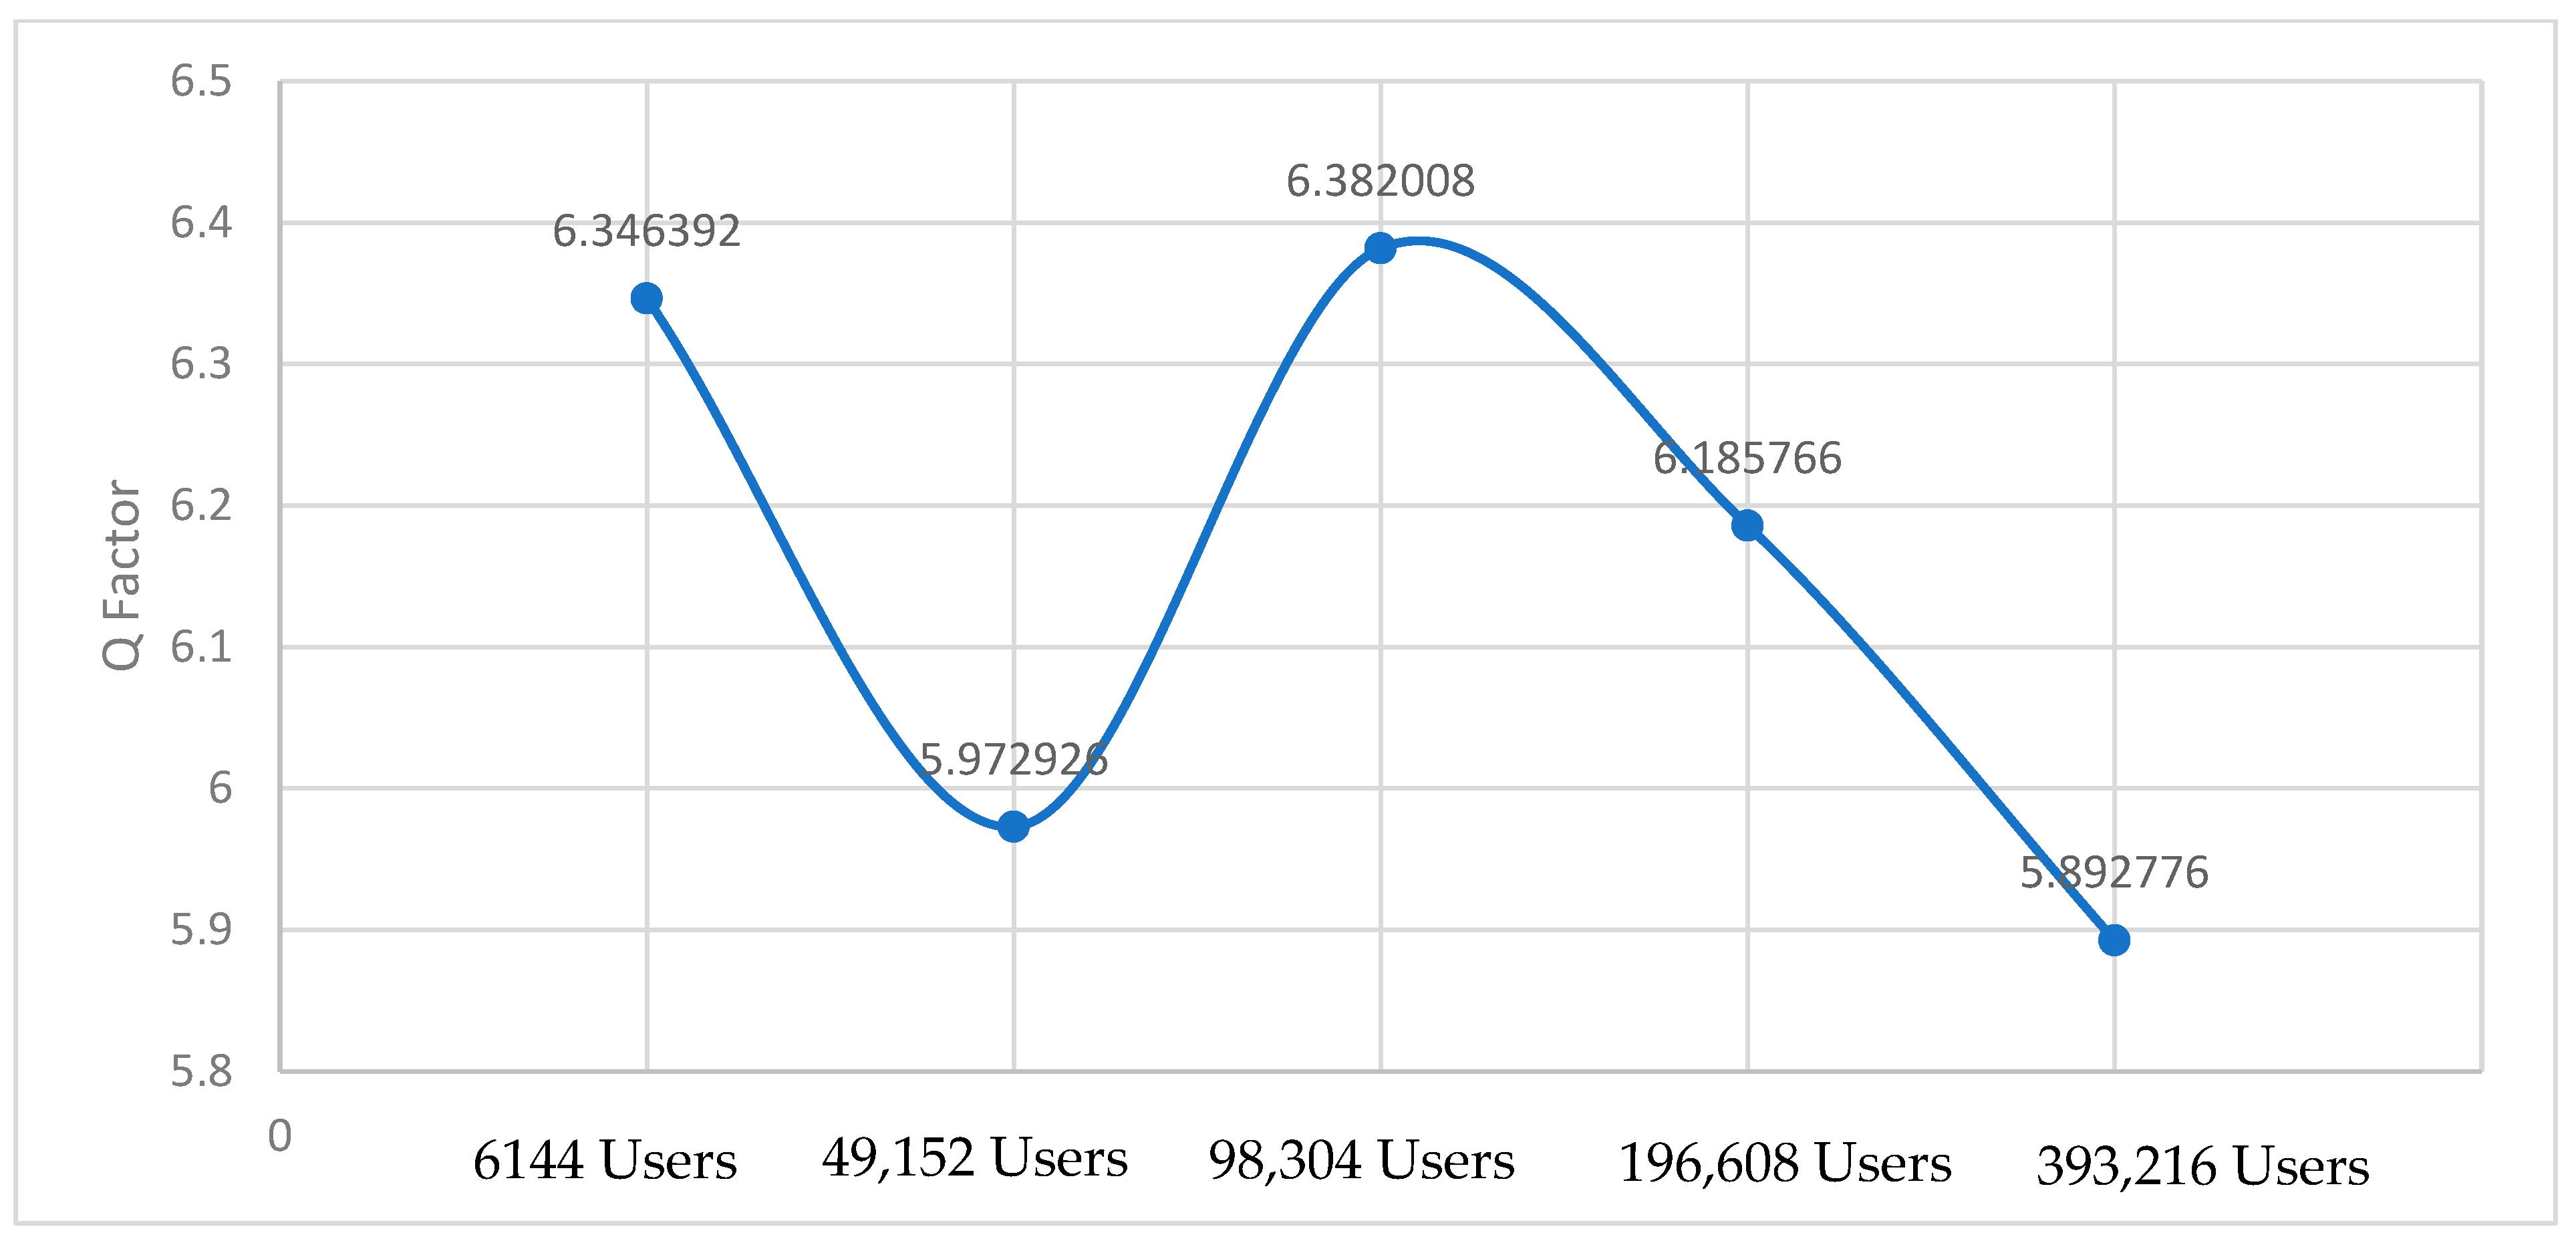
3.2. Calculation for Number of Users
3.3. Results for Power, Bandwidth and Group of Users
3.4. Results for Maximum Allowable Users
4. Conclusions
Author Contributions
Funding
Institutional Review Board Statement
Informed Consent Statement
Data Availability Statement
Acknowledgments
Conflicts of Interest
References
- Ab-Rahman, M.S.; Ng, B.; Aziz, S.A.C.; Mastang Premadi, A.; Saupe, M.N.M.; Jumari, K. High Efficiency of FTTH Network Management through SANTAD. J. Netw. Syst. Manag. 2010, 18, 210–231. [Google Scholar]
- Shaltami, F.M.; Ab-Rahman, M.S.; Hwang, I.-S.; Swedan, A.A. High-bit-rate SOA-based optical network unit with low seeding power that uses feedback seeding scheme. IET Optoelectron. 2017, 6, 272–277. [Google Scholar] [CrossRef]
- Ab-Rahman, M.S.; Shaltami, F.M.; Hwang, I.-S.; Swedan, A.A. Analysis of 10 Gbps SOA-based optical network unit with low seeding power that uses feedback seeding scheme. Optik 2019, 183, 602–611. [Google Scholar] [CrossRef]
- Ibrahim, M.M.; Ab-Rahman, M.S.; Hwang, I.-S. Analytical- and Simulation-Based Analysis for Optimum Erbium-Doped Fiber Amplifier (EDFA) Performance. Arab. J. Sci. Eng. 2015, 40, 2571–2583. [Google Scholar] [CrossRef]
- Ab-Rahman, M.S.; Swedan, A.A. Semiconductor Optical Amplifier for Optical Channel Capacity Improvement Based on CrossPhase Modulation. J. Telecommun. Electron. Comput. Eng. 2018, 10, 89–95. [Google Scholar]
- Kani, J.I. Enabling Technologies for Future Scalable and Flexible WDM-PON and WDM/TDM-PON Systems. IEEE J. Sel. Top. Quantum Electron. 2010, 16, 1290–1297. [Google Scholar] [CrossRef]
- Sano, A.; Masuda, H.; Kobayashi, T.; Fujiwara, M.; Horikoshi, K.; Yoshida, E. Ultra-High Capacity WDM Transmission Using Spectrally- Efficient PDM 16-QAM Modulation and C- and Extended L-Band Wideband Optical Amplification. J. Light. Technol. 2011, 29, 578–586. [Google Scholar] [CrossRef]
- Chen, H.-Y.; Wei, C.-C.; Lu, I.-C.; Chu, H.-H.; Chen, Y.-C.; Chen, J. High-capacity and high-loss-budget OFDM long-reach PON without an optical amplifier [invited]. J. Opt. Commun. Netw. 2015, 7, A59–A65. [Google Scholar] [CrossRef]
- Havic, Z.; Mikac, B. Economic Model for FTTH Access Network Design. Univers. J. Commun. Netw. 2015, 3, 57–63. [Google Scholar] [CrossRef]
- Aziz, S.A.C.; Ab-Rahman, M.S.; Jumari, K. Customer Access Protection Unit for Survivable FTTH Network. In Proceedings of the International Conference on Space Science and Communication 2009, Port Dickson, Malaysia, 26–27 October 2009; pp. 71–73. [Google Scholar]
- Ab-Rahman, M.S.; Hameed, A.; Swedan, A. Optical Channel Capacity Upgrade Based on Multiwavelength Conversion XGM Using Semiconductor Optical Amplifier for Access Networks. Int. J. Opt. 2017, 2017, 3195383. [Google Scholar] [CrossRef]
- Ab-Rahman, M.S.; Mohamed, I.M.M. Options and Challenges in Next-Generation Optical Access Networks (NG-OANs). OPTIK 2015, 126, 131–138. [Google Scholar]
- Kim, K.S. On the evolution of PON-based FTTH solutions. Inf. Sci. 2003, 149, 21–30. [Google Scholar] [CrossRef]
- Hilmi, S.; Lee, B.H.; Dimyati, K. Unlimited FTTH-PON Scaling by Exploiting the AWG Free Spectral Range. In Proceedings of the 2005 13th IEEE International Conference on Networks Jointly held with the 2005 IEEE 7th Malaysia International Conf on Communic, Kuala Lumpur, Malaysia, 16–18 November 2005; Volume 1, pp. 491–495. [Google Scholar]
- Hilmi, S.; Lee, B.H.; Dimyati, K. Scalable FTTH-PON architecture for unlimited user and flexible services. In Proceedings of the Network Architectures, Management, and Applications III, Shanghai, China, 5 December 2005; Volume 6022. [Google Scholar] [CrossRef]
- Aldouri, M.Y.; Aljunid, S.A.; Anuar, M.S.; Fadhil, H.A.; Ahmed, N.; He, T. One EDFA Loop in 16 Channels spectrum Slicing WDM for FTTH Access Network. In Proceedings of the International Conference On Photonics 2010, Langkawi, Malaysia, 5–7 July 2010. [Google Scholar]
- Dahman, H.S.Z. Designing Optical Fiber to the Home (FTTH) Networks by Using Hybrid Techniques; Al-Furat Al-Awsat Technical University: Najaf, Iraq, 2019; p. 111. [Google Scholar]
- Jin, C.; Shevchenko, N.A.; Li, Z.; Popov, S.; Chen, Y.; Xu, T. Nonlinear Coherent Optical Systems in the Presence of Equalization Enhanced Phase Noise. J. Light. Technol. 2021, 39, 4646–4653. [Google Scholar] [CrossRef]
- Yang, H.; Zhang, X.; Lin, B.; Deng, P.; Yi, A. Next-Generation Passive Optical Network Based on Sparse Code Multiple Access and Graph Neural Networks. IEEE Photonics J. 2022, 14, 1–6. [Google Scholar] [CrossRef]
- Ganesan, E.; Liem, A.T.; Hwang, I.-S.; Ab-Rahman, M.S.; Taju, S.W.; Sheikh, M.N.A. LSTM-Based DWBA Prediction for Tactile Applications in Optical Access Network. Photonics 2023, 10, 37. [Google Scholar] [CrossRef]
- Hwang, I.-S.; Rianto, A.; Kharga, R.; Ab-Rahman, M.S. Global P2P BitTorrent Real-Time Traffic Over SDN-Based Local-Aware NG-PON2. IEEE Access 2022, 10, 76884–76894. [Google Scholar] [CrossRef]


| No. of Users | 6144 Users | 49,152 Users | 98,304 Users | 196,608 Users | 393,216 Users | ||||||||||||||||
|---|---|---|---|---|---|---|---|---|---|---|---|---|---|---|---|---|---|---|---|---|---|
| Bandwidth (GHz) | a | b | c | d | a | b | c | d | a | b | c | d | a | b | c | d | a | b | c | d | |
| 6 | x | 32 | 32 | 6 | 8 | 32 | 32 | 6 | 16 | 32 | 32 | 6 | 32 | 32 | 32 | 6 | 64 | 32 | 32 | ||
| 100 | 5.84612 | 5.37531 | 6.41122 | 5.65825 | 5.17017 | ||||||||||||||||
| 150 | 6.67228 | 5.97101 | 5.83785 | 6.49439 | 6.09388 | ||||||||||||||||
| 200 | 5.59458 | 6.42985 | 6.51374 | 5.49055 | 5.79648 | ||||||||||||||||
| 250 | 6.8909 | 6.3323 | 6.58316 | 6.84947 | 5.8144 | ||||||||||||||||
| 300 | 6.72808 | 5.75616 | 6.56407 | 6.43617 | 6.58895 | ||||||||||||||||
| Q factor (Average) | 6.346392 | 5.972926 | 6.382008 | 6.185766 | 5.892776 | ||||||||||||||||
Disclaimer/Publisher’s Note: The statements, opinions and data contained in all publications are solely those of the individual author(s) and contributor(s) and not of MDPI and/or the editor(s). MDPI and/or the editor(s) disclaim responsibility for any injury to people or property resulting from any ideas, methods, instructions or products referred to in the content. |
© 2023 by the authors. Licensee MDPI, Basel, Switzerland. This article is an open access article distributed under the terms and conditions of the Creative Commons Attribution (CC BY) license (https://creativecommons.org/licenses/by/4.0/).
Share and Cite
Ab-Rahman, M.S.; Rahman, J.A.; Arifin, N.F.M.; Kaharudin, I.H.; Hwang, I.-S. Upscaling Customer Access Network Using Spectrum Conversion–Slicing–Duplication Technique. Photonics 2023, 10, 1271. https://doi.org/10.3390/photonics10111271
Ab-Rahman MS, Rahman JA, Arifin NFM, Kaharudin IH, Hwang I-S. Upscaling Customer Access Network Using Spectrum Conversion–Slicing–Duplication Technique. Photonics. 2023; 10(11):1271. https://doi.org/10.3390/photonics10111271
Chicago/Turabian StyleAb-Rahman, Mohammad Syuhaimi, Juwairiyyah Abdul Rahman, Nurul Farhana Mohd Arifin, Iszan Hana Kaharudin, and I-Shyan Hwang. 2023. "Upscaling Customer Access Network Using Spectrum Conversion–Slicing–Duplication Technique" Photonics 10, no. 11: 1271. https://doi.org/10.3390/photonics10111271