1. Introduction
The need for a reliable operation of passive optical networks (PONs) for fiber to the home (FTTH) access is driven by the continuously growing demand for bandwidth of internet and other services [
1,
2]. The next-generation optical access (NGOA) networks offer a potential for providing high bandwidth access to both residential and business customers, while reducing network power consumption and operational expenditures (OPEX) of the network operator [
3,
4,
5,
6]. A passive optical power splitter used in PONs is not limited to bandwidths, which provides opportunities to increase economic efficiency by future upgrades to higher bandwidth, higher subscriber counts and longer reach [
7,
8,
9].
Due to the use of only passive components in the network, a fault in the transparent path cannot be detected or located by the network infrastructure itself. A monitoring of the PON is needed to support the network installation process, facilitate repair activities and improve the availability of services [
10]. To avoid a disturbance of data transmission wavelengths by monitoring wavelengths and vice versa, the monitoring is required to use a wavelength band that is intentionally reserved for monitoring purposes (cf. “U-band”, 1,625–1,675 nm, ITU-T L.66).
The PON monitoring is intended to enable fault monitoring for the complete transparent path from the optical line termination (OLT) at the network operator’s office via the optical distribution network (ODN) to the optical network unit (ONU) at the subscriber’s site. A fault can occur in the passive ODN or in the active equipment, such as the ONU and OLT. Since the ONU is owned by the subscriber, the network operator must be capable to monitor the whole ODN up to the interconnection point to the subscriber without participation of the ONU. On one hand, the PON structure offers many advantages as mentioned above. On the other hand, PON-monitoring is a challenge caused by high attenuation, high splitting ratios and sometimes short spatial distances between the subscribers. If the monitoring system is installed at the OLT, the monitoring signals need to pass the ODN in one direction, get reflected at the subscriber, pass the ODN in the other direction and be detected by the monitoring system. Compared to data signals that pass the ODN only in one direction, monitoring signals experience at least twice the attenuation of data signals. A conventional optical time domain reflectometer (OTDR) cannot distinguish subscribers unambiguously in a PON based on passive optical power splitters, as reflections from several branches after the splitter superimpose.
To enable an unambiguous subscriber identification, a PON monitoring concept based on unique combinations of wavelength-selective mirrors per subscriber was developed [
11]. Each one of the mirrors per subscriber differs in reflection wavelength. Binomial coefficients guarantee the uniqueness of each mirror combination in a PON. To enable monitoring of high subscriber counts, a narrow reflection bandwidth <0.5 nm is chosen for the mirrors to ensure many mirror combinations in narrow wavelength bands. Monitoring signals pass the ODN, are reflected at the subscriber, and pass the PON in the other direction. This two-way attenuation of monitoring signals is minimized by using mirrors with a reflectivity higher than 99%. No unwanted effects, such as ghosts, could be observed due to the high reflectivity of the mirrors. It was shown that the probability for ambiguous measurement results is very low by using two mirrors per subscriber (mirror pairs). The robustness of measurement results can be enhanced by employing more measurement wavelengths and/or using a higher spatial resolution [
12]. The installation of the mirror pairs is assumed to be performed during subscriber installation. The concept succeeded in a field trial [
13,
14]. Coding techniques implemented to our OTDR set-up can further improve the signal to noise ratio (SNR) of our measurements and enable a PON monitoring for higher reach and a higher splitting factor than used in the field trial, which was successfully tested [
15].
In this paper a comparison of theoretical and experimentally achieved results is performed. The coding gain is chosen as a comparative value of the Coding-OTDR measurements. The experimental results are achieved in a PON in which each subscriber is equipped with a unique combination of wavelength-selective mirrors.
2. OTDR SNR Enhancement Techniques
The following OTDR SNR enhancement techniques have in common, that a single impulse is encoded to a more complex signal and coupled into the PON. The reflected waveforms are detected and decoded, resulting in OTDR traces showing a better SNR compared to conventional single-impulse OTDR traces. The SNR is achieved by compression of energy from a signal of long duration to a short impulse during decoding. A conventional single impulse OTDR achieves a gain in SNR via measuring multiple times and averaging of the aquired measurements. An OTDR employing SNR enhancement techniques is able to achieve the same SNR in a measurement in a shorter time than a single impulse OTDR. Analogously a better SNR can be achieved by averaging the same or more samples while measuring for a longer time. In the following chapters three SNR enhancement techniques are presented. Each of them is based on a different decoding.
2.1. Simplex Code OTDR
Simplex codes can be derived from the Hadamard-Matrix. They are unipolar binary codes consisting of “1” and “0” symbols. An OTDR signal based on a Simplex codes consists of impulses corresponding to “1” and voids corresponding to “0”. In a Simplex code OTDR measurement
sub measurements with different codes of length
are necessary for decoding. The Hadamard-Transformation is used to accomplish the decoding. The SNR gain
in the result is expressed in Equation (
1) [
15,
16,
17].
2.2. Golay Code OTDR
Golay codes result in pairs of complementary autocorrelation functions, whose side lobes are complementary to each other. The sum of the autocorrelation functions of each complementary code pair is zero in all places except for the autocorrelation peak. This complementary characteristic minimizes misleading interpretations of side lobes to be identified as weak reflections. Golay-Codes are bipolar binary codes consisting of “1” and “−1” symbols. A directly modulated laser source is able to emit power, which corresponds to a logical 1, or no power, which corresponds to a logical 0. Emitting of a logical –1 is not possible, so the bipolar code has to be split into two unipolar codes. The received two unipolar code sequences are subtracted from each other to restore the initial bipolar code sequence. In the decoding process two quasi bipolar code sequences are computed from the received unipolar code sequences. The bipolar code sequences are autocorrelated with the corresponding code sequences and added up. For a measurement with codes of the length
the SNR improvement
in the result is expressed by the following equation [
15,
18].
2.3. Novel Linear-Frequency-Chirp OTDR
The Linear-Frequency-Chirp OTDR uses the Wigner-Distribution method to dechirp a chirped signal. This method has been proposed for radar [
19,
20]. In this paper, an OTDR implementation is presented for the first time to the best of our knowledge. The use of the Wigner-Distribution method represents a different approach to impulse coding. In this Method a probe impulse is coded as a chirp signal
, as stated in Equation (
3), where
is the chirp starting frequency and
α the chirp rate.
The Wigner-Distribution is used to transform the received signal to a time-frequency representation.
In this representation the reflected signals appear as straight lines in the time-frequency plane. In the next step the Wigner-Distribution is integrated along all straight lines with an angle given by the chirp rate α.
The integration has two advantages. On one hand the interference terms cancel out and on the other hand the signal energy is compressed, which leads to an improved SNR. Due to the integration a trace similar to conventional OTDR-traces emerges, in which the reflections appear as peaks.
In contrast to the radar implementation, the OTDR implementation implies two differences. First, the modulation frequency of the signal has to be low enough to be processed electrically. For this reason the carrier wave is not frequency modulated but intensity modulated with a sweep signal. Furthermore, a low modulation frequency is beneficial, because the receiver bandwidth and the related noise bandwidth can be kept low; Second, the theoretical chirp signal oscillates around zero. As described in
Section 2.2, no negative laser powers can be emitted. To overcome this issue the theoretical chirp signal is divided into a positive and a negative part as shown in Equations (
6) and (
7).
With both signals measurements are carried out successively. The trace, which was measured with , is subtracted from the one, which was measured with . Analogue to the expression a trace originates, which has the characteristics of a measurement performed with the signal .
2.4. SNR Calculation
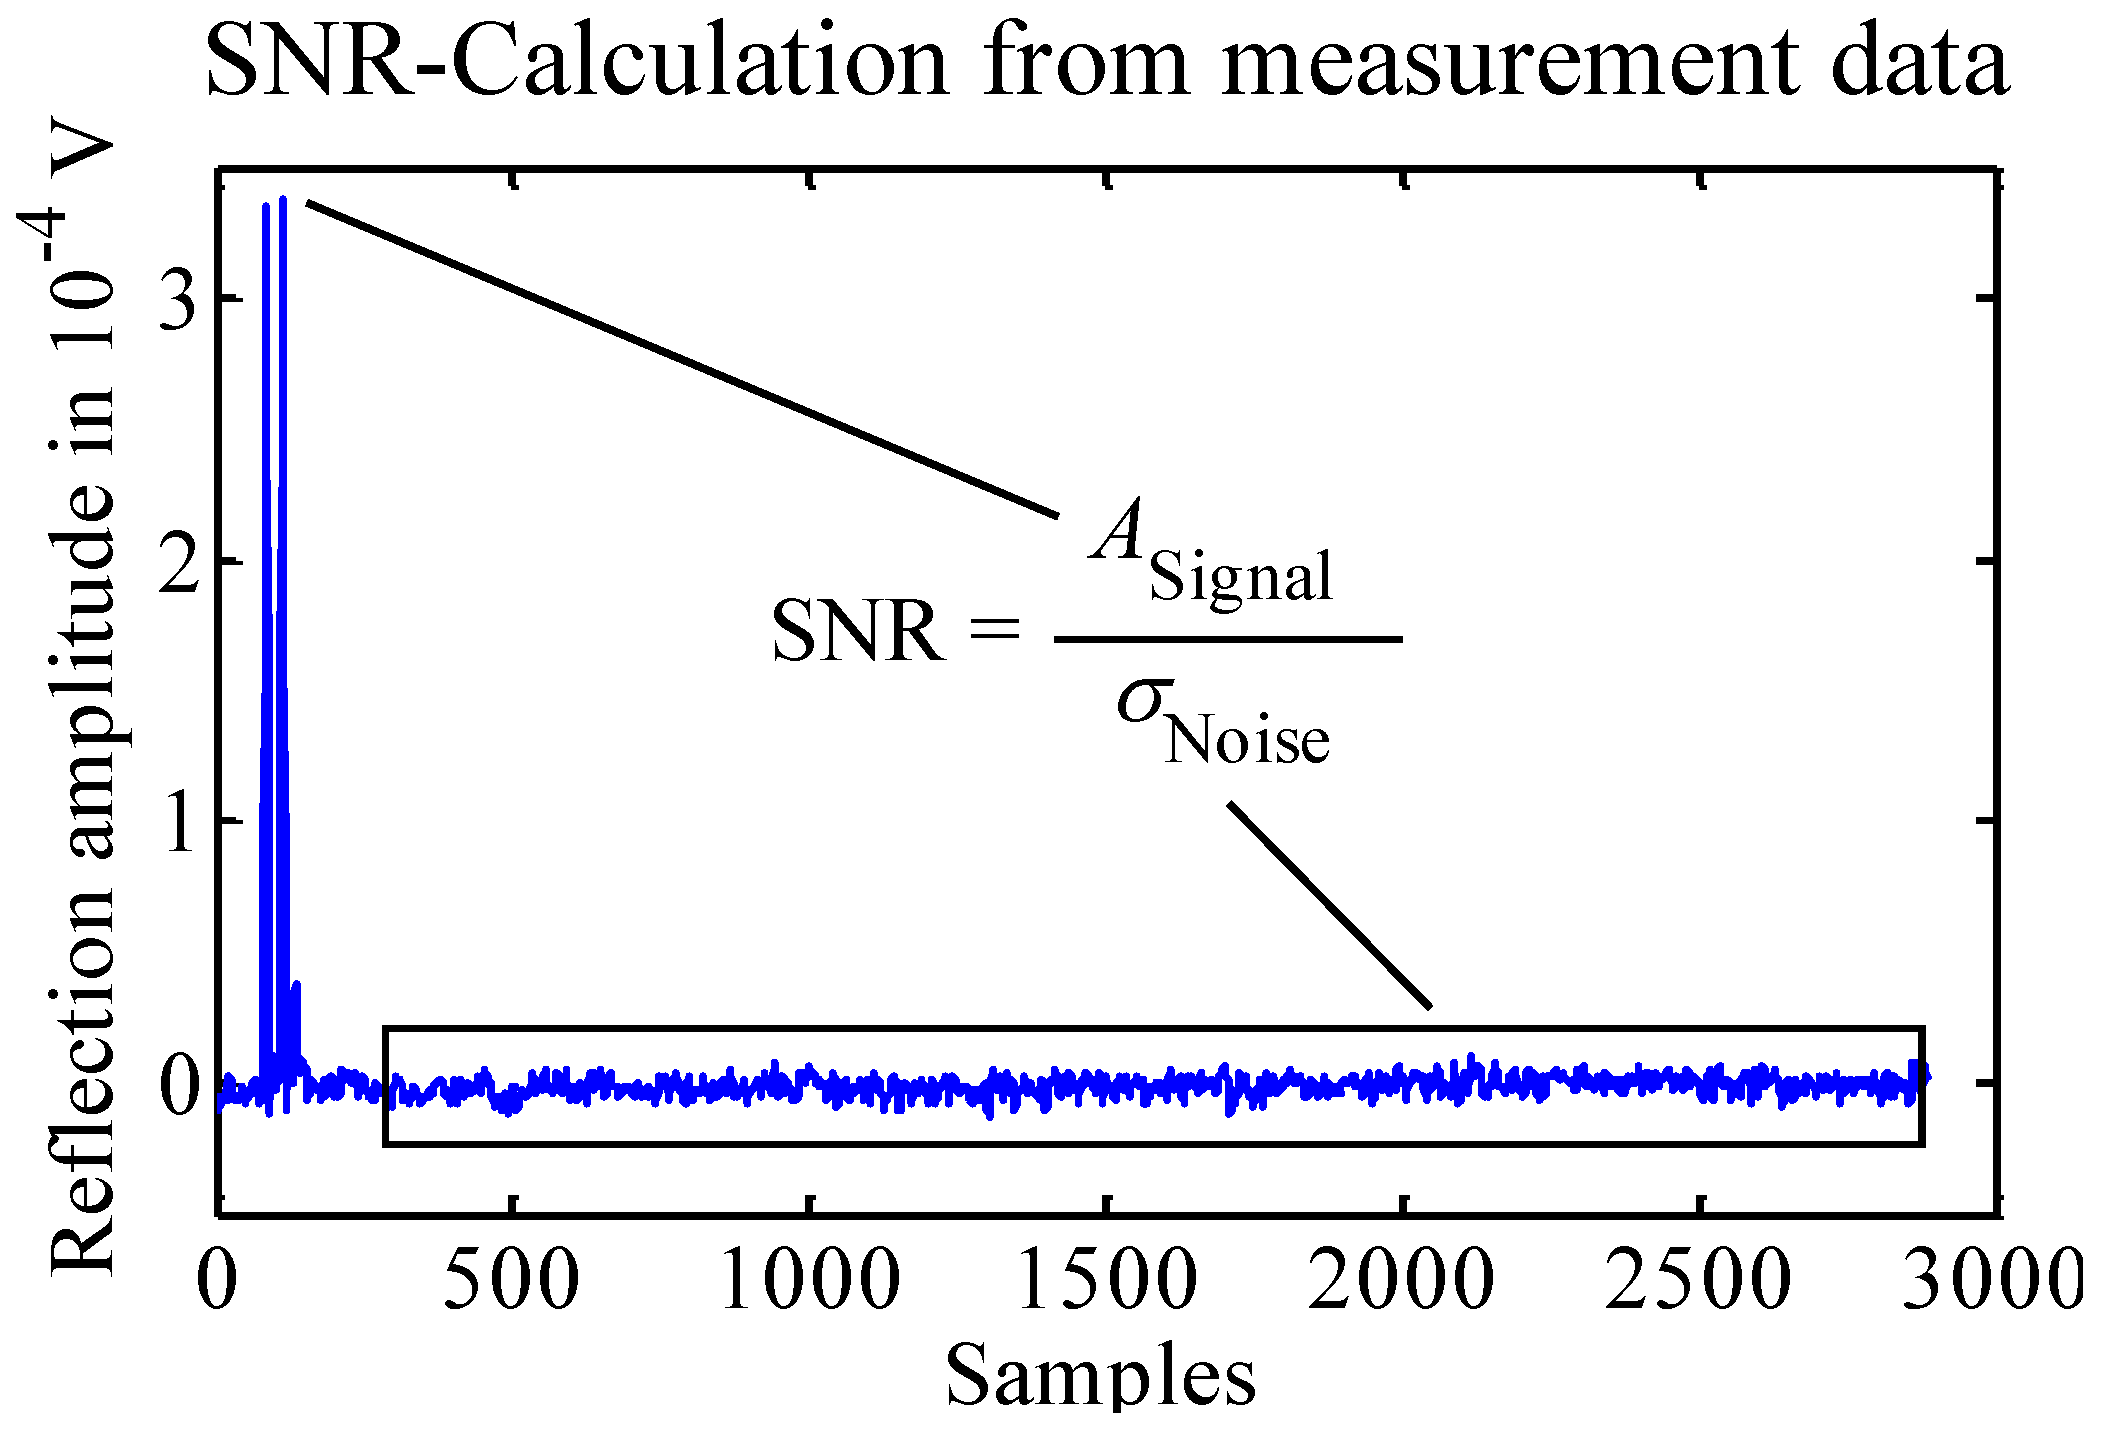
To obtain a measure for SNR improvement due to coding compared to single impulse measurements, SNR values are calculated from measurement data. We choose the following SNR definition for measurement result characterization.
In Equation (
8),
denotes the peak amplitude of the trace and
denotes the standard deviation, which has to be calculated from a part of the trace, where no reflections or backscatters are present. In this paper
is calculated from a part of the aquired signal beyond the end of the PON. In
Figure 1, the SNR calculation is illustrated schematically.
Figure 1.
Schematically shown signal to noise ratio (SNR) calculation based on measurement data.
Figure 1.
Schematically shown signal to noise ratio (SNR) calculation based on measurement data.
3. Experimental Set-up of PON and OTDR
3.1. PON Monitoring Concept
The PON monitoring concept used in this paper is based on a unique combination of wavelength selective mirrors per subscriber [
11,
14]. Each unique pair of mirrors is assigned to a subscriber. The maximum number of subscribers
can be calculated by using the binomial coefficient: the number of measurement wavelengths
choose the number of concatenated mirrors per subscriber
. In this paper we have
= 4 measurement wavelengths and
= 2, resulting in
= 6 maximum subscribers with a unique combination.
In the experiment, Fiber Bragg Gratings (FBGs) with a full width at half maximum (FWHM) reflection bandwidth of approximately 0.5 nm and a maximum reflectance of 99% are used as mirrors. For the possibility to reconfigure the mirrors for other measurements, the mirrors in each mirror pair are connected via 1.0 m of fiber. For commercial use, the distance of 1.0 m between the FBGs may be omitted.
3.2. Set-Up of PON
The PON set-up is intended to test the capability of our OTDR set-up to reliably identify subscribers. The set-up is depicted in
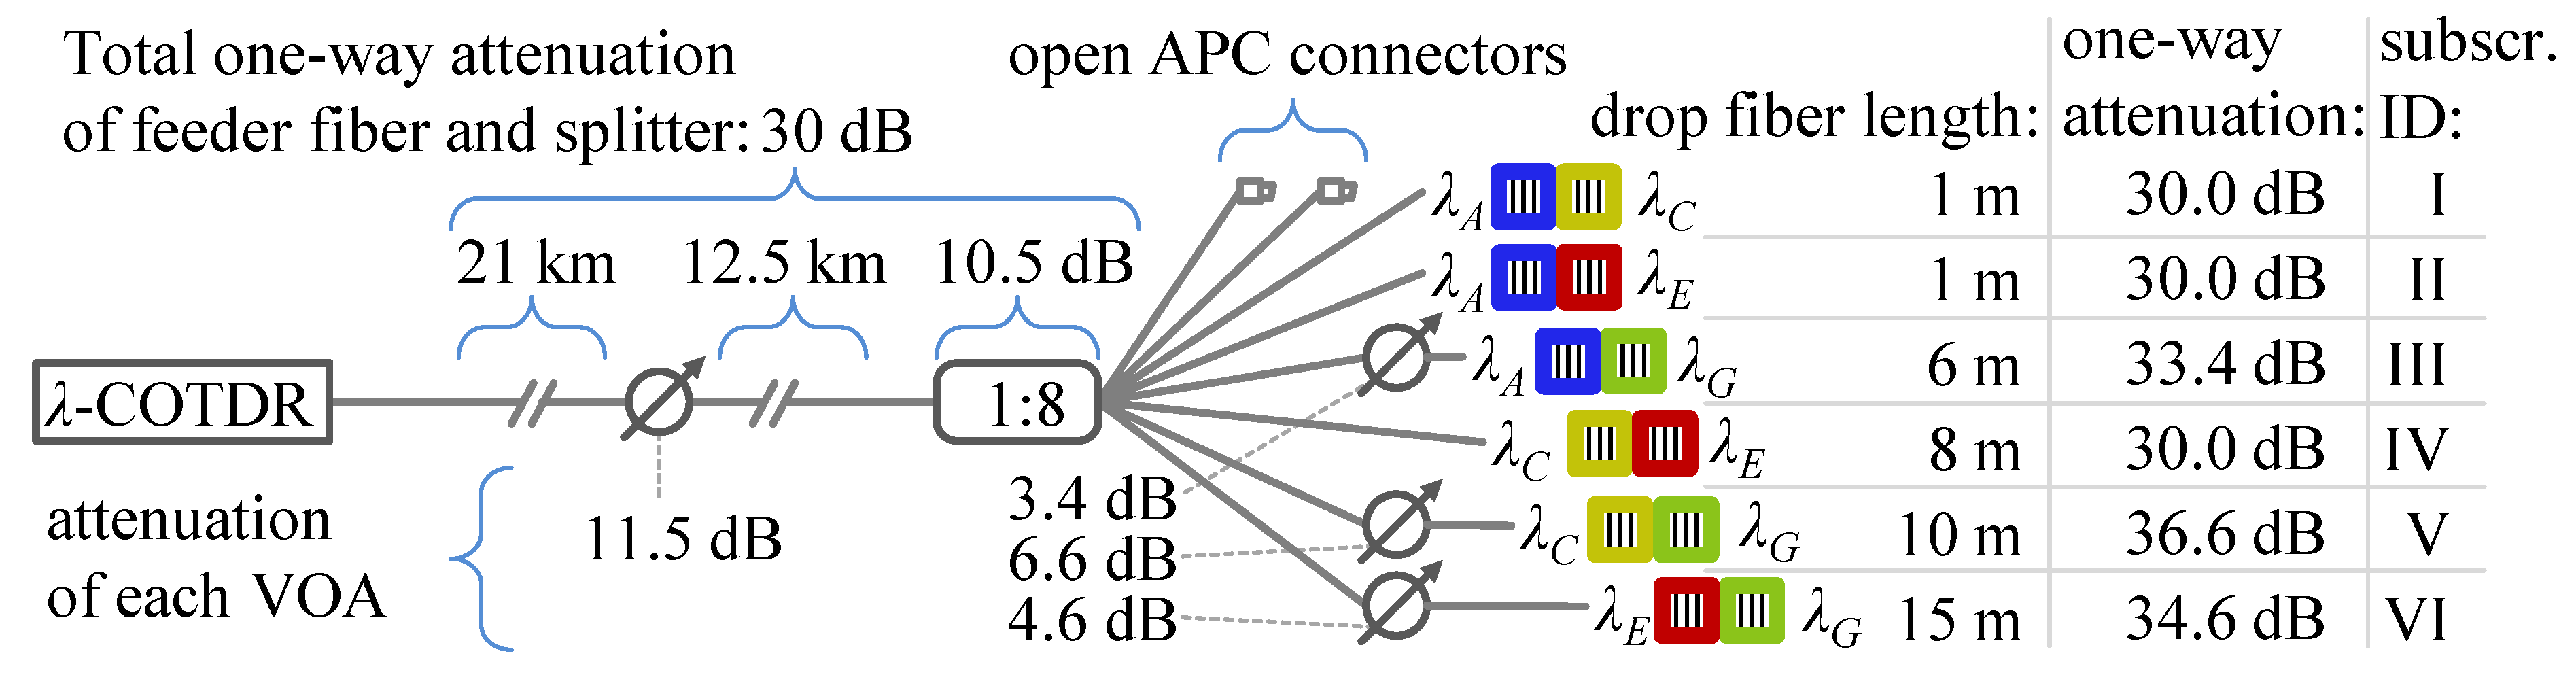
Figure 2. The total one-way attenuation of the concatenated feeder fiber, the variable optical attenuator (VOA) and the passive optical power splitter is 30 dB. The VOA in the feeder fiber is inserted to add attenuation to the optical path on demand. In a commercial PON, the attenuation would mainly be caused by long fiber lengths and passive optical power splitters. Three drop fibers contain VOAs set to different attenuations to test the capability of our OTDR measurement system to detect subscribers connected with higher attenuations than others.
Figure 2.
Schematic drawing of the passive optical network (PON) set-up.
Figure 2.
Schematic drawing of the passive optical network (PON) set-up.
All six subscribers are installed within a fiber length difference of 14.0 m. Each mirror pair is assigned to a subscriber identification number (ID) for an easy identification in the measurement results. Unused splitter ports are terminated by open angled physical contact (APC) connectors.
The PON set-up contains two test cases for a robustness test of our OTDR measurement system. The first test case includes subscribers III, V and VI, which are connected via a VOA in the drop fiber. The VOAs are set to different attenuations to test the monitoring system for its approximate subscriber detection attenuation threshold.
The second test case is composed of subscribers IV and V. Subscriber V is placed 2.0 m behind subscriber IV in fiber length. Additionally, subscriber V is connected with a total one-way attenuation of 36.6 dB, which is 6.6 dB higher than the one-way attenuation of the connection to subscriber IV. This case combines two challenges to detect both subscribers, because a weak reflection follows a much stronger reflection by 2.0 m.
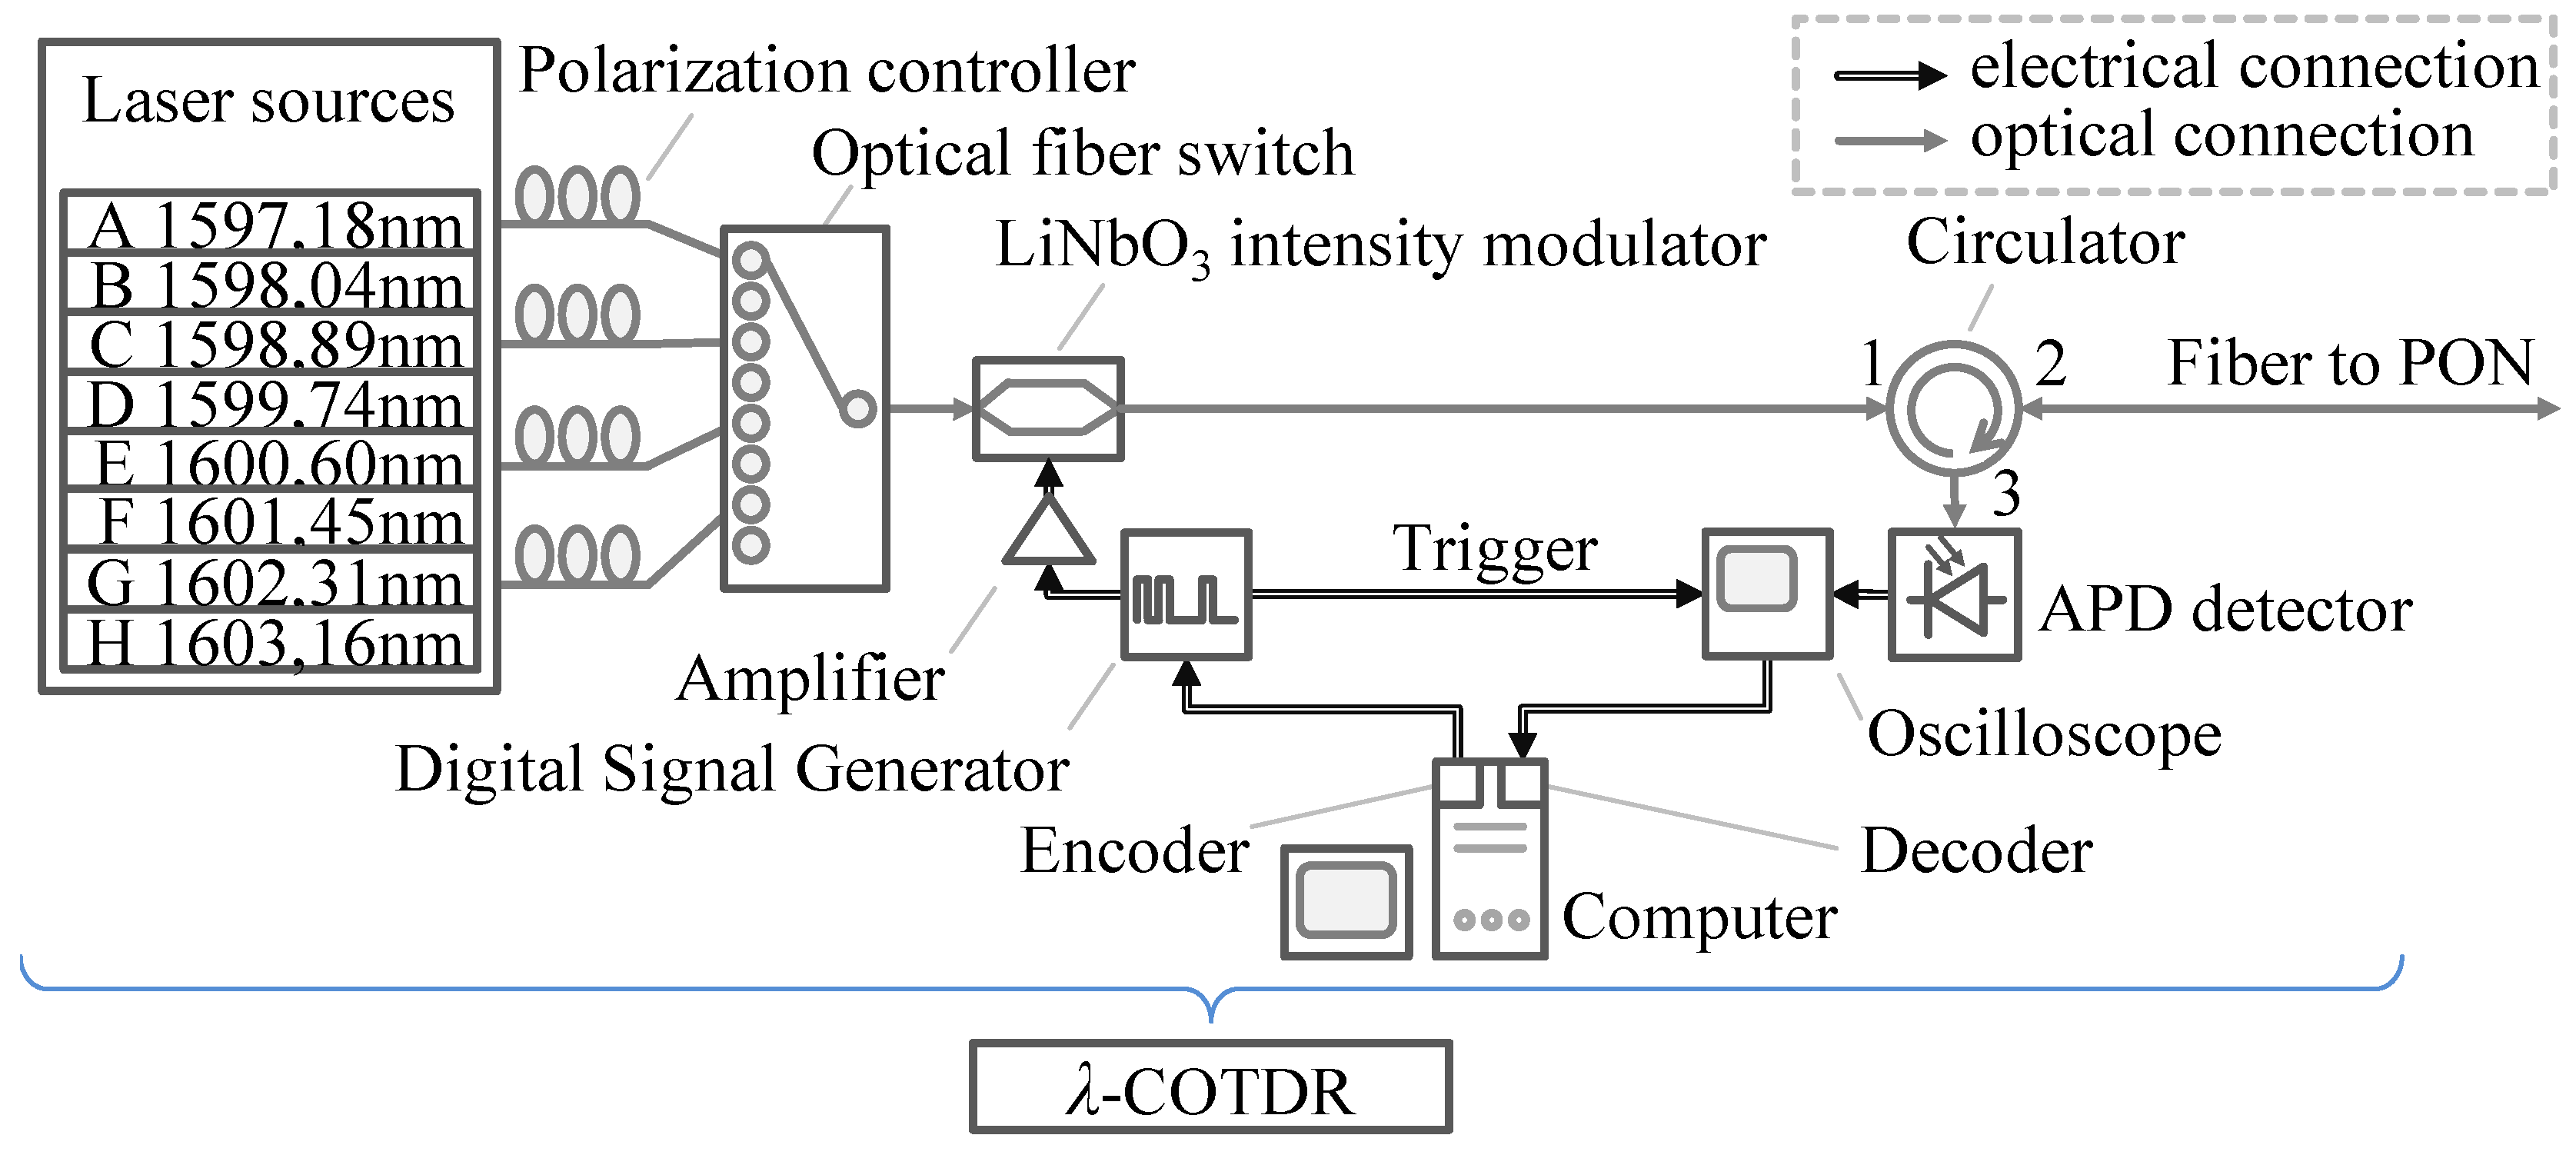
3.3. Set-Up of Wavelength Tunable OTDR
For the
λ-COTDR set-up L-Band continuous wave (CW) laser sources were used. Four measurement wavelengths (
= 1,597.18 nm,
= 1,598.89 nm,
= 1,600.60 nm and
= 1,602.31 nm) were selected, resulting in a maximum of six unique mirror combinations (cf. Equation (
9)). A computer program encodes sequences to be fed into a Digital Signal Generator, which sends the encoded sequence to an amplifier to drive a LiNbO
intensity modulator and triggers the start of the sampling process of an oscilloscope. The CW-signal with the desired measurement wavelength is selected via an optical fiber switch. The CW-signal is modulated to achieve optical sequences via a LiNbO
intensity modulator. The optical sequences pass an optical circulator and are emitted into the PON. Reflected signals from the PON are passed to an avalanche photo diode (APD) detector for data acquisition by an oscilloscope. A computer program compares the transmitted and received sequences, which is part of the decoding process.
The set-up of the wavelength tunable coding OTDR (
λ-COTDR) is depicted in
Figure 3.
Figure 3.
Schematic drawing of the wavelength tunable coding Optical Time Domain Reflectometer (λ-COTDR) set-up. For the wavelength tunable Linear-Frequency-Chirp OTDR set-up, the digital signal generator is substituted by an arbitrary waveform generator (AWG).
Figure 3.
Schematic drawing of the wavelength tunable coding Optical Time Domain Reflectometer (λ-COTDR) set-up. For the wavelength tunable Linear-Frequency-Chirp OTDR set-up, the digital signal generator is substituted by an arbitrary waveform generator (AWG).
The launch power of optical signals at the fiber input to the PON was 0 dBm. Impulses with a full width at half maximum (FWHM) duration of 10 ns were used. For Golay decoding, the generated code sequence is correlated with the received code sequence. For good correlation results, a raised cosine shape in the generated code sequence is selected to achieve a close proximity to the measured signal shape of the sequences sent.
For the Linear-Frequency-Chirp OTDR, a chirp frequency range from to 60 MHz was used with a chirp duration of 4 μs. Analog to a conventional single impulse OTDR, a pause longer than the roundtrip time of the PON is inserted before the next chirp signal is sent.
The distance to the subscribers is calculated from the propagation time of the reflected signals and the index of refraction of the fiber.
Measurements with this set-up implying a combination of Golay- and Simplex-Codes (Composite Coding Scheme implemented in [
15]) were omitted to test for discrete SNR enhancement techniques only.
4. Experimental Results
Measurements with a conventional single impulse technique and different code lengths of Golay- and Simplex-Codes were performed using the
λ-OTDR set-up shown in
Figure 3. Results for the Linear-Frequency-Chirp OTDR were obtained by the equivalent Linear-Frequency-Chirp OTDR set-up, using an Arbitrary Waveform Generator instead of the Digital Signal Generator. All measurements were performed using the PON set-up depicted in
Figure 2.
For each measurement result shown for each wavelength, a total of N = 16,384 single measurements were averaged. This implies that the single impulse measurement result consists of 16,384 averages, a measurement based on Golay-Codes of 4096 averages for each of the four unipolar codes, a measurement based on Simplex-Codes of 16,384/ averages for each of the codes and the measurement based on the chirp signal 8192 averages for each of the positive and negative part of the waveform.
For easier interpretation of measurement results, the mirror coloring for each wavelength in
Figure 2 matches the colors for the wavelength plots in the measurement results. Furthermore, vertical dashed lines indicate reflections from each subscriber. The distances indicated for subscribers refer to the nearest distance value to a vertical dashed line on the distance scale.
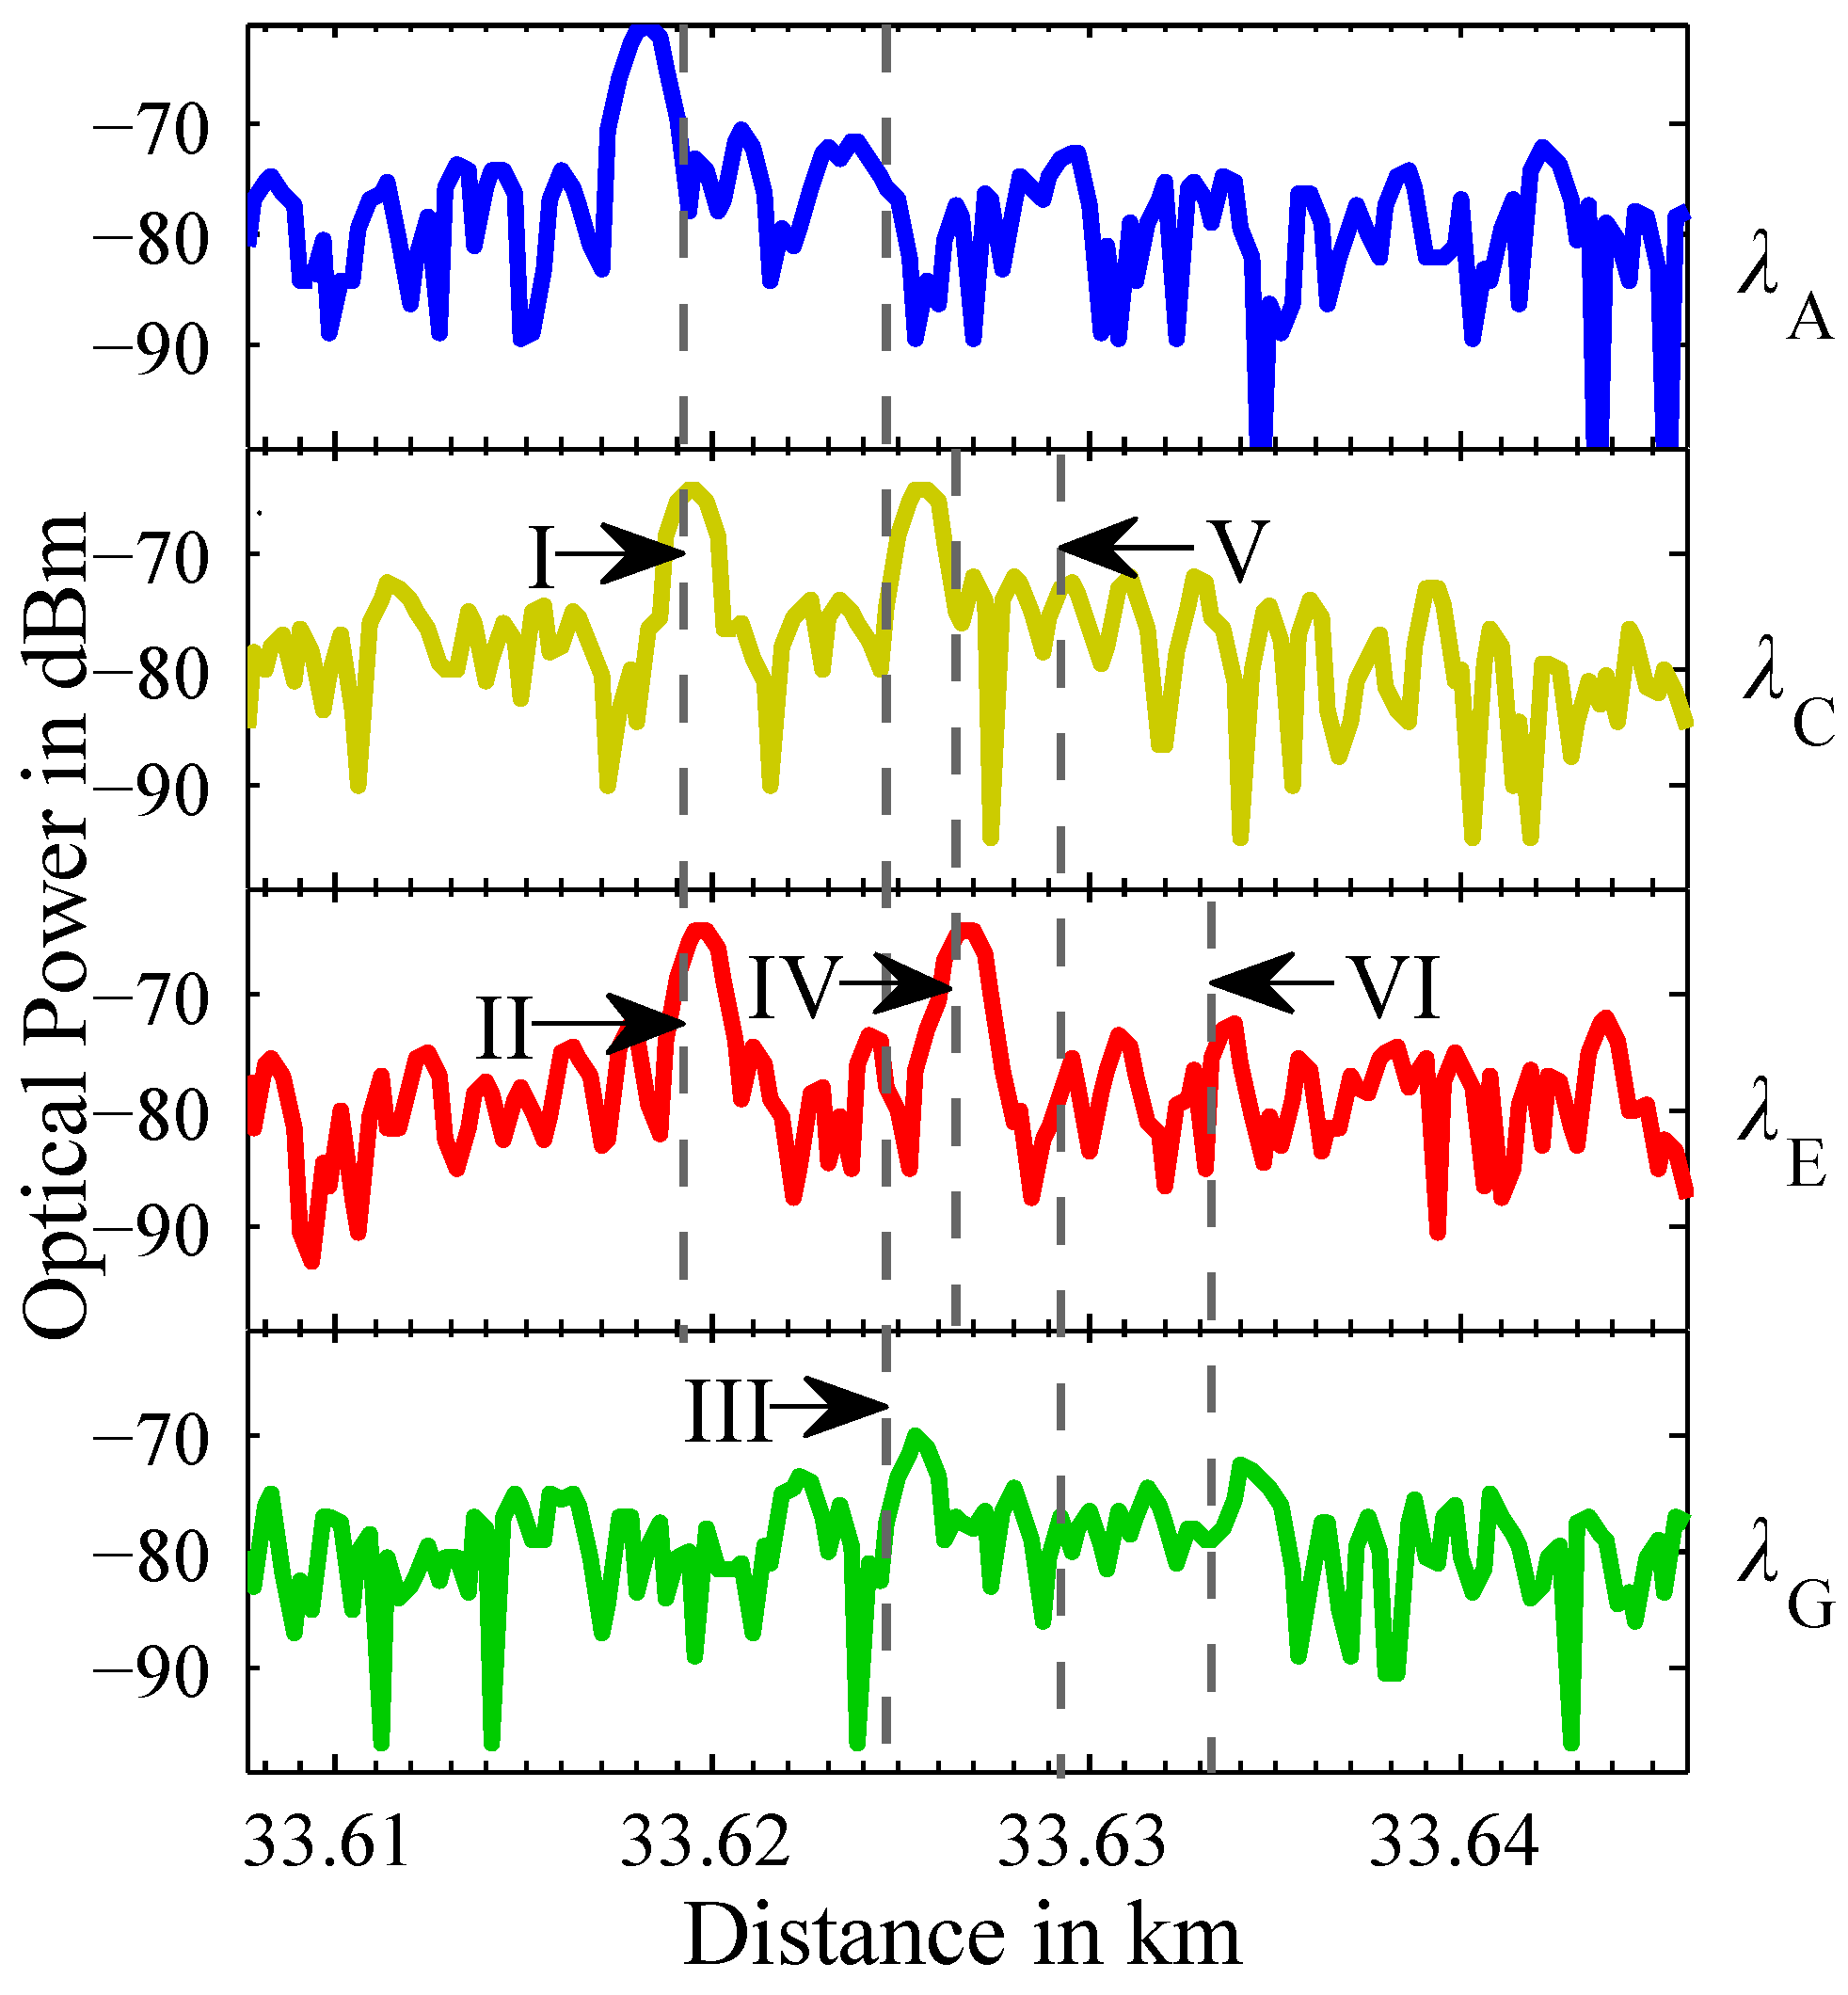
4.1. Single Impulse OTDR
The measurement result of the conventional single impulse OTDR technique is shown in
Figure 4 in comparison to Coding- and Chirp-OTDR techniques tested subsequently in this paper.
Figure 4.
Result of conventional single impulse OTDR measurement.
Figure 4.
Result of conventional single impulse OTDR measurement.
Subscribers I, II and IV are connected via a fiber connection implying 30 dB of one-way attenuation. The reflections of subscriber I ( and ), of subscriber II ( and ) both corresponding to a distance of 33.619 km and of subscriber IV ( and ) corresponding to a distance of 33.626 km exceed the reflected optical power of dBm and can easily be identified. Note the double reflection amplitude of the superposed reflections from the mirrors reflecting wavelength of subscriber I and II.
Subscribers V ( and ) and VI ( and ) cannot be identified due to the one-way attenuation of their connection of 36.6 and 34.6 dB, respectively. Subscriber III ( and ) is connected via a connection with 33.4 dB of one-way attenuation. Although a small reflection peak at is visible, the corresponding reflection at cannot be identified clearly.
Due to averaging, measurement results can be improved enough to detect subscribers connected via 30 dB of one-way attenuation. Although further improvements can be achieved by a higher number of averages, the measurement time increases severely, as each time the number of averages is doubled, the SNR increases by
or 1.5 dB [
18].
4.2. Simplex- and Golay-Coding OTDR
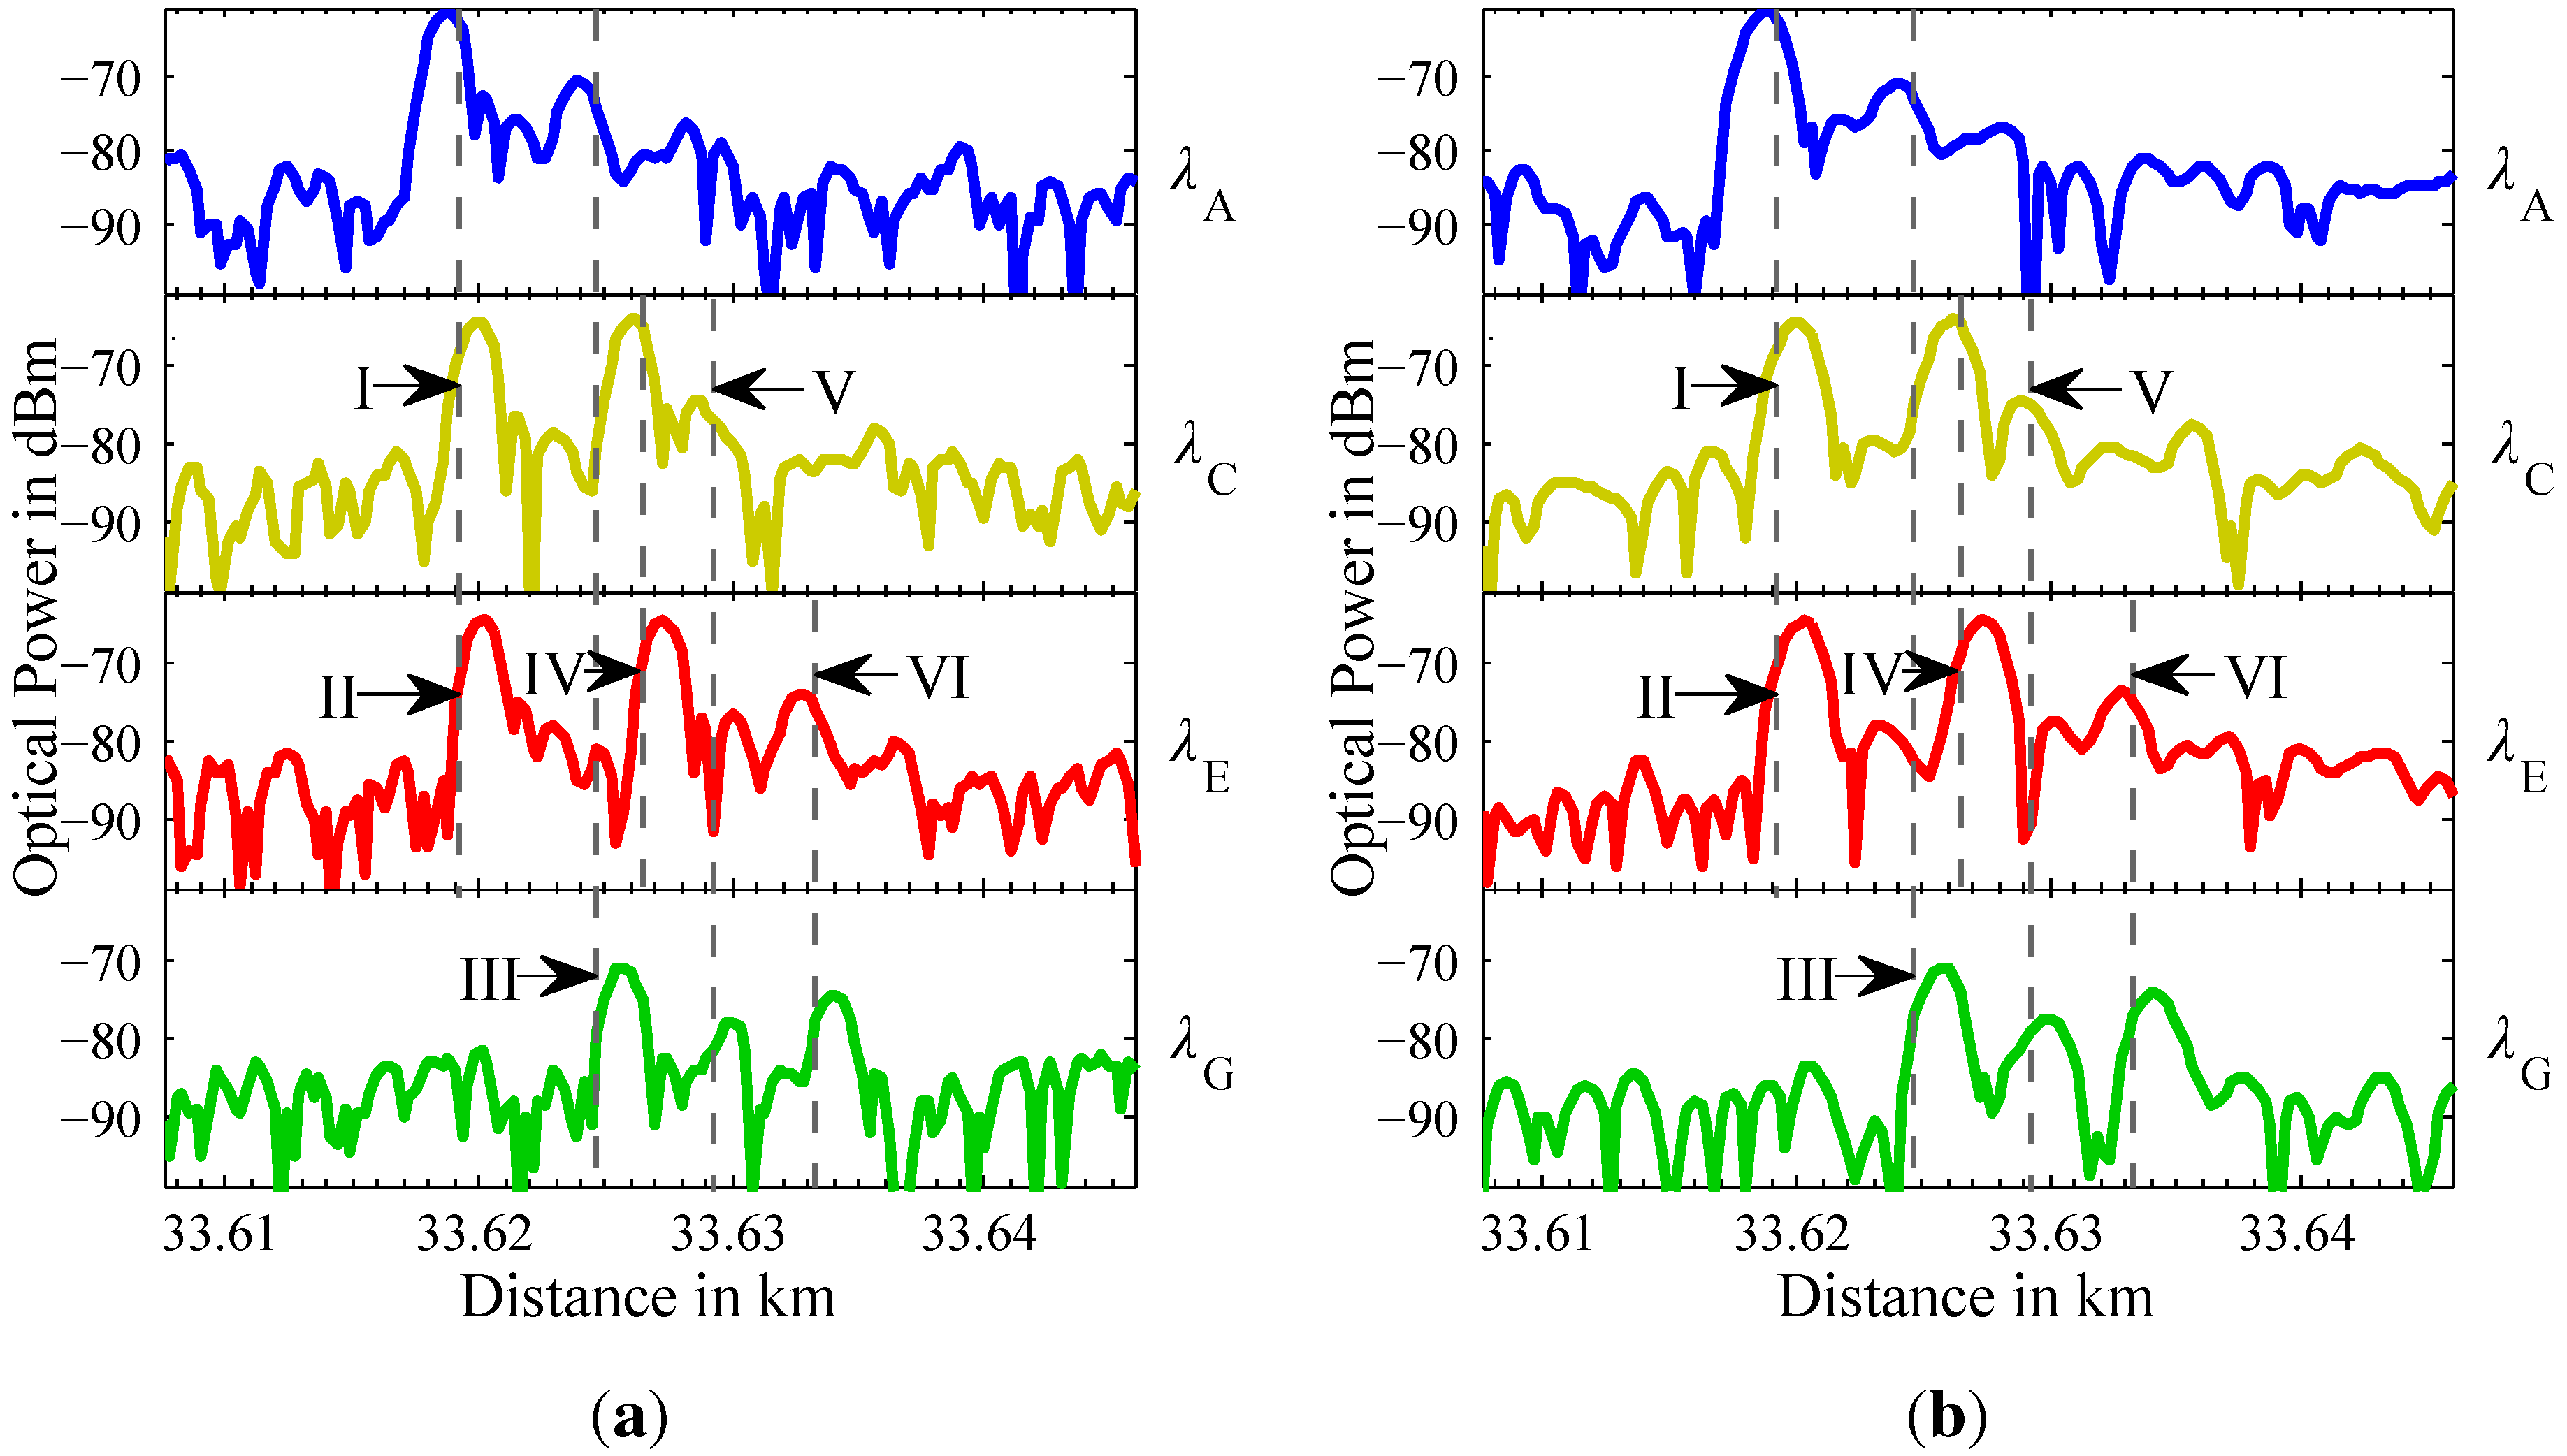
Both in the case of the single impulse measurement and using Simplex- and Golay-coding techniques, subscribers I, II and IV can easily be identified. The measurement results of a 255 bit Simplex-Code is depicted in
Figure 5(a). The measurement result of a 512 bit Golay-Code is depicted in
Figure 5(b).
Figure 5.
OTDR measurement results using (a) = 255 bit Simplex Code and (b) = 512 bit Golay Code.
Figure 5.
OTDR measurement results using (a) = 255 bit Simplex Code and (b) = 512 bit Golay Code.
With these techniques, an identification of subscriber III with reflections at and corresponding to a distance of 33.625 km is possible. The connection to subscriber III has a one-way attenuation of 33.4 dB. Subscriber VI ( and ) is connected via a connection with a one-way attenuation of 34.4 dB. Both coding techniques lower the noise level, enabling the identification of both reflections at and corresponding to a distance of 33.633 km.
The connection of subscriber V ( and ) possesses a one-way attenuation of 36.6 dB. In spite of the coding gain of both techniques, the reflection peaks at both wavelengths and are closer to the noise level than the subscribers connected with less attenuation. Although reflection peaks for subscriber V can be identified for both Simplex- and Golay-Codes, the 512-bit Golay-Code surpasses the 255-bit Simplex-Code in coding gain due to longer code length. This is the reason why the reflection peaks of subscriber V appear clearer in the plot for Golay-Codes compared to the plot for Simplex-Codes.
It becomes evident, that both coding techniques offer gains in addition to averaging that enable a subscriber identification for PONs of higher attenuation without hardware changes in the OTDR set-up.
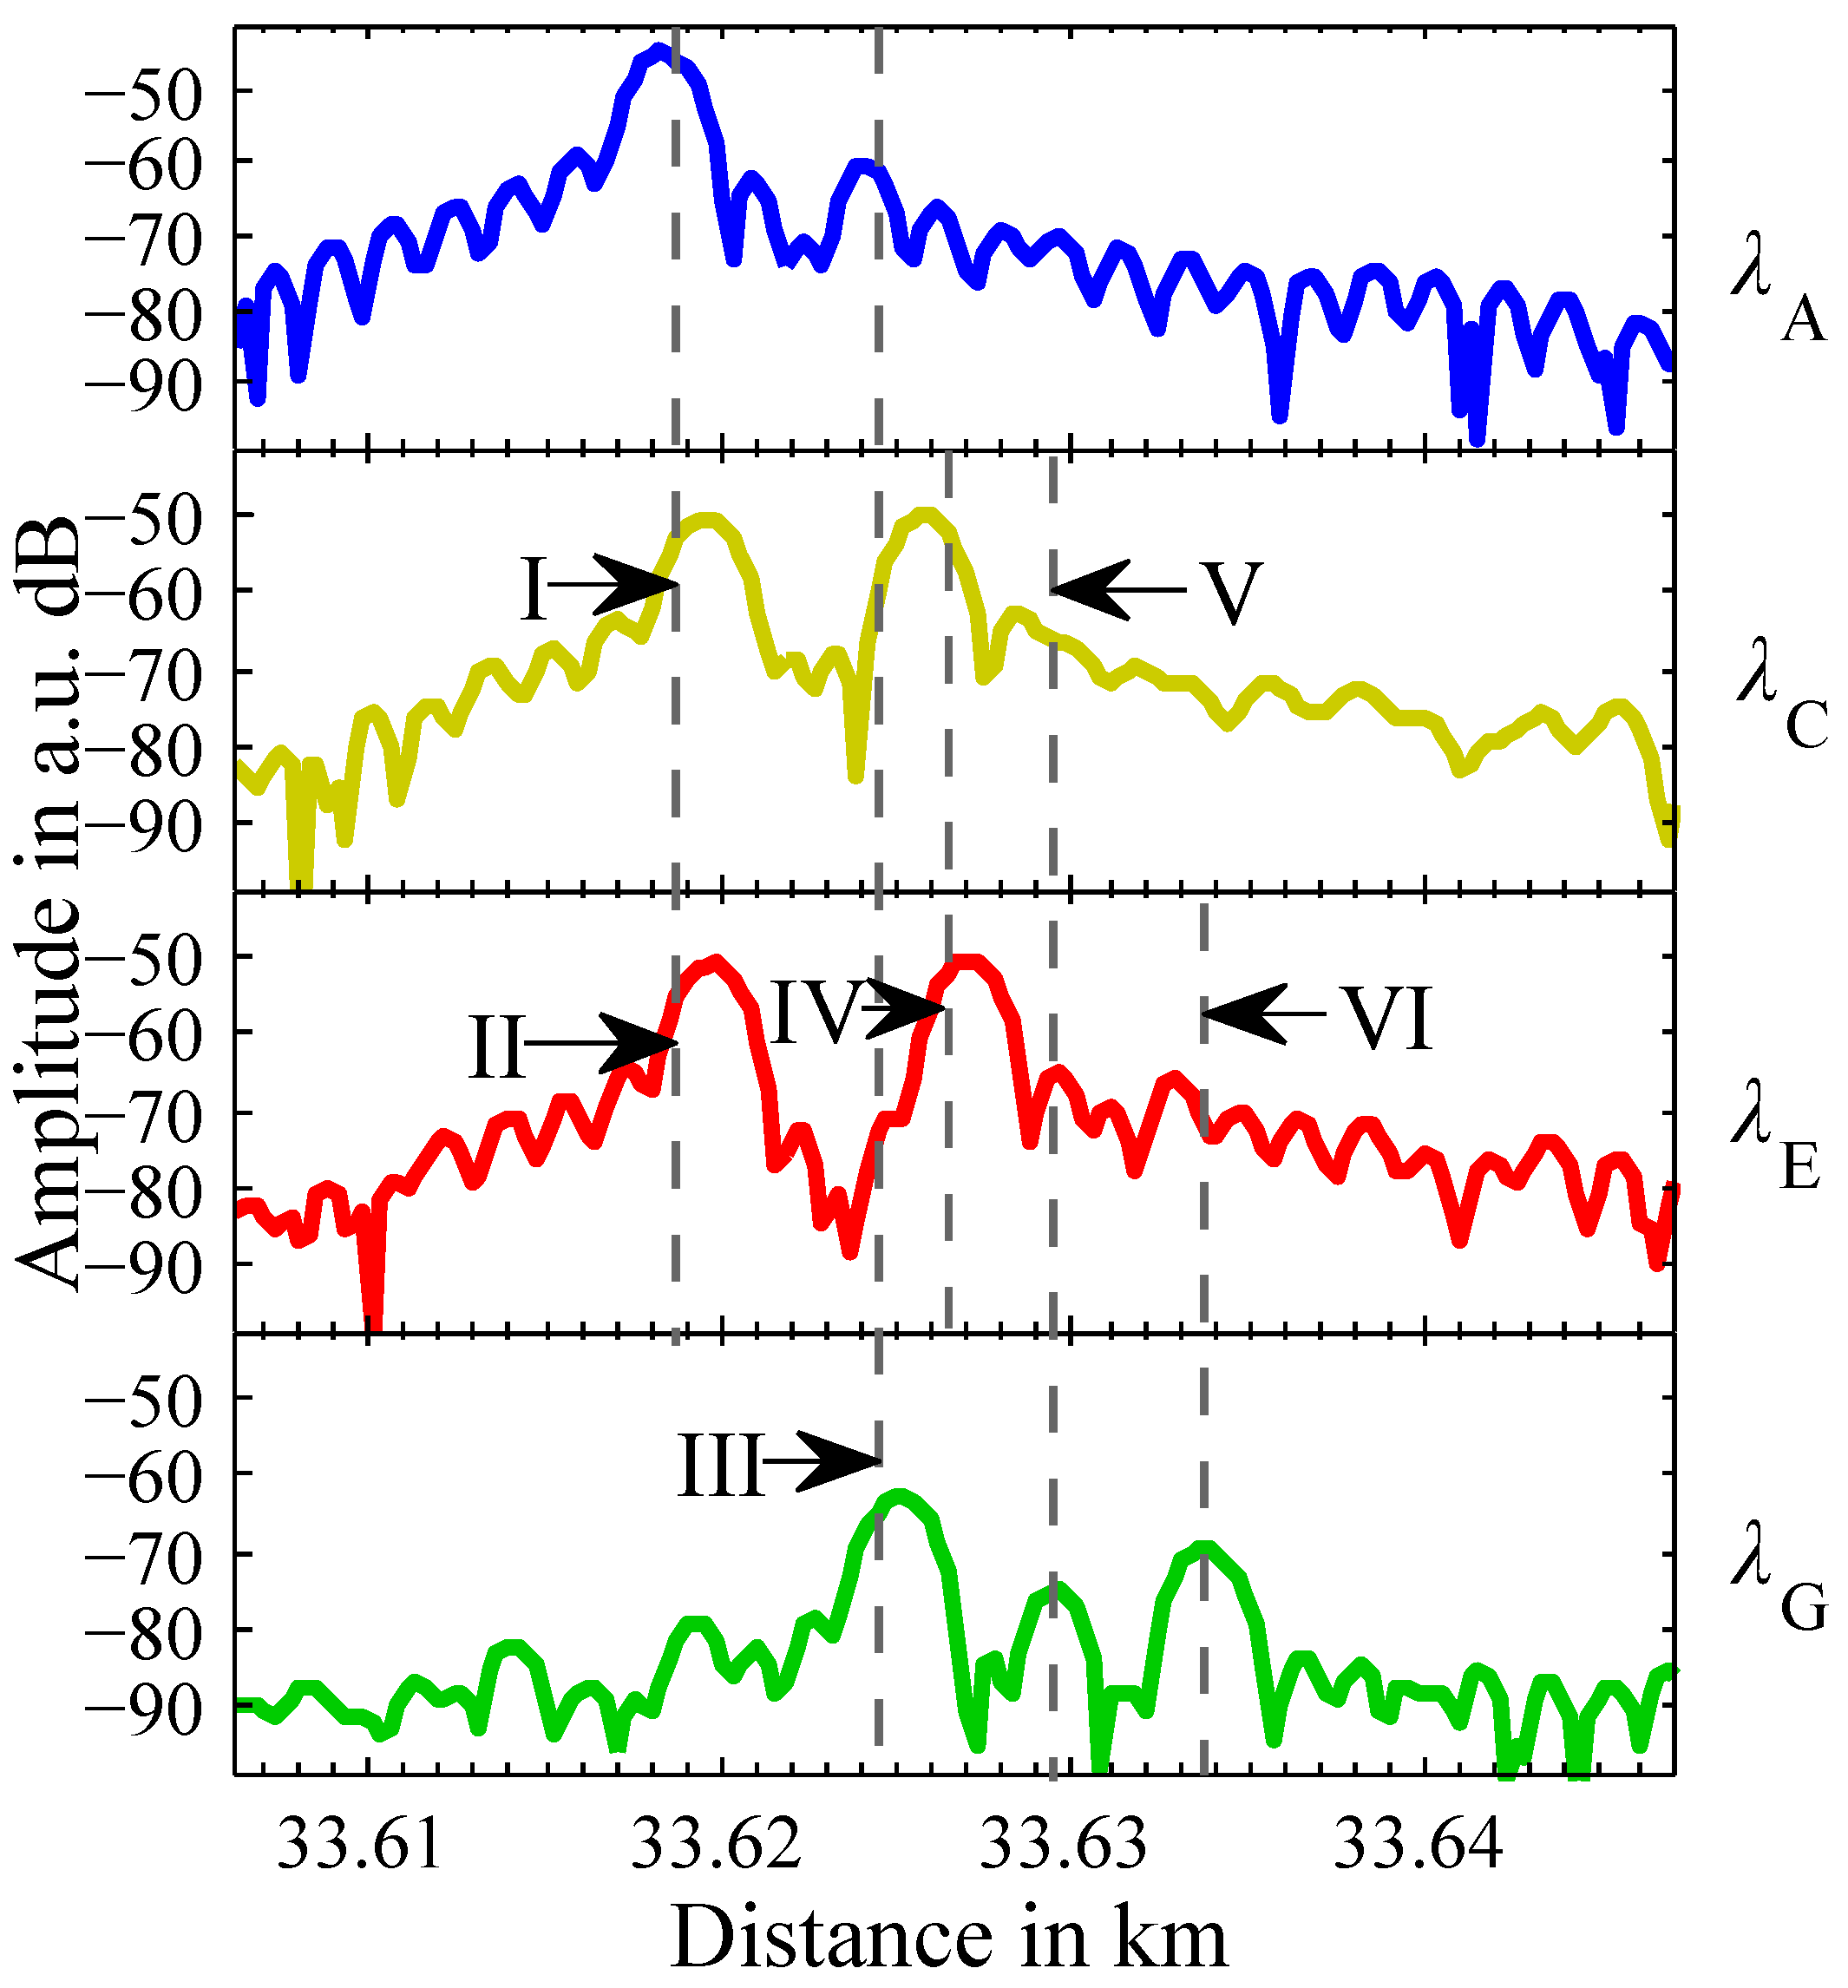
4.3. Linear-Frequency-Chirp OTDR
The measurement results acquired using the Linear-Frequency-Chirp OTDR are shown in
Figure 6. The vertical axis is proportional to the integrated Wigner distribution
from Equation (
5) in dB.
Subscribers I ( and ), II ( and ) and IV ( and ) can easily be identified.
All three weak reflections occuring at measurement wavelength belonging to subscribers III ( and ), V ( and ) and VI ( and ) are found. The reflections of subscribers III and VI can be identified clearly, the reflection of subscriber V is harder to detect, due to the connection via a one-way attenuation of 36.6 dB.
At only weak reflections occur due to attenuation of 33.4 dB or more in one-way. At other wavelengths, weak reflections are following stronger reflections. For subscribers III, V and VI, the effect of a weak reflection following a stronger reflection can be observed. For subscriber VI the corresponding reflection at can hardly be identified and for subscriber V the corresponding reflection at is also hard to be identified. For subscriber III the corresponding reflection is found at but does not clearly surpass the noise level.
To conclude, weak reflections can be identified, if no stronger preceding reflections are present.
Figure 6.
Results of Linear-Frequency-Chirp OTDR measurement.
Figure 6.
Results of Linear-Frequency-Chirp OTDR measurement.
4.4. Comparison of Results
The results of all OTDR techniques can be compared, because each measurement is performed under the same conditions. The optical input peak power is always 0 dBm and the number of averaged measurements is 16,384 for each measurement. A quantitative comparison can only be made between the impulse, Simplex- and Golay-Coding OTDR, because the nonlinear transformation, which is used with the Linear-Frequency-Chirp OTDR, distorts the shape of the reflections. Therefore the calculation of SNR is not applicable to the Linear-Frequency-Chirp OTDR measurement results. A qualitative comparison follows.
In
Figure 6 it can be seen that at wavelength
three reflections emerge. In
Figure 4, in which the results of the single impulse OTDR are shown, just one reflection is visible at the wavelength
. Hence, the Linear-Frequency-Chirp OTDR has a significant higher sensitivity than the single impulse OTDR.
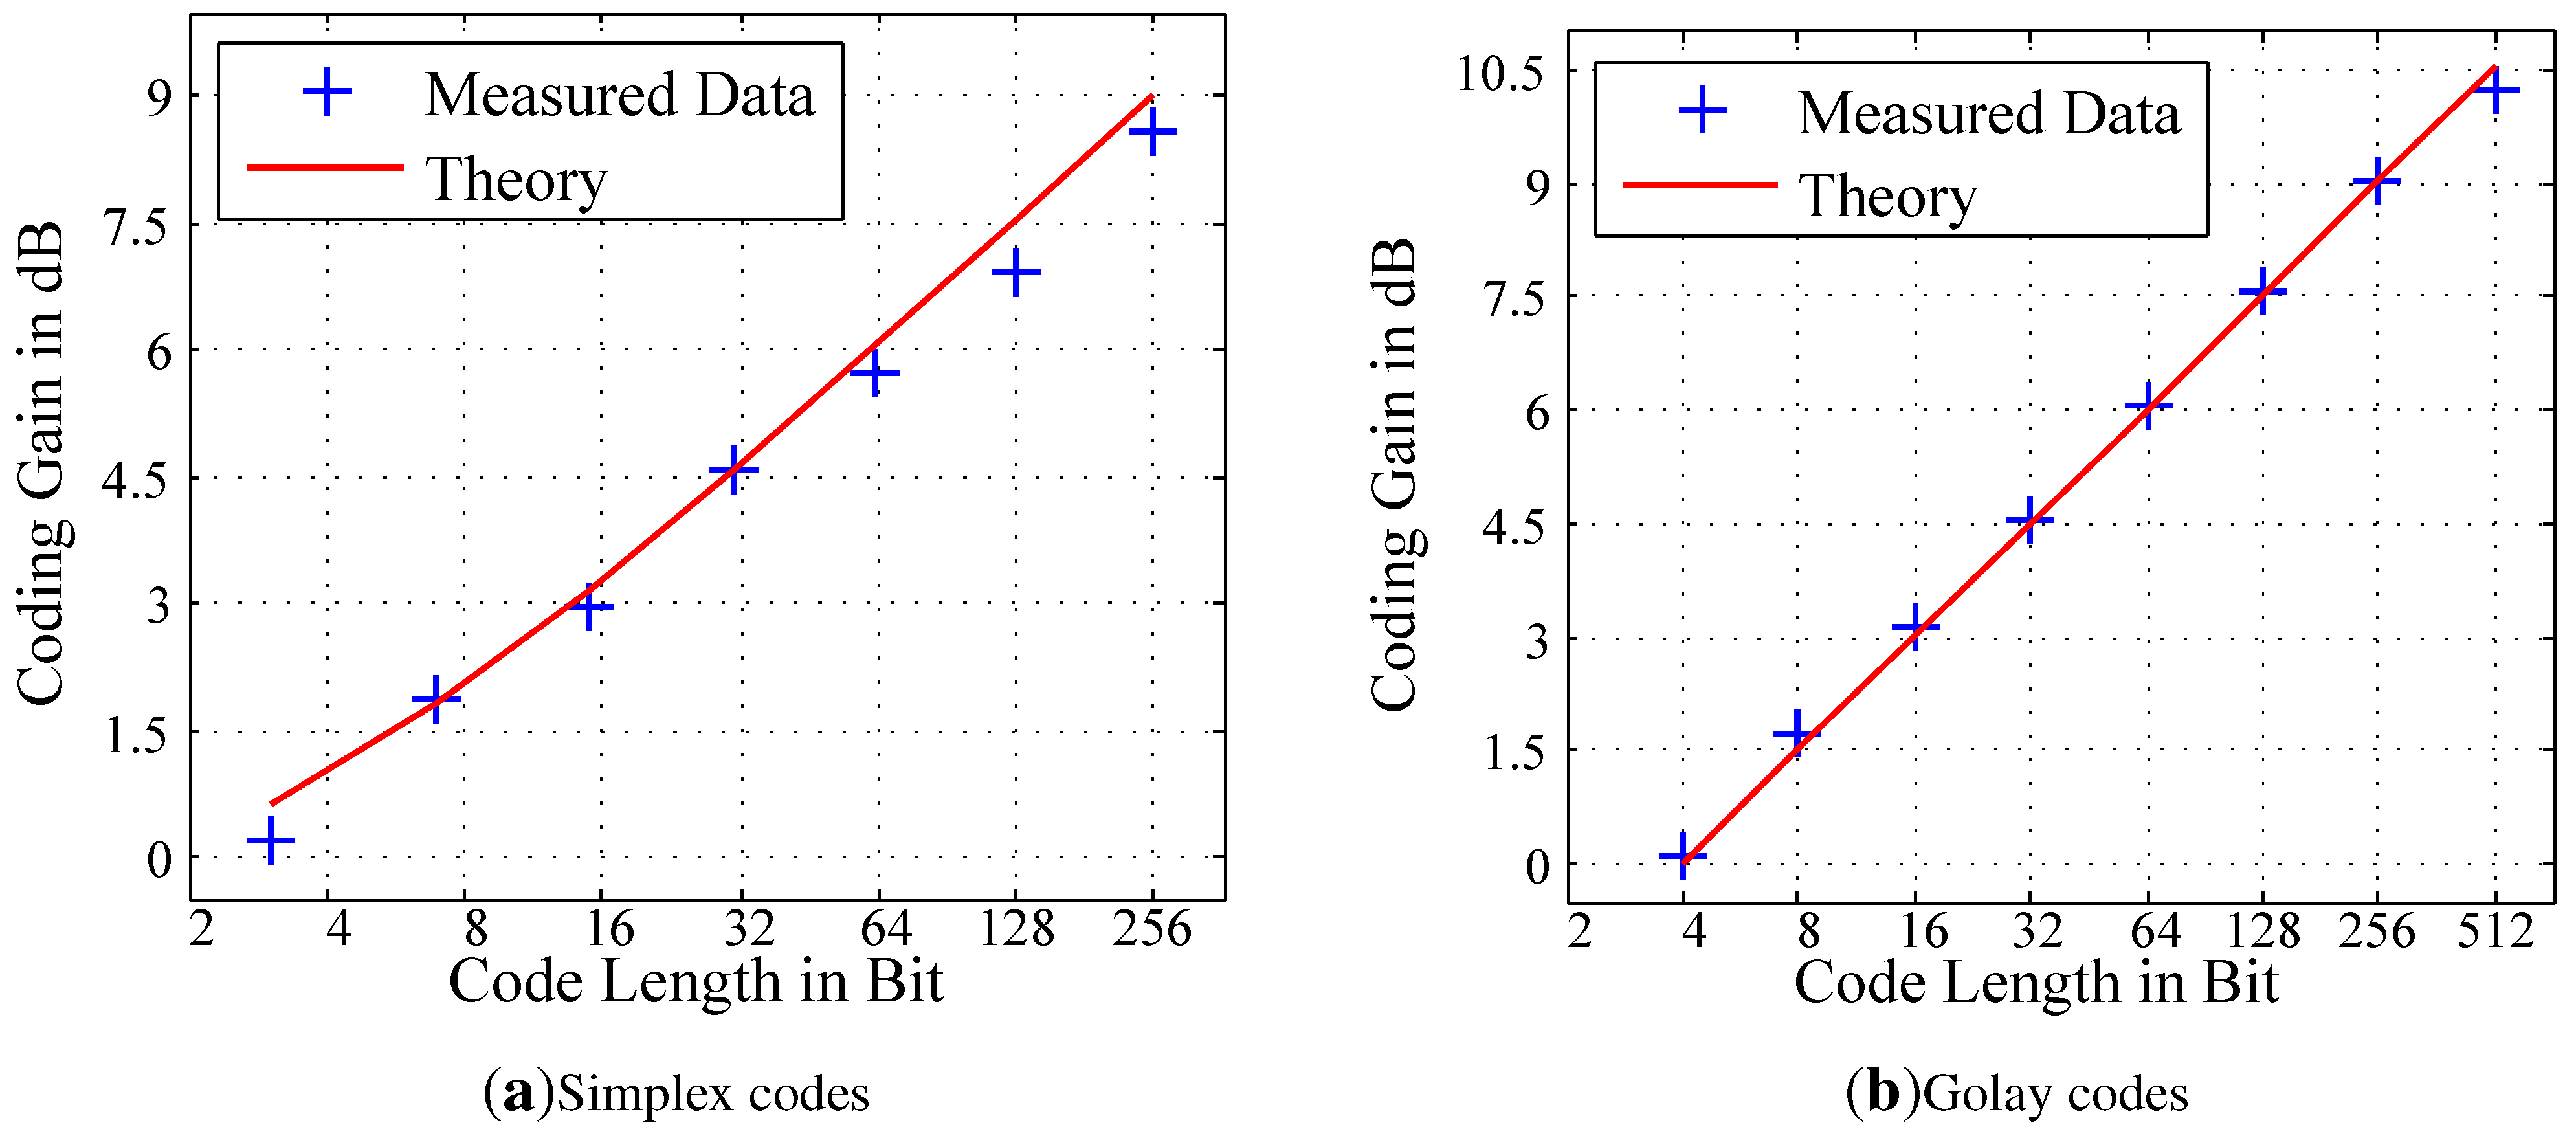
The results of the measurements, which demonstrate the SNR improvement due to coding, are shown in
Figure 7(a) and
Figure 7(b). Although the deviation of measured Golay coding gains compared to theoretical gains is less than the deviation of Simplex coding gains, all measurement results exhibit a close proximity to theoretical gains calculated by Equations (
1) and (
2). Maximum coding gain values achieved by measurements are 8.6 dB for Simplex codes and 10.2 dB for Golay codes.
Figure 7.
Comparison of theoretical SNR gain versus experimental SNR gain of (a) Simplex and (b) Golay Codes depending on the code length.
Figure 7.
Comparison of theoretical SNR gain versus experimental SNR gain of (a) Simplex and (b) Golay Codes depending on the code length.
The disadvantages of the Linear-Frequency-Chirp OTDR are the distortions of the shapes of the reflections due to the non linear transformation and small side lobes. The measurements with Simplex and Golay codes show nearly the same SNR improvements at similar code length. Simplex and Golay Code SNR enhancement techniques seem to be equally suitable for PON monitoring.
5. Conclusions
The PON monitoring concept based on combinations of cascaded wavelength-selective mirrors is intended to enable a unique subscriber identification. The mirrors feature a high reflectivity to enable monitoring in PONs with high attenuations and/or high splitting ratios.
We present measurement results employing four different OTDR SNR enhancement techniques including averaging of conventional single impulse OTDR, Golay Code OTDR, Simplex Code OTDR and a novel Linear-Frequency-Chirp OTDR. The latter three techniques showed significant SNR improvements compared to the conventional single impulse OTDR. The measurement set-up was tested for an identification of subscribers connected via different drop fiber losses, for which VOAs were used. The identification of a subscriber connected via 36.6 dB of one-way attenuation, which was not possible with the wavelength tunable single impulse OTDR and averaging, was enabled by using the wavelength tunable coding OTDR. All subscribers connected via one-way attenuations of 30.0, 33.4, 34.6 and 36.6 dB were successfully detected and identified. No dead-zone, that would mask weak reflections from subscribers connected via higher attenuations, following strong reflections was notable.
For example, a one way-attenuation of 36.6 dB corresponds to a 1:32-split PON reaching approx. 56 km, assuming a fiber loss of 0.34 dB/km for deployed standard single mode fiber (SSMF) and 17.5 dB insertion loss of a 1:32 passive optical power splitter. In this exemplary 32-split PON reaching 56 km, a successful subscriber identification is assumed due to identical attenuations as in our experiment.
The measurement results of the Linear-Frequency-Chirp OTDR shows small side lobes, which can be confused with smaller reflections. However, the Linear-Frequency-Chirp OTDR performs well if only weak reflections are present (cf. reflections at wavelength
in
Figure 6). The measurements were performed with a PON employing a high subscriber density of six subscribers within a range of 14 m. The spatial resolution of approx. 3.0 m was not affected by SNR enhancement techniques.
It was shown, that SNR enhancements can be achieved by implementing coding-techniques and the Linear-Frequency-Chirp-technique. The OTDR set-up enabled to switch between the following techniques: single impulse OTDR, coding OTDR or Linear-Frequency-Chirp OTDR. Coding-techniques can be implemented via software into an OTDR that features full control of the impulse sequences sent. This enables a monitoring of longer range and/or higher splitting factors without upgrading OTDR hardware.


