Article

Determination of Morphine and Its Metabolites in Human Urine by Capillary Electrophoresis with Laser Induced Fluorescence Detection Employing On-Column Labeling with a New Boronic Acid Functionalized Squarylium Cyanine Dye

by
Mahmoud M. Sebaiy
1,2,
Abdullah A. El-Shanawany
2,
Mohamed M. Baraka
2,
Lobna M. Abdel-Aziz
2,
Theresa A. Isbell
1 and
Christa L. Colyer
1,*
1
Chemistry Department, Wake Forest University, Winston-Salem, NC 27109, USA
2
Medicinal Chemistry Department, Faculty of Pharmacy, Zagazig University, Zagazig, Sharkia 44519, Egypt
*
Author to whom correspondence should be addressed.
Submission received: 29 October 2015 / Revised: 1 December 2015 / Accepted: 3 December 2015 / Published: 5 January 2016
(This article belongs to the Special Issue Electrophoretic Analyses in Capillaries and Microfluidic Devices)

Abstract

:
A novel method for the labeling and rapid separation of morphine, morphine-3-beta-d-glucuronide (M3G) and morphine-6-beta-d-glucuronide (M6G) in human urine employing a new boronic acid functionalized squarylium dye (SQ-BA3) and capillary electrophoresis with laser induced fluorescence detection (CE-LIF) is described. The spectrochemical properties, solution stability, pH range, and mechanisms for interactions with morphine and its metabolites were first established for SQ-BA3, followed by optimization of an on-column labeling procedure and CE-LIF method. SQ-BA3 itself was shown to be unstable and weakly fluorescent in aqueous buffers due to aggregate formation. However, SQ-BA3 showed a relative stability and dramatic increase in fluorescence intensity upon the addition of morphine, M3G, and M6G. Because of the low background fluorescence of this dye, on-column labeling was feasible, leading to a simple and rapid analytical method with the potential for clinical applications.

1. Introduction

Morphine is an opioid analgesic drug used for the treatment of moderate to severe pain. The primary metabolism pathway of morphine is by way of glucuronidation, where glucuronic acid is added at the 3- or 6-carbon of the molecule through UDP-glucuronosyltransferase-2B7 enzyme (UGT2B7) action in the liver, leading to formation of morphine-3-beta-d-glucuronide (M3G) and morphine-6-beta-d-glucuronide (M6G) [1]. M6G has been shown to exhibit activity at the µ-opioid receptor with a potency surpassing that of morphine, while M3G has no analgesic activity [2,3]. While there is some indication that M3G might be responsible for the side effects felt after treatment [4], other studies suggest that it is a functional antagonist of morphine and M6G [5]. Normorphine is another minor inactive metabolite and represents 5% of the initial dosage [6]. There is also evidence of a diglucuronide species, morphine-3,6-diglucuronide; however, the presence of this metabolite has only been documented in urine [7].
Screening for morphine and its major metabolites, M3G and M6G, can be conducted by various methods. In general, biological samples are preferably screened by chromatographic methods, especially HPLC with ultraviolet-visible absorbance (UV/Vis), diode array, fluorescence, electrochemical, or mass spectrometric (MS) detection, or some combinations thereof [8,9,10,11,12]. Although capillary electrophoresis (CE) is a rapidly growing analytical technology, there are only limited publications documenting its use for the analysis of morphine alone [13] or in combination with other opiates [14,15,16]. Most recently, our laboratory has developed the first highly selective CE-MS method suitable for quantitation of morphine along with its isobaric glucuronide metabolites M3G and M6G in human urine samples [17]. Whereas the coupling of CE with MS detection provides for sample identification and low limits of detection, the necessary instrumentation is expensive and highly specialized, and so is perhaps less suitable for rapid screening assays than simpler yet still selective laser-induced fluorescence (LIF) detection methods. LIF is an attractive detection method, having advantages of minimal background, increased sensitivity and selectivity relative to absorbance detection.
LIF typically requires natively non-fluorescent analyte samples to be made fluorescent through some labeling procedure. In particular, noncovalent fluorescent labels can offset some of the additional challenges of sample derivatization prior to detection, since these labels typically offer the convenience of fast reaction times under a variety of aqueous solution conditions, and so they open up the possibility of on-column labeling schemes accompanying CE-based assays. For example, our laboratory has successfully developed noncovalent labeling procedures for a wide range of bioanalytes ranging from proteins to intact microbes using new squarylium dyes [18,19,20,21], and so, in the present work, we sought to likewise use a novel boronic acid functionalized squarylium dye, “SQ-BA3”, as a fluorescent label for morphine and its major metabolites, M3G and M6G, in human urine samples using CE-LIF for separation and quantitation.
Squarylium dyes are a particular class of cyanine dyes that were first synthesized almost 50 years ago [22,23] by way of the condensation of squaric acid with two aromatic and/or heterocyclic compounds to yield 1,3-disubstituted dye structures. These dyes exhibit effective light absorption and are resistant to photodegradation, and they have been used in organic solar cells and optical recording media, and as photoconductors in copier machines [24,25,26]. These dyes have also found analytical applications as noncovalent fluorescent probes for proteins including human serum albumin (HSA), bovine serum albumin (BSA), β-lactoglobulin and trypsinogen in fluorometric and CE studies [27,28,29,30]. By incorporating a boronic acid moiety into the squarylium dye structure, it is possible to introduce selectivity towards sugar-based analytes, which may interact with the dye not only via nonselective hydrogen bonding, hydrophobic, and/or electrostatic forces but also via a more selective, reversible cyclic cis-diol esterification reaction [31,32].
In an effort to establish a broader range of possible applications for boronic acid functionalized squarylium dyes, we explored the effects of solution conditions on interactions of SQ-BA3 with morphine, M3G and M6G, as described herein. Buffer composition and pH were shown to impact the stability of the dye-analyte complex and its emission properties. By optimizing these experimental parameters, we could develop suitable on-column labeling protocols for the simultaneous detection of morphine and its isobaric glucuronide metabolites M3G and M6G by a rapid and efficient CE-LIF method. Although the sensitivity of this method does not rival that of CE-MS, it does illustrate the utility of the method as a possible screening tool for small molecule drugs and drug metabolites, with the possibility of extension to other analytes in this class.

2. Materials and Methods

2.1. Reagents, Buffers, and Sample Solutions

A sample of SQ-BA3 dye (Figure 1) was synthesized through condensation of 1-(3-boronobenzyl)-2,3,3-trimethyl-3H-indolium bromide with 3-(4-ethylmethylaminophenyl)-4-hydroxycyclobut-3-ene-1,2-dione [32].
Figure 1. Molecular structure of SQ-BA3 (C31H31BN2O4, M.Wt. = 507.68 g/mol).
Separations 03 00001 g001
A 4.00 × 10⁻⁴ M stock solution of SQ-BA3 was prepared by weighing out an appropriate amount of solid dye and dissolving this in DMF, dimethylformamide (Fisher Scientific, Fair Lawn, NJ, USA). The dye stock solution was stored in the dark at 4 °C, under which conditions it was stable for several months or longer. For this reason, all dye solutions were stored this way. A working solution of the dye was prepared by further dilution of the stock solution in DMF to a concentration of 1.00 × 10⁻⁴ M just before use. Aliquots of this working solution were added to the appropriate buffer to serve as the background electrolyte (BGE) solution for CE studies. However, the final dye concentration was 1.00 × 10⁻⁶ M for spectral studies and up to 5.00 × 10⁻⁶ M for CE optimization studies.
Morphine, M3G and M6G standards (1 mg/mL in methanol) were used as received from Cerilliant (Round Rock, TX, USA). Morphine and M6G samples were stored at −10 °C and M3G was stored at 4 °C when not in use. Working solutions of drug standards for spectral and CE-LIF studies were prepared by dilution of the certified analytical standards with MilliQ distilled, deionized water (Millipore, Bedford, MA, USA) to the desired concentration of 5.00 × 10⁻⁴ M just before use.
Buffers for spectral and CE-LIF studies were prepared by dissolving the appropriate quantity of reagent citric acid (Sigma Aldrich, St. Louis, MO, USA), tris (hydroxymethyl) aminomethane (AMRESCO, Solon, OH, USA) or ammonium dihydrogen phosphate (JMC, Royston, Hertfordshire, UK) in MilliQ distilled, deionized water prior to pH adjustment by the addition of 1 M NH4OH or 1 M HCl (Fisher Scientific, Pittsburgh, PA, USA). For some CE-LIF studies, phytic acid sodium salt (Sigma Aldrich, St. Louis, MO, USA) was added to the separation buffer to a concentration of 10 mM. All buffers were stored in high density polyethylene plastic bottles at room temperature for 1–2 weeks, and were filtered through 0.20 μm nylon syringe filters (VWR International, Houston, TX, USA) prior to use.
For spectral studies, drug-dye solution mixtures were prepared by adding 5.00 μL of the 1.00 × 10⁻⁴ M solution of SQ-BA3 to a 500 μL quartz cuvettes. Some volumes of morphine, M3G and M6G working stock solution were then added to this aliquot of dye, along with sufficient buffer to achieve the final desired concentrations of both drugs and dye. The final volume for all solutions was 500 μL and the total organic solvent content in aqueous buffer solutions was kept below 10% (v/v).

2.2. Human Urine Sample Preparation

Normal human urine samples were obtained from Fisher Scientific (Pittsburgh, PA, USA) and were certified to be drug- and disease-free. Urine samples were kept frozen (−20 °C) before use, and were then stored at 4 °C between uses. For CE-LIF studies, urine samples were prepared by centrifugation at 500 rpm for 5 min using a 100-K molecular weight cutoff centrifugal Nanosep device (Pall Life Science, Ann Arbor, MI, USA) to remove large proteins. Filtered urine samples were then diluted 1:10 in high purity water before spiking with morphine, M3G and M6G standards to achieve the desired concentration of the drug or metabolite in urine. Final concentrations ranged from 3.50 × 10⁻⁴ M–1.75 × 10⁻³ M for morphine, 2.50 × 10⁻⁴ M–1.25 × 10⁻³ M for M3G, and 1.00 × 10⁻³ M–1.75 × 10⁻³ M for M6G.

2.3. Instrumentation

CE-LIF studies were conducted using a Beckman Coulter P/ACE MDQ capillary electrophoresis instrument (Beckman Coulter, Brea, CA, USA) equipped with an external LIF detector module with a 635 nm diode laser (2.5 mW; Oz Optics, Ottawa, ON, Canada) and a 655 nm emission band-pass filter. Uncoated fused-silica capillary (Polymicro Technologies, Phoenix, AZ, USA) was employed for all separations, with optimized dimensions of 50 μm (ID) × 365 μm (OD) × 70 cm (total length) × 60 cm (effective length, inlet-to-detector). Each new length of capillary was conditioned by sequential pressure flushes (at 20 psi) with water (20 min), 1 M sodium hydroxide (20 min), water (20 min), and finally separation buffer (30 min). Prior to sample analysis at the start of each day, the capillary was subjected to a similar conditioning cycle, but pressure flushes were reduced to 10 min (water, 1 M NaOH, water) and 20 min (separation buffer). Between each run, the capillary was pressure flushed with water and buffer for 1 min and 2 min, respectively. Samples were injected by pressure at 5 psi for 10 s, and analyses were conducted using an applied separation voltage of 30 kV. The temperature of the capillary, buffer, and sample were held constant at 25 °C.
Fluorescence spectra were recorded using a Perkin-Elmer Luminescence Spectrometer (Shelton, CT, USA). Excitation and emission slit widths were 10 nm; the excitation wavelength (as specified in Table 1) was selected according to the wavelength of maximum absorbance for the sample or solution under consideration; and the emission wavelength range was scanned from 640 nm to 800 nm at a rate 250 nm/min. Fluorescence spectra of the free dye and mixtures of the dye with morphine (or morphine metabolites) were measured using a 1-cm, semi-micro (500 µL) quartz cuvette (Perkin-Elmer).
Table 1. Absorbance (λex) and fluorescence (λem) properties for boronic acid functionalized squarylium dye (SQ-BA3) (1.00 × 10⁻⁶ M) with and without added morphine, morphine-3-beta-d-glucuronide (M3G), and morphine-6-beta-d-glucuronide (M6G) (5.00 × 10⁻⁴ M) in dimethylformamide (DMF) and various aqueous buffer systems (25 mM).
Solvent or BufferSQ-BA3 AloneSQ-BA3 with MorphineSQ-BA3 with M3GSQ-BA3 with M6G
λex (nm)λem (nm)λex (nm)λem (nm)% Fluorescence Enhancementλex (nm)λem (nm)% Fluorescence Enhancementλex (nm)λem (nm)% Fluorescence Enhancement
DMF631661N/AN/AN/AN/AN/AN/AN/AN/AN/A
Ammonium Citrate (pH = 3.50)6206596216594.05%62066014.33%6226593.90%
Tris-HCl (pH = 7.50)6196606216606.10%6226617.79%6236606.10%
Ammonium Phosphate (pH = 9.50)61865761965818.20%62165923.45%6216596.20%
Ammonium Phosphate (pH = 11.30)6176596196608.05%6196599.52%6186594.8%
Absorbance studies were conducted over a scan range of 500–800 nm with an integration time of 0.5 s and an interval of 1 nm using a Hewlett Packard HP8453 UV/Vis spectrometer (Waldbronn, Germany) and a 1-cm semi-micro 500 µL) quartz cuvette (Perkin-Elmer).

3. Results and Discussion

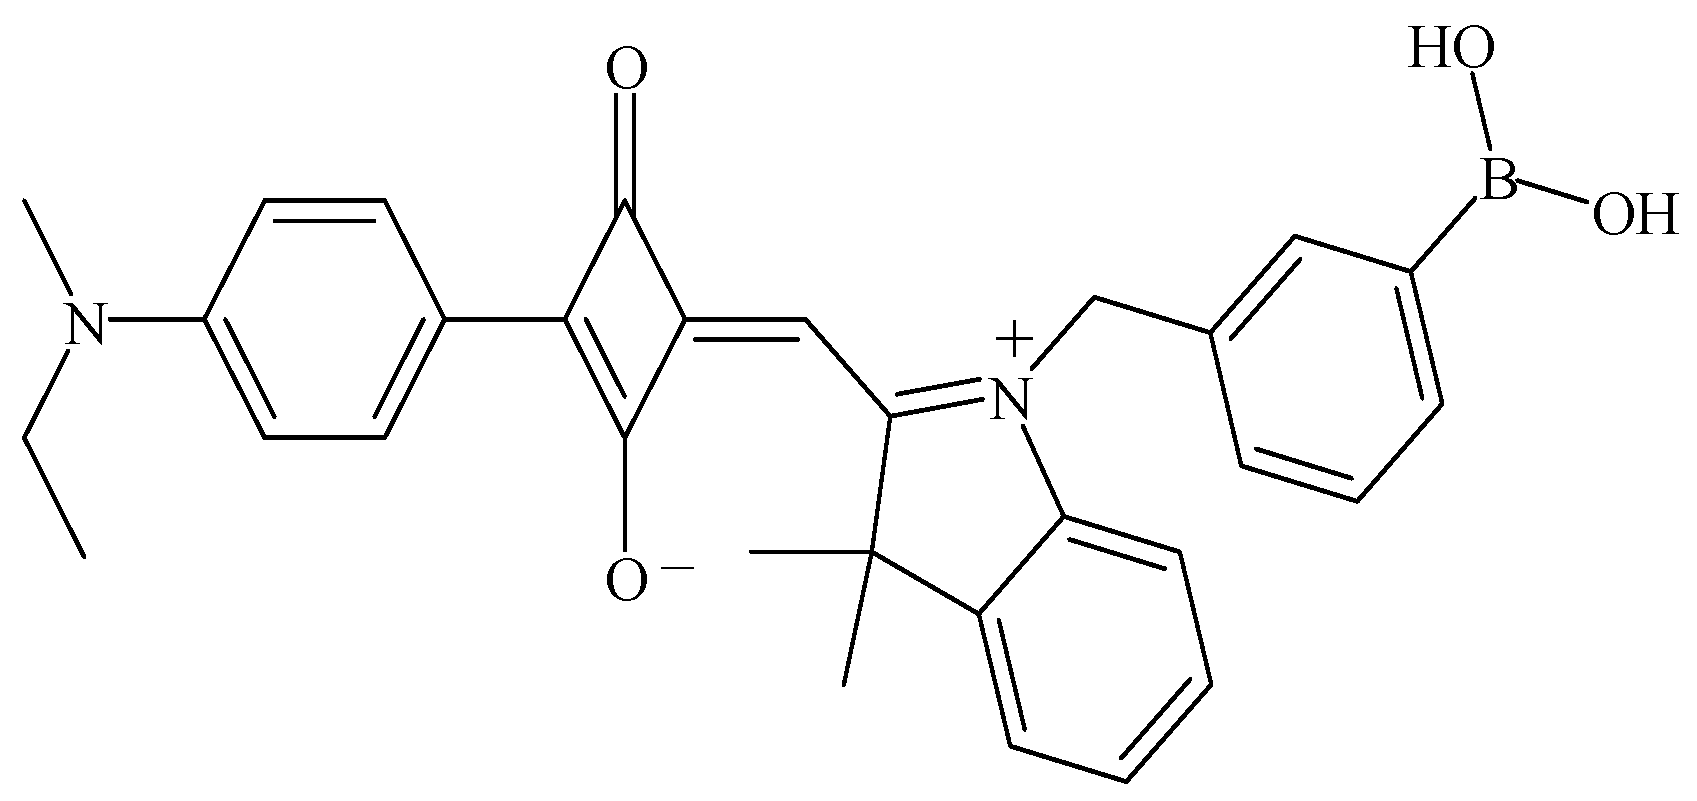
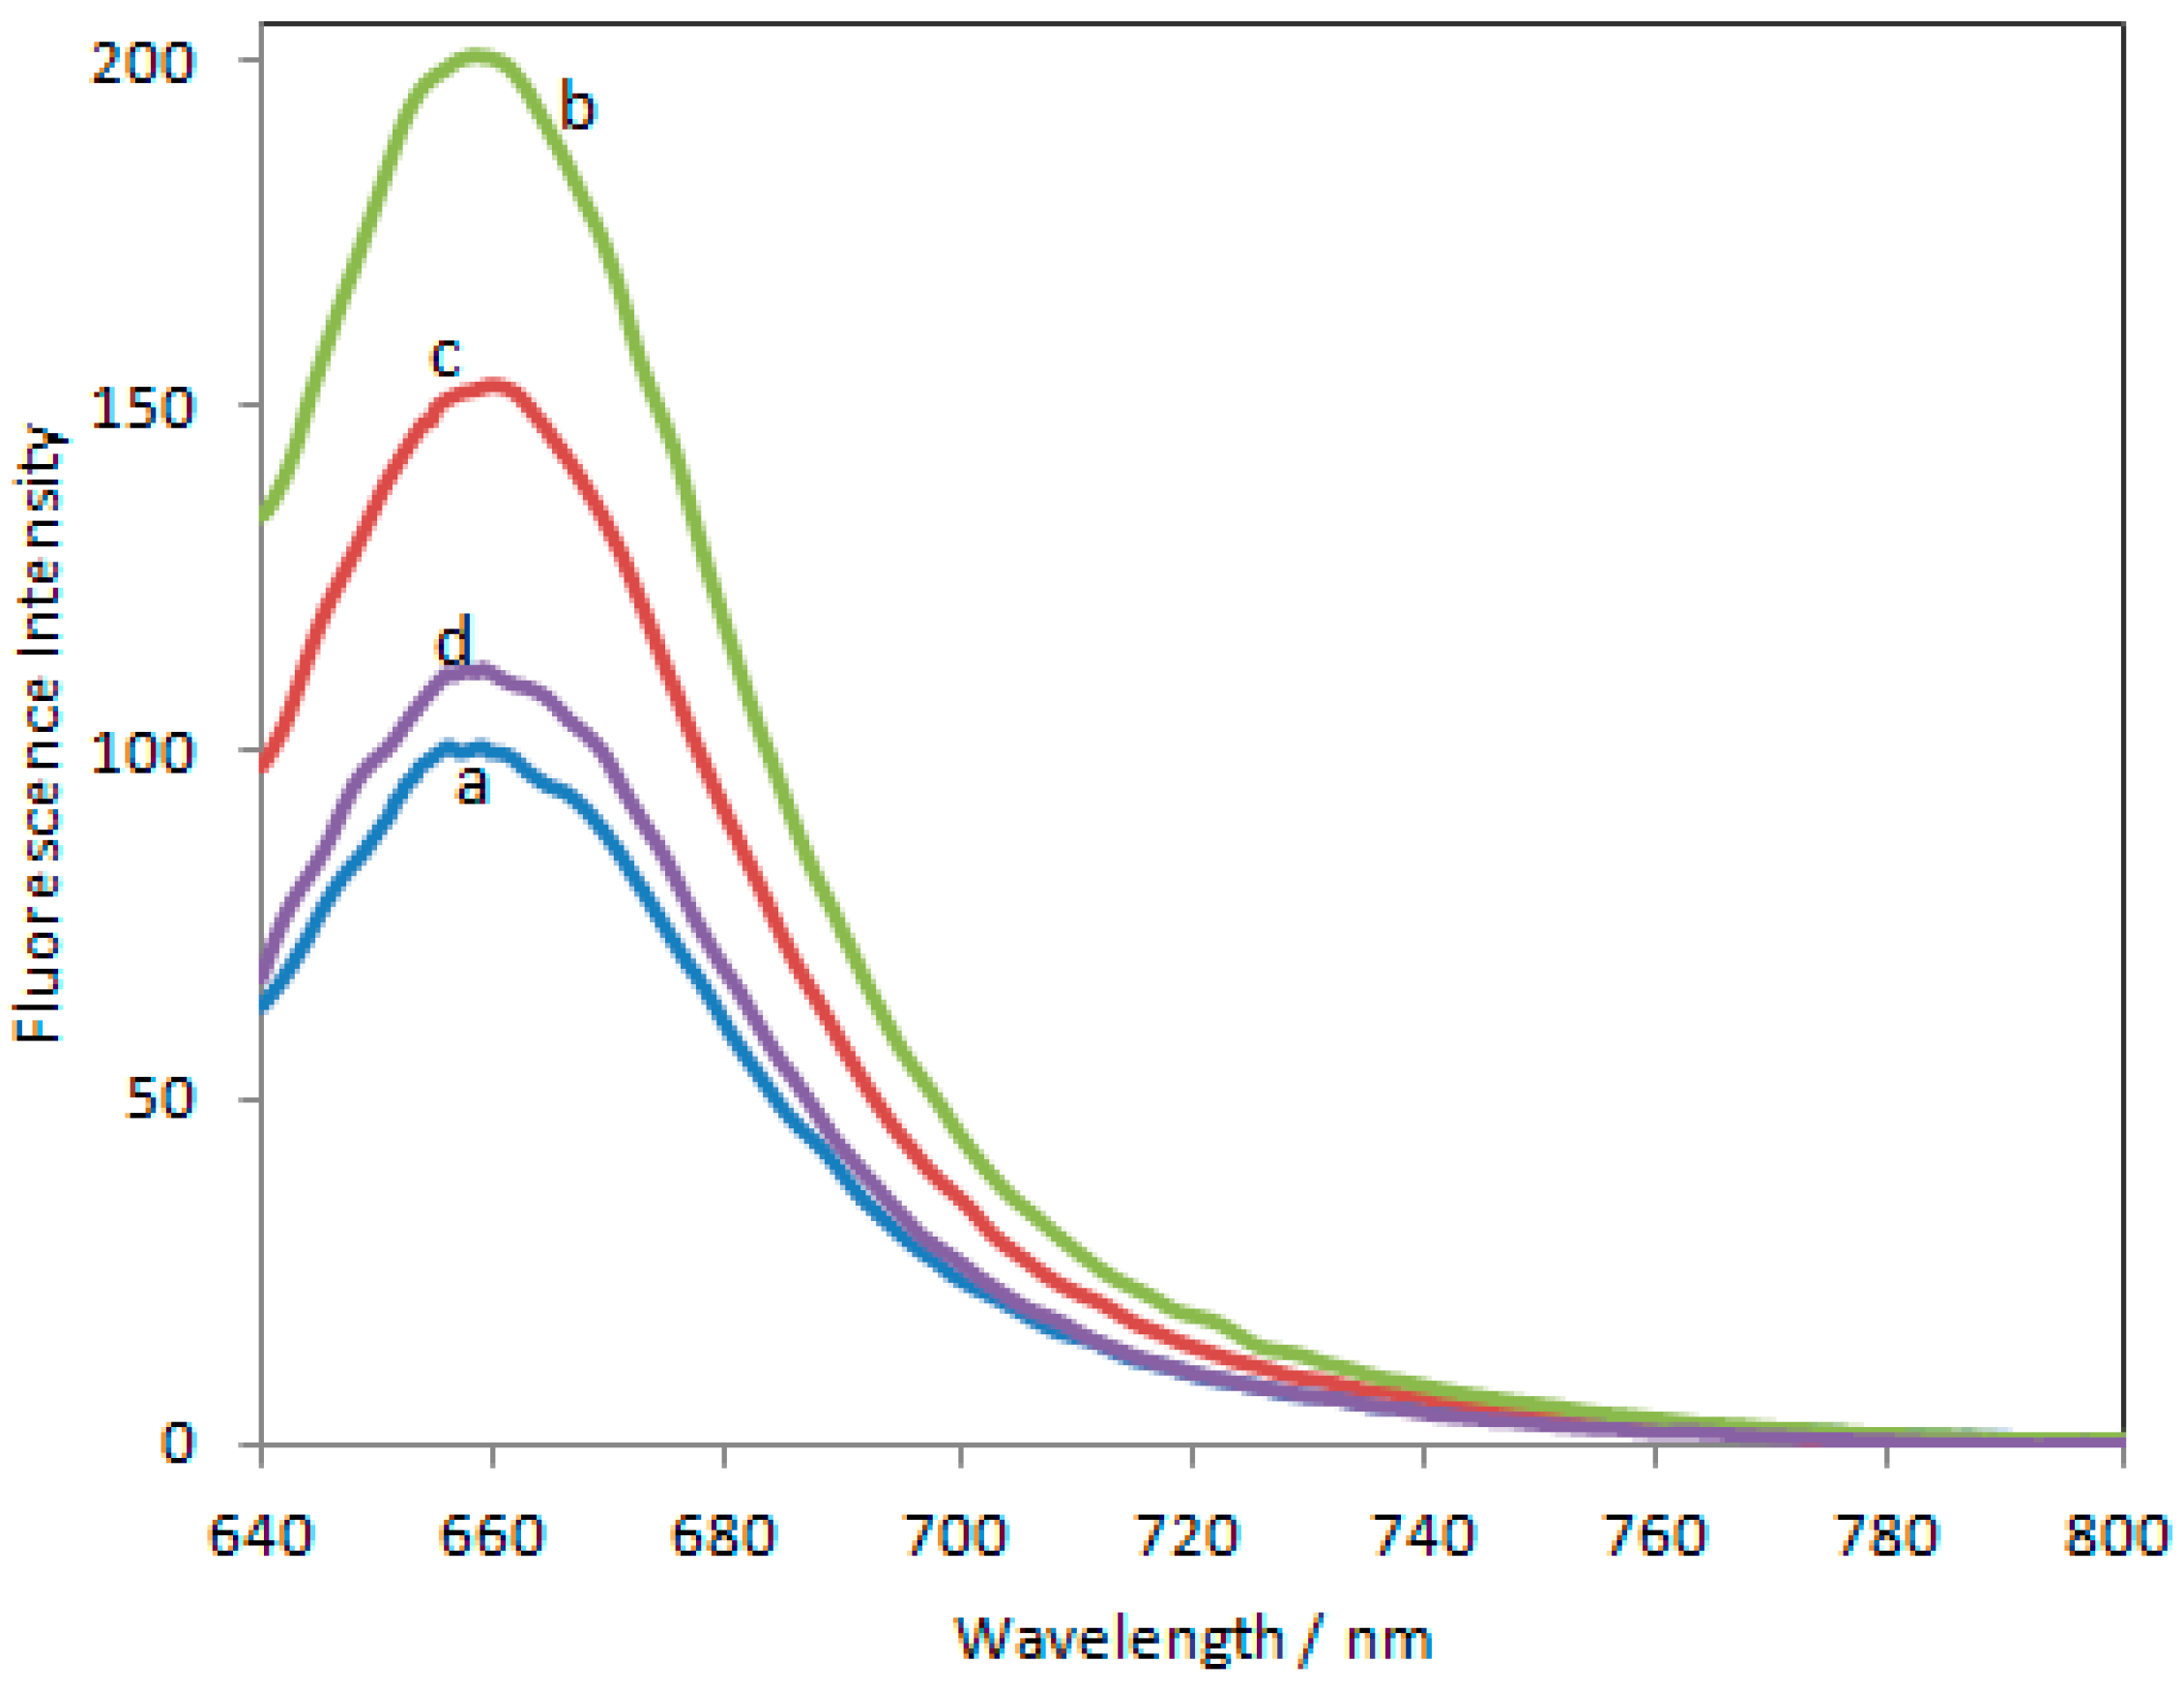
3.1. Spectral Properties of SQ-BA3 Alone and with Morphine, M3G, and M6G

Spectral properties of the novel squarylium dye SQ-BA3 were determined under various solution conditions in order to assess its suitability as a fluorescent probe for morphine and its glucuronide metabolites. The absorbance maximum for SQ-BA3 alone in aqueous buffer systems was slightly blue-shifted relative to the dye’s response in DMF. Broad absorbance bands and hypsochromic shifts attributable to the formation of water-soluble dye aggregates have been reported by others [33,34], and this result for SQ-BA3 is also in agreement with the spectral behavior previously observed in our laboratory for SQ-BA [31]. According to Figure 2, SQ-BA3 showed a sharp band at 550–680 nm with an intense maximum absorption at 631 nm as shown in Figure 2a (most likely due to soluble monomer) in DMF solvent, while a broadened band at around 500–750 nm was blue shifted by 12 nm (at 619 nm) with much lower absorption value of the free squarylium dye aggregates in ammonium phosphate buffer as seen in Figure 2b. This blue shift observed for the dye alone in aqueous buffer relative to the dye alone in DMF suggests that the aggregates in aqueous solution are H-type (parallel) as opposed to J-type (head-to-tail), as described by Fukuda and Nakahara [35]. An H-type aggregate would be formed by association of the terminal, pendant ethyl and methyl groups on one SQ-BA3 molecule with those on another SQ-BA3 molecule, which is more plausible than their association with the hydrophilic boronic acid group on another molecule of the dye (which would characterize a J-type aggregate). However, the absorbance was slightly enhanced after addition of M3G, morphine and M6G with maximum absorption at 622, 621 and 623 nm, repectively (Figure 2c–e).
Figure 2. Absorption spectra for the free SQ-BA3 dye (1.00 × 10⁻⁶ M) and its complex with morphine, M3G and M6G (5.00 × 10⁻⁴ M each): (a) free dye in DMF; (b) free dye in buffer; (c) dye with M3G in buffer; (d) dye with morphine in buffer; (e) dye with M6G in buffer. [Ammonium phosphate buffer, 25 mM, pH 9.50].
Separations 03 00001 g002
Dye concentration and aggregation studies were performed only at pH 7.50, which was deemed to be the optimal for the dye itself as reported by Ouchi et al. [32]. Increasing the dye concentration from 5.00 × 10⁻⁷ M to 4.00 × 10⁻⁶ M did not appear to affect the aggregation state of the dye, since this resulted in a linear increase in absorbance according to Beer’s Law (see Supplementary Data, Figure S1). However, fluorescence emission of the dye was saturated above a concentration of 1.00 × 10⁻⁶ M (see Supplementary Data, Figure S2). Dye aggregation may be responsible for such saturation.
A summary of the absorbance (λabs) and fluorescence emission (λem) properties of the dye, with and without added morphine, M3G, and M6G in DMF and various aqueous buffer systems is presented in Table 1.
According to Table 1, a large Stokes shift (of approximately 40 nm) was observed for SQ-BA3 (with or without added analyte) in each of the solvent systems tested. Such a shift provides good analytical discrimination between excitation and emission signals, thus allowing for more sensitive detection. The fluorescence background arising due to a 1.00 × 10⁻⁶ M solution of SQ-BA3 alone was greatest under basic pH conditions, which parallels the effect of solution pH on the fluorescence of a boronic acid functionalized squaryium dye SQ-BA in prior studies from our lab [20]. However, even under these conditions, the observed enhancement in fluorescence upon the addition of high concentrations of morphine analytes (5.00 × 10⁻⁴ M) suggests that this functionalized squarylium dye (or some variant of the dye) may, indeed, be suitable for pharmaceutical detection or screening.
The greatest fluorescence enhancements (calculated as the difference between emission intensities in the presence and absence of analyte divided by the emission intensity of dye alone) were observed for SQ-BA3 with added morphine, M3G or M6G under basic pH conditions (for example, in ammonium phosphate at pH 9.50, as illustrated in Figure 3, and Table 1 where the best fluorescence enhancements were highlighted in bold). Furthermore, the concentration of buffering species, however, had no impact on fluorescence enhancements. For example, increasing the concentration of ammonium phosphate (pH 9.50) from 25 mM to 100 mM did not yield any further enhancement of the fluorescence emission of the SQ-BA3 dye.
Figure 3. Emission spectra for free SQ-BA3 dye (1.00 × 10⁻⁶ M) with or without added opioid standards (5.00 × 10⁻⁴ M each) in ammonium phosphate buffer (25 mM, pH 9.50). (a) Dye alone; (b) with M3G; (c) with morphine; (d) with M6G.
Separations 03 00001 g003
According to the table, it was noted that the fluorescence enhancement observed for SQ-BA3 with added M6G (+6.20%) was significantly lower than with added M3G (+23.45%) in 25 mM ammonium phosphate buffer (pH 9.50), despite the fact that these two metabolites are isomers of one another and so might be expected to respond similarly in the presence of the dye. Chromatographic behavior of these isomers has indicated a difference in their relative polarities, with M3G demonstrating more polar character than M6G [36]. Thus, the more polar character of M3G seems to favor interaction with the SQ-BA3 dye, perhaps through enhanced dipole-dipole or hydrogen bonding interactions. With its pKa value near 8 [37], morphine would exist largely in its neutral or negatively charged state in the ammonium phosphate buffer (pH 9.50), which may favor its electrostatic interaction with the SQ-BA3 dye.
The absence of a significant shift in the wavelength of maximum absorbance of the metabolite-dye complex (621 nm) and the morphine-dye complex (619 nm) relative to the free dye (618 nm) in phosphate buffer (pH 9.50) suggests that the dye is not necessarily forming a covalent complex with the analyte via boronate esterification. Such a reaction would be expected to result in the disaggregation of the dye in aqueous solution, which would, in turn, be expected to result in the absorbance maximum of the dye-analyte complex more closely resembling that of the free dye in its disaggregated state, as it exists in DMF (λabs = 631 nm). Since neither morphine nor its glucuronide metabolites possess cis-diol functionalities, it is not surprising that these analytes lack specific covalent interactions with the SQ-BA3 dye. Even in the absence of specific covalent interactions, evidence of dye-analyte interaction is clearly provided by the significant change in the emission of the dye-analyte complex relative to the emission of the free dye as monitored by fluorimetry.

3.2. Stability of SQ-BA3 Solutions

Since the solubility and stability of many fluorescent dyes in aqueous solution is poor [38], we prepared a concentrated stock solution of SQ-BA3 in DMF prior to mixing it with analyte standards or samples. The stability of the dye alone and of mixtures of the dye with opioid analytes diluted in 25 mM ammonium citrate (pH 3.50), 25 mM Tris-HCL (pH 7.50), or 25 mM ammonium phosphate (pH 9.50 and 11.30) buffers was investigated over a one-week period, during which time the samples were stored in quartz cuvettes. Previous work with the related, unfunctionalized dye SQ-BA revealed that adsorption of the dye onto glass or polypropylene vessel walls during storage could result in decreased fluorescence emission over time [31]. The stability of aqueous solutions of SQ-BA3 (1.00 × 10⁻⁶ M) alone and with added morphine, M3G, or M6G (5.00 × 10⁻⁴ M) was monitored by fluorimetry. Despite using only quartz wares, which minimizes adsorption of the dye on its walls, the fluorescence signal of SQ-BA3 alone decreased by 50% within the first 24 h after dilution with 25 mM ammonium citrate buffer (pH 3.50) or with 25 mM Tris-HCL buffer (pH 7.50). Beyond this initial 24-h period, the signal remained stable (with no further decrease in fluorescence emission) for up to one week. However, the addition of morphine or M3G to these SQ-BA3 solutions resulted in the stabilization of the fluorescence emission (no reduction in RFU) for up to 72 h, whereas the addition of M6G resulted in the same decrease in fluorescence (50%) observed for the dye alone over this same period of time. These observations would suggest that both morphine and M3G interact more strongly with SQ-BA3 than does M6G (in agreement with spectral studies, vide supra), and that such interactions to form dye-analyte complex can prevent fluorescence degradation by offering some protection for the dye against hydrolysis, aggregation, etc.
Under basic solution conditions, the dye alone was less stable than under acidic and neutral solution conditions. The fluorescence signal of SQ-BA3 alone rapidly degraded to just 50% of its original value within the first 6 h after dilution with 25 mM ammonium phosphate buffer, and to just 10% of its original value within 48 h. In this basic buffer, the addition of M3G offered no further stabilization of the fluorescence signal, and the addition of morphine or M3G provided less of a stabilizing influence than in acidic and neutral buffers where the fluorescence signal was degraded to 60% and 30% of its original value after 6 h and 48 h, respectively.
These stability studies confirmed the relatively weak interaction of M6G with SQ-BA3 compared to interactions of morphine and M3G with the dye. Additionally, these studies served to inform optimal solution and sample handling procedures for the analytical studies to follow. It should be noted that, due to the dye instability, and, in particular for the case of on-column labeling of morphine analytes, the calibration curves were recorded using dye-buffer mixtures prepared freshly between runs to avoid decreased absorbance readings due to dye degradation.

3.3. Optimization of CE-LIF Methods for Morphine and Its Metabolites

Solution conditions leading to optimal fluorescence enhancement for SQ-BA3 with the opioid analytes being considered herein were then transposed to a CE-LIF platform to serve as a starting point for analytical separation method development. High efficiency CE-based separation methods are ideal for the determination of closely related analytes, such as the isobaric glucuronide metabolites of morphine. As previously established in our laboratory [17], a number of different background electrolytes at pH 9.50 led to baseline resolution of morphine, M3G, and M6G by CE, and although ammonium borate was found to be ideal for the separation of analytes in our prior work, ammonium phosphate was also found to be suitable, and so in the present work, we employed phosphate buffers rather than borate buffers for CE-LIF studies to eliminate any possible competitive reactions with the boronic acid functionalized SQ-BA3 dye. Additionally, the wide buffer capacity range of ammonium phosphate enables us to determine the most suitable pH for separation. Furthermore, the chosen ammonium phosphate buffer was to be used as a part of an on-column labeling scheme for CE-LIF analysis in the present work, whereby a fixed concentration of SQ-BA3 (1.00 × 10⁻⁶ M) was added to the separation buffer to provide for fluorescent tagging of the analytes during separation, thus eliminating the need for more complicated sample derivatization steps prior to analysis. The benefits of on-column fluorescent labeling schemes for CE-LIF are well established, including reduced sample handling, reduced total analysis time, and enhanced signal [30]. Additional parameters to be optimized for this chosen buffer system for on-column labeling and analysis of morphine, M3G, and M6G included pH, concentration of background electrolyte and dye, and the utility of buffer additives (specifically, phytic acid), while CE parameters to be optimized included applied voltage and capillary dimensions.
Whereas it was found that 25 mM ammonium phosphate buffer adjusted to pH 9.50 provided the greatest fluorescence enhancement for 1.00 × 10⁻⁶ M SQ-BA3 with 5.00 × 10⁻⁴ morphine, M3G, or M6G (see Section 3.1), these buffer conditions did not permit the resolution of a mixture of opioid analyte standards when employed for CE-LIF analysis with on-column labeling. Using this buffer system, morphine, M3G, and M6G standards comigrated at 4.16 min (data not shown). Buffer pH was adjusted incrementally from 8.00 to 10.50 with no improvement in separation. A detailed pH study conducted previously for CE-MS studies [17] revealed that baseline resolution of morphine, M3G, and M6G could be achieved with an ammonium phosphate buffer over a very narrow pH range only (from 8.70–10.30). The fact that buffers within this range did not yield baseline separation of opioid analyte standards in the present work can be attributed to the presence of SQ-BA3 in the buffer (as required for on-column labeling in CE-LIF) in the present work. The presence of the dye will affect the ionic strength of the buffer and, hence, the electroosmotic mobility. In addition, it will affect the electrophoretic mobility of the analytes by virtue of its association with the analytes to form fluorescent complexes for detection by LIF. As such, buffer conditions suitable for CE-MS analysis may not be directly transferrable to CE-LIF systems.
To improve resolution, we explored the use of the buffer additive, phytic acid. Phytic acid contains six phosphate groups bound to a hexane ring, with pKa values ranging from 1.90 to 9.50 [39]. It is a nontoxic, naturally occuring phosphate source, which has been shown to improve CE-based separations by ion-pairing interactions [40]. Phytic acid concentrations in the running buffer were varied from 0 to 20 mM. Morphine, M3G and M6G were not resolved with phytic acid concentrations less than 5 mM. Complete resolution was achieved with 10 mM phytic acid but only when the buffer pH was increased to 10.50. Resolution was retained at higher concentrations of phytic acid, but migration times were increased, so 10 mM phytic acid was deemed optimal. A representative electropherogram with peaks for M6G, morphine, and M3G at 2.56, 3.15 and 3.79 min, respectively, is shown in Figure 4a. The identity of each peak was verified by spiking a known amount of each analyte into the mixture.
Other aspects of the buffer composition, including buffer concentration and concentration of added SQ-BA3, were studied to determine their effect on the CE-LIF determination of morphine, M3G and M6G. Increasing the buffer concentration from 10–100 mM has the effect of decreasing the rate of electroosmotic flow, which was seen as a net increase in migration time for the analytes in this study. Upon consideration of not only migration time and resolution, but also peak shape and signal intensity, these studies indicated an optimal buffer concentration of 25 mM ammonium phosphate (with 10 mM phytic acid buffer additive). The concentration of dye added to the separation buffer to facilitate on-column labeling can affect not only the sensitivity of the method but also the overall rate of electroosmotic flow and hence, the resolution of the method. Optimization of dye concentration must, therefore, be conducted for any given assay. This was done by keeping the amount of morphine (5.00 × 10⁻⁴ M) injected onto the column constant while varying the concentration of dye in the run buffer. When the SQ-BA3 dye concentration was doubled from 1.00 × 10⁻⁶ M to 2.00 × 10⁻⁶ M, the peak area of the complex did not increase. However, when the dye concentration was further increased to 5.00 × 10⁻⁶ M, the peak area of the dye-morphine complex decreased (see Supplementary Data, Figure S3). This effect may have been due to increased background or greater adsorption of dye to the inner wall of the capillary, thus reducing analyte signal. Thus, 1.00 × 10⁻⁶ M dye in the optimized separation buffer (25 mM ammonium phosphate at pH 10.5, with 10 mM phytic acid) provided the best compromise between background signal from free dye and fluorescence enhancement of analyte-bound dye.
Figure 4. Electropherograms demonstrating on-column labeling of a mixture of morphine standards including morphine ◊, M3G ■ and M6G ● (5.00 × 10⁻⁴ M each) by CE-LIF using a 25 mM ammonium phosphate buffer (pH 10.50) containing 10 mM phytic acid and 1.00 × 10⁻⁶ M SQ-BA3. (a) Mixture of opioid standards pepared in water; (b) Normal human urine sample, diluted 1:1 in water and spiked with opioid standards; (c) Normal human urine sample, diluted 1:10 in water and spiked with opioid standards. Electropherograms offset for clarity. Capillary: 50 μm ID, 70 cm total length and 60 cm effective length; a separation voltage of 30 kV; capillary and sample temperatures were at 25 °C and injection was by pressure (5 psi for 10 s).
Separations 03 00001 g004
Having thus optimized CE buffer conditions for separation and detection of morphine and its metabolites, we set out to optimize CE operational parameters including separation voltage and capillary dimensions. Although baseline resolution of the morphine, M3G, and M6G standards was nominally achieved for applied separation voltages ranging from 10–30 kV (see Figure S4), the peak shape was optimal and the migration time was minimized at 30 kV, and so this separation voltage was adopted for subsequent studies. Additionally, the effect of capillary inner diameter (ID) was studied. Only the 50 μm ID uncoated fused silica capillary led to both baseline resolution and good peak shape for morphine, M3G and M6G, whereas a 25 μm ID capillary yielded baseline resolution but poor peak shape, and a 75 μm ID capillary yielded good peak shape but poor resolution.
Employing all of these optimized conditions, CE-LIF calibration curves were established for on-column labeling of morphine, M3G, and M6G standards with SQ-BA3. The calibration results are summarized in Table 2, which highlights a linear increase in peak area as a function of analyte concentration with excellent correlation coefficients (R2 > 0.994) for each analyte (see also Figure S5).
Table 2. Analytical figures of merit for morphine, M3G and M6G samples in water and diluted normal human urine (1:10) matrices. Values are extracted from Figures S5 and S6.
Figures of MeritMorphineM3GM6G
Water MatrixDiluted Urine MatrixWater MatrixDiluted Urine MatrixWater MatrixDiluted Urine Matrix
Linear Regression (Conc. vs. Peak Area)y = (1 × 10¹⁰)x
−1 × 10⁶
y = (2 × 10¹⁰)x
−5 × 10⁶
y = (5 × 10¹⁰)x
−7 × 10⁶
y = (3 × 10¹⁰)x
−5 × 10⁶
y = (7 × 10⁹)x
−1 × 10⁶
y = (4 × 10⁹)x
−2 × 10⁶
Correlation Coefficient, R20.99740.99770.99650.99620.99730.9950
% RSD5.344.475.354.614.465.89
Linearity range (M)2.50 × 10⁻⁴–2.50 × 10−33.50 × 10−4–1.75 × 10−31.50 × 10−4–1.50 × 10−32.50 × 10−4–1.25 × 10−35.00 × 10−4–2.00 × 10−31.00 × 10−3–1.75 × 10⁻³
LOD (M)1.20 × 10−41.10 × 10−48.70 × 10−59.30 × 10−51.10 × 10−41.80 × 10−4
LOQ (M)4.10 × 10−43.80 × 10−42.90 × 10−43.10 × 10−43.80 × 10−45.90 × 10−4

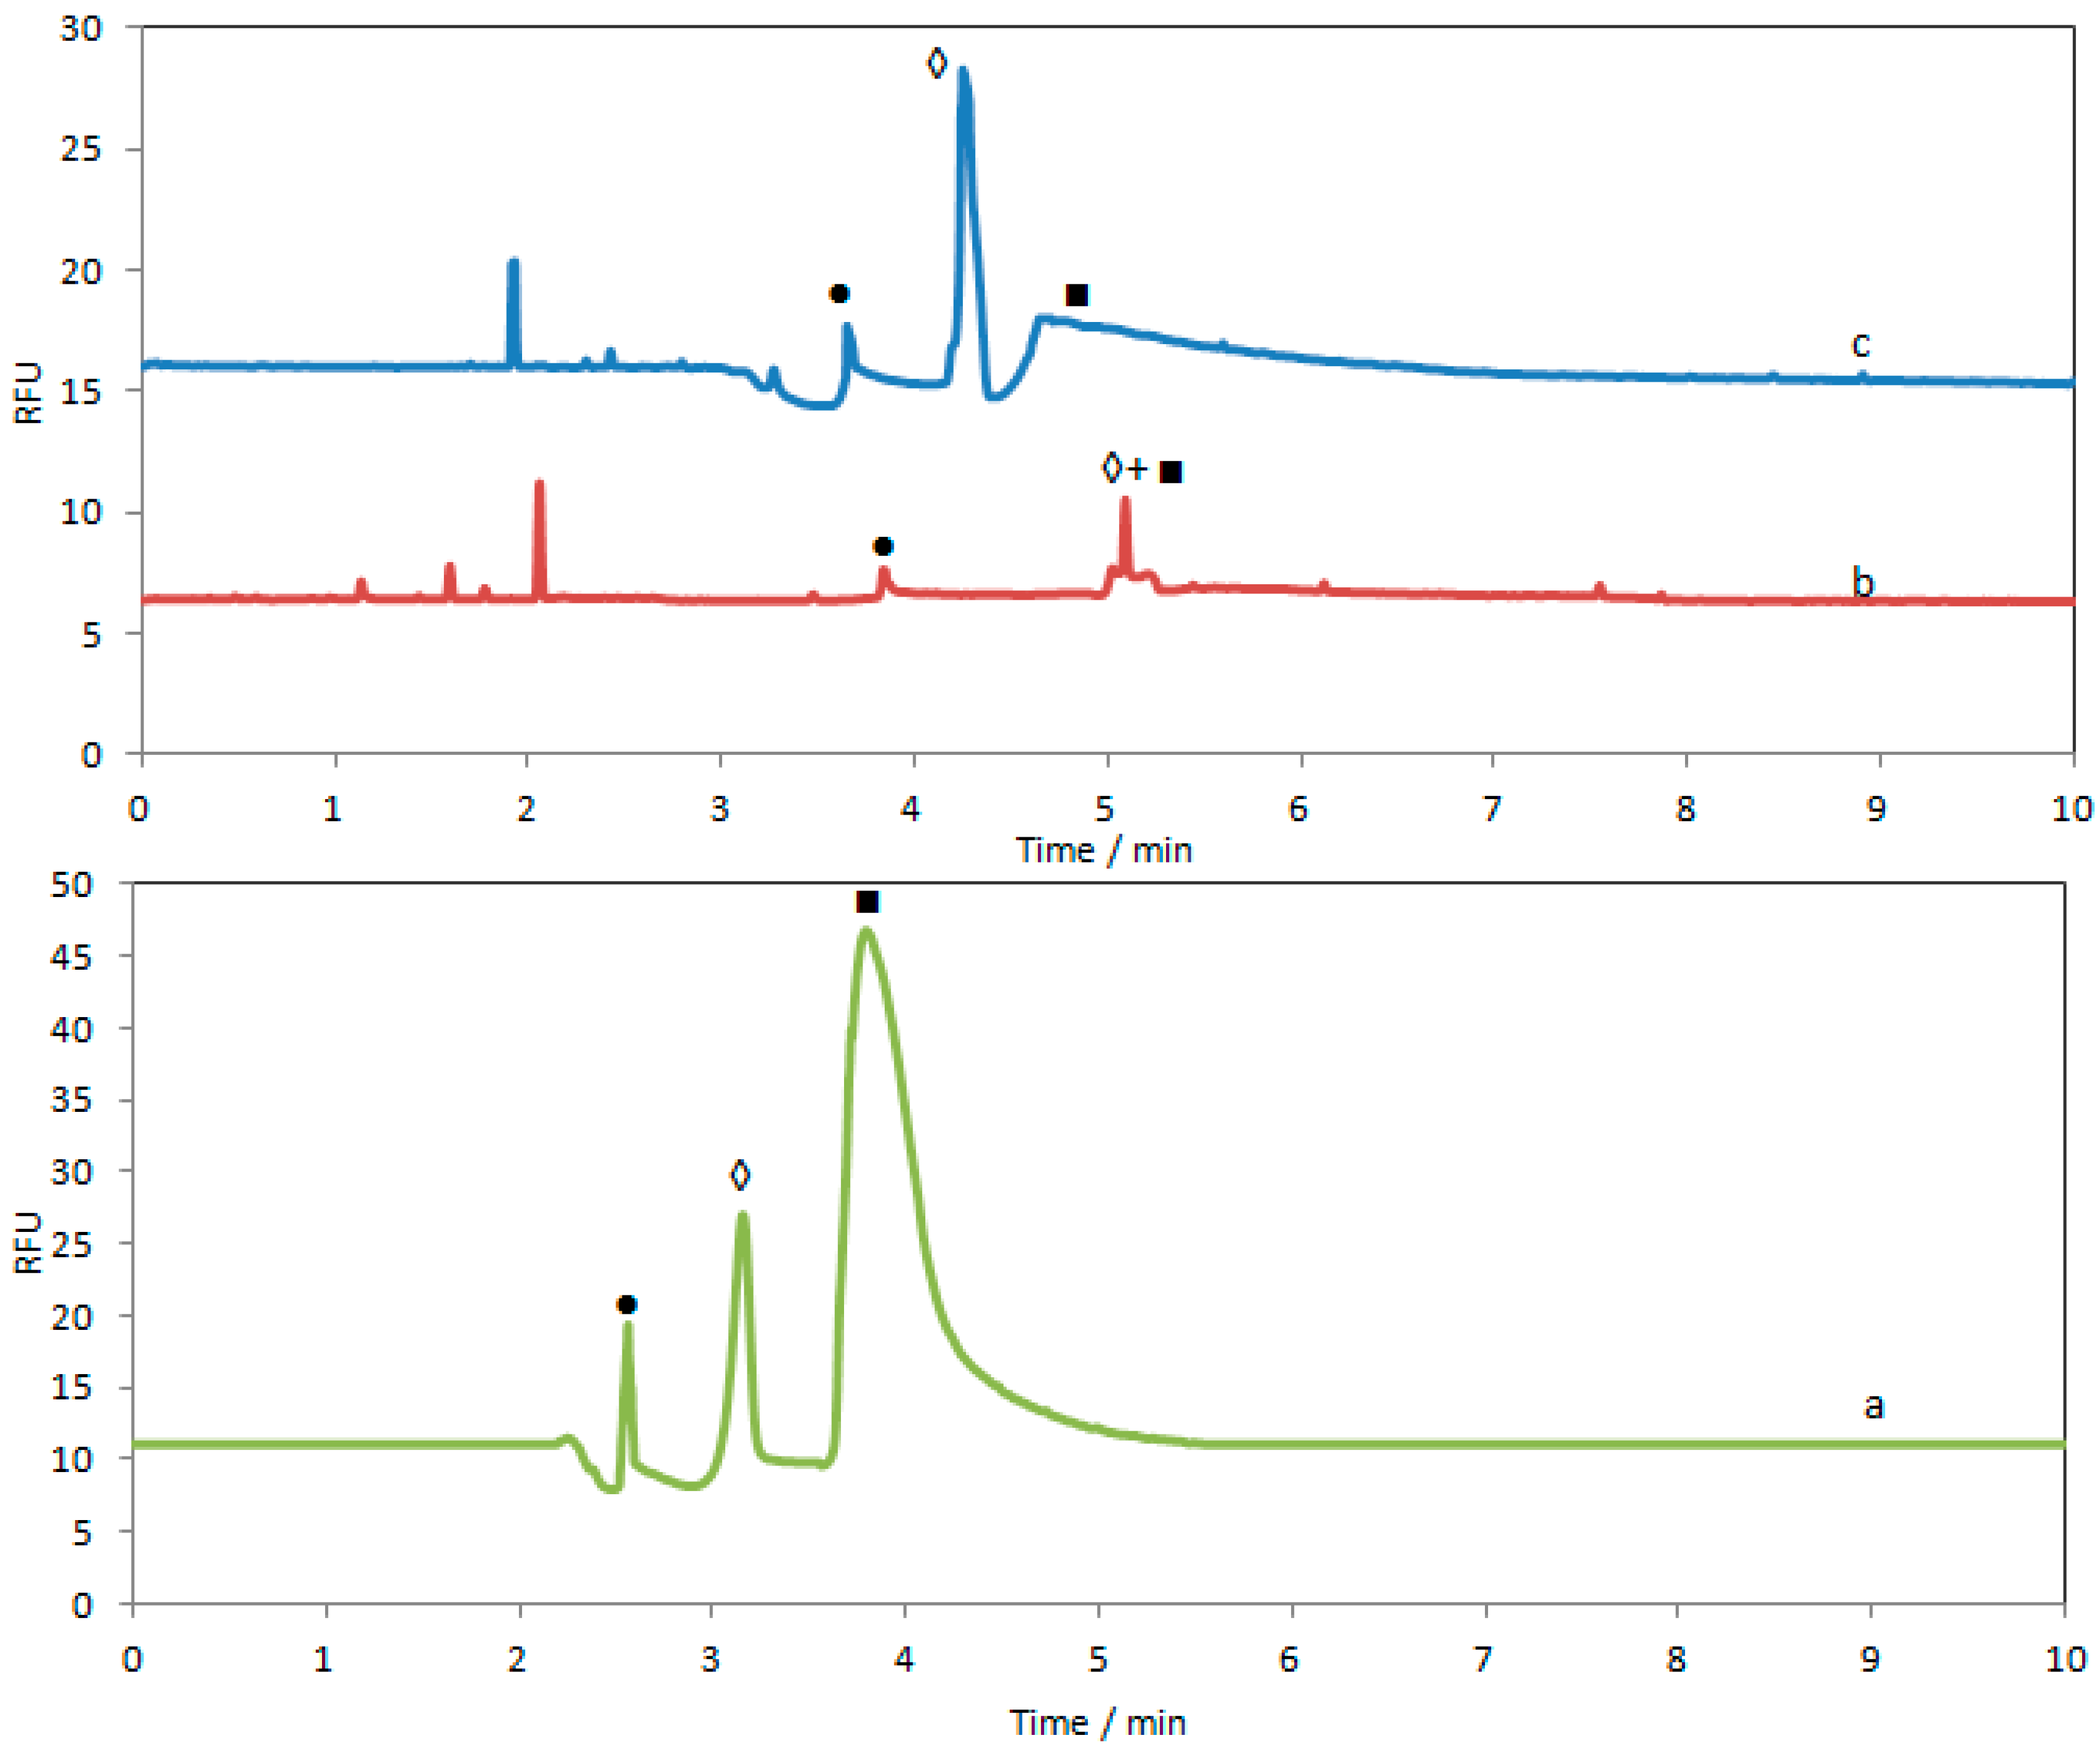
3.4. CE-LIF Analysis of Morphine and Its Metabolites in Human Urine Samples

Normal human urine samples with added morphine and morphine glucuronide metabolite standards were prepared according to the procedure described earlier (see Section 2.2) and were subjected to the optimized CE-LIF analysis with on-column labeling with SQ-BA3. Recognizing the sensitivity limitations of the method, initial urine sample dilutions of just 1:1 and 1:5 with water were conducted. However, morphine and M3G co-eluted in samples thus prepared (as seen in Figure 4b). The complete separation of all three analytes could be achieved using a 10-fold dilution of the urine samples with water (as seen in Figure 4c) with slight delay of migration time may be due to the urine matrix which indeed decreases the electroosmotic flow inside the capillary. Whereas previous CE-MS studies in our laboratory utilized the running buffer as the diluent for urine-based samples containing morphine and its metabolites [17], such sample preparation in buffer for CE-LIF studies herein did not lead to resolution of the three analytes of interest while dilution in water achieved the required separation. As such, figures of merit for morphine, M3G and M6G in a normal human urine matrix prepared by a 10-fold dilution with water are summarized in Table 2 (compared to figures of merit for comparable analyte mixtures in water only). In addition, relative standard deviations for both water and diluted urine matrices showed a highly precise method with minimal error bars and variations for all calibration curve concentrations as presented in Table 2 and Figures S5, S6. Although sensitivities achieved by this CE-LIF method are not as high as for CE-MS [17], which showed LODs in the order of 10−6 and 10−7, CE-MS method requires more analysis time whereas CE-LIF is more cost-efficient screening option with the potential to develop selective squarylium dye probes with reactivity towards a single class of analytes. Thus, a demonstration of the feasibility of using SQ-BA3 as a fluorescent, on-column label for the CE-LIF analysis of small drug molecules and their metabolites in a clinical sample matrix such as urine, or at least in the pharmaceutical field, was pursued.

4. Conclusions

A novel method for the rapid separation and detection of morphine, M3G, and M6G in human urine by CE-LIF was established. On-column labeling of morphine and its metabolites was done by utilizing a new boronic acid functionalized squarylium dye, SQ-BA3. This dye has been shown to possess useful characteristics for sensing morphine and its metabolites, including the demonstration of fluorescence enhancements for morphine, M3G and M6G under a variety of solution conditions. Spectroscopic and electrophoretic studies provided evidence that the boronic acid functionalized dye does not interact with the opioid analytes by way of specific boronate ester formation, but rather, by electrostatic, dipole, and H-bond types of interactions. Such interactions are sufficient to maintain the integrity of the dye-analyte complex as it migrates in CE, according to its net electrophoretic mobility, past the LIF detector. Optimized CE-LIF conditions included a 25 mM ammonium phosphate separation buffer (pH 10.50) containing 10 mM phytic acid to aid separation and 1.00 × 10⁻⁶ M SQ-BA3 to facilitate on-column labeling. This method provided sufficient resolution to distinguish between isobaric glucuronide metabolites of morphine. Minimal sample preparation, which included just a molecular weight cutoff filtration and a 10-fold dilution of urine samples with water, was required prior to CE-LIF analysis of urine samples containing opioid standards, making this an attractive tool for drug detection. By combining the high resolving power of CE with the sensitivity of LIF detection and the convenience of on-column labeling, applications for novel squarylium dyes as probes for new drugs of interest are expected to grow.

Supplementary Materials

The following are available online at https://www.mdpi.com/2227-9075/3/1/1/s1.

Acknowledgments

The authors would like to thank Wake Forest University, the Embassy of the Arab Republic of Egypt Cultural & Educational Bureau (Washington, D.C.), and the Egyptian government scholarship #JS2736 (M. Sebaiy) for funding. The authors also thank H. Nakazumi (Osaka Prefecture University, Osaka, Japan) for providing SQ-BA3 samples.

Author Contributions

Mahmoud M. Sebaiy performed the experimental work, and Christa L. Colyer and Theresa A. Isbell analyzed the data, and wrote the article with Mahmoud. Abdullah A. El-Shanawany, Mohamed M. Baraka and Lobna M. Abdel-Aziz provided oversight during data analysis and writing of the article.

Conflicts of Interest

The authors declare no conflict of interest.

References

  1. Coffman, B.L.; Rios, G.R.; King, C.D.; Tephly, T.R. Human UGT2B7 catalyzes morphine glucuronidation. Drug Metab. Dispos. 1997, 25, 1–4. [Google Scholar]
  2. Ulens, C.; Baker, L.; Ratka, A.; Waumans, D.; Tytgat, J. Morphine-6beta-glucuronide and morphine-3-glucuronide, opioid receptor agonists with different potencies. Biochem. Pharmacol. 2001, 62, 1273–1282. [Google Scholar] [CrossRef]
  3. Stone, A.N.; Mackenzie, P.I.; Galetin, A.; Houston, J.B.; Miners, J.O. Isoform activity and kinetics of morphine-3 and 6-glucuronidation by human UDP-glucuronosyltransferases: Evidence of atypical glucuronidation kinetics by UGT2B7. Drug Metab. Dispos. 2003, 31, 1086–1089. [Google Scholar] [CrossRef] [PubMed]
  4. Christrup, L.L. Morphine metabolites. Acta Anaesth. Scand. 1997, 41, 116–122. [Google Scholar] [CrossRef] [PubMed]
  5. Smith, M.T.; Watt, J.A.; Cramond, T. Morphine-3-glucuronide--a potent antagonist of morphine analgesia. Life Sci. 1990, 47, 579–585. [Google Scholar] [CrossRef]
  6. Gong, Q.L.; Hedner, T.; Hedner, J.; Bjorkman, R.; Nordberg, G. Antinociceptive and ventilatory effects of the morphine metabolites: morphine-6-glucuronide and morphine-3-glucuronide. Eur. J. Pharmacol. 1991, 193, 47–56. [Google Scholar] [CrossRef]
  7. Yeh, S.Y.; Gorodetzky, C.W.; Krebs, H.A. Isolation and identification of morphine 3- and 6-glucuronides, morphine 3,6-diglucuronide, morphine 3-ethereal sulfate, normorphine, and normorphine 6-glucuronide as morphine metabolites in humans. J. Pharm. Sci. 1977, 66, 1288–1293. [Google Scholar] [CrossRef] [PubMed]
  8. Netriova, J.; Blahova, E.; Johanesova, Z.; Brandsteterova, E.; Lehotay, J.; Serdt, K.; Mocak, J. HPLC determination of morphine, morphine-3-glucuronide and morphine-6-glucuronide in human serum of oncological patients after administration of morphine drugs. Pharmazie 2006, 61, 528–534. [Google Scholar] [PubMed]
  9. Hartley, R.; Green, M.; Quinn, M.; Levene, M.I. Analysis of morphine and its 3- and 6-glucuronides by high performance liquid chromatography with fluorimetric detection following solid phase extraction from neonatal plasma. Biomed. Chromatogr. 1993, 7, 34–37. [Google Scholar] [CrossRef] [PubMed]
  10. Wright, A.W.E.; Watt, J.A.; Kennedy, M.; Cramond, T.; Smith, M.T. Quantitation of morphine, morphine-3-glucuronide, and morphine-6-glucuronide in plasma and cerebrospinal fluid using solid-phase extraction and high-performance liquid chromatography with electrochemical detection. Ther. Drug Monit. 1994, 16, 200–208. [Google Scholar] [CrossRef] [PubMed]
  11. Taylor, K.; Elliott, S. A validated hybrid quadrupole linear ion-trap LC–MS method for the analysis of morphine and morphine glucuronides applied to opiate deaths. Forens. Scie. Int. 2009, 187, 34–41. [Google Scholar] [CrossRef] [PubMed]
  12. Mabuchi, M.; Takatsuka, S.; Matsuoka, M.; Tagawa, K. Determination of morphine, morphine-3-glucuronide and morphine-6-glucuronide in monkey and dog plasma by high-performance liquid chromatography–electrospray ionization tandem mass spectrometry. J. Pharm. Biomed. Anal. 2004, 35, 563–573. [Google Scholar] [CrossRef] [PubMed]
  13. Zhang, X.; Li, J.; Gao, J.; Sun, L.; Chang, W. Determination of morphine by capillary electrophoresis immunoassay in thermally reversible hydrogel-modified buffer and laser-induced fluorescence detection. J. Chromatogr. A 2000, 895, 1–7. [Google Scholar] [CrossRef]
  14. Taylor, R.B.; Low, A.S.; Reid, R.G. Determination of opiates in urine by capillary electrophoresis. J. Chromatogr. B 1996, 675, 213–223. [Google Scholar] [CrossRef]
  15. Wey, A.B.; Thormann, W. Capillary electrophoresis-electrospray ionization ion trap mass spectrometry for analysis and confirmation testing of morphine and related compounds in urine. J. Chromatogr. A 2001, 916, 225–238. [Google Scholar] [CrossRef]
  16. Lurie, I.S.; Panicker, S.; Hays, P.A.; Garcıa, A.D.; Geer, B.L. Use of dynamically coated capillaries with added cyclodextrins for the analysis of opium using capillary electrophoresis. J. Chromatogr. A 2003, 984, 109–120. [Google Scholar] [CrossRef]
  17. Isbell, T.A.; Strickland, E.C.; Hitchcock, J.; McIntire, G.; Colyer, C.L. Capillary electrophoresis – mass spectrometry determination of morphine and its glucuronide metabolites. J. Chromatogr. B 2015, 980, 65–71. [Google Scholar] [CrossRef] [PubMed]
  18. Colyer, C.L. Noncovalent labeling of proteins in capillary electrophoresis with laser-induced fluorescence detection. Cell Biochem. Biophys. 2000, 33, 323–337. [Google Scholar] [CrossRef]
  19. Yan, W.; Sloat, A.L.; Yagi, S.; Nakazumi, H.; Colyer, C.L. Protein labeling with red squarylium dyes for analysis by capillary electrophoresis with laser-induced fluorescence detection. Electrophoresis 2006, 27, 1347–1354. [Google Scholar] [CrossRef] [PubMed]
  20. Saito, S.; Massie, T.L.; Maeda, T.; Nakazumi, H.; Colyer, C.L. On-column labeling of gram-positive bacteria with a novel boronic acid functionalized squarylium cyanine dye for analysis by polymer-enhanced capillary transient isotachophoresis. Anal. Chem. 2012, 84, 2452–2458. [Google Scholar] [CrossRef] [PubMed]
  21. Saito, S.; Maeda, T.; Nakazumi, H.; Colyer, C.L. An application of polymer-enhanced capillary transient isotachophoresis with an emissive boronic acid functionalized squarylium dye as an on-capillary labeling agent for gram-positive bacteria. Anal. Sci. 2013, 29, 157–159. [Google Scholar] [CrossRef] [PubMed]
  22. Maahs, G.; Hegenberg, P. Syntheses and derivatives of squaric acid. Angew. Chem. Int. Ed. Engl. 1966, 5, 888–893. [Google Scholar] [CrossRef]
  23. Sprenger, H.E.; Ziegenbein, W. Condensation products of squaric acid and tertiary aromatic amines. Angew. Chem. Int. Ed. Engl. 1966, 6, 894. [Google Scholar] [CrossRef] [PubMed]
  24. Gravesteijin, D.J.; Steenbergen, C.; Vander Veen, J. Single wavelength optical recording in pure, solvent coated infrared dye layers. Proc. SPIE. Int. Soc. Opt. Eng. 1983, 420, 327–331. [Google Scholar]
  25. Merritt, V.Y.; Hovel, H.J. Organic solar cells of hydroxy squarylium. Appl. Phys. Lett. 1976, 29, 414–415. [Google Scholar] [CrossRef]
  26. Kim, S.H.; Han, S.K. High performance squarylium dyes for high-tech use. Color Tech. 2001, 117, 61–67. [Google Scholar] [CrossRef]
  27. Welder, F.; Paul, B.; Nakazumi, H.; Yagi, S.; Colyer, C.L. Symmetric and asymmetric squarylium dyes as noncovalent protein labels: A study by fluorimetry and capillary electrophoresis. J. Chromatogr. B 2003, 793, 93–105. [Google Scholar] [CrossRef]
  28. Yan, W.; Colyer, C.L. Investigating noncovalent squarylium dye–protein interactions by capillary electrophoresis–frontal analysis. J. Chromatogr. A 2006, 1135, 115–121. [Google Scholar] [CrossRef] [PubMed]
  29. Sloat, A.L.; Roper, M.G.; Lin, X.; Ferrance, J.P.; Landers, J.P.; Colyer, C.L. Protein determination by microchip capillary electrophoresis using an asymmetric squarylium dye: Noncovalent labeling and nonequilibrium measurement of association constants. Electrophoresis 2008, 29, 3446–3455. [Google Scholar] [CrossRef] [PubMed]
  30. Lin, X.; Rockett, S.; Massie, T.L.; Turner, G.B.; Maeda, T.; Nakazumi, H.; Colyer, C.L. Asymmetric Mono- and Bis-Squarylium Dyes as Pre-Column and On-Column Labels for Protein Analysis by Capillary Electrophoresis with Laser-induced Fluorescence Detection. J. Anal. Bioanal. Tech. 2012, S9, 1–7. [Google Scholar]
  31. Saito, S.; Massie, T.L.; Maeda, T.; Nakazumi, H.; Colyer, C.L. A long-wavelength fluorescent squarylium cyanine dye possessing boronic acid for sensing monosaccharides and glycoproteins with high enhancement in aqueous solution. Sensors 2012, 12, 5420–5431. [Google Scholar] [CrossRef] [PubMed]
  32. Ouchi, K.; Colyer, C.L.; Sebaiy, M.; Zhou, J.; Maeda, T.; Nakazumi, H.; Shibukawa, M.; Saito, S. Molecular design of boronic acid-functionalized squarylium cyanine dyes for multiple discriminant analysis of sialic acid in biological samples: Selectivity toward monosaccharides controlled by different alkyl side chain lengths. Anal. Chem. 2015, 87, 1933–1940. [Google Scholar] [CrossRef] [PubMed]
  33. Wang, B.; Fan, J.; Sun, S.; Wang, L.; Song, B.; Peng, X. 1-(Carbamoylmethyl)-3H-indolium squarine dyes: Synthesis, spectra, photo-stability and association with BSA. Dyes Pigments 2010, 85, 43–50. [Google Scholar] [CrossRef]
  34. Tatikolov, A.S.; Costa, S.M.B. Photophysical and aggregation properties of a long-chain squarylium indocyanine dye. J. Photochem. Photobiol. A 2001, 140, 147–156. [Google Scholar] [CrossRef]
  35. Fukuda, K.; Nakahara, H. Spectroscopic studies on aggregation of squarylium dyes and the photopolymerization of a diacetylenic derivative in monolayers at the air/water interface. Colloid Surf. A 1995, 102, 57–68. [Google Scholar] [CrossRef]
  36. Chen, X.Y.; Zhao, L.M.; Zhong, D.F. A novel metabolic pathway of morphine: Formation of morphine glucosides in cancer patients. Br. J. Clin. Pharmacol. 2003, 55, 570–578. [Google Scholar] [CrossRef] [PubMed]
  37. Roy, S.D.; Flynn, G.L. Solubility behavior of narcotic analgesics in aqueous media: Solubilities and dissociation constants of morphine, fentanyl, and sufentanil. Pharm. Res. 1989, 6, 147–151. [Google Scholar] [CrossRef] [PubMed]
  38. Yan, W.; Colyer, C.L. Fluorimetric studies and noncovalent labeling of protein with the near-infrared dye HITCI for analysis by CE-LIF. J. Sep. Sci. 2005, 28, 1409–1415. [Google Scholar] [CrossRef] [PubMed]
  39. Evans, W.J.; McCourtney, E.J.; Sharager, R.I. Titration studies of phytic acid. J. Amer. Oil Chem. Soc. 1982, 59, 189–191. [Google Scholar] [CrossRef]
  40. Okafo, G.N.; Birrell, H.C.; Greenaway, M.; Haran, M.; Camilleri, P. The effect of phytic acid on the resolution of peptides and proteins in capillary electrophoresis. Anal. Biochem. 1994, 219, 201–206. [Google Scholar] [CrossRef] [PubMed]

