Fault Ride-Through Capability Enhancement of Type-4 WECS in Offshore Wind Farm via Nonlinear Adaptive Control of VSC-HVDC


1
Department of Electrical Engineering and Electronics, University of Liverpool, Liverpool L69 3GJ, UK
2
Faculty of Electric Power Engineering, Kunming University of Science and Technology, Kunming 650500, China
3
College of Electric Power, South China University of Technology, Guangzhou 510640, China
*
Author to whom correspondence should be addressed.
Processes 2019, 7(8), 540; https://doi.org/10.3390/pr7080540
Submission received: 22 July 2019
/
Revised: 6 August 2019
/
Accepted: 12 August 2019
/
Published: 15 August 2019
(This article belongs to the Special Issue Design and Control of Sustainable Systems)
Abstract
:This paper proposes a perturbation estimation-based nonlinear adaptive control (NAC) for a voltage-source converter-based high voltage direct current (VSC-HVDC) system which is applied to interconnect offshore large-scale wind farms to the onshore main grid in order to enhance the fault ride-through (FRT) capability of Type-4 wind energy conversion systems (WECS). The VSC-HVDC power transmission system is regraded as a favourable solution for interconnecting offshore wind farms. To improve the FRT capability of offshore power plants, a de-loading strategy is investigated with novel advanced control of the VSC-HVDC systems. The proposed NAC does not require an accurate and precise model and full state measurements since the combinatorial effects of nonlinearities, system parameter uncertainties, and external disturbances are aggregated into a perturbation term, which are estimated by a high-gain perturbation observer (HGPO) and fully compensated for. As the proposed NAC is adaptive to system model uncertainties (e.g., mismatched output impedance of the converters and the line impedance of transmission line), time-varying disturbance (e.g., AC grid voltage sags and line to ground faults), and unknown time-varying nonlinearities of the power-electronic system (e.g., unmodelled dynamics existed in valve and VSC phase-locked loop system), a significant robustness can be provided by the de-loading strategy to enhance the FRT capability. Simulation results illustrated that the proposed strategy can provide improved dynamic performance in the case of operation with a variety of reduced voltage levels and improved robustness against model uncertainties and mismatched system parameters comparing with conventional vector control.
1. Introduction
In the past decade, the ratings of offshore wind farms have been increasing rapidly and they are being planned far from the grid connection point [1,2]. However, the conventional AC transmission through submarine cables produces a significant amount of reactive current due to its high capacitance, which reduces the current-carrying capacity and often requires extra reactive power compensation devices [3,4].
A voltage-source converter-based high voltage direct current (VSC-HVDC) transmission system is the favorable solution for offshore DC connection since it does not require a strong offshore or onshore AC grid and can even start up against a dead network (black-start capability) [5]. A VSC-HVDC transmission system also allows the independent control of active and reactive power, which reduces the requirement for reactive-power compensation and is able to contribute to the stabilization of the connected onshore AC grid [6,7,8].
However, one inevitable challenge for VSC-HVDC transmission systems which are applied to integrating offshore wind farms is the fault ride-through (FRT) capability which is stipulated by grid codes [9]. FRT capability enables offshore wind farms to remain connected during abnormal onshore AC grid conditions like voltage deviations [10]. Figure 1 demonstrates a FRT time-voltage profile set by the German Transmission and Distribution Utility (E.ON) regulation [11]. The FRT requirement contains zero voltage ride-through (ZVRT), low-voltage ride-through (LVRT), and high-voltage ride-through (HVRT). This paper focuses on investigating the ZVRT and LVRT. E.ON also requires additional reactive current from WECS for grid voltage support during voltage sags. The corresponding controller must take action within 20 ms after fault recognition. The required reactive current is required to be changed relative to the pre-fault operation in the case of the voltage deviation exceeds a deadband of around the nominal value. Up to 100% of the WECS rated current is expected to be used for this support. The WECS is required to get back to normal generation immediately after fault clearance [12].
Although FRT attracted many research works, most of them are mainly studying the FRT capability of individual wind turbines and these proposed works all caused considerable efforts in large-scale wind farms, which are formed by huge numbers of wind turbines. Investigating FRT capability on VSC-HVDC transmission system is regarded as a smarter way. There are two major types of approaches to enhance the FRT capability: control improvement and hardware modification.
FRT capability can be enhanced by installing additional protection devices, such as DC choppers with braking resistors [13], flywheel energy storage system [14], and novel topology like nine switch converter [15]. Installing extra devices used for providing voltage compensation, energy consumption, or storage are effective yet being limited by the high cost and heat dissipation capacity. These methods also bring the complicated control of energy storage circuits or novel converter. Another effective alternative put forward to enhance the FRT of the HVDC is to modify the control strategies applied on the converters. In [16], fuzzy logic controller for temporary blocking the VSC converter is proposed during AC grid fault. However, even when the insulated gate bipolar transistors (IGBTs) in the sending-end VSC are blocked, the reverse current flowing via antiparallel diodes will still cause the power transmitting to the DC side [15]. Different control strategies are applied for power reduction (de-loading strategies) to enhance the FRT performance, but are designed based on linear mode like mentioned in [13,17,18,19]. However, existing linear approaches cannot provide consistently satisfactory performance since they are all tuned specially based on one operation point and the time-varying nonlinearities and uncertainties are not being fully compensated. Due to the poor-off standard operation point behaviour during AC network faults, inrush faulty grid-side current cannot be limited rapidly and may cause converter components to be damaged since the power electronics in converters are very sensitive to transient current surges [20]. Feedback linearizing control (FLC) has been proposed in [20] for solving the nonlinearity problem to improve the FRT performance of individual wind turbines. However, the FLC requires the accurate and precise system model and hence FLC will degrade dramatically in the presence of parameter uncertainties and external disturbances, which has adverse impacts on FRT performance. On the other hand, most FLC-based controllers require full state feedback and many measured variables to calculate the nonlinear controller. Since co-operating with the de-loading strategy will introduce more parameter uncertainties and disturbances caused by transients of slower mechanical response and can hardly provide real-time full state feedback, FLC is not suitable to be applied to this application. To improve these issues of the FLC, extended-order state and perturbation (or disturbance) observer (ESPO)-based nonlinear adaptive controller is proposed to use estimates of perturbation to compensate real perturbation and achieve the adaptive feedback linearizing control.
This paper develops a perturbation estimation-based nonlinear adaptive control (NAC) scheme with proper de-loading strategy for the FRT capability enhancement of VSC-HVDC systems. The combinatorial effect of nonlinearities, system parameter uncertainties, and external disturbances is aggregated into a perturbation, which is estimated by a high-gain perturbation observer (HGPO) [21,22,23]. NAC is proposed to solve the nonlinearity problem and considered as the suitable method to enhance the FRT capability with de-loading strategy. The NAC-based VSC-HVDC converter controller only requires the measurement of active and reactive power and DC voltage, thus it provides the merit of inherently easy implementation in real systems. The effectiveness of the proposed strategy is verified by simulation under several cases, e.g., voltage sags and line-line-line-ground (LLLG) faults. The robustnesses against system parameter uncertainties and control efforts of conventional converter vector control (VC) without de-loading strategy, conventional VC with de-loading control, and proposed NAC-based converter control with de-loading control are analyzed and compared.
The rest of the paper is organized as follows. In Section 2, the system configuration and corresponding models are presented. In Section 3, the proposed NAC-based VSC controllers with de-loading strategy embedded are developed and discussed. Simulation results of Simulink are provided in Section 4. Finally, conclusions are drawn in Section 5.
2. System Configuration and Modelling
Figure 2 shows the typical configuration of the offshore wind farm needing to be integrated via VSC-HVDC system. The wind power plants in the offshore wind farm are represented by one aggregated wind turbine model which behaves like the sum of all those in this paper. Hence, the typical point to point VSC-HVDC transmission system with wind power integrated is shown in Figure 3. The wind power generated is transmitted from sending end VSC station (SEC), which regulates the active and reactive power, to the receiving end VSC station (REC), which maintains the DC voltage and regulates reactive power. The reactive power control channel is used to support the grid voltage during faults. The VSC state-space representation [24,25] in VSC-HVDC transmission system after Park transformation into dq-axis:
where and are the dq components of current at point of common coupling (PCC), and are the dq components of voltage at PCC, and are the dq components of voltage at VSC terminal, R and L are the equivalent series resistance and inductance of the filter and transformer between the VSC terminal and corresponding PCC.
The instantaneous active power and reactive power at PCC can be expressed as follows without considering the power losses during the switching process:
The DC cables in VSC-HVDC transmission system are modelled as a nominal Pi configuration, which use approximated lumped-parameter models and are expressed as the following:
where is the DC voltage difference between VSC terminals, is one equivalent DC cable capacitance which is divided equivalently from cable shunt capacitance, each placed at the sending and receiving ends of the cable, is the current flowing through DC cables, and are the resistance and inductance of DC cable. The Phase-locked loops (PLL) is assumed in a steady state, therefore equals 0 [26]. The global mathematical model of overall VSC-HVDC system is expressed as follows:
The active and reactive powers entering both REC and SEC can be expressed as:
where number 1, 2 subscript denote the variable corresponding to REC and SEC. Type-4 WECS configuration owns the second highest share now and is stated by the wind turbine manufacturers that this type technology would take over the wind energy market in the near future [11]. Type-4 WECS configuration is attractive for the use of full-scale power converters which is operated with the permanent magnetic synchronous generator (PMSG), wound rotor synchronous generator (WRSG), and squirrel cage induction generator (SCIG). PMSG is the most popular generator among these three types and is chosen as the investigated objective in this paper.
With the full-scale power converters, the generator is theoretically fully decoupled from the grid and operated at full speed range. These adopted power converters can also support the grid with reactive power compensation and smooth grid connection. This configuration can also provide the highest wind energy conversion efficiency comparing with other types. For FRT capability without installing external hardware devices, the best compliance can be achieved with full-scale power converters comparing with other types. However, the FRT capability is still required to be improved because the mechanical system response is much slower than the electrical response, and the transient active power injected by wind turbine is critical to the stability of whole power system. The extra injected power, which is called ”surplus energy”, needs to be handled carefully. There are various proposed strategies, and the adopted strategy is described in the next section.
The equivalent aggregated type-4 wind turbine generator with PMSG model [27,28] is applied for simulation in this paper. The mechanical power extracted by the wind turbine is expressed by
where is the power extracted from the wind, is air density, is the area covered by the rotor, is the wind speed, and is the performance coefficient or power coefficient. Within , is the pitch angle of rotor blades, is the tip speed ratio for which , where is blade tip speed.
where
Under normal operation, the dynamics of shaft system and mechanical torque are expressed by
where is the mechanical torque, is generator electrical torque, is mechanical rotation speed of wind turbine, H is the summation of wind turbine inertia constant and generator inertia constant. D is the viscous damping coefficient which is taken to be 0 in this paper, and are the inductances in the d-q axis, is the permanent magnetic flux given by the magnets, R is the blade radius of wind turbine, and p is the number of pole pairs.
The equivalent circuit model of the studied wind turbine generator can be expressed in the d-q axis, where the q-axis is fixed on the machine rotor and rotates at rotor speed,
where and are the stator voltages in the d-q axis, and are the currents in the d-q axis, is the stator resistance, is electrical rotation speed which equals .
3. Design for Proposed Strategy
This section presents the design of the perturbation observer-based NAC. For each subsystem in the VSC-HVDC transmission system with wind farm integrated, a lumped perturbation term is defined to contain all time-varying external disturbances, subsystem nonlinearities, and interactions between subsystems. Extended-order high-gain state and perturbation observers are employed in the adaptive linearization and decoupled control to estimate each subsystem state and perturbation term. The estimation processes are implemented via introducing fictitious states. The proposed NAC design is illustrated in the following subsections.
3.1. The High-Gain State and Perturbation Observer
Consider a canonical control form of studied system as follows
and a fictitious state is defined to expressed the system perturbation, i.e., , thus the state equation becomes
where , is the nominal control gain. On the system (14), these assumptions are made as follows.
Assumption A1.
is set to meet the requirement of: , where θ is one positive constant.
Assumption A2.
The function and are locally Lipschitz in their arguments over the domain of interest and are globally bounded in x:
where and are both positive constants. Besides, and .
Assumption 2 can assure that the origin is one of the equilibrium point in the open-loop system.
The high-gain observer in [21] is adopted to achieve the perturbation estimation. Under the Assumptions 1 and 2, and are unknown continuous functions. One state is assumed to be available. Therefore, one (n+1)th-order HGSPO is designed as
where , are gains of the observer, is a positive constant to be specified and the positive constants , are selected and made the roots of
are in the open left-half complex plan.
3.2. NAC for VSC-HVDC Transmission System
The proposed NAC adopts perturbation estimation term to compensate the actual system perturbation and achieves the adaptive feedback linearizing control. It does not demand an accurate and precise system model in conventional feedback linearization control. The more details can be found in previous work [21,29,30]. is denoted as the estimate of x in this paper.
For the REC side, the objective system output is selected as , where and are the reference values of reactive power and DC voltage , respectively. Hence, the DC voltage level can be maintained and the reactive power can be controlled and be used to support the main onshore grid voltage during fault. Differentiate until the control input appears explicitly, it yields
where and are constant control gains. The perturbations yield as follows
A second-order high-gain perturbation observer (HGPO) [21] is designed to estimate as
A third-order high-gain state and perturbation observer (HGSPO) [21] is designed to estimate as
where , , , , and are the positive constants and .
The NAC for the REC side using the perturbation estimation is designed as
where , , and are positive feedback control gains, hence put the poles of the closed-loop system in the left-half plane (LHP).
For the SEC side, the system output is chosen as , where and are the reference values of reactive power and active power , respectively. Differentiate until the control input appears explicitly, it expresses as
where and are constant control gains. The perturbations are expressed as follows
As same as mentioned previously, two second-order HGPOs for and estimation are designed, respectively:
where , , , and are the positive constants.
The NAC for the SEC side using the perturbation estimation is designed as
where and are positive feedback control gains, hence put the poles of the closed-loop system in the LHP.
Notice that control laws (22) and (27) require only one state measurement for its control design, that is, the DC voltage , active power , reactive powers and .
The structure of the proposed FRT strategy design can be illustrated by the block diagram in Figure 4.
3.3. De-Loading Strategy of Wind Turbine Generator
For the VSC-HVDC transmission system fault ride-through in the event of onshore main grid fault, the wind turbine generator power is required to be rapidly reduced (de-loaded) via reducing the reference generator torque or block the output powers via adjusting active power currents proportional to DC link voltage rise [13].
Since the DC link voltage is suppressed rapidly via adopting NAC in VSC controller of VSC-HVDC [31], DC link voltage rise cannot be adopted for exact de-loaded reference in linear vector control in WECS. Original AC grid voltage is required to be directly real-time measured and adopted in the proposed de-loading strategy. As aforementioned, mechanical system response is much slower than the electrical response, mechanical rotation speed and mechanical torque adjustment is critical during de-loading strategy for FRT capability enhancement. The controllers of motor side converter (MSC) and grid side converter (GSC) in the type-4 wind turbine generator are very similar to the SEC and REC mentioned above. The design of detailed corresponding controllers is based on [23,32]. The existing peak power tracking controller mentioned in [32] is designed to regulate the turbine rotating speed for capturing maximum wind. For the proposed de-loading strategy, it is shifted to regulate another specific value according to the reference torque mentioned below rather than the value obtained by existing peak power tracking controller when fault being detected.
The reference stator current in the q-axis is calculated by set-point torque, which is received by dictated order by the de-loading strategy shown below. The droop gain in de-loading loop is multiplied by the torque demand coming from 1 p.u., which is set as the steady state AC voltage value.
The proposed strategy is designed based on the de-loading strategy mentioned in [18], but it replaced the increasing DC voltage by measured onshore main grid AC voltage directly. The reduction of reference electrical torque is still set as proportional to the difference of real-time measured faulty AC voltage and nominal AC voltage by de-loading droop.
where the is the reference input for WECS controller, and the is the original set-point torque output generated by maximum power point tracking (MPPT) look-up table. is the droop gain applied in the de-loading strategy. is the measured onshore main grid voltage in q-axis during fault. is the measured nominal onshore main grid voltage in q-axis. Hence, the electrical power reference for WECS, which is also being sent to the HVDC SEC converter controller, is obtained as flows
3.4. Current Limiter Applied in NAC Controller
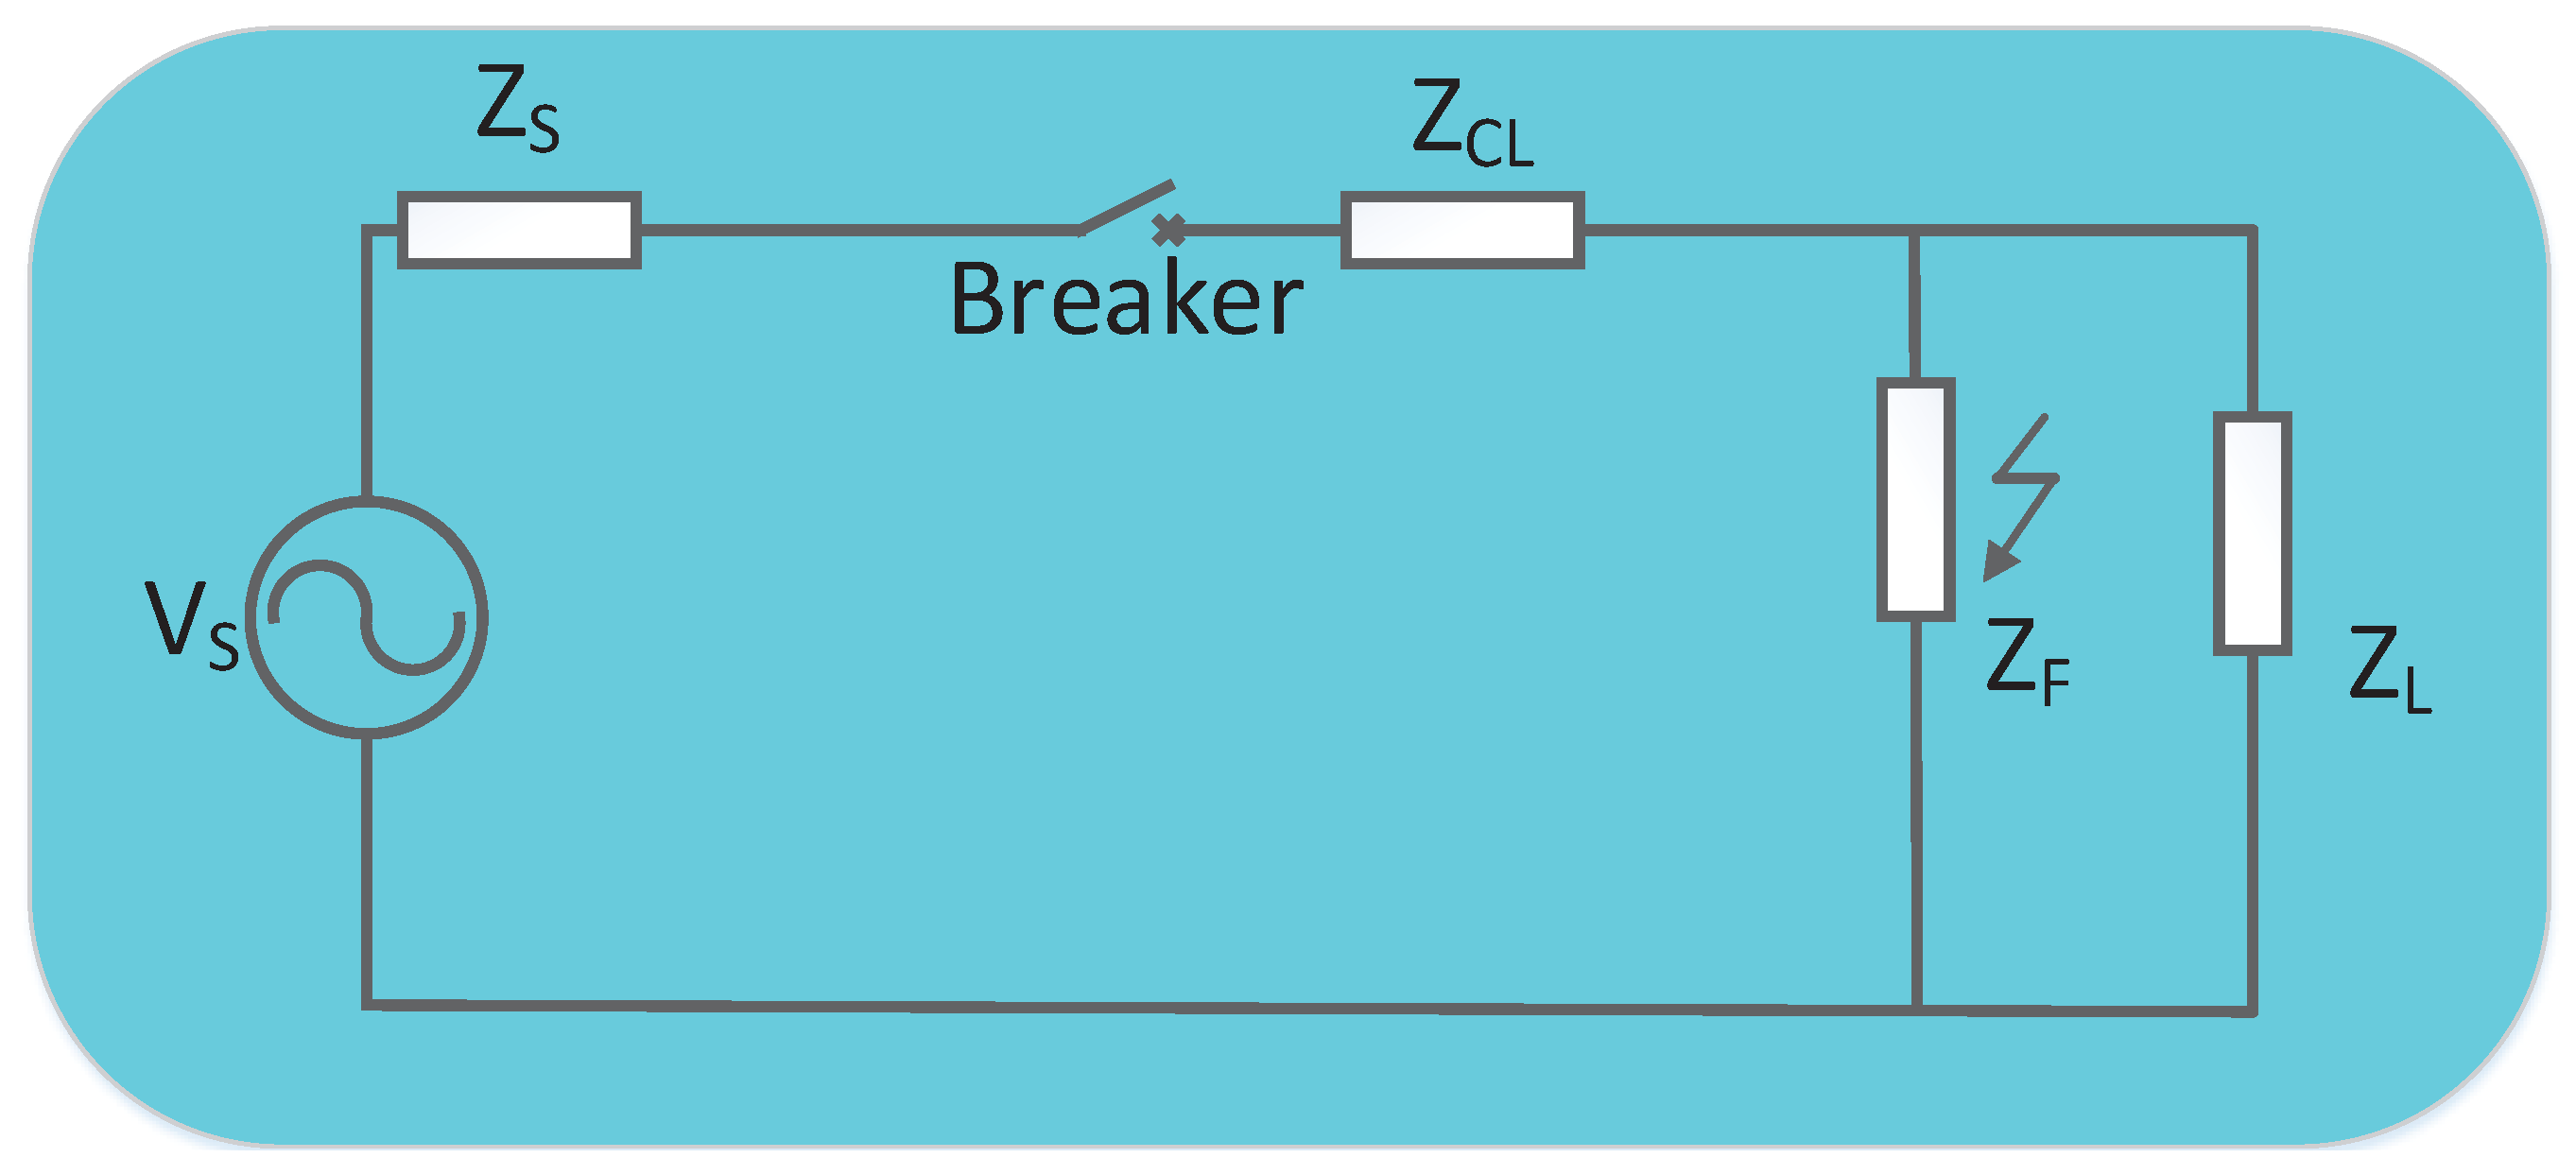
Mainland grid fault happens transiently; the resultant inrush current may cause serious disturbances to the grid and high torque spikes in the drive rain. Such a transient phenomenon can be relieved by a current limiter based on thyristor. Normally, the inrush current is limited to a level below two times the rated current of the generator which effectively dampens the torque peaks of the generator and reduces the loads on the drive train. A typical current limiter equivalent circuit is shown as following Figure 5:
In steady-state condition, the current without installing current limiter is shown as follows:
where is source voltage, is internal impedance, is load impedance. When the fault happens the load impedance will decrease sharply and become fault impedance with an extremely small value. Hence the value of current I will increase sharply and become far from rated current. With a current limiter installation, the fault current becomes as follows:
where is the impedance of the current limiter, with a considerably large impedance with current limiter the inrush fault current is greatly relieved. In this paper, a passive current limiter is adopted and the current limiter is embedded into VSC-HVDC model as saturation module when modelling in Matlab. Meanwhile in the controllers, current inputs are bounded as p.u. and p.u., , respectively.
4. Simulation Results
The proposed approach is applied on the system displayed by Figure 3. The FRT performance comparison of proposed de-loading NAC with conventional vector control (VC) [33] and de-loading VC [18] is presented in this section.
The system parameters used in the simulation are listed in Table 1. The values of system variables are used in the per unit (p.u.) value. The NAC parameters illustrated in Table 2 are tuned considering the application of the de-loading strategy, while control inputs are bounded as p.u. and p.u., , respectively. Moreover, the time period of the boundary values s.
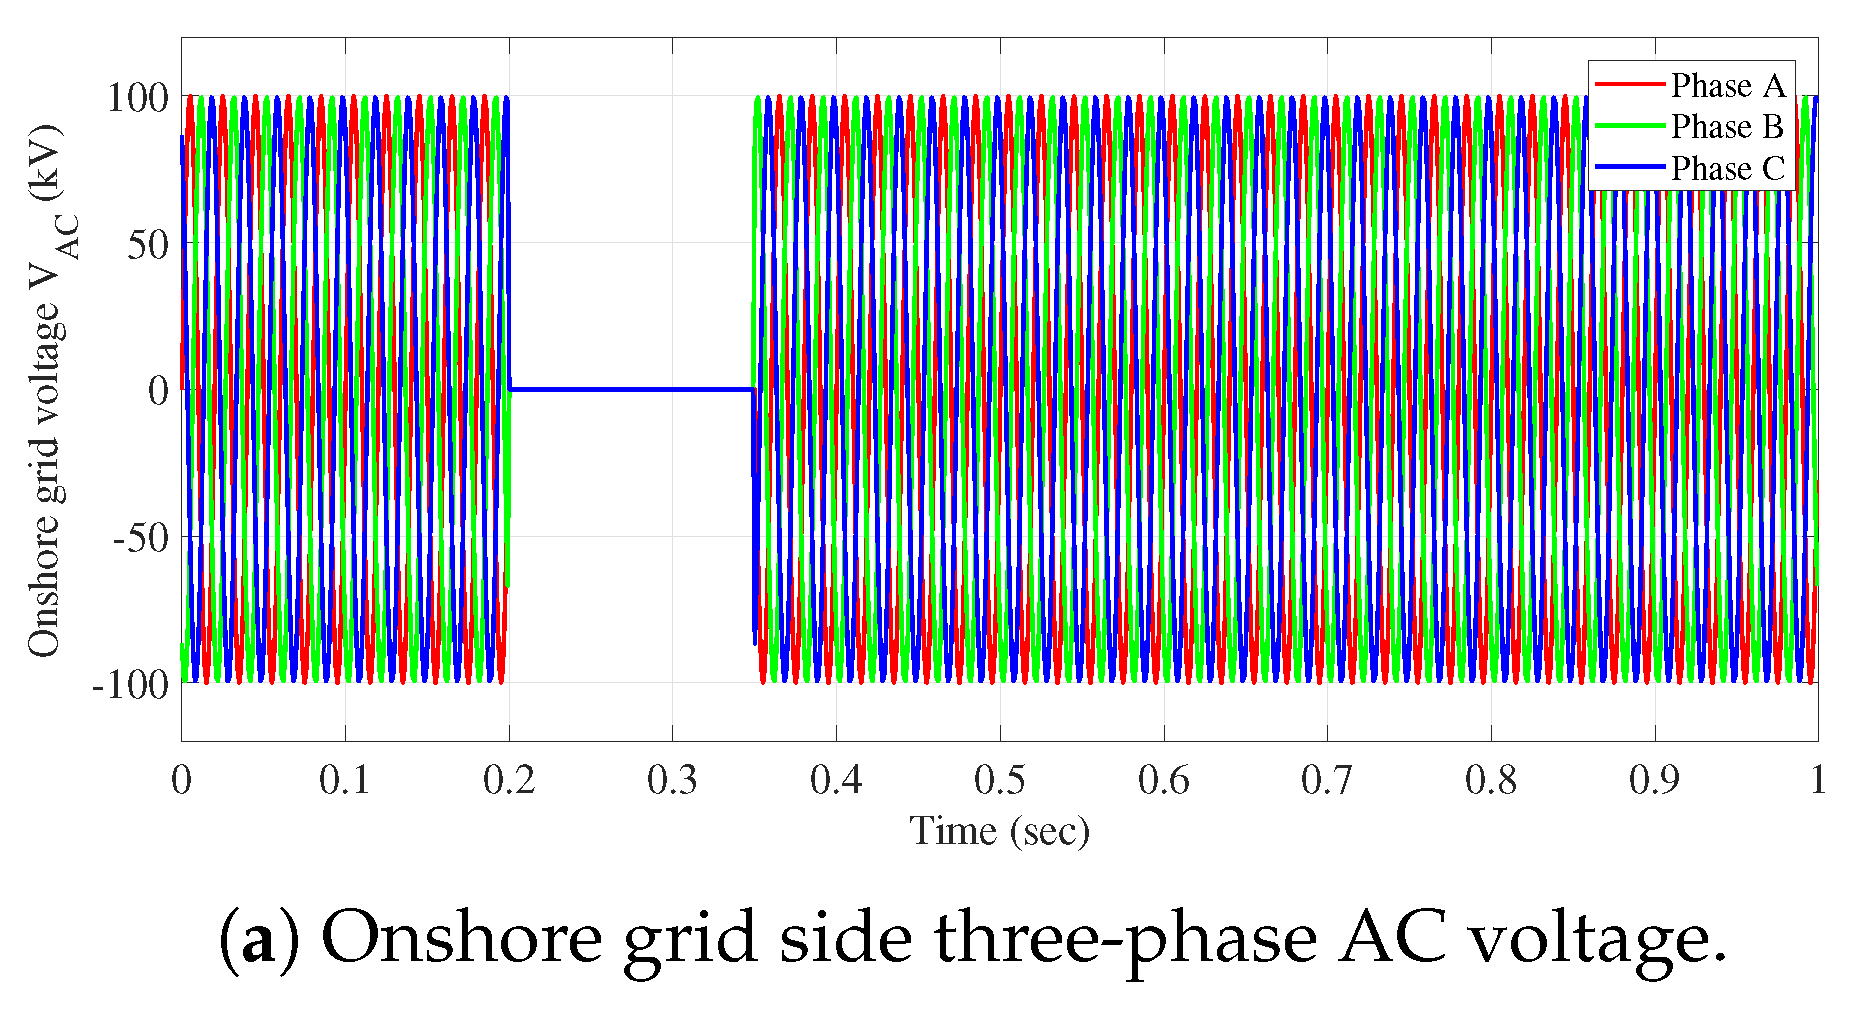
(1) System response to voltage sag at onshore AC grid: The FRT capability is tested with voltage sag at different reduced voltage levels. Take the voltage sag at of nominal voltage as an example, the response comparison of using proposing de-loading NAC with de-loading VC and conventional VC without de-loading process is displayed in Figure 6 and Figure 7. From analyzing the response obtained from REC, it can be seen as the voltage sag occurs at 0.2 and lasts 0.3 s. From comparing the overshoots in (b) (c) (d) of Figure 6, the proposed de-loading NAC can provide most smooth performance during voltage sags. For better comparison, the AC current measured from REC is converted into the d-q axis and shown in (e) of Figure 6. From comparing three control strategies in the d-q axis, it can be seen that proposed NAC could suppress current oscillations significantly. With the help of the de-loading strategy, the proposed control strategy can significantly reduce the peak current of the onshore grid. From analyzing the response obtained from SEC which shown in Figure 7, the voltage of HVDC link can also be reduced significantly comparing with conventional controllers. Hence, the FRT capability is enhanced by proposed NAC de-loading strategy.
(2) System response to line-line-line-ground (LLLG) fault at on shore AC bus: In this section, more severe fault is considered for the grid codes of some states. For example, German grid code stipulate that all types of generating plants should remain connected during AC grid voltage reduced down to 0% for 150 ms [11,12]. From (a) of Figure 8, it can be seen that a 0.15 s LLLG fault is simulated at onshore AC bus from 0.2 s to 0.35 s. Due to the severe fault, the conventional VC without de-loading strategy or any extra FRT equipment loses the stability after fault completion because of extremely far operation point shift. From (b) of Figure 8, it can be seen that the conventional VC cannot recover the nominal HVDC link voltage after such a long LLLG fault. From comparing the HVDC link voltage curve of de-loading VC and de-loading NAC, The proposed de-loading NAC is able to restore the system more rapidly with less voltage surge. Thus, NAC can significantly enhance the FRT capability of the VSC-HVDC systems with de-loading strategy.
(3) System response to different reduced voltage levels at onshore AC grid: Further comparing the three methods in detail with numerical values, simulations with different reducing voltage levels from 100% to 10% at onshore AC grid are implemented in this section and displayed in Figure 9. Since the conventional control strategy cannot restore the system and maintain stability after LLLG fault which lasts longer than 0.02 s, it needs to be noticed that the fault in this part is selected to be cleared after 0.02 s for whole range comparison, which is different from the previous sections. For such a short time fault, the proposed de-loading NAC cannot present an obvious advantage with de-loading VC in comparing currents at REC side and DC voltage. However, the proposed strategy still can provide a slight improvement on them and especially significantly suppression on regulating currents at the SEC side.
(4) System response to AC grid with parameters variations: Since the main AC grid is extremely complex, which consists of large amounts of electrical devices with difficulties in fully detailed modelling like coupling reactors, transformers, AC filters different types of transmission lines or cables, and REC itself, the parameter variation at the onshore AC grid side is regarded as a common phenomenon due to temperature effects, minor internal faults, load change, and aging of these components. The parameter variation will cause mismatched and uncertain equivalent line impedance in simulating system model. The robustness against AC grid parameter uncertainties is tested and the comparison of two de-loading control strategies is illustrated in this section. The mismatches on reactance and resistance will cause different, equally severe impacts on FRT performance. Hence, different levels of mismatch are also evaluated in this section. From (a) and (b) of Figure 10 with the simulation of 30% mismatch at onshore AC gird equivalent impedance, the proposed de-loading NAC strategy can provide better transient performance comparing with de-loading VC strategy. From comparing (c) and (d) of Figure 10, the proposed de-loading NAC strategy can provide relatively smaller peak current and can relieve the impact on power electronics devices in systems. From comparing (e) and (f) of Figure 10, the overshoots of DC voltage are also reduced via adopting the proposed de-loading NAC strategy.
(5) System response to HVDC link with parameters variations: Besides mismatched parameters of the onshore AC grid, VC controller is more sensitive to mismatched parameters of HVDC link. The (a) and (b) of Figure 11 demonstrate that the mismatched impedance of HVDC link will cause more severe oscillation when regulating DC voltage and AC currents during onshore AC grid voltage sag. Similarly, (c)–(f) of of Figure 11 are used for evaluating the FRT performance under different level of mismatches of reactance and resistance. Unlike mismatches of parameters in AC grids, where mismatches of resistance and reactance play equally important roles on FRT performance, the mismatches of resistance play relatively severe impact on DC link comparing the mismatches of reactance. From (c) and (d) of Figure 11, the peak AC current is suppressed and maintained into a relatively small range via adopting the proposed de-loading NAC strategy. From (e) and (f) of Figure 11, although the overshoots of DC voltage varied obviously with fluctuation of resistance and the peak value increases linearly with the equivalent resistance value, the proposed de-loading NAC strategy still suppresses the DC voltage effectively comparing with conventional de-loading strategy.
(6) System response for evaluating the de-loading strategy with different droop gains: For evaluating the FRT performance of adopting the proposed de-loading strategy with different droop gains, different droop gain is adopted in de-loading control strategies. is selected from 0.2 to 0.4 and then the system response of different droop gains is illustrated in Figure 12. From comparing the simulation results with different droop gains, for both VC and NAC, larger droop gains can suppress AC currents and DC voltage overshoots more effectively. However, besides the FRT performance there is control performance need to be considered. To compare the control performance of each schemes in difference droop gains, the overall control costs is calculated and provided in Table 3. Here, the control cost of the SEC controller , where is the initial value which being set in advance. The units of system variables are p.u. The simulation time s such that all system states can converge to the equilibrium point after AC grid voltage sag. Note that under the nominal model, NAC has a little bit higher value than VC due to the estimation error, where the difference is only , , , , and of the de-loading VC. For evaluating the different droop gains, it can be found that increasing the droop gains although enhances the FRT performance and also increases the control costs. In order to get satisfied FRT performance and also maintain the acceptable control efforts, 0.3 is chosen for proposed control strategy.
The integral of absolute error (IAE) indices for different approaches calculated in different situations are tabulated in Table 4. Here, . is the reference value of the variable x. The simulation time T is set to be 0.5s. From Table 4, proposed NAC does not provide much obvious better dynamic performance within the nominal system model. However, in the case of system parameter variations, it can provide much better dynamic performance. In particular, its with AC grid parameter uncertainties and DC link parameter uncertainties are only 62.4% and 52.7% of those of VC control, its with AC grid parameter uncertainties and DC link parameter uncertainties are only 72.1% and 66.7% of those of VC control.
In offshore WECS which are integrated into the mainland AC grid via HVDC system, transient inrush VSC currents are raised following a voltage sag on AC grid [34]. Therefore, the offshore VSC current in HVDC system station is very important index to measure the FRT capability. According to multiple cases of simulation results mentioned above, the peak current is greatly suppressed via the proposed control approach. From all the simulation cases, it is obvious that the converter peak current is effectively reduced in comparison with conventional VC and deloading VC control. In particular, the REC peak current is only 75% and 87% of that of conventional VC control and deloading VC control with 35% voltage sag in nominal model. Since the peak current includes the rated current under normal operation, is taken into consideration for better understand the improvement with proposed FRT strategy in comparison, where is the peak value of the converter current and the is the converter current set-point value when system under normal operation. The %overshoot of REC fault current with the proposed deloading NAC is only 52.1% and 71.8% of that of conventional VC control and deloading VC control, with 35% voltage sag in nominal model. In the case with parameter uncertainties, the peak current is only 85.9% of that of deloading VC control and %overshoot of fault current is only 69.2% of that of deloading VC control. Therefore, the enhanced FRT capability of proposed FRT strategy has been verified.
5. Conclusions
This paper has developed a novel NAC-based REC controller and SEC controller for VSC-HVDC transmission systems with wind farms integrated, which can provide significant robustness against system uncertainties and rapid response to the de-loading process for enhancing the FRT capability. The proposed FRT strategy effectively suppresses peak AC current surge and DC voltage rise during AC mainland grid fault and hence prevents serious mechanical stress to the power electronic devices. The proposed NAC adopts HGPOs and HGSPOs to obtain estimates of the system states and perturbation terms. Therefore, it can compensate the perturbation in real-time and provide optimal performance over the whole system operation range and the control performance will not degrade for the system nonlinearity during severe faults. The simulation results have verified that the proposed FRT strategy enhanced the system FRT capability effectively, especially under the circumstance of a system with parameter uncertainties.
Author Contributions
Conceptualization, Y.S. and B.Y.; validation, Y.S. and H.S.; investigation, N.A. and F.Z.; methodology, T.Y. and H.S.; writing—original draft preparation, Y.S.; writing—review and editing, Y.S. and B.Y.; visualization, Y.S. and N.A.; supervision, T.Y. and H.S.; project administration, B.Y.; funding acquisition, B.Y.
Funding
This research was funded by National Natural Science Foundation of China grant number (51667010, 51777078).
Conflicts of Interest
The authors declare no conflict of interest.
References
- Yang, B.; Yu, T.; Shu, H.C.; Dong, J.; Jiang, L. Robust sliding-mode control of wind energy conversion systems for optimal power extraction via nonlinear perturbation observers. Appl. Energy 2018, 210, 711–723. [Google Scholar]
- Yang, B.; Jiang, L.; Wang, L.; Yao, W.; Wu, Q.H. Nonlinear maximum power point tracking control and modal analysis of DFIG based wind turbine. Int. J. Electr. Power Energy Syst. 2016, 74, 429–436. [Google Scholar] [Green Version]
- Bresesti, P.; Kling, W.L.; Hendriks, R.L.; Vailati, R. HVDC Connection of Offshore Wind Farms to the Transmission System. IEEE Trans. Energy Convers. 2007, 22, 37–43. [Google Scholar] [CrossRef]
- Yang, B.; Zhang, X.S.; Yu, T.; Shu, H.C.; Fang, Z.H. Grouped grey wolf optimizer for maximum power point tracking of doubly-fed induction generator based wind turbine. Energy Convers. Manag. 2017, 133, 427–443. [Google Scholar] [CrossRef]
- Faisal, R.; Badal, P.D.; Subrata, S.K.; Sajal, K.D. A survey on control issues in renewable energy integration and microgrid. Prot. Control Mod. Power Syst. 2019, 4, 87–113. [Google Scholar]
- Carrasco, J.M.; Franquelo, L.G.; Bialasiewicz, J.T.; Galvan, E.; Guisado, R.C.P.; Prats, M.A.M.; Leon, J.I.; Moreno-Alfonso, N. Power-electronic systems for the grid integration of renewable energy sources: A survey. IEEE Trans. Power Electron. 2006, 53, 1002–1016. [Google Scholar] [CrossRef]
- Butti, D.; Mangipudi, S.; Rayapudi, S. Interconnected multi-machine power system stabilizer design using whale optimization algorithm. Prot. Control Mod. Power Syst. 2019, 4, 13–23. [Google Scholar]
- Li, J.H.; Wang, S.; Ye, L.; Fang, J.K. A coordinated dispatch method with pumped-storage and battery-storage for compensating the variation of wind power. Prot. Control Mod. Power Syst. 2018, 3, 21–34. [Google Scholar]
- Moawwad, A.; El Moursi, M.S.; Xiao, W. Advanced fault ride-through management scheme for VSC-HVDC connecting offshore wind farms. IEEE Trans. Power Syst. 2016, 31, 4923–4934. [Google Scholar] [CrossRef]
- Nanou, S.; Patsakis, G.; Papathanassiou, S. Assessment of communication-independent grid code compatibility solutions for VSC-HVDC connected offshore wind farms. Electr. Power Syst. Res. 2015, 121, 38–51. [Google Scholar]
- Yaramasu, V.; Wu, B.; Sen, P.C.; Kouro, S.; Narimani, M. High-power wind energy conversion systems: State-of-the-art and emerging technologies. Proc. IEEE 2015, 103, 740–788. [Google Scholar] [CrossRef]
- TenneT TSO GmbH. Requirements for Offshore Grid Connections in the Grid of TenneT TSO GmbH; TenneT TSO GmbH: Bayreuth, Germany, 2012. [Google Scholar]
- Feltes, C.; Wrede, H.; Koch, F.W.; Erlich, I. Enhanced Fault Ride-Through Method for Wind Farms Connected to the Grid Through VSC-Based HVDC Transmission. IEEE Trans. Power Syst. 2009, 24, 1537–1546. [Google Scholar] [CrossRef]
- Daoud, M.I.; Massoud, A.M.; Abdel-Khalik, A.S.; Elserougi, A.; Ahmed, S. A flywheel energy storage system for fault ride through support of grid-connected VSC HVDC-based offshore wind farms. IEEE Trans. Power Syst. 2016, 31, 1671–1680. [Google Scholar] [CrossRef]
- Kirakosyan, A.; Moursi, M.S.E.; Khadkikar, V. Fault Ride Through and Grid Support Topology for the VSC-HVDC Connected Offshore Wind Farms. IEEE Trans. Power Deliv. 2017, 32, 1592–1604. [Google Scholar]
- Vrionis, T.D.; Koutiva, X.I.; Vovos, N.A.; Giannakopoulos, G.B. Control of an HVdc link connecting a wind farm to the grid for fault ride-through enhancement. IEEE Trans. Power Syst. 2007, 22, 2039–2047. [Google Scholar] [CrossRef]
- Xu, L.; Yao, L.; Sasse, C. Grid integration of large DFIG-based wind farms using VSC transmission. IEEE Trans. Power Syst. 2007, 22, 976–984. [Google Scholar]
- Ramtharan, G.; Arulampalam, A.J.; Ekanayake, B.; Hughes, F.M.; Jenkins, N. Fault ride through of fully rated converter wind turbines with AC and DC transmission systems. IET Renew. Power Gener. 2009, 4, 426–438. [Google Scholar] [CrossRef]
- Erlich, I.; Feltes, C.; Shewarega, F. Enhanced voltage drop control by VSC-HVDC systems for improving wind farm fault ridethrough capability. IEEE Trans. Power Deliv. 2014, 29, 378–385. [Google Scholar] [CrossRef]
- Mullane, A.; Lightbody, G.; Yacamini, R. Wind turbine fault ride through enhancement. IEEE Trans. Power Syst. 2015, 20, 1929–1937. [Google Scholar]
- Wu, Q.H.; Jiang, L.; Wen, J.Y. Decentralized adaptive control of interconnected non-linear systems using high gain observer. Int. J. Control 2004, 77, 703–712. [Google Scholar] [CrossRef]
- Jiang, L.; Wu, Q.H.; Wen, J.Y. Decentralized nonlinear adaptive control for multi-machine power systems via high-gain perturbation observer. IEEE Trans. Circuits Syst. I Reg. Pap. 2004, 51, 2052–2059. [Google Scholar] [CrossRef]
- Chen, J.; Jiang, L.; Yao, W.; Wu, Q.H. Perturbation estimation based nonlinear adaptive control of a full-rated converter wind turbine for fault ride-through capability enhancement. IEEE Trans. Power Syst. 2014, 29, 2733–2743. [Google Scholar] [CrossRef]
- Moharana, A.; Dash, P.K. Input-output linearization and robust sliding-mode controller for the VSC-HVDC transmission link. IEEE Trans. Power Deliv. 2010, 25, 1952–1961. [Google Scholar] [CrossRef]
- Tummala, S.L.V.A. Modified vector controlled DFIG wind energy system based on barrier function adaptive sliding mode control. Prot. Control Mod. Power Syst. 2019, 4, 34–41. [Google Scholar]
- Yazdani, A.; Iravani, R. Voltage-Sourced Converters: Modeling, Control, and Applications; Wiley: Hoboken, NJ, USA, 2010. [Google Scholar]
- Kunjumuhammed, L.P.; Pal, B.C.; Gupta, R.; Dyke, K.J. Stability analysis of a PMSG-based large offshore wind farm connected to a VSC HVDC. IEEE Trans. Energy Convers. 2017, 32, 1166–1176. [Google Scholar] [CrossRef]
- Yang, B.; Yu, T.; Shu, H.C.; Zhang, Y.M.; Chen, J.; Sang, Y.Y.; Jiang, L. Passivity-based sliding-mode control design for optimal power extraction of a PMSG based variable speed wind turbine. Renew. Energy 2018, 119, 577–589. [Google Scholar] [CrossRef]
- Jiang, L.; Wu, Q.H.; Wen, J.Y. Nonlinear adaptive control via sliding-mode state and perturbation observer. IEE Proc. Control Theory Appl. 2002, 149, 269–277. [Google Scholar] [CrossRef]
- Liu, Y.; Wu, Q.H.; Zhou, X.X.; Jiang, L. Perturbation observer based multiloop control for the DFIG WT in multimachine power system. IEEE Trans. Power Syst. 2014, 29, 2905–2915. [Google Scholar] [CrossRef]
- Sang, Y.Y.; Yang, B.; Jiang, L. Nonlinear adaptive control design for the VSC-HVDC light transmission system. In Proceedings of the 2015 50th International Universities Power Engineering Conference (UPEC), Stoke on Trent, UK, 1–4 September 2015. [Google Scholar]
- Li, S.; Timothy, A.; Haskew, T.; Swatloski, P.; Gathings, W. Optimal and direct-current vector control of direct-driven PMSG wind turbines. IEEE Trans. Power Electron. 2012, 27, 2325–2337. [Google Scholar] [CrossRef]
- Li, S.; Haskew, T.A.; Xu, L. Control of HVDC light system using conventional and direct current vector control approaches. IEEE Trans. Power Electron. 2010, 25, 3106–3118. [Google Scholar]
- Silva, B.; Moreira, C.; Leite, H.; Pecas Lopes, J. Control Strategies for AC Fault Ride through in Multiterminal HVDC Grids. IEEE Trans. Power Deliv. 2014, 29, 395–405. [Google Scholar] [CrossRef]
Figure 1.
Fault ride-through (FRT) profiles according to the German Transmission and Distribution Utility (E.ON) regulation [11].
Figure 1.
Fault ride-through (FRT) profiles according to the German Transmission and Distribution Utility (E.ON) regulation [11].

Figure 2.
The configuration of the offshore wind farms that need to be integrated.

Figure 3.
The configuration of the voltage-source converter-based high voltage direct current (VSC-HVDC) system.
Figure 3.
The configuration of the voltage-source converter-based high voltage direct current (VSC-HVDC) system.

Figure 4.
The overall control structure of the nonlinear adaptive control (NAC)-based receiving end VSC station (REC) controller and sending end VSC station (SEC) controller of the VSC-HVDC systems with type-4 wind energy conversion systems (WECS).
Figure 4.
The overall control structure of the nonlinear adaptive control (NAC)-based receiving end VSC station (REC) controller and sending end VSC station (SEC) controller of the VSC-HVDC systems with type-4 wind energy conversion systems (WECS).

Figure 5.
The equivalent circuit of the WECS with current limiter.

Figure 6.
System responses obtained through REC with voltage sag at onshore AC grid. (a) Onshore grid side three-phase AC voltage; (b) REC side three-phase AC current with conventional VC; (c) REC side three-phase AC current with deloading VC; (d) REC side three-phase AC current with deloading NAC; (e) REC side current in d-q axis with three approaches.

Figure 7.
System responses obtained through SEC with voltage sag at onshore AC grid.

Figure 8.
System responses obtained with 0.15 s duration of line-line-line-ground (LLLG) fault at onshore AC grid.
Figure 8.
System responses obtained with 0.15 s duration of line-line-line-ground (LLLG) fault at onshore AC grid.


Figure 9.
System responses obtained with 0.02 s duration of different reduced voltage levels at onshore AC grid.
Figure 9.
System responses obtained with 0.02 s duration of different reduced voltage levels at onshore AC grid.

Figure 10.
System responses obtained with 0.3 s duration of 30% voltage sag at onshore AC grid with grid parameter uncertainties.
Figure 10.
System responses obtained with 0.3 s duration of 30% voltage sag at onshore AC grid with grid parameter uncertainties.

Figure 11.
System responses obtained with 0.3 s duration of 30% voltage sag at onshore AC grid with DC link parameter uncertainties.
Figure 11.
System responses obtained with 0.3 s duration of 30% voltage sag at onshore AC grid with DC link parameter uncertainties.

Figure 12.
System responses obtained with 0.3 s duration of voltage sag with different de-loading droop gains.
Figure 12.
System responses obtained with 0.3 s duration of voltage sag with different de-loading droop gains.


Table 1.
System parameters used in the Section 4.
Table 1.
System parameters used in the Section 4.
| AC grid frequency | f | 50 Hz |
| AC grid base voltage | 100 kV | |
| DC link base voltage | 200 kV | |
| AC grid base power | 100 MVA | |
| AC grid line resistance (25 km) | 0.05 /km | |
| AC grid line inductance (25 km) | 0.026 mH/km | |
| DC link resistance (50 km) | 0.21 /km | |
| DC bus capacitance | 11.94 F |
Table 2.
Controller parameters used in the Section 4.
Table 2.
Controller parameters used in the Section 4.
| Rectifier controller | |||
| Control gains | |||
| Observer gains | |||
| Inverter controller | |||
| Control gains | |||
| Observer gains | |||
Table 3.
Overall control costs of different control schemes with varying de-loading droop gain.
| Droop gain | |||||
| Deloading VC | 0.01165 | 0.01365 | 0.01701 | 0.0197 | |
| Deloading NAC | 0.00969 | 0.01177 | 0.01385 | 0.01733 | 0.02008 |
Table 4.
Integral of absolute error (IAE) indices (in p.u.) of different control schemes calculated in different cases.
Table 4.
Integral of absolute error (IAE) indices (in p.u.) of different control schemes calculated in different cases.
| Simulation Cases | Variables | Control Approaches | |
|---|---|---|---|
| Deloading VC | Delaoding NAC | ||
| 35% Voltage sag nominal model | 0.131 | 0.1223 | |
| 0.613 | 0.6041 | ||
| 0.561 | 0.5432 | ||
| 30% AC system parameter mismatches | 0.212 | 0.1323 | |
| 0.3964 | 0.2011 | ||
| 0.7546 | 0.5439 | ||
| 30% DC system parameter mismatches | 0.2713 | 0.143 | |
| 0.5063 | 0.2103 | ||
| 0.9043 | 0.6034 | ||
© 2019 by the authors. Licensee MDPI, Basel, Switzerland. This article is an open access article distributed under the terms and conditions of the Creative Commons Attribution (CC BY) license (http://creativecommons.org/licenses/by/4.0/).
Share and Cite
MDPI and ACS Style
Sang, Y.; Yang, B.; Shu, H.; An, N.; Zeng, F.; Yu, T. Fault Ride-Through Capability Enhancement of Type-4 WECS in Offshore Wind Farm via Nonlinear Adaptive Control of VSC-HVDC. Processes 2019, 7, 540. https://doi.org/10.3390/pr7080540
AMA Style
Sang Y, Yang B, Shu H, An N, Zeng F, Yu T. Fault Ride-Through Capability Enhancement of Type-4 WECS in Offshore Wind Farm via Nonlinear Adaptive Control of VSC-HVDC. Processes. 2019; 7(8):540. https://doi.org/10.3390/pr7080540
Chicago/Turabian StyleSang, Yiyan, Bo Yang, Hongchun Shu, Na An, Fang Zeng, and Tao Yu. 2019. "Fault Ride-Through Capability Enhancement of Type-4 WECS in Offshore Wind Farm via Nonlinear Adaptive Control of VSC-HVDC" Processes 7, no. 8: 540. https://doi.org/10.3390/pr7080540
Note that from the first issue of 2016, this journal uses article numbers instead of page numbers. See further details here.