Article

Improving the Performance of Entities in the Mining Industry by Optimizing Green Business Processes and Emission Inventories

by
Ionica Oncioiu
1,*,
Sorinel Căpuşneanu
1,
Dana-Maria Oprea Constantin
2,
Mirela Cătălina Türkeș
3,
Dan Ioan Topor
4,
Florentina Raluca Bîlcan
5 and
Anca Gabriela Petrescu
5
1
Faculty of Finance-Banking, Accounting and Business Administration, Titu Maiorescu University, 040051 Bucharest, Romania
2
Faculty of Geography, University of Bucharest, 050107 Bucharest, Romania
3
Faculty of Finance, Banking and Accountancy, Dimitrie Cantemir Christian University, 040051 Bucharest, Romania
4
Faculty of Economic Sciences, 1 Decembrie 1918 University, 510009 Alba-Iulia, Romania
5
Faculty of Economic Sciences, Valahia University, Carol I Bvd, No. 2, 130024 Targoviste, Romania
*
Author to whom correspondence should be addressed.
Processes 2019, 7(8), 543; https://doi.org/10.3390/pr7080543
Submission received: 5 July 2019 / Revised: 9 August 2019 / Accepted: 12 August 2019 / Published: 16 August 2019
(This article belongs to the Special Issue Design and Control of Sustainable Systems)

Abstract

:
Due to environmental considerations, environmental sustainability has become the main target of contemporary organizations, which has a direct influence on increasing their performance. The purpose of this study was to present the efficiency of green business process optimization for the performances of mining entities. Quantitative research was carried out on a sample of 209 people in an economic entity in the mining industry. The results of the study indicated real possibilities to achieve the objectives set in the research undertaken. Using business process management, the authors examined how green business processes can be optimized in a Romanian mining entity. The main results determined the degree of pollution from suspended and sedimentary dust particles due to coal production from the mining entity that was studied. Moreover, the present research proved that certain key environmental indicators underlie the performance and optimization of green business processes. The practical implications of this study are to respect and continually improve the management of the processes of activities, to reduce the costs of depollution and increase the performances.

1. Introduction

Changes in environmental policies worldwide have affected not only natural living conditions but also economic, social, and political consequences [1,2,3]. In this context, environmental protection, social equity, and well-being have become priorities in ensuring the concept of sustainable development [4,5,6]. In this respect, business process management plays an essential role in generating value for every business process, especially environmental sustainability [7,8,9]. By integrating business process management (BPM) and business process optimization, green business process management (GBPM) is the right solution for an organization that wants to be competitive, profitable, and environmentally friendly. Both the environmental performance of the organization and long-term sustainability are achieved by optimizing green business processes.
Considering the studies undertaken by specialists around the world [10,11,12,13,14,15,16,17,18,19,20], we have set out to conduct a study on improving performance by optimizing green business processes within an economic entity in the mining industry in Romania. This study contributes to the expansion of Green Business Process Management knowledge in the mining field with a dual importance for all categories of specialists: (1) facilitates the successful implementation of Green Business Process Management within mining entities; and (2) provides managers with a solution in identifying a new opportunities to increase performance by optimizing green business processes.
With this background, this paper is structured as follows: In Section 2, we analyze a series of previous studies on business process management and green business process management. Section 3 presents the research methodology. In Section 4 and Section 5, the empirical results and discussions, respectively, demonstrate the performance of the mining entity on the basis of environmental indicators. The main conclusions of this research are provided in Section 6.

2. Materials

2.1. Business Process Management (BPM) and Green Business Process Management (GBPM)

As defined by the World Commission on Environment and Development, sustainability is “development that meets the needs of the present without compromising the ability of future generations to meet their own needs” [21]. Some authors define BPM as a discipline that provides the concepts, appropriate methods, and tools for modeling, implementing, operating, and monitoring business processes [22]. In the current view of some specialists, business process management is a combination of the information technology resources needed to optimize the performance of certain processes [23,24]. In addition, information systems that add value to their business information technology are included in this definition [25,26].
Based on the concept of sustainability, the business process management framework has been broadened by including environmental considerations, thus leading to GBPM. The definition of this concept also takes into account the environmental consequences of business processes [27], the ecological dimension of business process optimization [28], or the support of environmental objectives [29].
To evaluate business process management, most specialists use the maturity model as a performance measure [7,30]. It allows an organization to evaluate its business process performance based on six criteria: culture, methods, technology, people, strategic alignment, and governance [7,31]. In order to achieve the goal of managing green business processes, information technology and systems should be integral parts of the maturity model [32,33].
The execution of a business process always has a definite impact on the environment [34,35]. As a business process converts inputs into outputs, inputs from renewable and nonrenewable sources, as well as the type and quality of the output environment, determine the sustainability of a business process [36]. Thus, the magnitude of the production factors from renewable sources as well as the degree of emissions (outputs) that can maintain the environmental assimilation capacity should be maximized, while the degree of non-regenerative inputs and the magnitude of the emissions (outflows) that can maintain environmental assimilation capacity should be minimized [31,37].
In other words, a green business process is a conscious environmental business process that is necessary, effective, effective, agile, and measurable within an organization [38] and that brings value to the organization with minimal impact on the environment [39]. A sustainable (green) business process generates business value with a minimal impact on the environment and without compromising environmental resources at the expense of future generations [40].

2.2. Criteria for Assessing the Performance of Green Business Processes

The components of the Business Process Management Capabilities model are the success factors in its implementation: strategic alignment, methods, information technology, governance, people, and culture. When implementing green business process management, most specialists and organizations pay considerable attention to strategic alignment, methods, and information technology and less to governance, people, and culture [41].
Strategic alignment refers to the business process management cycle that must be correlated with the organization’s overall strategy, thus enabling continuous improvement and business goals. The green strategy presents the interface between processes, strategic planning, and control and is the framework for sustainable action [42,43].
Based on this, eco-guides are built and employees are trained accordingly [44]. The green strategy determines which technological devices will be used to support green activities [7,45]. According to certain specialists, strategic alignment with environmental objectives can be achieved by key environmental indicators [34,46,47], sustainability indicators [48], the motivational business model [49], and the Balanced Sustainability Scoreboard [50].
The methods are the set of tools and techniques that allow and support the actions that take place over the life cycle of business process management. Most specialists have opted for a wide range of methods or tools to help measure organizations’ green performance, and the most well-known are Activity-Based Emissions (ABE) [30,41], management based on green activities (Green-Activity-Based Management, GABM) and Business Process Simulation (BPS), and Emission Annotations (EA) [51,52,53].
Information technology refers to solutions based on software and hardware systems and information that allows support of specific activities of business process management [54]. Among these systems that support green activity in an organization are the evaluation of process modeling tools [55], geographic information system (GIS) [42], process mining [19], and energy informatics [56].
Viewing the processes using swim-lane diagrams, as well as analyzing and evaluating them through key ecological indicators (KEIs), should result in the optimization of business processes regarding environmental impacts [57,58]. Even optimizing only part of the entire business process should lead to improvements and create value for the organization. Starting from the ideas discussed by the aforementioned authors, we intend to carry out our study to highlight the performance of an extractive mining entity by optimizing green business processes, using the swim-lane diagrams for process visualization and for analyzing/evaluating them the economic and financial indicators of the entity.

3. Methods

In order to accomplish this research, we considered the hypothesis that the performance of a mining economic entity is being improved by optimizing its green business processes. Given this hypothesis, this work has a double purpose: (1) to demonstrate how organizations are capable of optimizing green business processes in order to streamline their activities, and (2) to increase environmental performance by using green strategic alignment for an entity in the mining industry.
In this study, our research objectives were based on two solid concepts related to (1) the maturity model and (2) the sum of all information systems that support management activities and help monitor and reduce the environmental impact of business processes in the design, implementation, or exploitation phases, leading to cultural changes in the process life cycle [20]. Thus, our objectives were: (1) the strategic alignment of the environmental objectives of the economic entity by incorporating them into business processes; and (2) enhancing environmental performance through the use of green strategic alignment within the entity.
Thus, in order to achieve the objectives, quantitative research was carried out among two categories of persons (specialists and management) within an economic entity in the mining extractive industry in Romania. The main considerations were (1) optimization of green business processes within the entity; (2) implementation of green business process management; (3) to enhance enterprise performance by optimizing green business processes. In the quantitative study, the survey was used as method, using the questionnaire as a data collection tool. The study ran from 15–30 July, 2016, using four interviewers with experience in the field, who distributed questionnaires to the economic entity. This study analyzed the use of green business process management to optimize activities within a mining entity and to use the emissions-based method to enhance environmental performance based on key environmental indicators.
The study sample included 209 people from two categories: specialists (miners) and management (heads of departments, senior management). The questionnaire was composed of three questions as follows: (1) Does green business process management contribute to making your business more efficient? (2) What is the modern method for determining pollutant emissions in your company? (3) What are the cost and performance benefits for your company? Table 1 and Figure 1 show the results from collecting the questionnaires and performing data centralization.
As we can see in Figure 1, in a very large proportion, both specialists and management agree that the management of green business processes contributes to the efficiency of their activities by using modern methods to determine the activities based on emissions pollution benefiting from long-term improvements (reducing operational environmental costs and increasing profit).
After conducting the survey and discussing the results, a brainstorming session was carried out, which contributed to a better understanding of the specialists on issues such as (1) identifying access to databases; (2) the relevance and updating of the data provided to the management of the current green business processes regarding the efficiency of the activities; (3) identifying weaknesses in enhancing environmental performance through the use of green strategic alignment in the considered mining entity; (4) modeling the data underlying green business processes; (5) monitoring green business processes; and (6) continuous improvement of the management of green business processes. All the information and findings were communicated both to the interviewees and the business process implementation team. Thus, three business processes were identified: the process of bidding assignment of mining projects, the process of budgeting the costs of mining works, and the process of mining works. At the basis of the selection were two criteria: the reduction of additional costs and the repetitiveness of certain similar operations. Based on all the information presented, we have done the optimization of green business processes by implementing Green Business Process Management (GBPM).

4. Results

In this study, the authors used two models that have already been established in the literature to demonstrate their viability in the mining extractive industry in Romania. Based on swim-lane charts, green business process optimization (GBPO) was shown to help create a favorable framework for increasing the performance of a mining entity. In order to highlight environmental performance, a series of key environmental indicators were considered; the role of which was to determine the degree of pollution due to suspended and sedimentary dust particles from coal production the mining entity studied. The overall findings illustrate the fact that optimizing green business processes and highlighting environmental performance are based on key environmental indicators.

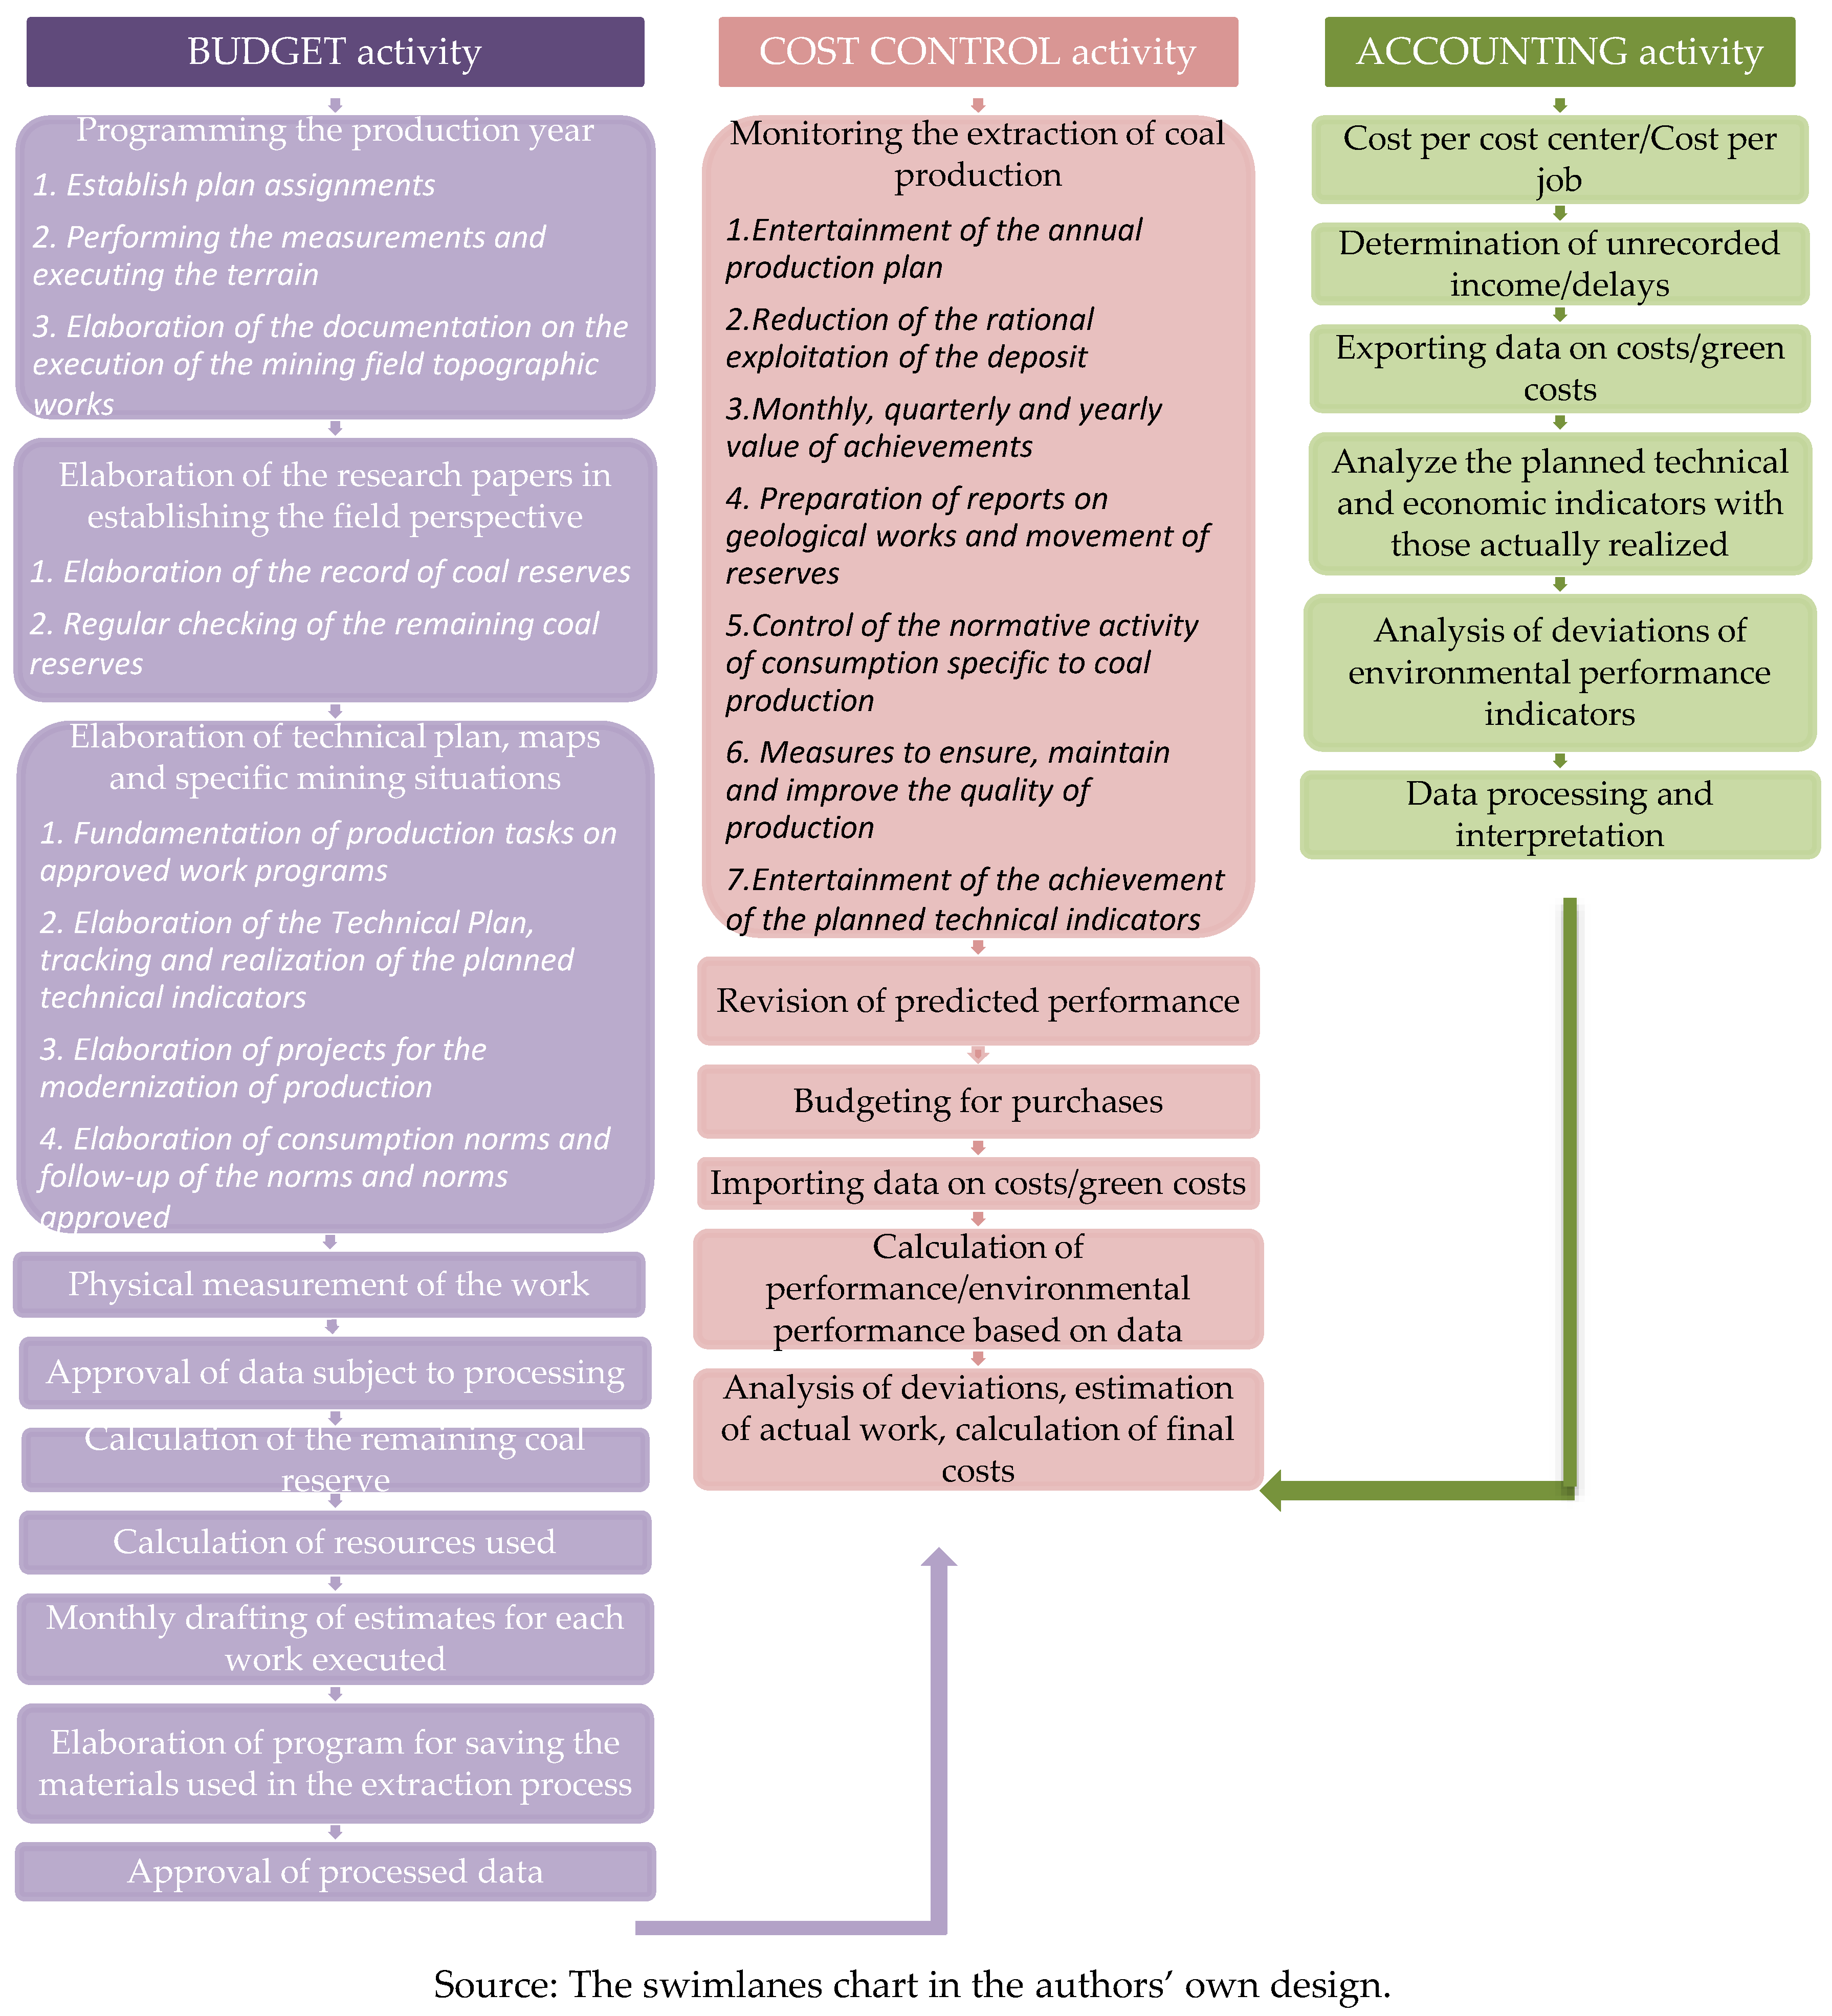
4.1. Presentation of Business Processes Before Optimization

The process of bidding assignment of mining projects is composed of two main activities: auction and management. The flow diagram of this process is shown in Figure 2.
The specific operations of the budgeting activity include elaboration of the annual production program; elaboration of the documentation regarding the research works in establishing the field perspective; development of the technical plan, maps, and specific mining situations; physical measurement of the work performed; endorsement of data subject to processing; calculating the remaining coal reserves; calculating the resources used; monthly drawing of the estimates for each executed work; elaboration of the program for saving the materials used in the extraction process; and approval of processed data.
The specific cost control operations are the following: monitoring the extraction of coal production; reviewing predicted performance; establishing the procurement budget; importing data on costs/green costs; calculation of performance/environmental performance based on data; and analysis of deviations, estimation of actual work, and calculation of final costs.
The following operations comprise the accounting activities: cost/job cost center registration; establishing unrecorded revenue/delays; exporting data on costs/green costs; analyzing the planned technical and economic indicators with those actually realized; analysis of deviations of environmental performance indicators; and data processing and interpretation.
In the process of budgeting the costs of mining, three activities were carried out: budgeting, cost control, and accounting. The flow diagram of the mining costs business process is presented in Figure 3.
The process of mining works consists of three activities: execution of works, cost control, and accounting. From the flow diagram presented in Figure 4, the following mining operations can be distinguished: the preparation of the situation (called preliminary) on the basis of a set of 22 documents related to predictive technical and economic indicators (i.e., production groups on layers, exploitation methods, sectors, coal reserves, preparation and opening of working fronts, loss of exploitation, coal quality, maintenance works, preservation and closure works, environmental protection and rehabilitation works, and programs for the use of technological equipment); calculating the resources used; and reviewing predicted performance.
In the cost control activity, the following operations were identified: physical measurement of the work performed; proposals for the rehabilitation, development, or shutdown of unprofitable works; evidence of samples, analysis bulletins, and completion and control of specific consumption; importing data on costs/green costs; recording and managing the entity’s overall operations; establishing the procurement budget; calculation of environmental performance; and deviation analysis. The following operations comprise the accounting activities: cost/job cost center registration; financial accounting activities; making cost calculations and settling the obtained output; setting the price per tons of coal; exporting data on costs/green costs; keeping records and salaries of staff; and the calculation of environmental performance indicators.

4.2. Business Process Analysis

According to the referrals of the employees of the business process: Execution of mining works regarding the existence of redundant operations has been investigated. In order to identify the redundant activities in the business process Execution of mining works, the analysis team devised a set of three questions, following the employees’ satisfaction, identifying the bottlenecks and suggestions for eliminating and improving the business process. These questions were as follows: (1) Which of the operations in this process caused frustration among employees or customers? (2) Which of the operations do you consider to cause bottlenecks in the optimization of the business process? (3) What suggestions for improving the business process do you propose? The interview was conducted by direct questioning (face to face) of the employees directly involved in the mentioned business process. In this way, the analysis team was able to better understand the phenomenon and apply a cause–effect analysis, in order to optimize the business process (Table 2).
Following the interviews and collecting the answers from the 22 employees in the Business Process (Execution of mining works) they revealed that there are some frustrations related to the volume of documents drawn up by other employees that are not directly related to those or large documents. Part of their activity is carried out by other employees who do almost the same thing. In addition, the production of these documents creates certain time lags, i.e., certain delays in providing and analyzing the documents to the direct information users. These had the effect of increasing certain additional costs, and thus a decrease in the company’s profit. The degree of dissatisfaction was also felt at the customers’ level, when the late delivery of coal took place. The circuit of the documents being difficult caused a chain reaction in the business process Execution of mining works and thus generated financial losses at the company level.
On the basis of the business process diagram, three operations related to the cost of the mining operation were identified as being ineffective for the whole process: endorsement of data subject to processing, calculation of the remaining coal reserves, and elaboration of the material saving program used in the extraction process. The three operations identified at the technical level can be eliminated, because according to the interviews conducted with the employees directly involved, the respective tasks can be performed by other employees in another activity that have similar tasks (for example: cost control or accounting). This reduces certain operational costs and eliminates the redundant operations that made it difficult for the efficiency of the information circuit normally developed in the business process. Following the cause–effect analysis, the following were established: (1) The Calculation of the remaining coal reserve will be included in the calculation of the resources used; (2) The Elaboration of program for saving the materials used in the extraction process will be passed to the Programming the production year; (3) The approval of the processed data will be passed to the data processing and interpretation.

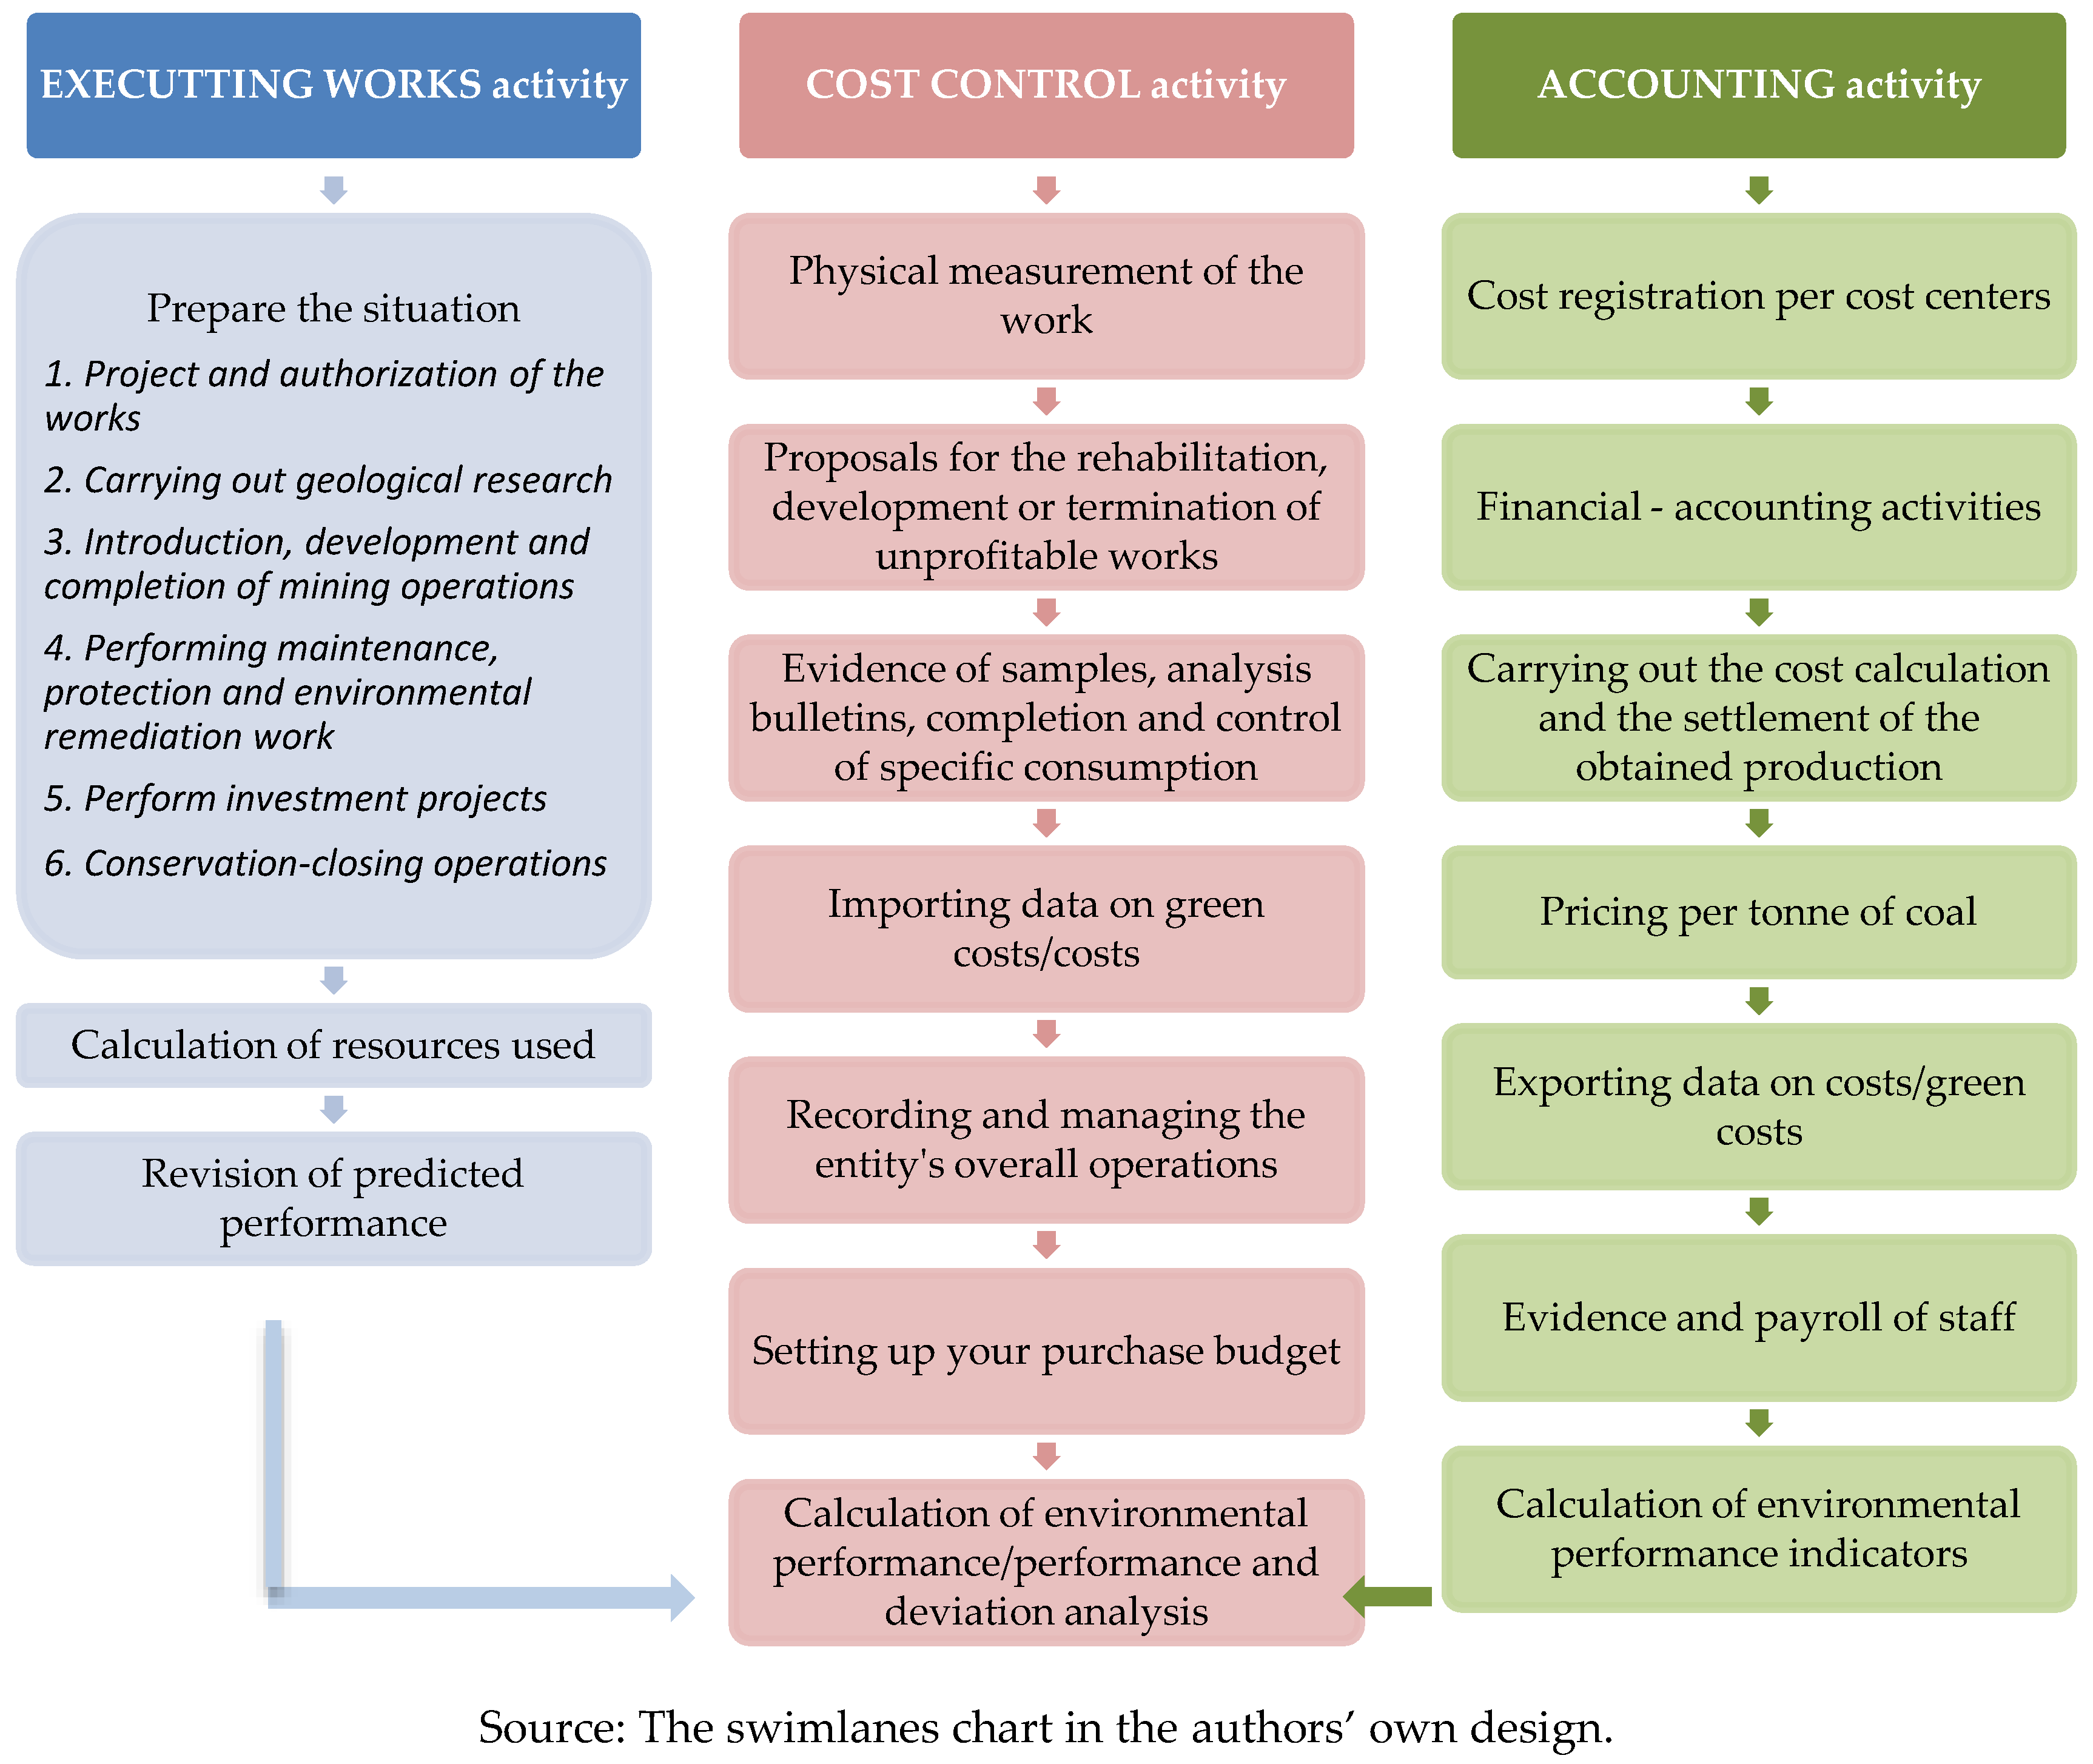
4.3. Presentation of Business Processes After Optimization

After analyzing the three operations, the business process analysis team decided to eliminate them, and the new diagram of business process activities is presented in Figure 5. This has resulted in the optimization of green business processes at the level of the activities of the mining entity.
Business process management centers on adapting an entity’s business to the ever-increasing needs and diversification of its customers. This approach is based on the flexibility and integration of computer applications that help to increase the efficiency of economic entities, leaving room for innovation. The most important aspect is that of helping to reduce operational costs by automating operations with software programs by using information from a process to understand and streamline the process and remove intermediaries from it.

5. Discussions

By redesigning the business process “Costs of the Mining Work”, an optimization of this was done, in order to eliminate the intermediate operations within the Budgeting Activity that incurred certain additional costs. After balancing operations in the business process, there was a significant reduction in operational costs that contributed to the calculation of total production cost. These issues are highlighted in Table 3 which also shows the differences resulting from the optimization of the business process. By removing the three operations, Approval of data subject to processing (21,987 thousand RON), Calculation of the remaining coal reserve (21,247 thousand RON), and Elaboration of program for saving the materials used in the extraction process (14,862 thousand RON), which amounted to 58,096 thousand RON (15.26% of the total cost of the budgeting activity) it was made an economy necessary to increase the environmental investments needed for the depollution.
In other words, the amount saved by eliminating the three intermediate operations within the budgeting activity (which were repetitive in some of the other operations) contributed to making green investments and thus optimizing green business processes within the mining entity. By lowering the operational costs and increasing the revenues earned by the economic entity, a slow increase in profit was achieved, which was also reflected in the economic and financial indicators, i.e., in the performance of the economic entity. This is highlighted in Table 3 which was prepared after the presentation and calculation of the environmental conditions indicators.
In managing the sustainability of a mining company to improve and evaluate environmental performance, environmental condition indicators (ICMs) are analyzed, the primary role of which is to help the mining entity better understand its present or potential impact on the environment. Without considering these, it is not possible to analyze and evaluate environmental performance indicators (IPMs). These two categories of indicators are an integral part of the environmental performance assessment [59,60]. In our analysis, we used environmental condition indicators, which are based on air concentrations of suspended and sedimental powders. It is not by accident that we chose to analyze this environmental status indicator; in the mining industry, suspended and sedimental powders have the greatest impact on air quality [61,62].
Particulate powders or pollutants are a mixture of organic substances (carbon particles, heavy metals, iron oxides, sulphates, and persistent organic pollutants) and inorganic ones [63] which are generated by a multitude of stationary or mobile natural and anthropogenic sources and can be formed even in the atmosphere through chemical and physical transformation [64,65].
In the case of the mining industry, particulate pollutants are generated during the mining and handling of ores or coals or are wind-driven on the surface of the excavated material. Following particulate behavior, particulate pollutants are classified as follows: (1) suspended particulates that are less than 10 μm in diameter and have high stability and spreading power in the atmosphere, reaching the ground only through precipitation; (2) sedimental dusts with a diameter of more than 10 μm and low scatter stability and spreadability, which are spread to about 3 km, so they are deposited on the ground near the emission sources [66]. In order to highlight the environmental performance of the mining entity, the monthly and daily inventory of particulate and sedimental particulate emissions for September 2016–2018 was used to identify and assess trends in particulate pollutant evolution. September was chosen because it is when the environmental monitoring laboratory of the mining entity performs its yearly check at the control points for suspended particulate matter (sterile transport, coal loading in wagons, ventilation station, and auto transport enclosure) and sedimentary powders (auto-carriage and charging of coal in wagons). All these control points are located inside the mining entity. The obtained results were compared with the data from the manual air quality monitoring carried out by the National Environmental Protection Agency.
These data were compared to the admissible limit values established in Romania by STAS 12574-87 and Law No. 104/2011 on ambient air quality [67]. For particulate matter, the admissible limit values are: 0.5 mg/m3 for the 30 min average concentration, 0.15 mg/m3 for the maximum permissible daily concentration, and 0.075 mg/m3 for the maximum permissible annual concentration. For sedimental powders, the monthly limit value is 17.0 g/m3 (Table 4).
Regarding the concentration of suspended particulate matter in the control points located within the mining entity, Table 4 and Figure 6 show that there was a decrease in the particulate matter concentrations for all control points from September 2016 to September 2018, except for the auto-checkpoint, where there was a slight increase of 0.03 mg/m3 for September 2017. The mean values of September for the 2016–2018 interval ranged between 0.02 and 0.13 mg/m3. The highest values were recorded at the sterile transport flow control point due to the fact that the transport of tailings generates industrial dust which rises and spreads into the atmosphere, leading to more pronounced air pollution. It should also be noted that all values recorded for the analyzed time period were below the permitted limit of 0.5 mg/m3.
From the data collected and centralized by the National Environmental Protection Agency for the area in which the studied mining entity is located, the values of 0.0886 mg/m3 for September 2016, 0.0884 mg/m3 for September 2017, and 0.0883 mg/m3 for September 2018 were recorded for suspended particulate pollutants. There was a slight decrease of 0.0003 mg/m3 for September 2016. Both values were below the 24 h limit value of 0.15 mg/m3 for air.
For sedimental dust pollutants, Table 5 shows a lower value in September 2017 compared with September 2016 at both control points, with higher values at the charging points of coal loading wagons caused by the dust produced during charging. The average monthly value varied between 12.50 and 13.39 g/m2. All recorded values were below the permitted limit of 17 g/m2.
Regarding the data collected and centralized by the National Environmental Protection Agency, it was found that for the sedimentary powders, the registered concentrations were 11.07 g/m2 for September 2016, 10.63 g/m2 for September 2017 and 10.25 g/m2 for September 2018, all values being below the limit value allowed (Figure 7). There was the same downward trend for 2017 and 2018, as in the case of particulate matter.
As a result, the analysis of the emission inventories within the mining entity and the manual sampling by the National Environmental Protection Agency showed a slight decrease in the concentrations of suspended and sedimental particulate concentrations, which were below the admissible limit value. Emission inventories are an important tool in developing plans to improve environmental performance and air quality components and to evaluate control and intervention policies. It is recommended to continuously minimize air emissions and, implicitly, particulate and sedimentary dust emissions by permanently upgrading the ventilation system and applying dust control measures to the lanes and open transportation routes.
These recommendations are justified by the fact that particulate pollutants have an irritating effect on the eyes and respiratory system and decrease the immunity of the body to infections. They also reduce the transparency of the atmosphere, favoring the heating of the air by capturing solar heat and changing the precipitation regime. The negative action of these pollutants effects both the environment (air, soil, and vegetation) and human health.
In line with the changes in the legislation on integrated pollution prevention and control adopted in 2005, the entity had to adopt an alignment program, which included some steps to be taken. This program concerns limiting the emission into the atmosphere of certain pollutants generated by high-capacity combustion plants, such as by reducing dust emissions to the limit values set out in Directive 2000/120/75/EU. The entity operates in an unfair competitive environment in an electricity market in which the electricity sales price is artificially lowered by the renewable energy sectors, which mainly seek to obtain green certificate profits rather than the actual energy price. As a result of the abolition of the regulated market, which ensures the sale of electricity at prices approved by National Regulatory Authority for Energy at the level of the justified real costs, the electricity produced by the entity is sold at low prices dictated by other producers favoring hydro, wind, photovoltaic, and other types of renewable energy.
In 2016, the entity recorded a loss of 1,661,612 thousand RON. The loss from current activity was only 373,611 thousand RON, while the difference of 1,288,001 thousand RON came from the penalties applied for the non-acquisition until 30 April 2015 of the deficit of greenhouse gas emission allowances for the year 2015 and the non-acquisition until 30 April 2017 of the deficit of greenhouse emission allowances for 2016. The losses in previous years amounted to 798,437 thousand RON. The investments made by the entity in 2016 amounted to 86,067 thousand RON, compared with the 154,807 thousand scheduled (55.60%). In 2017, the entity recorded a loss of 858,832 thousand RON. The loss from current activity was of 325,328 thousand RON and the difference of 533,024 thousand RON came from the penalties applied for the non-acquisition until 30 April 2018 of the deficit of greenhouse gas emission certificates. In 2018, the entity records a profit of 1,235,337 thousand RON due to the timely acquisition of greenhouse emission allowances for 2019 and the coverage of losses in previous years to 235,904 RON. Most of this is due to cost-per-activity reductions by optimizing green business processes.
The information on the economic and financial indicators of the mining entity for the period 2016–2018 is presented in Table 6. Investments for energy activity in 2016 amounted to 85,142 thousand RON (98.93% of total investments), while investments for mining activity amounted to 925 thousand RON (1.07% of the total investments made). In 2017, the investments for energy activity were 3.136 thousand RON (85.59% of the total investments), while the investments for the mining activity amounted to 528 thousand RON (14.41% of the total investments made). Both investments made in the period 2016–2017 were insignificant, which led to an increase in the production cost of the coal. The investments made consisted of: the purchase of modern equipment, the reprocessing of an old tailings pond and a poor ore dump.
In 2018, investments for energy activity amounted to 143,256 thousand lei (92.56% of the total investments), while the investments for the mining activity amounted to 24.153 thousand lei (16.86%). They considered the research infrastructure in technologies with low carbon dioxide emissions, such as the technology of carbon capture and storage (CCS). The carboniferous basin of the analyzed company offers the possibility of storing these CO2 emissions in the unexploited mining perimeters, which offers a storage depth of at least 600 m from the surface. Capture and storage of carbon dioxide in coal layers is a solution for storing these emissions in the Earth’s crust.

6. Conclusions

This study explored the effectiveness of taking into account the changes made by optimizing green business processes and paying greenhouse gas deficit penalties. Here, the financial situation of the mining entity is expected to recover. This demonstrates that the swim-lane charts can be an effective framework for increasing the performance of a mining entity.
Importantly, in contrast with other authors, the present research also showed that the necessary condition for achieving and increasing the performance of a mining entity is provided by the continuous observance and improvement of the management of the activity processes, as well as the cost reductions for depollution [68,69,70]. Our work contributes to this important issue by demonstrating the significance of optimizing green business processes.
Additionally, green business process optimization in the mining industry involves costs that cannot be immediately recovered. Therefore, the way in which resources are managed (i.e., qualified staff, appropriate equipment, infrastructure, and maintenance of equipment), as well as the good management of financial resources, can ensure sustainable environmental performance that will contribute to the development of the economy and society. Consequently, in Romania, strategic efforts should be made to build an efficient energy sector because even the privatization of the mining industry has led to social and urban problems.
In light of the results, this investigation contains elements that have the potential to open new avenues for future research. In the current global warming context, coal is considered to be the main driver of the climate problem. It is mainly used to produce electricity and is considered to be the largest source of carbon pollution in the world. By the end of the last century, coal was dominant in terms of energy production, a situation that completely changed after 2013 when its global decline began. EU countries have proposed to shut down most coal-fired power plants and coal mines by 2020. Different regulations on air quality and carbon emissions and the low cost of renewable technologies have led to falling coal prices and, implicitly, to a decline in coal mining.

Author Contributions

Conceptualization, I.O. and S.C.; Methodology, D.-M.O.C., S.C. and D.I.T.; Validation, D.-M.O.C. and A.G.P.; Formal Analysis, I.O., D.-M.O.C. and F.R.B.; Writing—Original Draft Preparation, S.C. and M.C.T.; Writing—Review and Editing, I.O.

Funding

This research received no external funding.

Conflicts of Interest

The authors declare no conflict of interests.

References

  1. Galarraga, I.; Gonzalez-Eguino, M.; Rübbelke, D.T.G. Environmental Economics, Climate Change Policy and Beyond: A Tribute to Anil Markandya. Environ. Res. Econ. 2016, 63, 219–224. [Google Scholar] [CrossRef]
  2. Bréchet, T.; Meunier, G. Are clean technology and environmental quality conflicting policy goals? Resour. Energy Econ. 2014, 38, 61–83. [Google Scholar] [CrossRef] [Green Version]
  3. Brekke, K.A.; Johansson-Stenman, O. The behavioural economics of climate change. Oxf. Rev. Econ. Policy 2008, 24, 280–297. [Google Scholar] [CrossRef] [Green Version]
  4. Guest, R. Optimal Pollution Abatement under ‘Sustainable’ and Other Social Time Preferences. Environ. Res. Econ. 2014, 58, 373–390. [Google Scholar] [CrossRef]
  5. Stoever, J.; Weche, J.P. Environmental Regulation and Sustainable Competitiveness: Evaluating the Role of Firm-Level Green Investments in the Context of the Porter Hypothesis. Environ. Resour. Econ. 2018, 70, 429. [Google Scholar] [CrossRef]
  6. Combes Motel, P.; Choumert, J.; Minea, A.; Sterner, T. Explorations in the Environment–Development Dilemma. Environ. Resour. Econ. 2014, 57, 479. [Google Scholar] [CrossRef]
  7. Rosemann, M.; de Bruin, T. Towards a Business Process Management Maturity Model. In Proceedings of the Thirteenth European Conference on Information Systems, Regensburg, Germany, 26–28 May 2005. [Google Scholar]
  8. Hasan, S.N.M.S.; Kusin, F.M.; Jusop, S.; Yusuff, F.M. Potential of soil, sludge and sediment for mineral carbonation process in selinsing gold mine, Malaysia. Minerals 2018, 8, 257. [Google Scholar] [CrossRef]
  9. Prior, T.; Giurco, D.; Mudd, G.M.; Mason, L.; Behrisch, J. Resource depletion, peak minerals and the implications for sustainable resource management. Glob. Environ. Chang. 2012, 22, 577–587. [Google Scholar] [CrossRef]
  10. Ana Karla, M. Genetic Process Mining; CIP-Data Library Technische Universität Eindhoven: Eindhoven, The Netherlands, 2006. [Google Scholar]
  11. Van der Aalst, W.M.P. Decision Support Based on Process Mining. In Handbook on Decision Support Systems 1; Burstein, F., Holsapple, C.W., Eds.; Basic Themes; Springer: Berlin/Heidelberg, Germany, 2008; pp. 637–657. [Google Scholar]
  12. Nowak, A.; Leymann, F.; Schumm, D.; Wetzstein, B. An Architecture and Methodology for a Four-Phased Approach to Green Business Process Reengineering. In Information and Communication on Technology for the Fight against Global Warming ICT-GLOW 2011; Kranzlmüller, D., Toja, A.M., Eds.; Lecture Notes in Computer Science; Springer: Berlin/Heidelberg, Germany, 2011; Volume 6868, pp. 150–164. [Google Scholar]
  13. Pinggera, J.; Zugal, S.; Weidlich, M.; Fahland, D.; Weber, B.; Mendling, J.; Reijers, H. Tracing the Process of Process Modeling with Modeling Phase Diagrams. In Proceeding of the Business Process Management Workshops; Springer: Berlin/Heidelberg, Germany, 2012; pp. 370–382. [Google Scholar]
  14. Weske, M. Business Process Management-Concepts, Languages, Architectures, 2nd ed.; Springer: Berlin/Heidelberg, Germany, 2012. [Google Scholar]
  15. Ahlers, D.; Krogstie, J.; Driscoll, P.; Lundli, H.E.; Loveland, S.J.; Rothballer, C.; Wyckmans, A. A workflow Analysis of Greenhouse Gas (GHG) Emission Inventory Methods for Trondheim Municipality; CTT Deliverable; Technical report; NTNU: Trondheim, Norway, 2015. [Google Scholar]
  16. Thaler, T.; Maurer, D.; De Angelis, V.; Fettke, P.; Loos, P. Mining the Usability of Business Process Modeling Tools: Concept and Case Study. In Proceedings of the Industry Track at the 13th International Conference on Business Process Management, Innsbruck, Austria, 31 August–3 September 2015. [Google Scholar]
  17. Larsch, S.; Betz, S.; Duboc, L.; Magdaleno, A.M.; Bomfim, C. Integrating Sustainability Aspects in Business Process Management. In Business Process Management Workshops (BPM 2016); Dumas, M., Fantinato, M., Eds.; Lecture Notes in Business Information Processing; Springer: Cham, Switzerland, 2016; Volume 281, pp. 403–415. [Google Scholar]
  18. Vom Brocke, J.; Mendling, J. Business Process Management Cases: Digital Innovation and Business Transformation in Practice (Management for Professionals), 1st ed.; Springer: Berlin/Heidelberg, Germany, 2018. [Google Scholar]
  19. Couckuyt, D.; Van Looy, A. Green BPM as a Business-Oriented Discipline: A Systematic Mapping Study and Research Agenda. Sustainability 2019, 11, 4200. [Google Scholar] [CrossRef]
  20. Opitz, N.; Krüp, H.; Kolbe, L.M. Green Business Process Management—A Definition and Research Framework. In Proceedings of the 47th Hawaii International Conference on System Sciences (HICSS), Waikoloa, HI, USA, 6–9 January 2014; pp. 3808–3817. [Google Scholar]
  21. World Commission on Environment and Development. Our Common Future; Oxford University Press: Oxford, UK; New York, NY, USA, 1987. [Google Scholar]
  22. Reiter, M.; Fettke, P.; Loos, P. Towards Green Business Process Management: Concept and Implementation of an Artifact to Reduce the Energy Consumption of Business Processes. In Proceedings of the 2014 47th Hawaii International Conference on System Sciences (HICSS), Waikoloa, HI, USA, 6–9 January 2014; pp. 885–894. [Google Scholar]
  23. Hammer, M. What is Business Process Management? In Handbook on Business Process Management 1: Introduction, Methods and Information Systems; vom Brocke, J., Rosemann, M., Eds.; Springer: Berlin/Heidelberg, Germany, 2010; pp. 88–101. [Google Scholar]
  24. Li, S.; Wang, Y. Dynamic Performance Assessment of Primary Frequency Modulation for a Power Control System Based on MATLAB. Processes 2019, 7, 11. [Google Scholar] [CrossRef]
  25. Remenyi, D.; Money, A.H.; Bannister, F. The Effective Measurement and Management of IT Costs and Benefits, 3rd ed.; Elsevier: Amsterdam, The Netherlands, 2007. [Google Scholar]
  26. Hatayama, H.; Tahara, K.; Daigo, I. Worth of metal gleaning in mining and recycling for mineral conservation. Miner. Eng. 2014, 76, 58–64. [Google Scholar] [CrossRef]
  27. Seidel, S.; Recker, J.; vom Brocke, J. (Eds.) Green Business Process Management; Springer: New York, NY, USA, 2012; pp. 3–13. [Google Scholar]
  28. Nowak, A.; Leymann, F.; Schumm, D. The differences and commonalities between green and conventional business process management. In Proceedings of the 2011 IEEE Ninth International Conference on Dependable, Autonomic and Secure Computing, Sydney, Australia, 12–14 December 2011; pp. 569–576. [Google Scholar]
  29. Lubbecke, P.; Reiter, M.; Fettke, P.; Loos, P. Simulation-based Decision Support for the Reduction of the Energy Consumption of Complex Business Processes. In Proceedings of the 48th Hawaii International Conference on System Sciences, 5–8 January 2015. [Google Scholar]
  30. Zambon, I.; Egidi, G.; Rinaldi, F.; Cividino, S. Applied Research towards Industry 4.0: Opportunities for SMEs. Processes 2019, 7, 344. [Google Scholar] [CrossRef]
  31. Lottermoser, B.G. Mine Wastes: Characterization, Treatment and Environmental Impacts; Springer: Berlin/Heidelberg, Germany, 2010. [Google Scholar]
  32. Hitch, M.; Ballantyne, S.M.; Hindle, S.R. Revaluing mine waste rock for carbon capture and storage. Int. J. Min. Reclam. Environ. 2010, 24, 64–79. [Google Scholar] [CrossRef] [Green Version]
  33. McCutcheon, J.; Turvey, C.C.; Wilson, S.A.; Hamilton, J.L.; Southam, G. Experimental deployment of microbial mineral carbonation at an asbestos mine: Potential applications to carbon storage and tailings stabilization. Minerals 2017, 7, 191. [Google Scholar] [CrossRef]
  34. Nowak, A.; Leymann, F.; Schleicher, D.; Schumm, D.; Wagner, S. Green business process patterns. In Proceedings of the 18th Conference on Pattern Languages of Programs (PLoP ’11), Portland, OR, USA, 21–23 October 2011. [Google Scholar]
  35. Moran, C.J.; Kunz, N.C. Sustainability as it pertains to minerals and energy supply and demand: A new interpretative perspective for assessing progress. J. Clean. Prod. 2014, 84, 16–26. [Google Scholar] [CrossRef]
  36. Lundgren, T.; Zhou, W. Firm performance and the role of environmental management. J. Environ. Manag. 2017, 203, 330–341. [Google Scholar] [CrossRef]
  37. Färe, R.; Grosskopf, S. Modeling undesirable factors in efficiency evaluation: Comment. Eur. J. Oper. Res. 2004, 157, 242–245. [Google Scholar] [CrossRef]
  38. Lan, Y.C. Reengineering a Green Business. Int. Interdiscip. Stud. 2012, 2, 1–11. [Google Scholar]
  39. Fu, J. Two-stage data envelopment analysis with undesirable intermediate measures: An application to air quality improvement in China. Cent. Eur. J Oper. Res. 2018, 26, 861. [Google Scholar] [CrossRef]
  40. Maciel, J.C. The Core Capabilities of Green Business Process Management—A Literature Review. In Proceedings of the 13th International Conference on Wirtschaftsinformatik, St. Gallen, Switzerland, 12–15 February 2017; pp. 1526–1537. [Google Scholar]
  41. Recker, J.; Rosemann, M.; Hjalmarsson, A.; Lind, M. Modeling and analyzing the carbon footprint of business processes. In Green Business Process Management: Towards the Sustainable Enterprise; Vom Brocke, J., Seidel, S., Recker, J.C., Eds.; Springer: Heidelberg/Berlin, Germany; Dordrecht, The Netherlands; London, UK; New York, NY, USA, 2012; pp. 93–109. [Google Scholar]
  42. Perez, F.; Sanchez, L.E. Assessing the evolution of sustainability reporting in the mining sector. Environ. Manag. 2009, 43, 949–961. [Google Scholar] [CrossRef]
  43. Pernici, B.; Aiello, M.; vom Brocke, J.; Donnellan, B.; Gelenbe, E.; Kretsis, M. What IS Can Do for Environmental Sustainability: A Report from CAiSE’11 Panel on Green and Sustainable IS. In Proceedings of the 23rd International Conference on Advanced Information Systems Engineering (CAiSE’11), London, UK, 20–24 June 2011. [Google Scholar]
  44. Meyer, J.; Teuteberg, F. Nachhaltiges Geschäftsprozessmanagement—Status Quo und Forschungsagenda. In Tagungsband der Multikonferenz der Wirtschaftsinformatik (MKWI); Mattfeld, D., Robra-Bissantz, S., Eds.; Institut für Wirtschaftsinformatik: Braunschweig, Germany, 2012; pp. 1515–1530. [Google Scholar]
  45. Yeomans, J.S. Efficient generation of alternative perspectives in public environmental policy formulation: Applying co-evolutionary simulation–optimization to municipal solid waste management. Cent. Eur. J. Oper. Res. 2011, 19, 391. [Google Scholar] [CrossRef]
  46. Rada, E.C.; Zatelli, C.; Cioca, L.I.; Torretta, V. Selective Collection Quality Index for Municipal Solid Waste Management. Sustainability 2018, 10, 257. [Google Scholar] [CrossRef]
  47. Recker, J. Green, Greener, BPM? BPTrends 2011, 7, 1–8. [Google Scholar]
  48. Pavlovčič-Prešeren, P.; Stopar, B.; Sterle, O. Application of different radial basis function networks in the illegal waste dump-surface modelling. Cent. Eur. J. Oper. Res. 2019, 27, 783–795. [Google Scholar] [CrossRef]
  49. Rozman, T.; Draghici, A.; Riel, A. Achieving Sustainable Development by Integrating It into the Business Process Management System. In Systems, Software and Services Process Improvement; European Conference on Software Process Improvement EuroSPI; Springer: New York, NY, USA, 2015; pp. 247–259. [Google Scholar]
  50. Houy, C.; Reiter, M.; Fettke, P.; Loos, P.; Hoesch-Klohe, K.; Ghose, A. Advancing business process technology for humanity: Opportunities and challenges of green BPM for sustainable business activities. In Green Business Process Management; Springer-Verlag: Berlin/Heidelberg, Germany, 2012; pp. 75–92. [Google Scholar]
  51. Wesumperuma, A.; Ginige, A.; Ginige, J.; Hol, A. Green activity based management (ABM) for organisations. In Proceedings of the 24th Australasian Conference on Information Systems (ACIS), Melbourne, Australia, 4–6 December 2013; pp. 1–11. [Google Scholar]
  52. Zhu, X.; Zhu, G.; vanden Broucke, S.; Recker, J. On Merging Business Process Management and Geographic Information Systems: Modeling and Execution of Ecological Concerns. In Geo-Informatics in Resource Management and Sustainable Ecosystem; Springer: New York, NY, USA, 2015; pp. 486–496. [Google Scholar]
  53. Ghose, A.; Hoesch-Klohe, K.; Hinsche, L.; Le, L.S. Green business process management: A research agenda. Australas. J. Inf. Syst. 2010, 16, 103–117. [Google Scholar] [CrossRef]
  54. Mars, P. Learning Algorithms: Theory and Applications in Signal Processing, Control and Communications; CRC Press: Boca Raton, FL, USA, 2018. [Google Scholar]
  55. Opitz, N.; Erek, K.; Langkau, T.; Kolbe, L.; Zarnekow, R. Kick-starting Green Business Process Management—Suitable Modeling Languages and Key Processes for Green Perfomance Mesaurement. In Proceedings of the AMCIS 2012 Proceedings, Seattle, WA, USA, 9–12 August 2012. [Google Scholar]
  56. Watson, R.T.; Howells, J.; Boudreau, M.C. Energy Informatics: Initial Thoughts on Data and Process Management. In Green Business Process Management; Springer: New York, NY, USA, 2012; pp. 147–159. [Google Scholar]
  57. Lazarevic, D.; Buclet, N.; Brandt, N. The application of life cycle thinking in the context of European waste policy. J. Clean. Prod. 2012, 29, 199–207. [Google Scholar] [CrossRef]
  58. Houy, C.; Reiter, M.; Fettke, P.; Loos, P. Towards Green BPM—Sustainability and Resource Efficiency through Business Process Management. In Proceedings of the 8th International Conference on Business Process Management—BPM Workshops, Hoboken, NJ, USA, 13–16 September 2010; pp. 501–510. [Google Scholar]
  59. Rojanschi, V.; Grigore, F.; Ciomoş, V. Guide to Environmental Assessor and Auditor; Economic Publishing House: Bucharest, Romania, 2008. [Google Scholar]
  60. Yuan, Z.; Bi, J.; Yuichi, M. The circular economy: A new development strategy in China. J. Ind. Ecol. 2014, 10, 4–8. [Google Scholar] [CrossRef]
  61. Fodor, D. The influence of the mining industry on the environment. AGIR Bull. 2006, 3, 2–13. [Google Scholar]
  62. Wesumperuma, A.; Ginige, J.A.; Ginige, A.; Hol, A. A framework for multi-dimensional business process optimization for GHG emission mitigation. In Proceedings of the Australasian Conference on Information Systems (ACIS 2011): Identifying the Information Systems Discipline, Sydney, Australia, 30 November–2 December 2011. [Google Scholar]
  63. Martinescu Oprea, D.-M.; Căpuşneanu, S. Concentrations and annual scheme of particular matter in Slatina municipality area. Rom. Stat. Rev. 2010, 9, 31–34. [Google Scholar]
  64. Radulescu, C. Pollutant Emissions. Methods for Reducing Them; Bibliotheca Publishing House: Targoviste, Romania, 2008. [Google Scholar]
  65. Norgate, T.E.; Haque, N. Energy and greenhouse gas impacts of mining and mineral processing operations. J. Clean. Prod. 2010, 18, 266–274. [Google Scholar] [CrossRef]
  66. Popescu, M.; Popescu, M. Applied Ecology; Matrix Rom Publishing House: Bucharest, Romania, 2000. [Google Scholar]
  67. Environmental Protection Agency 2017. Available online: http://apmhd.anpm.ro/web/apm-hunedoara/acasa (accessed on 14 November 2018).
  68. Petrakis, E.; Xepapadeas, A. Location decisions of a polluting firm and the time consistency of environmental policy. Resour. Energy Econ. 2003, 25, 197–214. [Google Scholar] [CrossRef]
  69. Canton, J.; Soubeyran, A.; Stahn, H. Environmental Taxation and Vertical Cournot Oligopolies: How Eco-industries Matter. Environ. Resour. Econ. 2008, 40, 369. [Google Scholar] [CrossRef]
  70. Pactwa, K.; Wozniak, J. Environmental reporting policy of the mining industry leaders in Poland. Resour. Policy 2017, 53, 201–207. [Google Scholar] [CrossRef]
Figure 1. Graphic representation of processed data according to the questionnaire.
Processes 07 00543 g001
Figure 2. Diagram of the business process activities for bidding assignment of mining projects.
Processes 07 00543 g002
Figure 3. Business process diagram: costs of mining works.
Processes 07 00543 g003
Figure 4. Diagram of business processes: execution of mining works.
Processes 07 00543 g004
Figure 5. Diagram of business process activities: the cost of the mining work.
Processes 07 00543 g005
Figure 6. Concentrations of suspended particulate matter for September, within the mining entity.
Processes 07 00543 g006
Figure 7. Concentrations of sedimental dust for September in the mining entity.
Processes 07 00543 g007
Table 1. Centralized situation of the respondents.
QuestionsCategory of Respondents
SpecialistsManagement
YesNoYesNo
 (1) Does green business process management help make your business more efficient?13231397
 (2) What is the modern method for determining pollutant emissions used in your company?
(a) Emission inventory method *89743412
(b) Emission annotations **92712818
(c) Activity-Based Emissions (ABE) ***67962521
 (3) What are the cost and performance benefits for your company?
(a) Reduction of operational environmental costs101623016
(b) Increase in profit98652818
(c) Reliable information83802719
Source: authors processing. Where: * Method of inventory or accounting for the amount of pollutant emissions emitted into the atmosphere. It normally contains all annual emissions for one or more specific greenhouse gases or air pollutants originating from all source categories in a given geographical area (suspended particulate matter and sediment-specific particulate matter). ** GBPM uses the extension of conventional process models with emission annotations. *** A method consecrated to the study of CO emissions in the atmosphere and to the costs of emissions and other pollutants. Activity-Based Emissions (ABE) analysis is used in the Activity-Based Costing (ABC)/Activity-Based Management (ABM) mix.
Table 2. Identification of costs at employees’ level and competence level.
Process TypeActivitiesOperationsLevel of CompetenceEmployeesCosts
(Thousands RON)
Execution of mining worksBudgetingProgramming the production yearManagement325,286
Elaboration of the research papers in establishing the field perspectiveTechnical545,578
Elaboration of technical plan, maps and specific mining situationsTechnical5188,905
Physical measurement of the workTechnical113,777
Approval of data subject to processingTechnical121,987
Calculation of the remaining coal reserveTechnical121,247
Calculation of resources usedTechnical121,875
Monthly drafting of estimates for each work executedTechnical112,569
Elaboration of program for saving the materials used in the extraction processTechnical314,862
Approval of processed dataTechnical112,245
22378,331
Source: data of the mining entity from 2016–2018.
Table 3. Differences after the optimization of business processes.
Business Process: Cost of the Mining Work
Budget ActivityCosts (Thousands RON)Differences (Thousands RON)
Before OptimizationAfter Optimization
2016201620172018201620172018
Programming the production year25,28625,28624,15623,9650−1.13−0.191
Elaboration of the research papers in establishing the field perspective45,57845,57844,77543,9020−0.803−0.873
Elaboration of technical plan, maps and specific mining situations188,905188,905187,883187,2750−1.022−0.608
Physical measurement of the work13,77713,77713,22613,1580−0.551−0.068
Approval of data subject to processing21,987000−21,98700
Calculation of the remaining coal reserve21,247000−21,24700
Calculation of resources used21,87521,87520,17320,1560−1.702−0.017
Monthly drafting of estimates for each work executed12,56912,56911,90611,2980−0.663−0.608
Elaboration of program for saving the materials used in the extraction process14,862000−14,86200
Approval of processed data12,24512,24511,96411,8750−0.281−0.089
Total378,331320,235314,083311,629−58,096−6.152−2.454
Source: data of the mining entity from 2016–2018.
Table 4. Concentrations of suspended particulate matter for September, within the mining entity.
Suspensions (mg/mc)—Short-Term Average (30 min)
Control PointSterile Transport StreamCharging Coal in WagonsFan StationCar Transport
September 20160.160.130.080.08
September 20170.130.110.000.11
September 20180.110.090.000.08
September monthly average0.130.110.020.09
Allowed limit value0.500.500.500.50
Source: Data of the mining entity processed by the authors, 2018.
Table 5. Concentrations of sedimental dust for September in the mining entity.
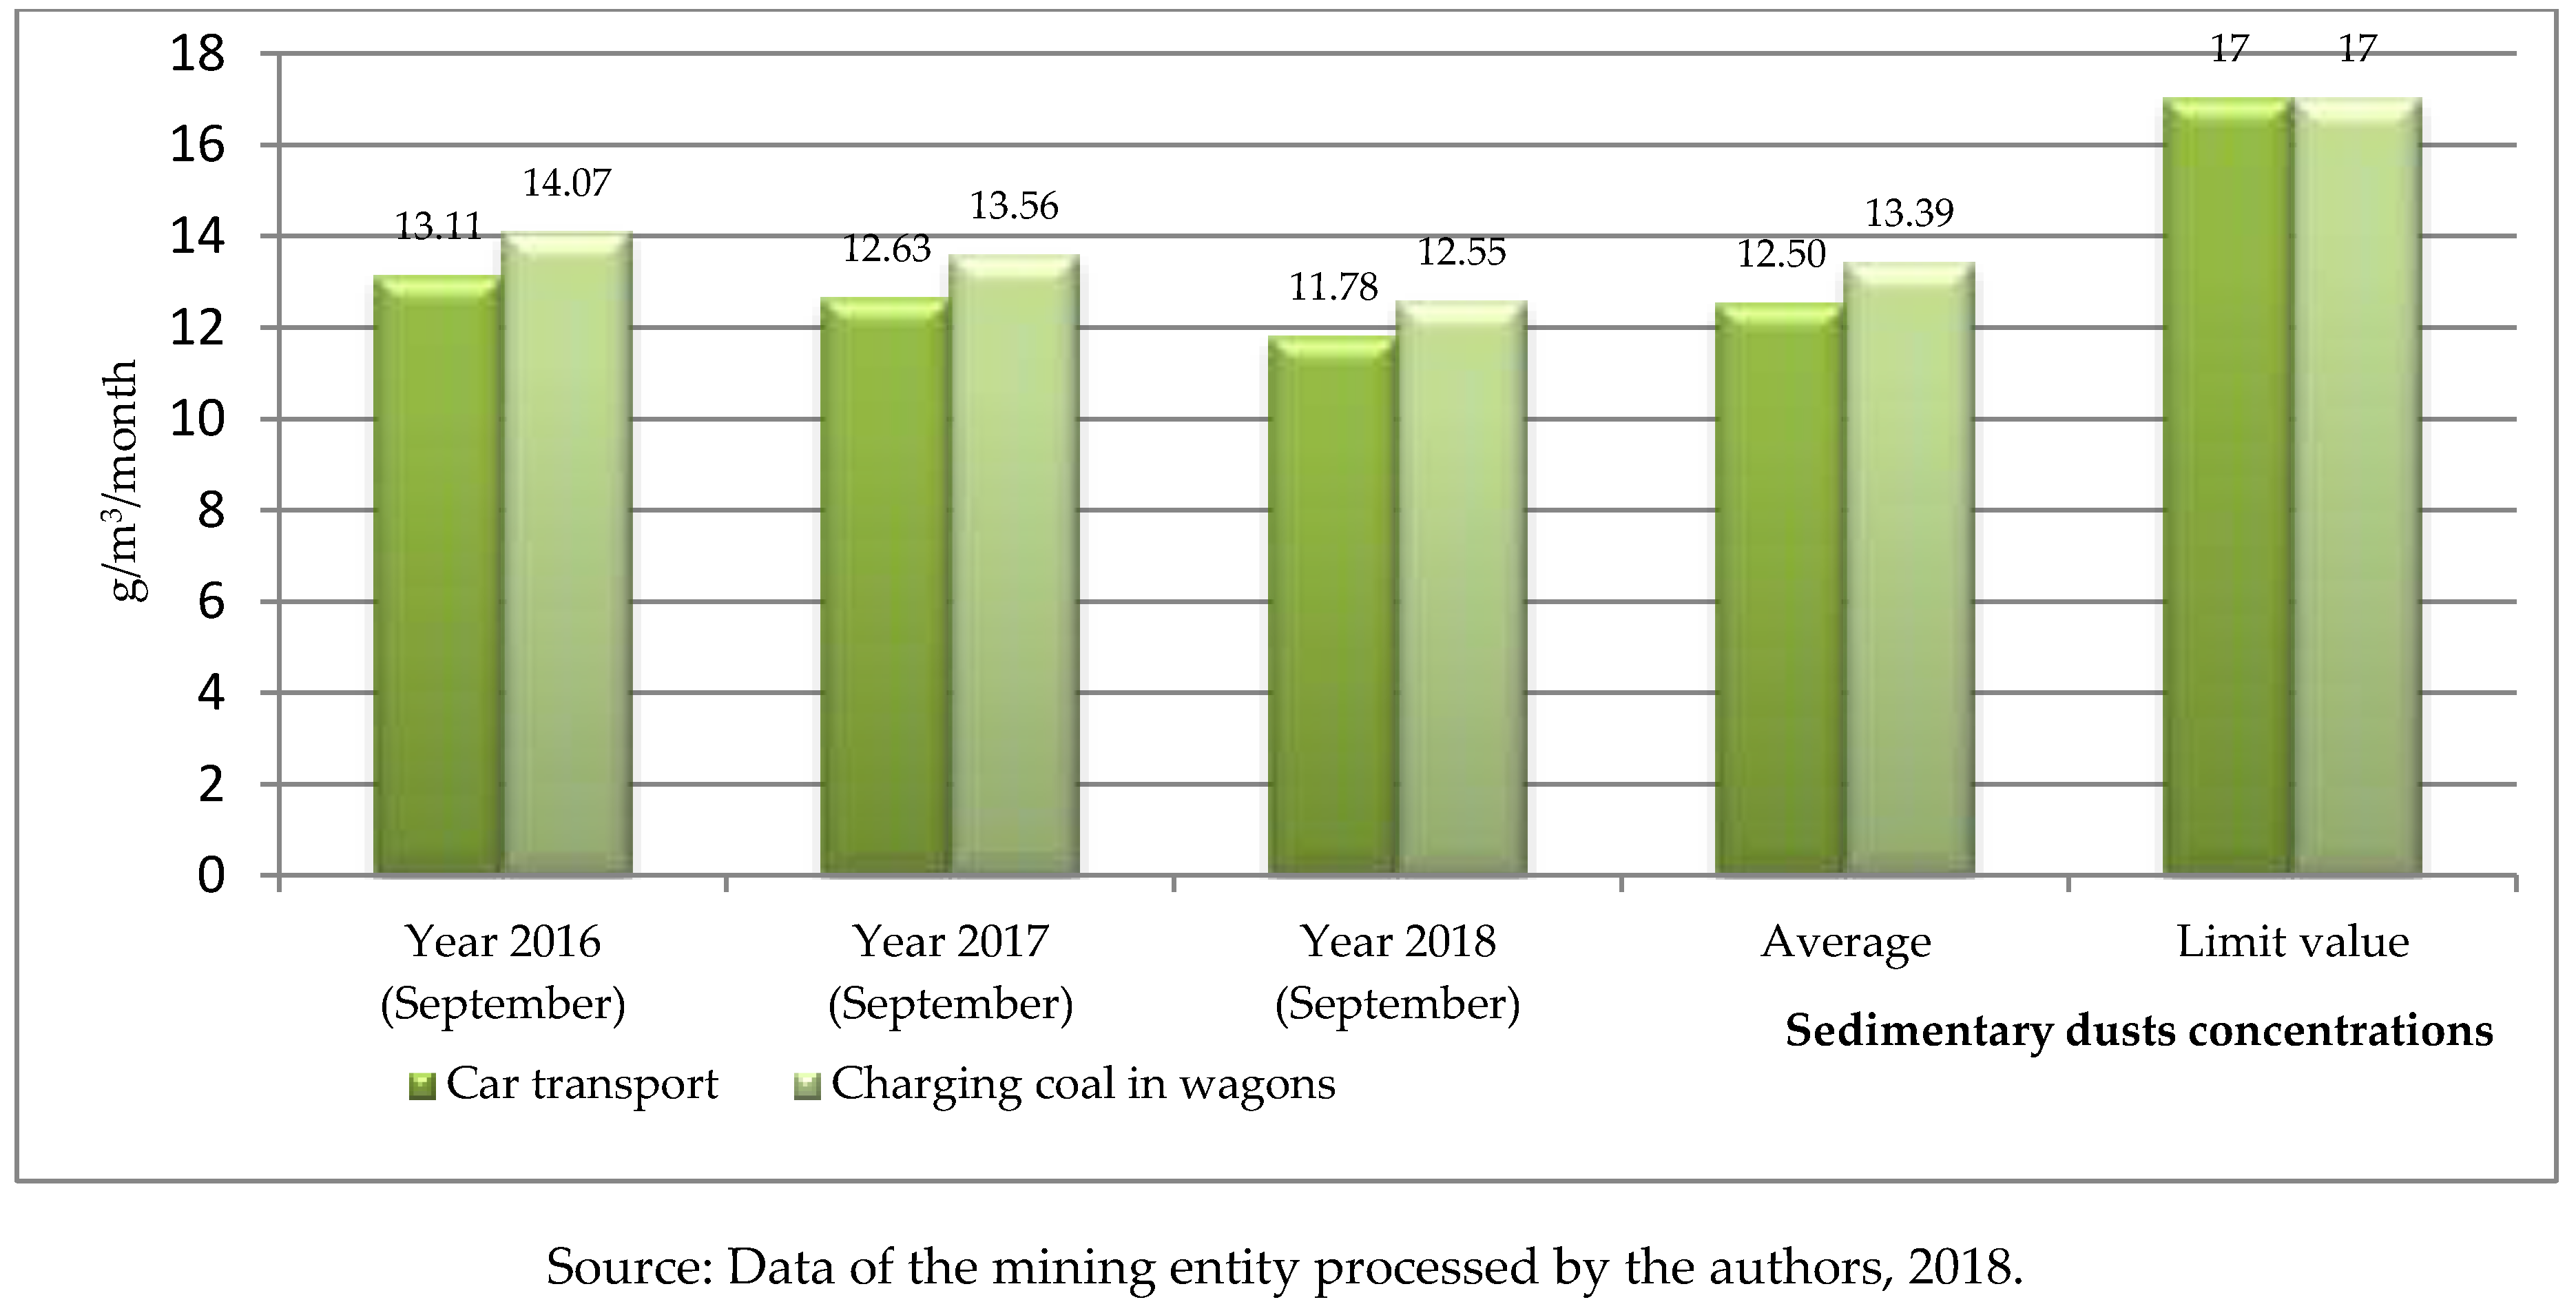
Sedimentary Dusts (g/m2)—Monthly Average Determination
Control PointCar TransportCharging Coal in Wagons
September 201613.1114.07
September 201712.6313.56
September 201811.7812.55
September monthly average12.5013.39
Allowed limit value17.0017.00
Source: Data of the mining entity processed by the authors, 2018.
Table 6. Evolution of economic and financial indicators for the period 2016–2018.
IndicatorM.U.YearDeviations
2016201720182016/20172017/2018
Electricity producedMWh1,842,4371,422,5661,516,271−419,871+93,705
Delivered electricityMWh1,658,4111,281,9641,356,904−376,447+74,940
Sold electricityMWh1,733,9591,409,9251,607,235−324,034+197,310
Purchased and resold energyMWh85,409130,346140,468+44,937+10,122
Thermal energy producedGcal337,783266,978315,475−70,805+48,497
Thermal energy deliveredGcal155,504103,074121,346−52,430+18,272
Coal delivered to power plantsGcal3,272,7012,622,1202,878,206−650,581+256,086
Gross margin on sales
(gross sales profit/ turnover), where:
−0.316−0.2120.297−0.104+0.084
1. Income from the sale of electricityThousands RON491,537,172375,085,877383,996,256−116,451,295+8,910,379
2. Income from the sale of heat, from which:Thousands RON19,478,25316,892,74918,425,690−2,585,504+1,532,941
-Thermal energy subsidy according to O36/2006Thousands RON1,365,9861,336,1931,287,798−29,793−48,395
3. Other IncomeThousands RON14,769,32112,095,95014,167,489−2,673,371+2,071,539
TotalThousands RON525,784,746404,074,576416,589,435−121,710,170+12,514,859
Profit (loss)Thousands RON−1,661,612−858,352+1,235,337−803,260+376,985
Source: data of the mining entity from 2016–2018.

