
Co-Injection of Foam and Particles: An Approach for Bottom Water Control in Fractured-Vuggy Reservoirs
1
School of Petroleum Engineering, China University of Petroleum (East China), Qingdao 266580, China
2
Research Institute of Engineering Technology, Northwest Oilfield Branch Company, SI-NOPEC, Urumqi 830011, China
*
Author to whom correspondence should be addressed.
Processes 2024, 12(3), 447; https://doi.org/10.3390/pr12030447
Submission received: 29 January 2024
/
Revised: 17 February 2024
/
Accepted: 20 February 2024
/
Published: 22 February 2024
(This article belongs to the Topic Multi-Phase Flow and Unconventional Oil/Gas Development)
Abstract
:Fractured-vuggy carbonate reservoirs are tectonically complex; their reservoirs are dominated by holes and fractures, which are extremely nonhomogeneous and are difficultly exploited. Conventional water injection can lead to water flooding, and the recovery effect is poor. This paper takes the injection of foam and solid particles to control bottom water as the research direction. Firstly, the rheological properties of foam were studied under different foam qualities and the presence of particles. The ability of foam to carry particles was tested. By designing a microcosmic model of a fractured-vuggy reservoir, we investigated the remaining oil types and the distribution caused by bottom water. Additionally, we analyzed the mechanisms of remaining oil mobilization and bottom water plugging during foam flooding and foam–particle co-injection. The experimental results showed that foam was a typical power-law fluid. Foam with a quality of 80% had good stability and apparent viscosity. During foam flooding, foam floated at the top of the dissolution cavities, effectively driving attic oil. Additionally, the gas cap is released when the foam collapses, which can provide pressure energy to supplement the energy of the reservoir. Collaborative injection of foam and solid particles into the reservoir possessed several advantages. On one hand, it inherited the benefits of foam flooding. On the other hand, the foam transported particles deep into the reservoir. Under the influence of gravity, particles settled and accumulated in the fractures or cavities, forming bridge plugs at the connection points, effectively controlling bottom water channeling. The co-injection of foam and solid particles holds significant potential for applications.
1. Introduction
Oil is an important strategic resource [1]. In recent years, the development of large fractured-vuggy carbonate reservoirs in Northwest China has attracted significant attention from both industry professionals and scholars [2,3,4]. Fractured-vuggy carbonate reservoirs are primarily characterized by caves, which exhibit poor connectivity and complex oil–water distribution and are highly heterogeneous. Large-scale erosional cavities within these reservoirs are typically discrete and isolated. Some fractures are individual large fractures, while others form localized complex fracture networks [5]. In fractured-vuggy carbonate reservoirs, fluid flow occurs in a complex manner involving a coupled flow of seepage, conduit flow, and free flow. Consequently, traditional development mechanisms, characteristics, and models are no longer directly applicable to seam hole reservoirs, which are used for clastic reservoirs, fracture-pore carbonate reservoirs, and pore-type carbonate reservoirs.
As early as 1984, Hearn introduced the concept of “fracture-cavity units” based on his geological understanding of clastic rock lithological units and clastic rock flow units [6]. In accordance with this concept, it is possible to reasonably delineate the storage space of fractured-vuggy reservoirs. Scholars provided detailed descriptions of three types of reservoirs: vuggy reservoirs, fractured reservoirs, and fractured-vuggy reservoirs [7,8]. Various development methods have been employed for fractured-vuggy reservoirs, including early natural water drive development, single-well waterflood swallowing, and unit water injection development [9,10]. Water injection tends to advance along the high-permeability zones, forming cones. As the injected water volume increases, the sweep efficiency of water injection gradually diminishes, and a substantial amount of remaining oil still presents in the vicinity of the top of the field and in low-permeability areas. Gas injection can effectively control the rise of the oil–water interface and enhance the development efficiency of fractured-vuggy systems [11,12]. However, in the application of gas injection, the strong heterogeneity, viscous fingering, and gravitational segregation can lead to the rapid formation of preferential pathways for gas breakthrough in the high-permeability zones at the top of the reservoir, resulting in gas channeling. This will decrease the efficiency of gas utilization [13,14] and, consequently, result in less-than-ideal oil recovery.
At present, the channeling sealing system of fractured-vuggy reservoirs can be divided into three types according to the type of plugging agent: high-temperature-resistant polymer gel systems, solid particle systems, and high-temperature foam profile control systems. Foam systems consist of gas as the dispersed phase, exhibiting high apparent viscosity and adjustable density. Foam can selectively plug high-permeability zones and control the redirection of subsequent fluids from high-permeability to low-permeability areas to expand the swept volume [15,16,17]. It is highly applicable to fractured-vuggy reservoirs with strong heterogeneity. During foam injection, there is a significant pressure drop at both ends of the core. Foam breakthrough time is relatively long, indicating that the fluid has a higher viscosity, which is advantageous for enhanced oil recovery [18,19,20]. Experiments with different sand bodies show that foam exhibits lower flowability in high-permeability media and extends its influence over a wider range in low-permeability areas, effectively blocking high-permeability channels and contributing to flow redirection [21,22]. Due to the harsh conditions of high temperature and high salinity in fractured-vuggy reservoirs, the effect of foam is greatly reduced. Experts and scholars overcame difficulties by optimizing foam formulas, for example, by using nanoparticles and silica to stabilize the foam, and achieved certain results. However, for larger fractures, the plugging effect of pure foam is limited, so they proposed the use of a solid particle system for plugging.
When solid particles enter the reservoir, they tend to prefer low-resistance pathways. Influenced by density differences, they spontaneously rise or sink, thereby achieving the control of water channeling through accumulation and bridging in low-resistance channels. It is worth noting that cracks of different sizes must be sealed with particles of appropriate size; Abrams et al. proposed the 1/3 bridging theory for sealing porous formations [23]. Chinese scholars further developed the “1/3 bridging theory” and put forward the “shielding temporary plugging theory”, which suggests that the bridge plugging is most stable when the particles match with 1/3~2/3 of the average size of the reservoir pores and fractures [24].
Granular plugging systems have advantages such as low cost, high plugging strength, adjustable particle size, and the ability to maintain stable physical and chemical properties under harsh reservoir conditions. Therefore, the characteristics of plugging channels in high-temperature and high-salinity fractured-vuggy reservoirs have attracted the attention of many experts and scholars [25,26,27]. For commonly used media-carrying particles, polymers are limited by formation conditions, the gelation time of the gel is uncontrollable, and the composition of the gel changes easily when it makes contact with the reservoir. So, the key to the blocking effect of particles deep in the reservoir is to select a suitable carrier medium to transport the particles to the desired location. Studies have shown that under physical or chemical bonding, inorganic particles can combine with organic substances. Not only does this leverage the advantages of solid-phase particles with high-pressure resistance, strength, and strong shear force resistance, but it also effectively improves the ability of particles to pass through the formation under the influence of the reservoir. This achieves the goal of “plugging high permeability areas and driving the low permeability areas” [28,29,30,31]. This provides an approach for the efficient development of fractured-vuggy reservoirs: the simultaneous injection of foam and solid particles.
Therefore, in this paper, an attempt is made to use foam as a carrying and transport medium for particles. During the synergistic co-injection of foam and particles, the particles inhibit the diffusion of gas between bubbles by adsorbing on the surface of the film and forming a particle barrier around the foam, thus inhibiting the diffusion of gas between the bubbles. Rahmani [32] and Singh [33] found that nanoparticle-stabilized foams can effectively control the flow rate in nonhomogeneous carbonatite reservoirs and models. Jie et al. [34] and Eftekhari et al. [35] prepared particulate foams stabilized under high-temperature and high-pressure conditions by processing microfine particles with an average particle size of 100–200 nm using the grinding method with rice husk ash and fly ash. These researches often focus on nanoscale particles, and these particles often only play the role of foam stabilizers and basically do not have a role in plugging. Dong et al. [36] selected quartz sand and ceramic grains with a particle size of 0.6–1.2 mm to fill the gravel layer, and Zong Dai et al. [37] selected particles with different mesh sizes for filling experiments in the fractured reservoir and achieved a good effect of controlling oil and water. The plugging agent containing ceramic particles studied by Aiguo Hu et al. [38] had excellent plugging performance for fractures. However, these works are often applied to fracturing and leakage prevention work, and there are fewer studies on the application in fractured-vuggy reservoirs.
Due to the fact that the permeability channels and oil storage spaces in fractured-vuggy reservoirs are mainly concentrated in the fractures and cavities, it is not possible to observe the displacement fluid’s migration rule and dynamic oil displacement processes in the fractures using real or artificial rock cores; the key to studying the process in fractured-vuggy reservoirs is the establishment of visual models [39,40]. Scholars have designed and created numerous physical models for research purposes, and currently established physical models can be classified into fracture unit models and fractured-vuggy network models. Robin Singh and others suggest that in heterogeneous systems when the foam flows, it does not always appear in a uniform “foam” phase [41]. During foam displacement, the interaction of two different types of flow between low-permeability layers and high-permeability layers is the key factor controlling the displacement process. Integrated visual fractured-vuggy physical models with geometric similarity, motion similarity, dynamic similarity, and characteristic parameter similarity can intuitively demonstrate the flow characteristics and distribution of bottom water, oil, foam, and particles during the displacement. Furthermore, changes in injection rate, injection location, foam quality, etc., can be studied to understand their impact on displacement efficiency [26,40,42,43]. At present, although numerous studies have been conducted on the mechanism of foam recovery enhancement, research on the co-injection of foam and solid particles is mainly focused on fracturing, and there are few studies applied to fractured-vuggy reservoirs.
There has been a significant amount of work on the study and propagation of foam in fractures, and particles are widely used for foam stabilization and fracture support. Fewer studies have dealt with the effect of particles above the micron scale on foam rheology and the role of particles in controlling bottom water in fractured-vuggy reservoirs. This paper conducts foam rheology experiments to study the variation of foam rheological parameters with foam quality, clarifies the foam rheological model, and compares the differences in foam consistency index and flow behavior index with or without solid particles. The settling performance of the solid particles was tested to evaluate the ability of foam to transport solid particles. Foam flow experiments in typical fractured-vuggy models were designed to investigate the impact of bottom water drive and foam drive on oil–water distribution, as well as the plugging effect of particle settling on bottom water channeling when the foam and solid particles are co-injected. This is of significant importance for preventing bottom water intrusion in fractured-vuggy reservoirs.
2. Experimental Work
2.1. Materials
Deionized water was prepared by an ultrapure water preparation instrument (resistivity up to 18.25 MΩ·cm). The temperature-resistant and salt-tolerant anionic–nonionic surfactant YF-1 was supplied by Shengli Oilfield. N2 was produced by the Qingdao Tianyuan Company (Qingdao, China) (gas purity: 99.9%). Polyacrylamide (MW = 5 million, as a foam base solution, added at 2%) was provided by Macleans Biochemical Technology Co., Shanghai, China. Sudan III dye and Brilliant Blue dye were used to observe the oil–water, foam–water, and foam–oil interfaces; all dyes were provided by Macleans Shanghai, China. The sand particles used had a particle size of 0.5–1 mm, a particle density of 2431 kg·m−3, and were basically unbroken at 60 MPa. Kerosene and liquid paraffin (both supplied by Macleans Biochemical Technology Co., Ltd.) were compounded to simulate the oil in the ratio of 1:10 and dyed with Sudan III dye, and the viscosity–temperature curves of the simulated oils are shown in Figure 1.
2.2. Experimental Setup
An ISCO dual piston pump (, Teledyne Co., Ltd., Thousand Oaks, CA, USA; model 100DX) with a plunger volume of 106.00 mL, a maximum output flow rate of 50 mL·min−1, and a flow accuracy of 0.0001 mL·min−1 was used. A gas flow meter (Bronkhorst, Ruurlo, The Netherlands.) with a standard condition N2 maximum flow rate of 20 mL·min−1, a maximum working pressure of 6.5 MPa, a maximum working differential pressure of 2 MPa, and an accuracy of ±1%FS was used. An Anton Paar rheometer (model MCR 302) and a high-speed mixer (Qingdao Haitongda Co., Ltd., Qingdao, China; model GJ-3S, adjustable speed range 0–15000 r·min−1) were also used. A VHX-6000 ultra-deep field 3D optical microscope (Keyence Ltd., Osaka, Japan), with a maximum resolution of 100 nm, was used for observing the micromorphology of the foam. A high-precision pressure transmitter (Keller Ltd., Winterthur, Switzerland; model SERIES 33X) with a maximum bearing pressure of 60 MPa, a maximum differential pressure of 3 MPa, and an accuracy of 0.01% FS was used. Other equipment included metal capillary lines (tube length 4.8 m, inner diameter 1 mm), check valves, pressure-reducing valves, and cameras.
The main structure of the microscopic etched fractured-vuggy model consists of two acrylic boards placed on top of each other in perfect alignment. The microfracture structure model shown in Figure 2 can be obtained through 3D printing. The dimensions of the fractured-vuggy model are 30 cm in length and width, with a volume of 120 mL. The opening and depth of the fractures are 2 mm. There are two 6 mm diameter holes drilled at the top and bottom, serving as the inlet and outlet points for fluids. A sand addition device controlled by a variable-speed rotor and a solid–liquid are used as mixing devices; once the foam is generated within the pipeline, they will be used to thoroughly mix the foam and solid particles in a specified proportion.
2.3. Foam Performance
2.3.1. Rheological Property Testing of Foams
The rheological properties of the foam were measured using the capillary method based on the Hagen–Poiseuille equation [44]. To maintain laminar flow within the tube, a low injection flow rate was adopted. In fact, the Reynolds number (Re) for all experiments was less than 300. The pressure difference between the two ends of the capillary was measured, and the Hagen–Poiseuille equation was applied to calculate the relevant parameter. The fundamental approach involved measuring the flow rate and pressure drop of the foam fluid by applying a consistent shear flow of the foam fluid in the test section of the tube. Shear stress was determined using Equation (1) (τw), and shear rate (γ) was calculated using Equation (2) (γ). Subsequently, the relationship curve between shear stress and shear rate was established. The slope of the fitted curve represents the consistency index (K), and the intercept is the flow behavior index (n). This analysis aimed to explore the rheological properties of the foam.
where Δp represents the pressure difference between the two ends of the capillary, (Pa). D is the diameter of the capillary in meters (m), L is the length of the capillary in meters (m), and um is the average velocity of the fluid inside the capillary (m·s−1).
The experimental procedure for studying the rheological modes of foam in fractures and exploring the influence of foam quality and temperature on foam rheological parameters is depicted in Figure 3. Initially, the airtightness of the entire setup was checked, and the temperature of the thermostat water tank was controlled and then preheated for 1 h. The gas and liquid injection rates were set according to the desired foam quality. The ISCO pump was activated to simultaneously pass nitrogen (N2) and the surfactant solution through the foam generator. Once the foam was stabilized at the outlet, the computer’s pressure difference recording module was initiated. The experimental system was started. The computer data acquisition system automatically recorded and saved the pressure difference at both ends of the experimental pipeline at regular intervals. After the experiment, the circulation system and temperature control system were turned off. The pressure was released by venting the experimental gas. Finally, the experimental equipment was cleaned and organized.
2.3.2. Experiments on Static Settling of Particles
The foaming agent solution was agitated using a magnetic stirrer, and N2 gas was introduced into the foaming agent solution by regulating the flow rate through a pressure-reducing valve, resulting in the generation of foams with varying foam qualities. Subsequently, 100 mL of the foam solution was promptly dispensed into a measuring cylinder. The solid particles were placed above the foam solution’s surface. Simultaneously, a particular solid particle was selected, and the stopwatch was initiated to record the settling time (t) of the ceramic particles, while the height of the liquid column (H) was measured. This measurement process was repeated for more than 5 sets of data, and the average settling time was calculated to obtain the settling velocity (ν). The settling velocity was calculated according to Equation (3):
where ν is the settling velocity of the ceramic particles, measured in centimeters per second (cm·s−1). H represents the height of the fracturing fluid in the measuring cylinder, in centimeters (cm). t is the settling time of the ceramic particles in the fracturing fluid, measured in seconds (s).
Following the completion of each experiment, the apparatus was thoroughly cleaned and dried to prepare for the subsequent set of experiments.
2.4. Experiments on Oil Displacement
The experimental flow of the foam system and particle migration rule in the fractured-vuggy medium is shown in Figure 4. The 2D parallel plate was saturated with dyed simulated crude oil. Firstly, the simulated bottom water invasion was injected at a rate of 10 mL·min−1 from the bottom-right injection end 2, with outlet 3 on the top left serving as the production end. When severe water flooding occurred at production end 3, the injection rate of the bottom water was reduced to 3 mL·min−1. At this point, the foam was injected at a rate of 3 mL·min−1 at port 3 with the gas-to-liquid ratio set at 5:1. Outlet 4 at the top right was used as the outlet. The entire experiment was recorded with a camera to capture the dynamic changes in the oil–water foam. After the experiment was concluded, the experimental model was cleaned.
Based on the completed assembly of the equipment, the research followed the steps shown in Figure 5, which primarily included four processes: (1) foam rheological characteristics, (2) foam–particle system evaluation, (3) oil displacement experiment, and (4) analysis of the driving effect.
3. Results and Discussion
3.1. Impact of Foam Quality on Foam Rheological Characteristics
Based on rheological studies of foam systems under different foam qualities, the relationship between shear stress and shear rate for various foam qualities was determined. Figure 6 displays the double-logarithmic curves between shear rate and shear stress, calculated by varying the flow velocity of foam in the capillary tube. These curves represent foam qualities of 40%, 60%, and 80%. It is evident that within a certain range, as the shear rate increases, the shear stress continually rises. On double-logarithmic coordinates, the shear stress exhibits linear growth with respect to shear rate, indicating that foam can be modeled using the rheological behavior of a power-law fluid.
Investigating the rheological properties of foam systems under different foam quality conditions, we conducted a study by fitting the relationship curve between shear stress and shear rate at various foam qualities. The slope of the resulting straight line represents the consistency index K, and the intercept represents the flow behavior index n, as shown in Figure 7. Within the experimental range, the consistency index K gradually increases as the foam quality increases, while the flow behavior index n decreases with increasing foam quality. The trend of K is consistent with the trend of apparent viscosity, indicating that bigger K values correspond to higher apparent viscosity of the foam system. This is primarily because as foam quality increases, the flow of the foam system shifts from an approximate gas–liquid two-phase flow to a more stable gas–liquid mixture. The gas phase is dispersed more densely and uniformly in the liquid phase, enhancing the structural properties of the foam, increasing the interactions between liquid films, and leading to an increase in apparent viscosity and consistency index. The flow behavior index (n) is less than 1 and decreases with increasing foam quality, indicating that within a certain range, the non-Newtonian behavior of the fluid becomes more pronounced with increasing foam quality.
Different foam qualities exhibit significant variations in foam morphology. Analysis of the microscopic morphology of foam in Figure 7 reveals that at a foam quality of 40%, the bubbles appear as small spheres with significant size disparities, uneven distribution, and liquid-filled interstitial spaces between bubbles. The liquid film is thick, resulting in stable foam. At a foam quality of 60%, the liquid film becomes thinner, and the bubble diameters generally increase. The bubbles take on a more regular shape, have a uniform distribution, and are closely packed. As foam quality further increases to 80%, the bubbles come into close contact, experiencing deformation and significant mutual interactions. The bubbles assume a polyhedral shape, and the plateau border can be clearly observed. The foam quality is related to the stability and attenuation of the foam. With increasing foam quality, bubble diameters continue to grow, the number of bubbles decreases, and coarsening effects become evident. However, bubble size and distribution become more uniform and tend towards a stable distribution. The collapse speed of large-sized foam is generally faster than that of small-sized foam; that is, the increase in foam size will accelerate the decay behavior of the foam [45].
The plateau boundary is the film structure between bubbles, and its formation and properties also affect the stability, rheology, and mass transfer characteristics of foam. Under low foam quality, the plateau boundary presents an irregular shape and complex structure, while under high foam quality, the plateau boundary is more flat and the structure is more orderly. In addition, the change in foam quality will also affect the surface morphology and flow behavior of the plateau boundary, thus affecting the stability and transmission performance of the foam. Additionally, higher foam quality results in drier foam, thinner liquid film, and greater susceptibility to gas breakthrough and escape through the liquid film. This leads to the formation of a gas–liquid two-phase system in the reservoir, facilitating the upward mobilization of the remaining oil in the upper section of the reservoir [40,46].
3.2. Effect of Particles on Foam Properties
3.2.1. Effect of Particles on the Rheological Properties of Foams
When the solid particle content is low (<15%), it exhibits uniform dispersion within the foam system, leading to a gradual settling process with slow settling velocity. However, as the solid particle content surpasses 15%, the density of particles increases. Then, the “particle agglomeration” effect appears. Under the influence of gravity, these particles tend to aggregate and experience significant settling.
The rheological properties of the system were further examined by introducing solid particles at concentrations of 5%, 15%, and 30% into the 60% foam-quality system. As depicted in Figure 8, with an increase in solid particle content, the consistency index enlarges, and the flow index decreases. An increase in solid particle content makes a denser distribution of solid particles within the foam system, intensifying the interactions between foam bubbles. As a result, the overall system viscosity increases, and along with it, the consistency index is also larger. Ultimately, the non-Newtonian properties of polymer fluids are enhanced [47,48,49]. When the particles are not added (the particle content is 0), the system consistency coefficient is about 2.9. After the particles are added, the particles are adsorbed on the liquid film, which improves the apparent viscosity of the foam and is conducive to the stability of the foam.
3.2.2. Static Particle Settling Experiments in Foam System
Based on the results of the aforementioned rheological experiments, it can be observed that foams with a foam quality between 60% and 80% exhibit higher consistency and can serve as a carrier medium for particle transport. Nevertheless, in the context of foam as a carrier medium, the particle distribution and settling velocity in static settling experiments remain critical factors to consider in terms of foam viscosity and carrying capacity.
As shown in Figure 9, the settling velocity of particles decreases as the foam quality increases, with settling velocity ranging between 0.08 and 0.11 cm·s−1, indicating that the foam has good particle-carrying capabilities [50]. After mixing the foam with particles, the stability of the foam significantly improves. As demonstrated in Figure 10, almost no liquid separation is observed in the foam, and particle settling is minimal after 0.5 h of mixing, highlighting the foam’s effective ability to carry particles [51,52].
3.3. Study on the Displacement Effect of Different Fluids in Fractured-Vuggy Reservoirs
3.3.1. Water Driving
Due to the significant energy of bottom water in fractured-vuggy reservoirs, t, the initial stage of the oil–water two-phase flow process, is depicted in Figure 11. In Figure 11a, we can observe that when water enters the cavern, it first disperses in the form of water droplets within the vuggy due to the interfacial tension between oil and water. With the influence of energy supply during the bottom water invasion process and gravity differentiation, the small water droplets in the vuggy start to aggregate and form larger water droplets, ultimately resulting in the formation of a stable oil–water interface within the vuggy. The aggregation process is illustrated in Figure 12a. The red-blue segmented line in Figure 11b represents the stable oil–water interface formed in the fractured-vuggy model after the completion of bottom water displacement. In the process of water injection development, the crude oil recovery rate increases significantly at the beginning, and then the growth rate gradually slows down until the crude oil recovery becomes relatively stable. At this time, the bottom water forms a channeling in the fractures, and the water content at the output end increases sharply, no longer producing crude oil. There is a large amount of remaining oil concentrated in the blind end area that cannot be reached by the bottom water in the model. In addition, after the model is saturated with oil, it tends to not be lipophilic internally, and there is also a large amount of oil film remaining on the crack wall. In real reservoirs, the accumulation of remaining oil is distributed in intergranular pores [53,54].
Figure 13 illustrates the entire process of bottom water breakthrough. Bottom water is injected through connection port 2 and first enters the cave connected to port 2. When the bottom water level in the cave reaches the height of the fracture, the bottom water enters the fracture. Bottom water also has selectivity towards fractures, often depending on the fracture opening, fracture height, and fracture wall roughness. The density difference between oil and water is also the main reason for the difference in the fluidity of oil and water during transportation. In this section, as shown in Figure 13a,b, the liquid level within fracture (i) gradually rises. When the oil–water interface within the left cavity exceeds the entrance of fracture (iv), gravity comes into play, causing the water to transport towards the lower-right cavern.
When the water drive production rate reaches above 98%, the water drive concludes, and the oil–water interface is illustrated in Figure 13c. At this point, the remaining oil in the fractured-vuggy reservoir can be mainly categorized into the following types:
Cave top remaining oil (Zone I in Figure 13c). This is the original oil that remains trapped at the top of the vuggy after water flooding, as illustrated in Figure 13c(I). The volume of cave top remaining oil is proportional to the Jamin effect of the injected water at the pore throat. The stronger the Jamin effect, the greater the flow resistance at the pore throat. Water flows along the relatively low flow resistance pathways, which affects some of the crude oil present at the top of the caves.
Sealed oil (Zone II in Figure 13c). This oil is located in fracture (iv). In the fractures, due to ruptures occurring as the water enters the cavities, a small amount of oil experiences a retrograde flow, and this retrograde oil in the region is referred to as sealed oil. Properly increasing the injection rate of water flooding can reduce the amount of sealed oil.
Attic oil. As shown in Figure 13c(III), attic oil is formed in the upper part of the vuggy reservoir, where the cavities are not impacted, due to the difference in oil–water density. It represents a substantial volume and is the primary form of remaining oil in fractured-vuggy reservoirs.
Bypassed oil. As shown in Figure 13c(IV), this is the remaining oil formed as bottom water flows in the direction of the lowest flow resistance. It is mainly located near the cavity outlet and the inlet of the fracture.
3.3.2. Foam Flooding
When the bottom water drive extends to 7.5 min, the injection volume reaches 0.625 PV (pore volume). The bottom water, injected from end 2, reaches the output end 3. This results in a sudden surge of water production from well location 3, leading to a violent water flooding event. During this period, the water content increases rapidly, causing a significant drop in the recovery efficiency. Concurrently, the energy of the bottom water also decreases.
In response to this development, an adjustment was made to the bottom water energy. The injection velocity for bottom water was set to 3 mL·min−1, and a similar injection velocity of 3 mL·min−1 was employed for the foam. The injection volume of the foam is 30 mL (0.25 PV). The foam, consisting of a gas–liquid two-phase system, has a density that falls between that of water and gas. This can be observed in Figure 12b. So, the foam could displace the remaining oil located above the oil–water interface. The foam is injected at port 3. Since the injection end has a certain pressure, the bottom water flows to outlet 4 through cracks ii and iii.
Foam is more likely to form a blockage in smaller pore throats and flow channels due to the Jarman effect that creates greater resistance to flow. The large opening of the fracture, as can be seen in Figure 14a, shows that the injected water is still flowing along the original channel. The blue arrows in Figure 14b show the direction of the water flow. The foam floats on the top of the cavern because of gravitational differentiation. Some of the attic oil is displaced. At the same time, the injected foam bursting production releases the gas cap to generate a certain pressure energy. It can effectively make the sealing oil flow into the fracture. The surfactant produced during the drainage process can be effective in reducing the interfacial tension so that the oil film breaks into fine oil droplets, which are stripped from the wall and transported with the flow field [17,57].
3.3.3. Co-Injection of Foam and Particles
Figure 14b shows the extraction effect of the water drive process when the foam and particles are co-injected. The injection end 3 injected 30 mL (0.25 PV) of foam and 10% volume fraction of particles at a rate of 3 mL·min−1. Under the influence of gravity and the precipitation of surface activators, the solid particles gradually separate from the foam system and descend slowly. As these particles settle, they will form a stable block at the bottom of the cavern and the entrance of the fracture; they create a plugging that inhibits the channeling of bottom water. The area marked with a red circle in Figure 12 represents the accumulation of particles.
When bottom water is injected from end 2, it initially flows along cracks ii and iii. When the solid particles settle and accumulate, as depicted in Figure 12b. This altered water flow direction partially suppresses the rapid channeling of bottom water. Compared to the injection of foam alone, the combined injection of foam and particles not only mobilizes the oil film, sealed oil, and attic oil in the upper-left portion of the model but also affects the attic oil in the middle and upper-right sections, as well as the remaining oil at the top of the cavern in the lower-right corner. This mobilization is achieved through the dual effects of gas pressure energy and injected water. Additionally, the sinking of particles effectively seals the larger fracture, adjusts the direction of bottom water flow, and inhibits bottom water channels. In addition, we can observe in Figure 14 that some particles sink into the bottom cave through the fractures, and the filling of particles into the cave can make up for the poor sealing effect of pure foam in large-scale caves. The model serves to characterize the mechanism by which foam-carrying particles effectively plug bottom water [58,59].
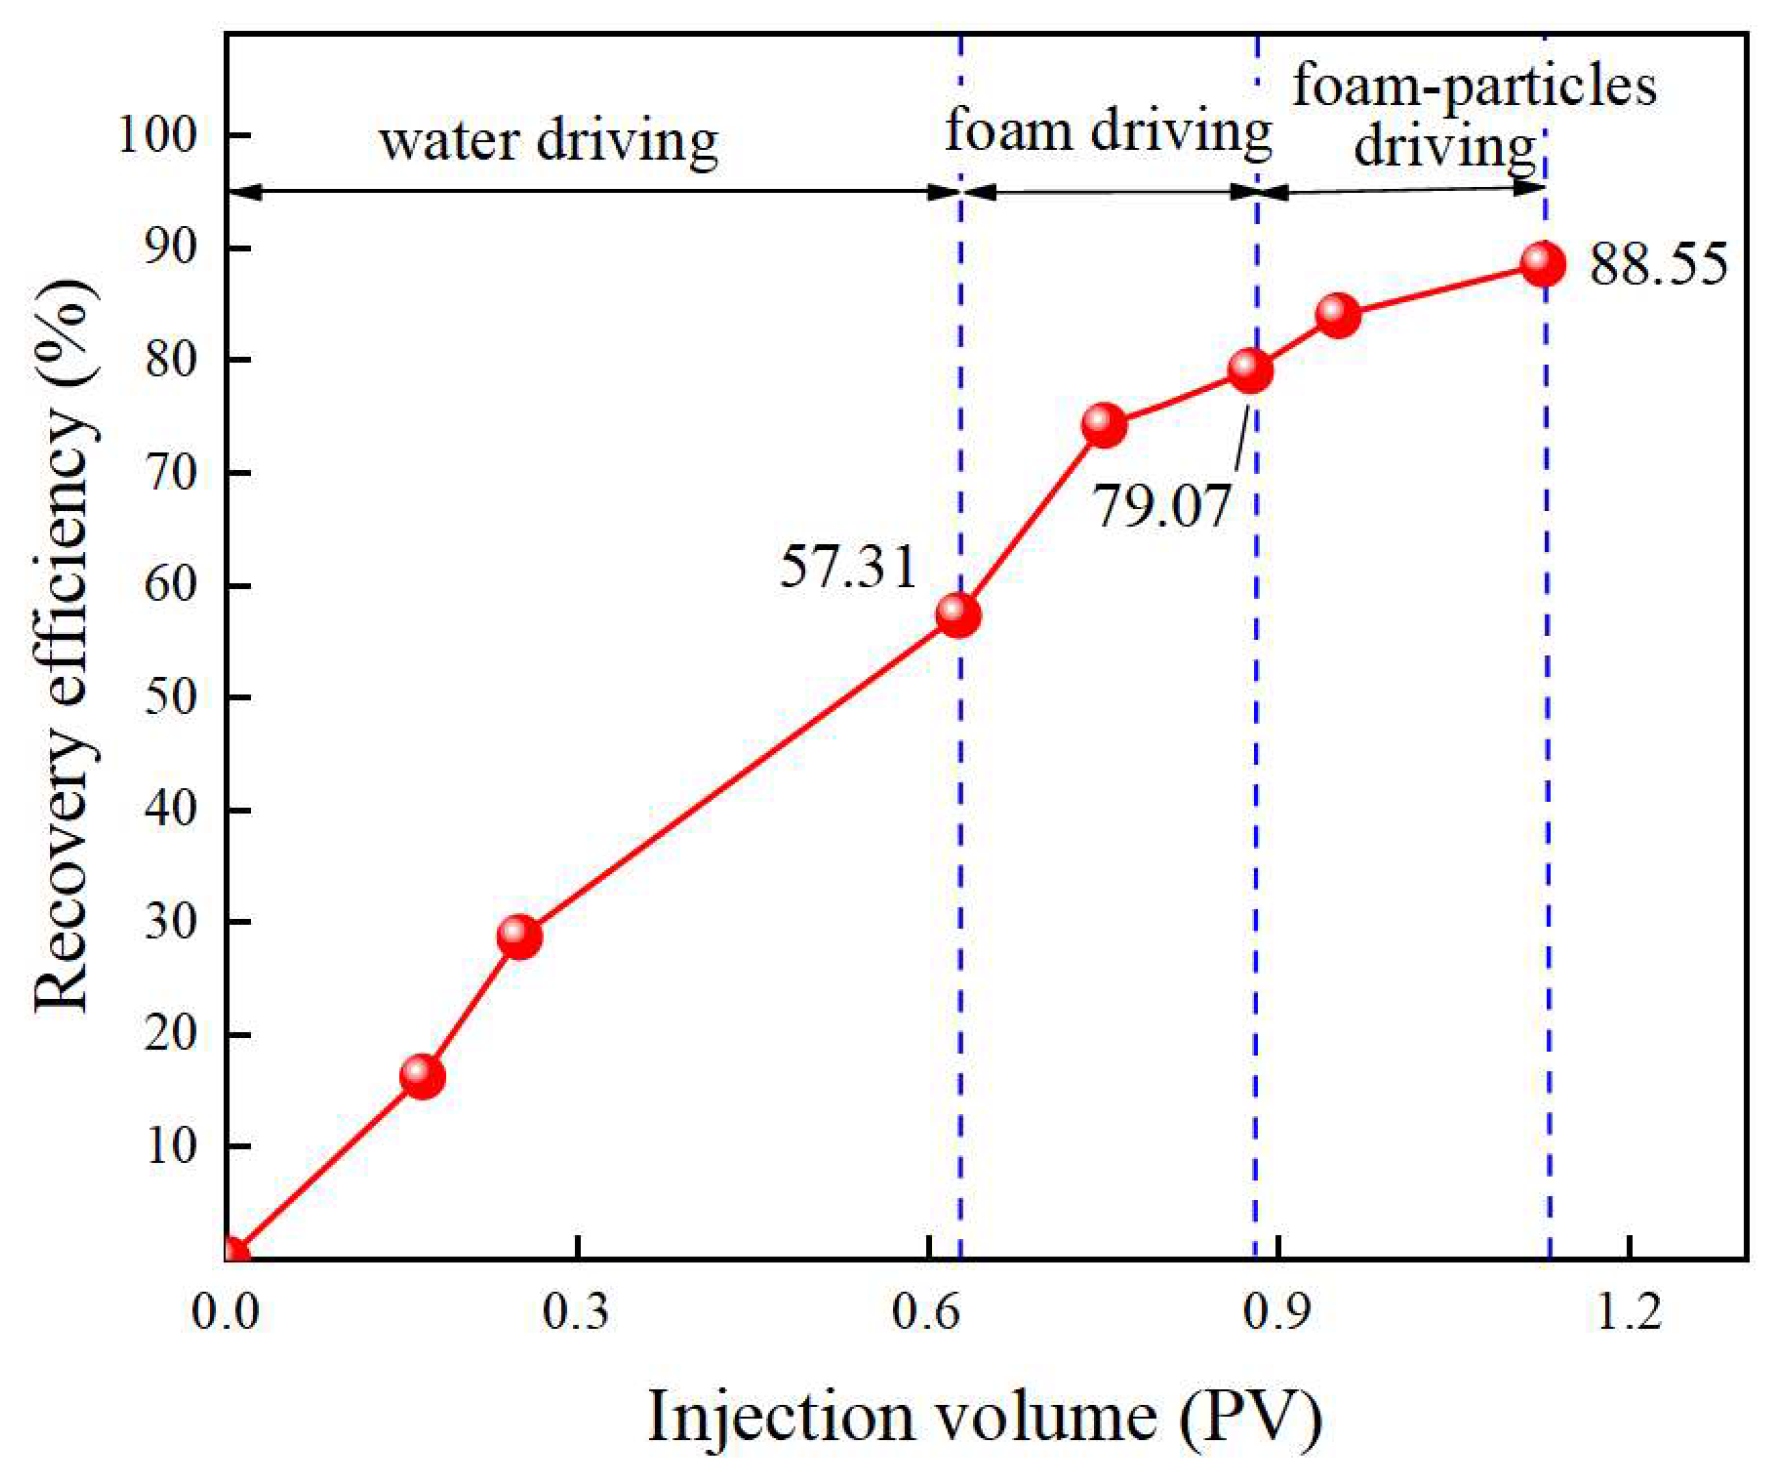
Figure 15 presents the cumulative oil recovery under different displacement methods. During the whole experiment, the cumulative oil recovery by bottom water flooding is 57.31%. After the bottom water displacement, the model was replaced by foam. The foam could effectively drive the remaining oil in the model, and the final recovery factor increased by 21.76%. It is worth noting that in the late period of foam injection, the contact with bottom water weakened the stability of the foam, and the increase in oil recovery gradually decreased. For larger-scale cavities and fractures, the plugging capacity of the foam is relatively weak. However, by co-injecting foam with particles, the recovery can be further enhanced. On one hand, the presence of particles increases the apparent viscosity of the foam, enhancing its stability. On the other hand, during flow, the particles settle and accumulate at the intersections of fractures, effectively inhibiting bottom water flooding and reducing the contact between bottom water and foam, which also contributes to foam stability. The ultimate oil recovery of the reservoir is 88.55%, which is 9.48% higher than that of foam driving.
4. Conclusions
In this paper, the mixed system of foam and particles was used to conduct bottom water control experiments in fractured-vuggy reservoirs. Through the analysis of consistency index K and flow index n, the effect of foam quality on the rheological properties of foam was evaluated. Further, the synergetic effect of particles and foam and the plugging of particles on large-scale fractures and caverns were discussed. The following conclusions are drawn:
(1) Foam is a typical power-law fluid. With the increase in foam quality, the structure of the foam is enhanced and the consistency index K gradually increases, before gradually decreasing. The foam has good stability and consistency in the range of 60% to 80% for the flow index n of the foam quality, as seen through rheological performance testing. The test of the settling performance of the particles was carried out, and the results confirmed that the foam system is suitable for carrying solid particle plugging agents.
(2) There is a big difference in the morphology of the foam with different foam quality. When the foam quality increases to 80%, the bubble diameter increases and the number of bubbles decreases, and the coarsening effect is obvious. At the same time, the foam dryness becomes larger, the liquid film becomes thinner, and the gas can easily break through the liquid film to float upward, driving the remaining oil to the top of the reservoir.
(3) As a plugging agent, particles can play a synergistic role with foam, strengthening bottom water control in fractured-vuggy reservoirs, plugging large opening fractures, and aiding bottom water channeling. The foam and particle co-injection increased the recovery by 9.48% on the basis of foam driving, and the final cumulative recovery was up to 88.55%.
The research results provide a reference for improving oil recovery and controlling bottom water channeling in fractured-vuggy reservoirs. However, it is still necessary to further study the synergistic production increase process using the foam–particle combination under high-temperature and high-pressure conditions.
Author Contributions
Conceptualization, J.W. and Y.F.; methodology, A.C., J.Z. and D.C.; formal analysis, J.W., Y.F., A.C., J.Z. and D.C.; investigation, J.W., Y.F. and A.C.; resources, J.W.; data curation, Y.F. and D.C.; writing—original draft preparation, J.W.; writing—review and editing, Y.F.; supervision, J.W. and Y.F.; project administration, J.W. and Y.F.; funding acquisition, J.W. All authors have read and agreed to the published version of the manuscript.
Funding
This research was funded by the National Key Research and Development Program (NKRDP) grant number (No. 222YFC3004901-2). And the APC was funded by School of Petroleum Engineering, China University of Petroleum (East China).
Data Availability Statement
The data presented in this study are available on request from the corresponding author.
Acknowledgments
We acknowledge the Shandong Engineering Research Center of Carbon Dioxide Utilization and Storage for the assistance with our experimental research.
Conflicts of Interest
Yibo Feng was employed by SINOPEC Northwest Branch Company Technology Research Institute of Petroleum Engineering. The remaining authors declare that the research was conducted in the absence of any commercial or financial relationships that could be construed as a potential conflict of interest.
References
- Kjärstad, J.; Johnsson, F. Resources and future supply of oil. Energy Policy 2009, 37, 441–464. [Google Scholar] [CrossRef]
- Jiao, F. Practice and knowledge of volumetric development of deep fractured-vuggy carbonate reservoirs in Tarim Basin, NW China. Pet. Explor. Dev. 2019, 46, 576–582. [Google Scholar] [CrossRef]
- Wang, J.; Zhang, T.; Liu, H.; Dong, X.; Li, X.; Yang, M.; Liu, H.; Hu, G.; Sepehrnoori, K. A Novel Method of Constructing Spatial Well Pattern for Water Flooding in Fractured-Vuggy Carbonate Reservoirs FVCRs. In Proceedings of the SPE Annual Technical Conference and Exhibition, Dubai, United Arab Emirates, 22 September 2021. SPE-206017-MS. [Google Scholar]
- Rong, Y.; Zhao, J.; Lu, X.; Li, X.; Li, X. Remaining oil distribution patterns and potential-tapping countermeasures in carbonate fracture-cavity reservoir. Acta Pet. Sin. 2014, 35, 1138. [Google Scholar]
- Nordqvist, A.W.; Tsang, Y.W.; Tsang, C.F.; Dverstorp, B.; Andersson, J. A variable aperture fracture network model for flow and transport in fractured rocks. Water Resour. Res. 1992, 28, 1703–1713. [Google Scholar] [CrossRef]
- Hearn, C.; Ebanks, W., Jr.; Tye, R.; Ranganathan, V.J. Geological factors influencing reservoir performance of the Hartzog Draw Field, Wyoming. J. Pet. Technol. 1984, 36, 1335–1344. [Google Scholar] [CrossRef]
- Zhang, S.; Jin, Q.; Hu, M.; Han, Q.; Sun, J.; Cheng, F.; Zhang, X. Differential structure of Ordovician karst zone and hydrocarbon enrichment in paleogeomorphic units in Tahe area, Tarim Basin, NW China. Pet. Explor. Dev. 2021, 48, 1113–1125. [Google Scholar] [CrossRef]
- Wang, J.; Pang, Y.; Cao, Y.C. Formation mechanism and significance of Cambrian carbonate fault-controlled karst reservoir in Shihuiyao outcrop area, Tarim Basin. J. China Univ. Pet. Ed. Nat. Sci. 2021, 45, 1–12. [Google Scholar]
- Wang, J.; Liu, H.; Ning, Z.; Zhang, H.; Hong, C. Experiments on water flooding in fractured-vuggy cells in fractured-vuggy reservoirs. Pet. Explor. Dev. 2014, 41, 74–81. [Google Scholar] [CrossRef]
- Hou, J.; Luo, M.; Zhu, D. Foam-EOR method in fractured-vuggy carbonate reservoirs: Mechanism analysis and injection parameter study. J. Pet. Sci. Eng. 2018, 164, 546–558. [Google Scholar] [CrossRef]
- Tariq, Z.; Alnuaim, S.; Abdulraheem, A.; Khan, M.R. New Methodology to quantify productivity of vertical wells in naturally fractured solution gas drive reservoirs with dual porosity and dual permeability. In Proceedings of the SPE/PAPG Pakistan Section Annual Technical Conference, Islamabad, Pakistan, 21–23 November 2016. SPE-185314-MS. [Google Scholar]
- Ebadati, A.; Akbari, E.; Davarpanah, A. An experimental study of alternative hot water alternating gas injection in a fractured model. Energy Explor. Exploit. 2019, 37, 945–959. [Google Scholar] [CrossRef]
- Qu, M.; Hou, J.; Wen, Y.; Liang, T. Nitrogen gas channeling characteristics in fracture-vuggy carbonate reservoirs. J. Pet. Sci. Eng. 2020, 186, 106723. [Google Scholar] [CrossRef]
- Khosravi, M.; Bahramian, A.; Emadi, M.; Rostami, B.; Roayaie, E. Mechanistic investigation of bypassed-oil recovery during CO2 injection in matrix and fracture. Fuel 2014, 117, 43–49. [Google Scholar] [CrossRef]
- Fernø, M.; Eide, Ø.; Steinsbø, M.; Langlo, S.; Christophersen, A.; Skibenes, A.; Ydstebø, T.; Graue, A. Mobility control during CO2 EOR in fractured carbonates using foam: Laboratory evaluation and numerical simulations. J. Pet. Sci. Eng. 2015, 135, 442–451. [Google Scholar] [CrossRef]
- Valencia, J.D.; Ocampo, A.; Mejía, J.M. Development and validation of a new model for in situ foam generation using foamer droplets injection. Transp. Porous Media 2020, 131, 251–268. [Google Scholar] [CrossRef]
- Ferno, M.A.; Gauteplass, J.; Pancharoen, M.; Haugen, A.; Graue, A.; Kovscek, A.R.; Hirasaki, G.J. Experimental study of foam generation, sweep efficiency, and flow in a fracture network. SPE J. 2016, 21, 1140–1150. [Google Scholar] [CrossRef]
- Gandomkar, A.; Kharrat, R.; Motealleh, M.; Khanamiri, H.H.; Nematzadeh, M.; Ghazanfari, M.H. An experimental investigation of foam for gas mobility control in a low-temperature fractured carbonate reservoir. Pet. Sci. Technol. 2012, 30, 976–985. [Google Scholar] [CrossRef]
- AlQuaimi, B.; Rossen, W. Characterizing foam flow in fractures for enhanced oil recovery. In Proceedings of the IOR 2017-19th European Symposium on Improved Oil Recovery, Stavanger, Norway, 24–27 April 2017; European Association of Geoscientists & Engineers: Utrecht, The Netherlands, 2017; pp. 1–16. [Google Scholar]
- Eide, Ø.; Fernø, M.A.; Alcorn, Z.; Graue, A. Visualization of carbon dioxide enhanced oil recovery by diffusion in fractured chalk. SPE J. 2016, 21, 112–120. [Google Scholar] [CrossRef]
- Rossen, W.R. Foams in enhanced oil recovery. In Foams; Routledge: London, UK, 2017; pp. 413–464. [Google Scholar]
- Clampitt, R. Selective Plugging of Formations with Foam. U.S. Patent No. 3,993,133, 23 November 1976. [Google Scholar]
- Abrams, A. Mud design to minimize rock impairment due to particle invasion. J. Pet. Technol. 1977, 29, 586–592. [Google Scholar] [CrossRef]
- Pu, X.; Luo, X.; Luo, P. The pressure bearing capacity of leakage layer of Luohe Formation in Changqing Oilfield is improved by shielding bridge plugging technology. J. Southwest. Pet. Inst. 1995, 2, 78–84. [Google Scholar]
- Rafati, R.; Haddad, A.S.; Hamidi, H. Experimental study on stability and rheological properties of aqueous foam in the presence of reservoir natural solid particles. Colloids Surf. A Physicochem. Eng. Asp. 2016, 509, 19–31. [Google Scholar] [CrossRef]
- Wang, T.; Fan, H.; Yang, W.; Meng, Z. Stabilization mechanism of fly ash three-phase foam and its sealing capacity on fractured reservoirs. Fuel 2020, 264, 116832. [Google Scholar] [CrossRef]
- Gaurina-Međimurec, N.; Brkić, V.; Topolovec, M.; Mijić, P. Fracturing fluids and their application in the republic of croatia. Appl. Sci. 2021, 11, 2807. [Google Scholar] [CrossRef]
- Chieng, Z.H.; Mohyaldinn, M.E.; Hassan, A.M.; Bruining, H. Experimental investigation and performance evaluation of modified viscoelastic surfactant (ves) as a new thickening fracturing fluid. Polymers 2020, 12, 1470. [Google Scholar] [CrossRef] [PubMed]
- Tong, S.; Gu, M.; Singh, R.; Mohanty, K.K. Proppant transport in foam fracturing fluid during hydraulic fracturing. J. Pet. Sci. Eng. 2019, 182, 106279. [Google Scholar] [CrossRef]
- Yekeen, N.; Padmanabhan, E.; Idris, A.K. A review of recent advances in foam-based fracturing fluid application in unconventional reservoirs. J. Ind. Eng. Chem. 2018, 66, 45–71. [Google Scholar] [CrossRef]
- Elturki, M.; McElroy, P.D.; Li, D.; Kablan, A.; Shaglouf, H. Simulation Study Investigating the Impact of Carbon Dioxide Foam Fracturing Fluids on Proppant Transport. In Proceedings of the SPE Trinidad and Tobago Section Energy Resources Conference, Virtual, 28–30 June 2021. D011S3R03. [Google Scholar]
- Rahmani, O. Mobility control in carbon dioxide-enhanced oil recovery process using nanoparticle-stabilized foam for carbonate reservoirs. Colloids Surf. A Physicochem. Eng. Asp. 2018, 550, 245–255. [Google Scholar] [CrossRef]
- Singh, R.; Mohanty, K.K. Foam flow in a layered, heterogeneous porous medium: A visualization study. Fuel 2017, 197, 58–69. [Google Scholar] [CrossRef]
- Jie, C.K.; Jaafar, M.Z.; Sulaiman, W.R.W. Foam stability performance enhanced with rice husk ash nanoparticles. J. Teknol. 2019, 81, 87–96. [Google Scholar]
- Eftekhari, A.A.; Krastev, R.; Farajzadeh, R. Foam stabilized by fly ash nanoparticles for enhancing oil recovery. Ind. Eng. Chem. Res. 2015, 54, 12482–12491. [Google Scholar] [CrossRef]
- Dong, C.; Zhou, Y.; Chen, Q.; Zhu, C.; Li, Y.; Li, X.; Liu, Y. Effects of fluid flow rate and viscosity on gravel-pack plugging and the optimization of sand-control wells production. Pet. Explor. Dev. 2019, 46, 1251–1259. [Google Scholar] [CrossRef]
- Dai, Z.; Liu, Y.; Zou, X. Experimental evaluation of water drive effect of ceramic filling in fractured reef limestone reservoirs. Petrochem. Appl. 2023, 42, 23–28+48. [Google Scholar]
- Hu, A.; Li, K.; Feng, Y.; Fu, H.; Zhong, Y. Laboratory Evaluation and Field Application of a Gas-Soluble Plugging Agent: Development of Bottom Water Plugging Fracturing Technology. Energies 2022, 15, 6761. [Google Scholar] [CrossRef]
- Wang, M.; Yang, S.; Li, M.; Wang, S.; Yu, P.; Zhang, Y.; Chen, H. Influence of heterogeneity on nitrogen foam flooding in low-permeability light oil reservoirs. Energy Fuels 2021, 35, 4296–4312. [Google Scholar] [CrossRef]
- Xu, Z.; Li, B.; Zhao, H.; He, L.; Liu, Z.; Chen, D.; Yang, H.; Li, Z. Investigation of the effect of nanoparticle-stabilized foam on eor: Nitrogen foam and methane foam. ACS Omega 2020, 5, 19092–19103. [Google Scholar] [CrossRef] [PubMed]
- Liu, P.; Zhang, X.; Wu, Y.; Li, X. Enhanced oil recovery by air-foam flooding system in tight oil reservoirs: Study on the profile-controlling mechanisms. J. Pet. Sci. Eng. 2017, 150, 208–216. [Google Scholar] [CrossRef]
- Wang, Z.; Cao, Z.; Li, S.; Li, S. Investigation of the plugging capacity and enhanced oil recovery of flexible particle three-phase foam. J. Mol. Liq. 2023, 386, 122459. [Google Scholar] [CrossRef]
- Xu, Z.; Li, Z.; Liu, Z.; Li, B.; Zhang, Q.; Zheng, L.; Song, Y.; Husein, M.M. Characteristics of CO2 foam plugging and migration: Implications for geological carbon storage and utilization in fractured reservoirs. Sep. Purif. Technol. 2022, 294, 121190. [Google Scholar] [CrossRef]
- Zhang, Y.; Zhang, L.; Wang, Y.; Wang, M.; Wang, Y.; Ren, S. Dissolution of surfactants in supercritical CO2 with co-solvents. Chem. Eng. Res. Des. 2015, 94, 624–631. [Google Scholar] [CrossRef]
- Wang, Z.H.; Liu, X.Y.; Zhang, H.Q.; Wang, Y.; Xu, Y.F.; Peng, B.L.; Liu, Y. Modeling of kinetic characteristics of alkaline-surfactant-polymer-strengthened foams decay under ultrasonic standing wave. Pet. Sci. 2022, 19, 1825–1839. [Google Scholar] [CrossRef]
- Li, B.-F.; Zhang, M.-Y.; Li, Z.-M.; Kovscek, A.; Xin, Y.; Li, B.-L. Flow characteristics and regime transition of aqueous foams in porous media over a wide range of quality, velocity, and surfactant concentration. Pet. Sci. 2023, 20, 1044–1052. [Google Scholar] [CrossRef]
- Chen, Y.; Xu, C.; Huang, J.; Wu, D.; Lv, Q. Rheological properties of nanocrystalline cellulose suspensions. Carbohydr. Polym. 2017, 157, 303–310. [Google Scholar] [CrossRef]
- Barati, N.; Zargartalebi, M.; Kharrat, R. Rheological behavior of nanosilica suspensions and the potential to enhance polymer flooding performance. Spec. Top. Rev. Porous Media Int. J. 2013, 4, 327–337. [Google Scholar] [CrossRef]
- Edy, I.K.O.; Saasen, A.; Hodne, H. Rheological properties of fracturing fluids. Nord. Rheol. Soc. 2011, 19. [Google Scholar]
- Luo, X.; Wang, S.; Wang, Z.; Jing, Z.; Lv, M. Experimental research on rheological properties and proppant transport performance of GRF–CO2 fracturing fluid. J. Pet. Sci. Eng. 2014, 120, 154–162. [Google Scholar] [CrossRef]
- Ba Geri, M.; Imqam, A.; Bogdan, A.; Shen, L. Investigate the rheological behavior of high viscosity friction reducer fracture fluid and its impact on proppant static settling velocity. In Proceedings of the SPE Oklahoma City Oil and Gas Symposium/Production and Operations Symposium, Oklahoma City, OK, USA, 9–10 April 2019. D021S04R03. [Google Scholar]
- Ba Geri, M.; Imqam, A.; Shen, L.; Bogdan, A.; Flori, R. Static Proppant Settling Velocity Characteristics in High Viscosity Friction Reducers Fluids for Unconfined and Confined Fractures. In Proceedings of the ARMA US Rock Mechanics/Geomechanics Symposium, New York City, NY, USA, 23–26 June 2019. ARMA-2019-0381. [Google Scholar]
- Zhong, H.; He, Y.; Yang, E.; Bi, Y.; Yang, T. Modeling of microflow during viscoelastic polymer flooding in heterogenous reservoirs of Daqing Oilfield. J. Pet. Sci. Eng. 2022, 210, 110091. [Google Scholar] [CrossRef]
- Hou, J.R.; Zheng, Z.Y.; Song, Z.J.; Luo, M.; Li, H.B.; Zhang, L.; Yuan, D.Y. Three-dimensional physical simulation and optimization of water injection of a multi-well fractured-vuggy unit. Pet. Sci. 2016, 13, 259–271. [Google Scholar] [CrossRef]
- El Din, S.S.; Dernaika, M.; Hannon, L.; Kalam, Z. The Effect of Rock Properties on Remaining and Residual Oil Saturation in Heterogeneous Carbonate Rocks. In Proceedings of the SPE Middle East Oil and Gas Show and Conference, Society of Petroleum Engineers, Manama, Bahrain, 10–13 March 2013. [Google Scholar] [CrossRef]
- Fredriksen, S.B.; Alcorn, Z.P.; Frøland, A.; Viken, A.; Rognmo, A.U.; Seland, J.G.; Ersland, G.; Fernø, M.A.; Graue, A. Surfactant prefloods during carbon dioxide foam injection for integrated enhanced oil recovery in fractured oil-wet carbonates. SPE J. 2019, 24, 1139–1153. [Google Scholar] [CrossRef]
- Chevallier, E.; Chabert, M.; Gautier, S.; Ghafram, H.; Khaburi, S.; Alkindi, A. Design of a combined foam eor process for a naturally fractured reservoir. In Proceedings of the SPE EOR Conference at Oil and Gas West Asia, Muscat, Oman, 26–28 March 2018. D031S18R02. [Google Scholar]
- Wang, K.; Wang, G.; Lu, C.; Pei, C.; Wang, Y. Preparation and investigation of foaming amphiphilic fluorinated nanoparticles for enhanced oil recovery. Materials 2017, 10, 1403. [Google Scholar] [CrossRef] [PubMed]
- Phong, G.M.; Pilus, R.M.; Mustaffa, A.; Thangavel, L.; Mohamed, N.M. Relationship between fly ash nanoparticle-stabilized-foam and oil production in core displacement and simulation studies. Fuel 2020, 266, 117033. [Google Scholar] [CrossRef]
Figure 1.
Simulated crude oil viscosity–temperature curve (Pg = 0 MPa).

Figure 2.
Schematic diagram of flow process during displacement.
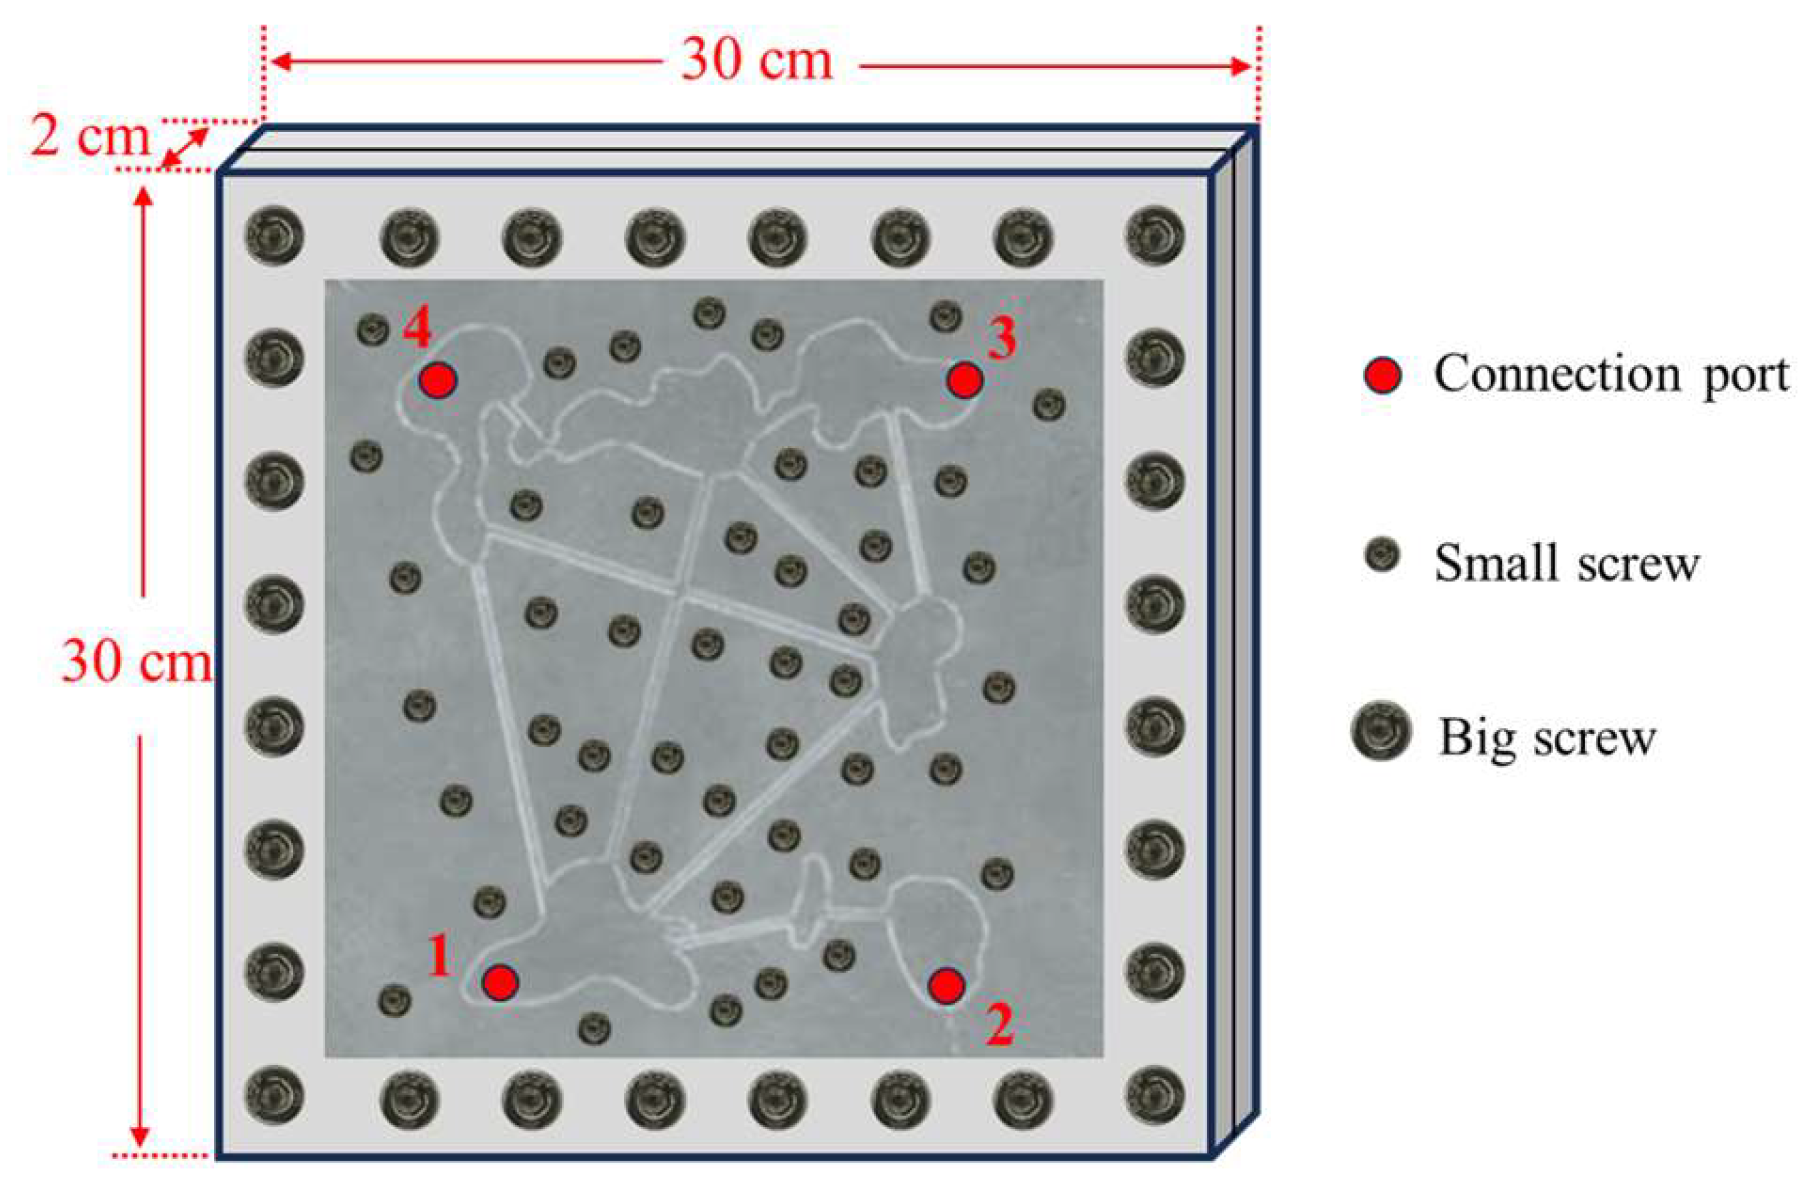
Figure 3.
Capillary rheological model test system.
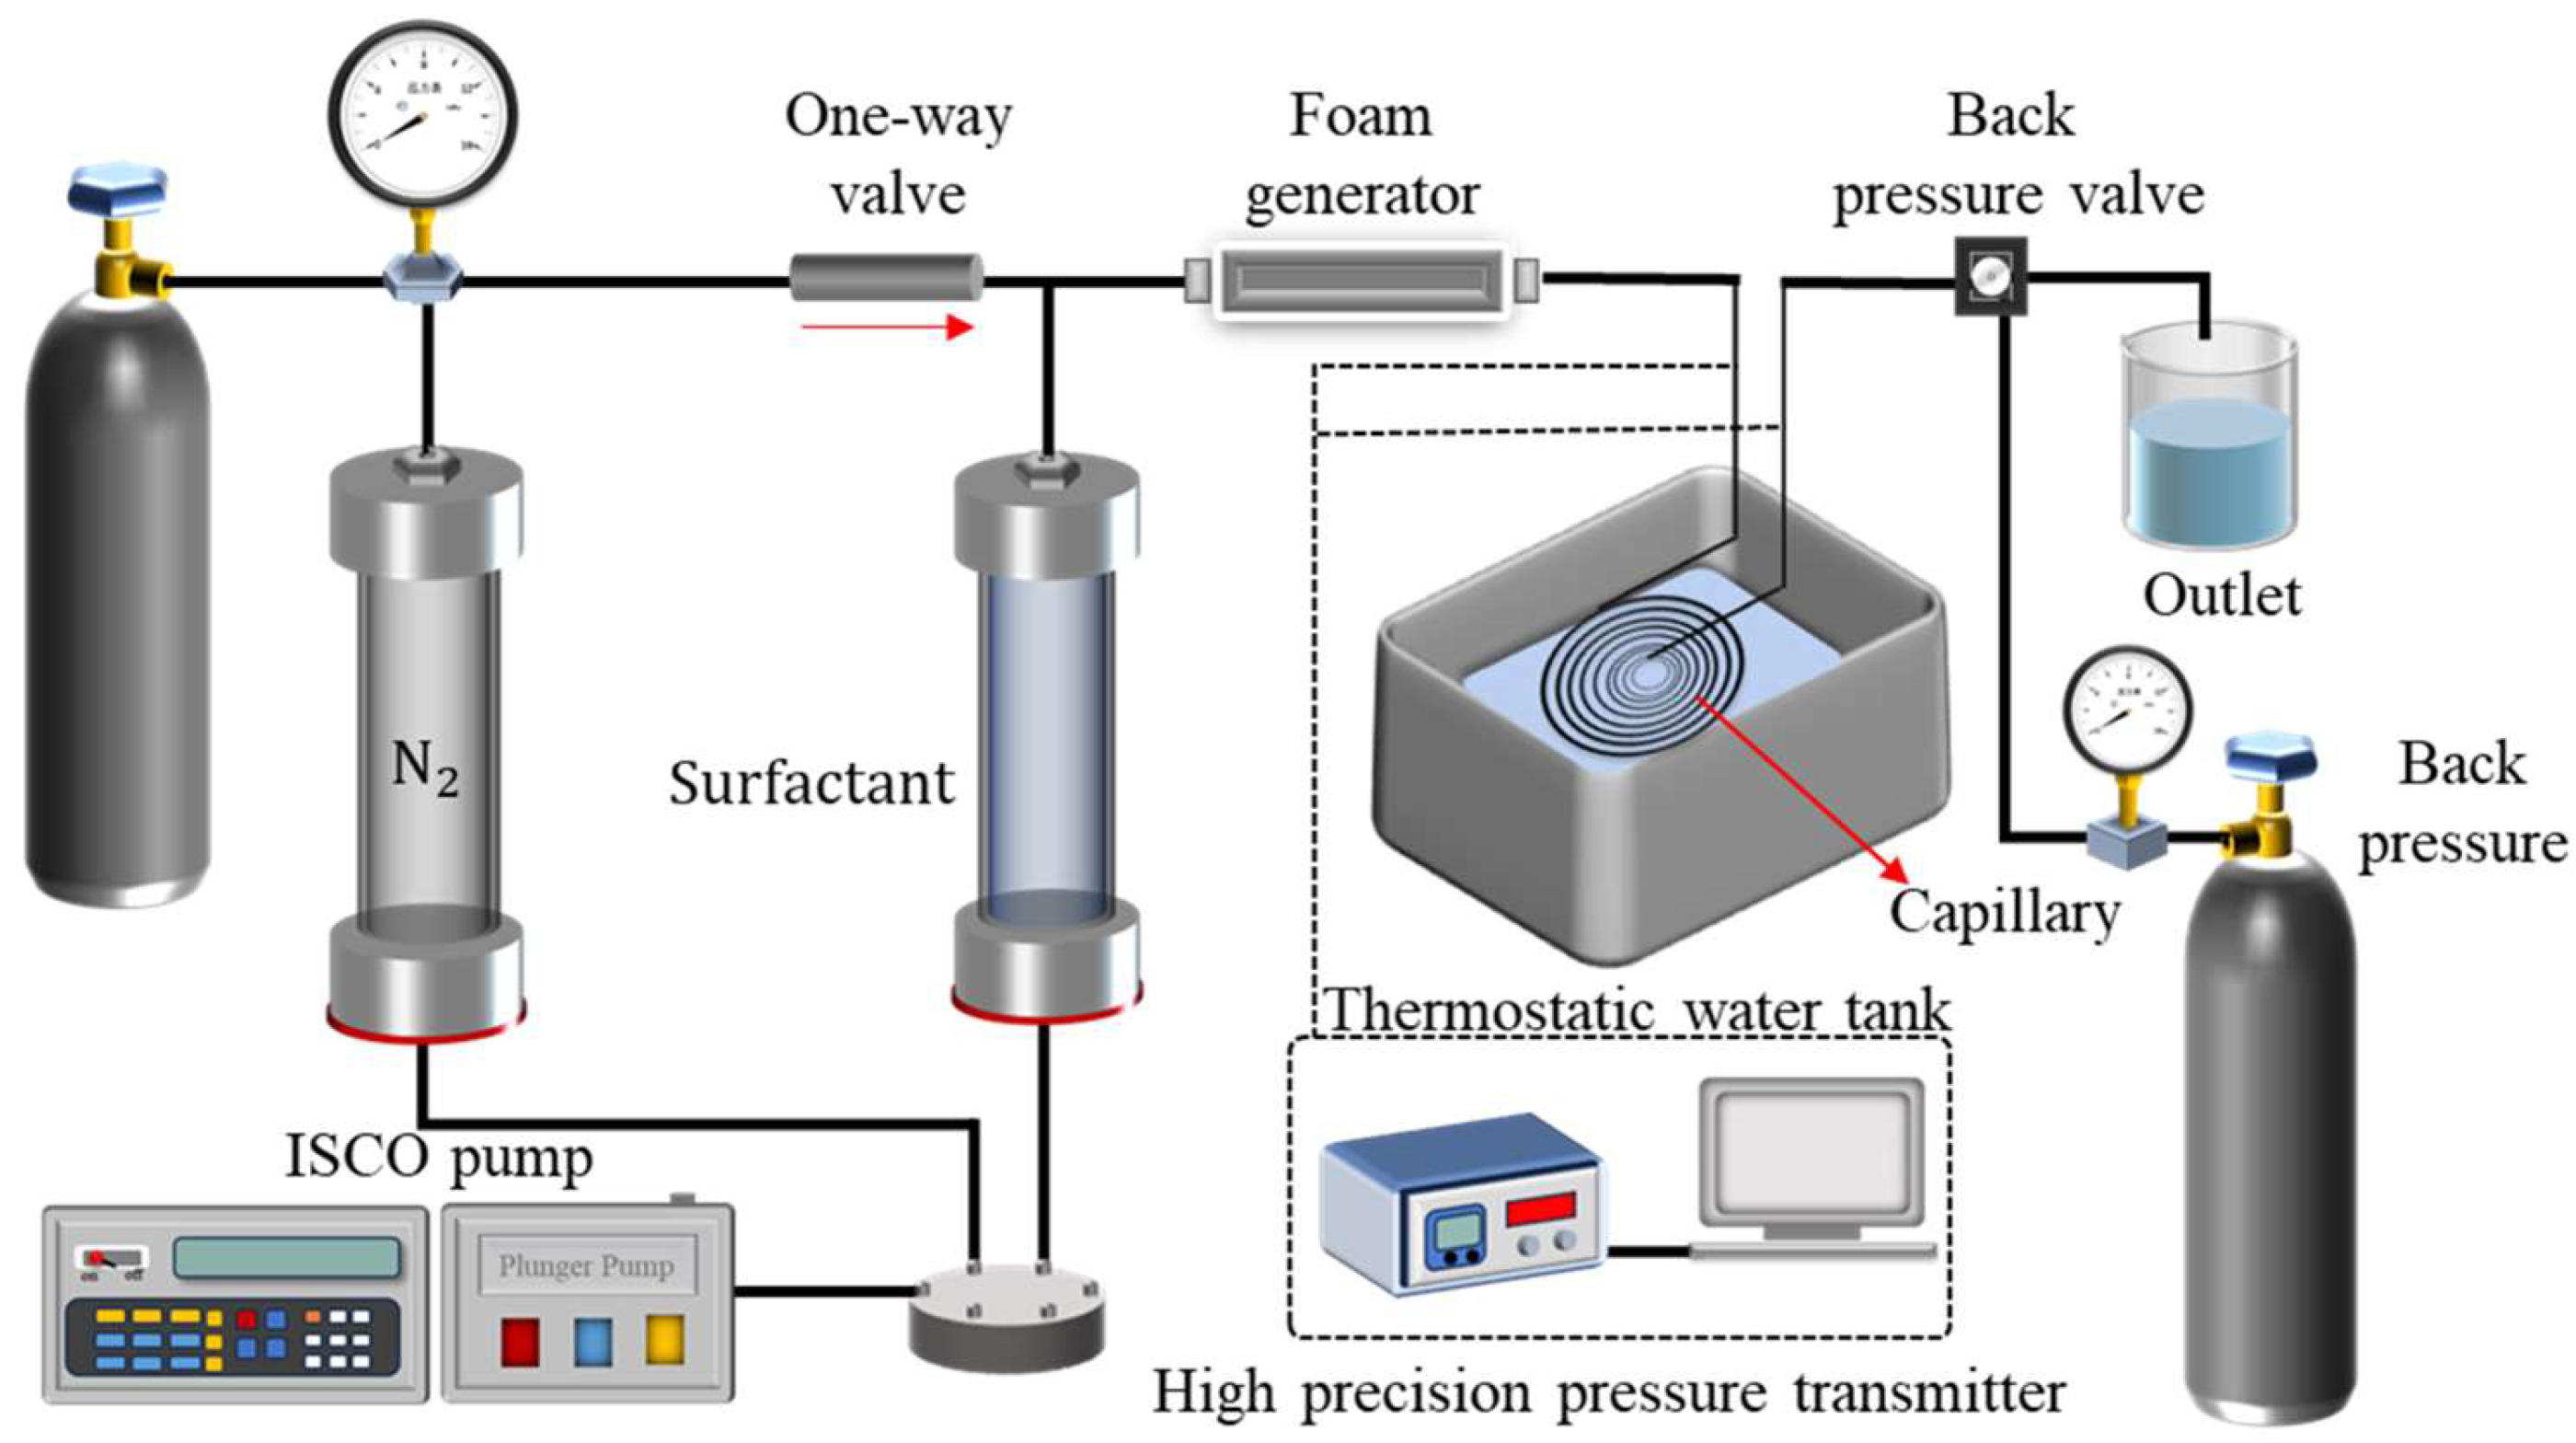
Figure 4.
Flow chart of the oil displacement experiments in the microscopic fractured-vuggy model.
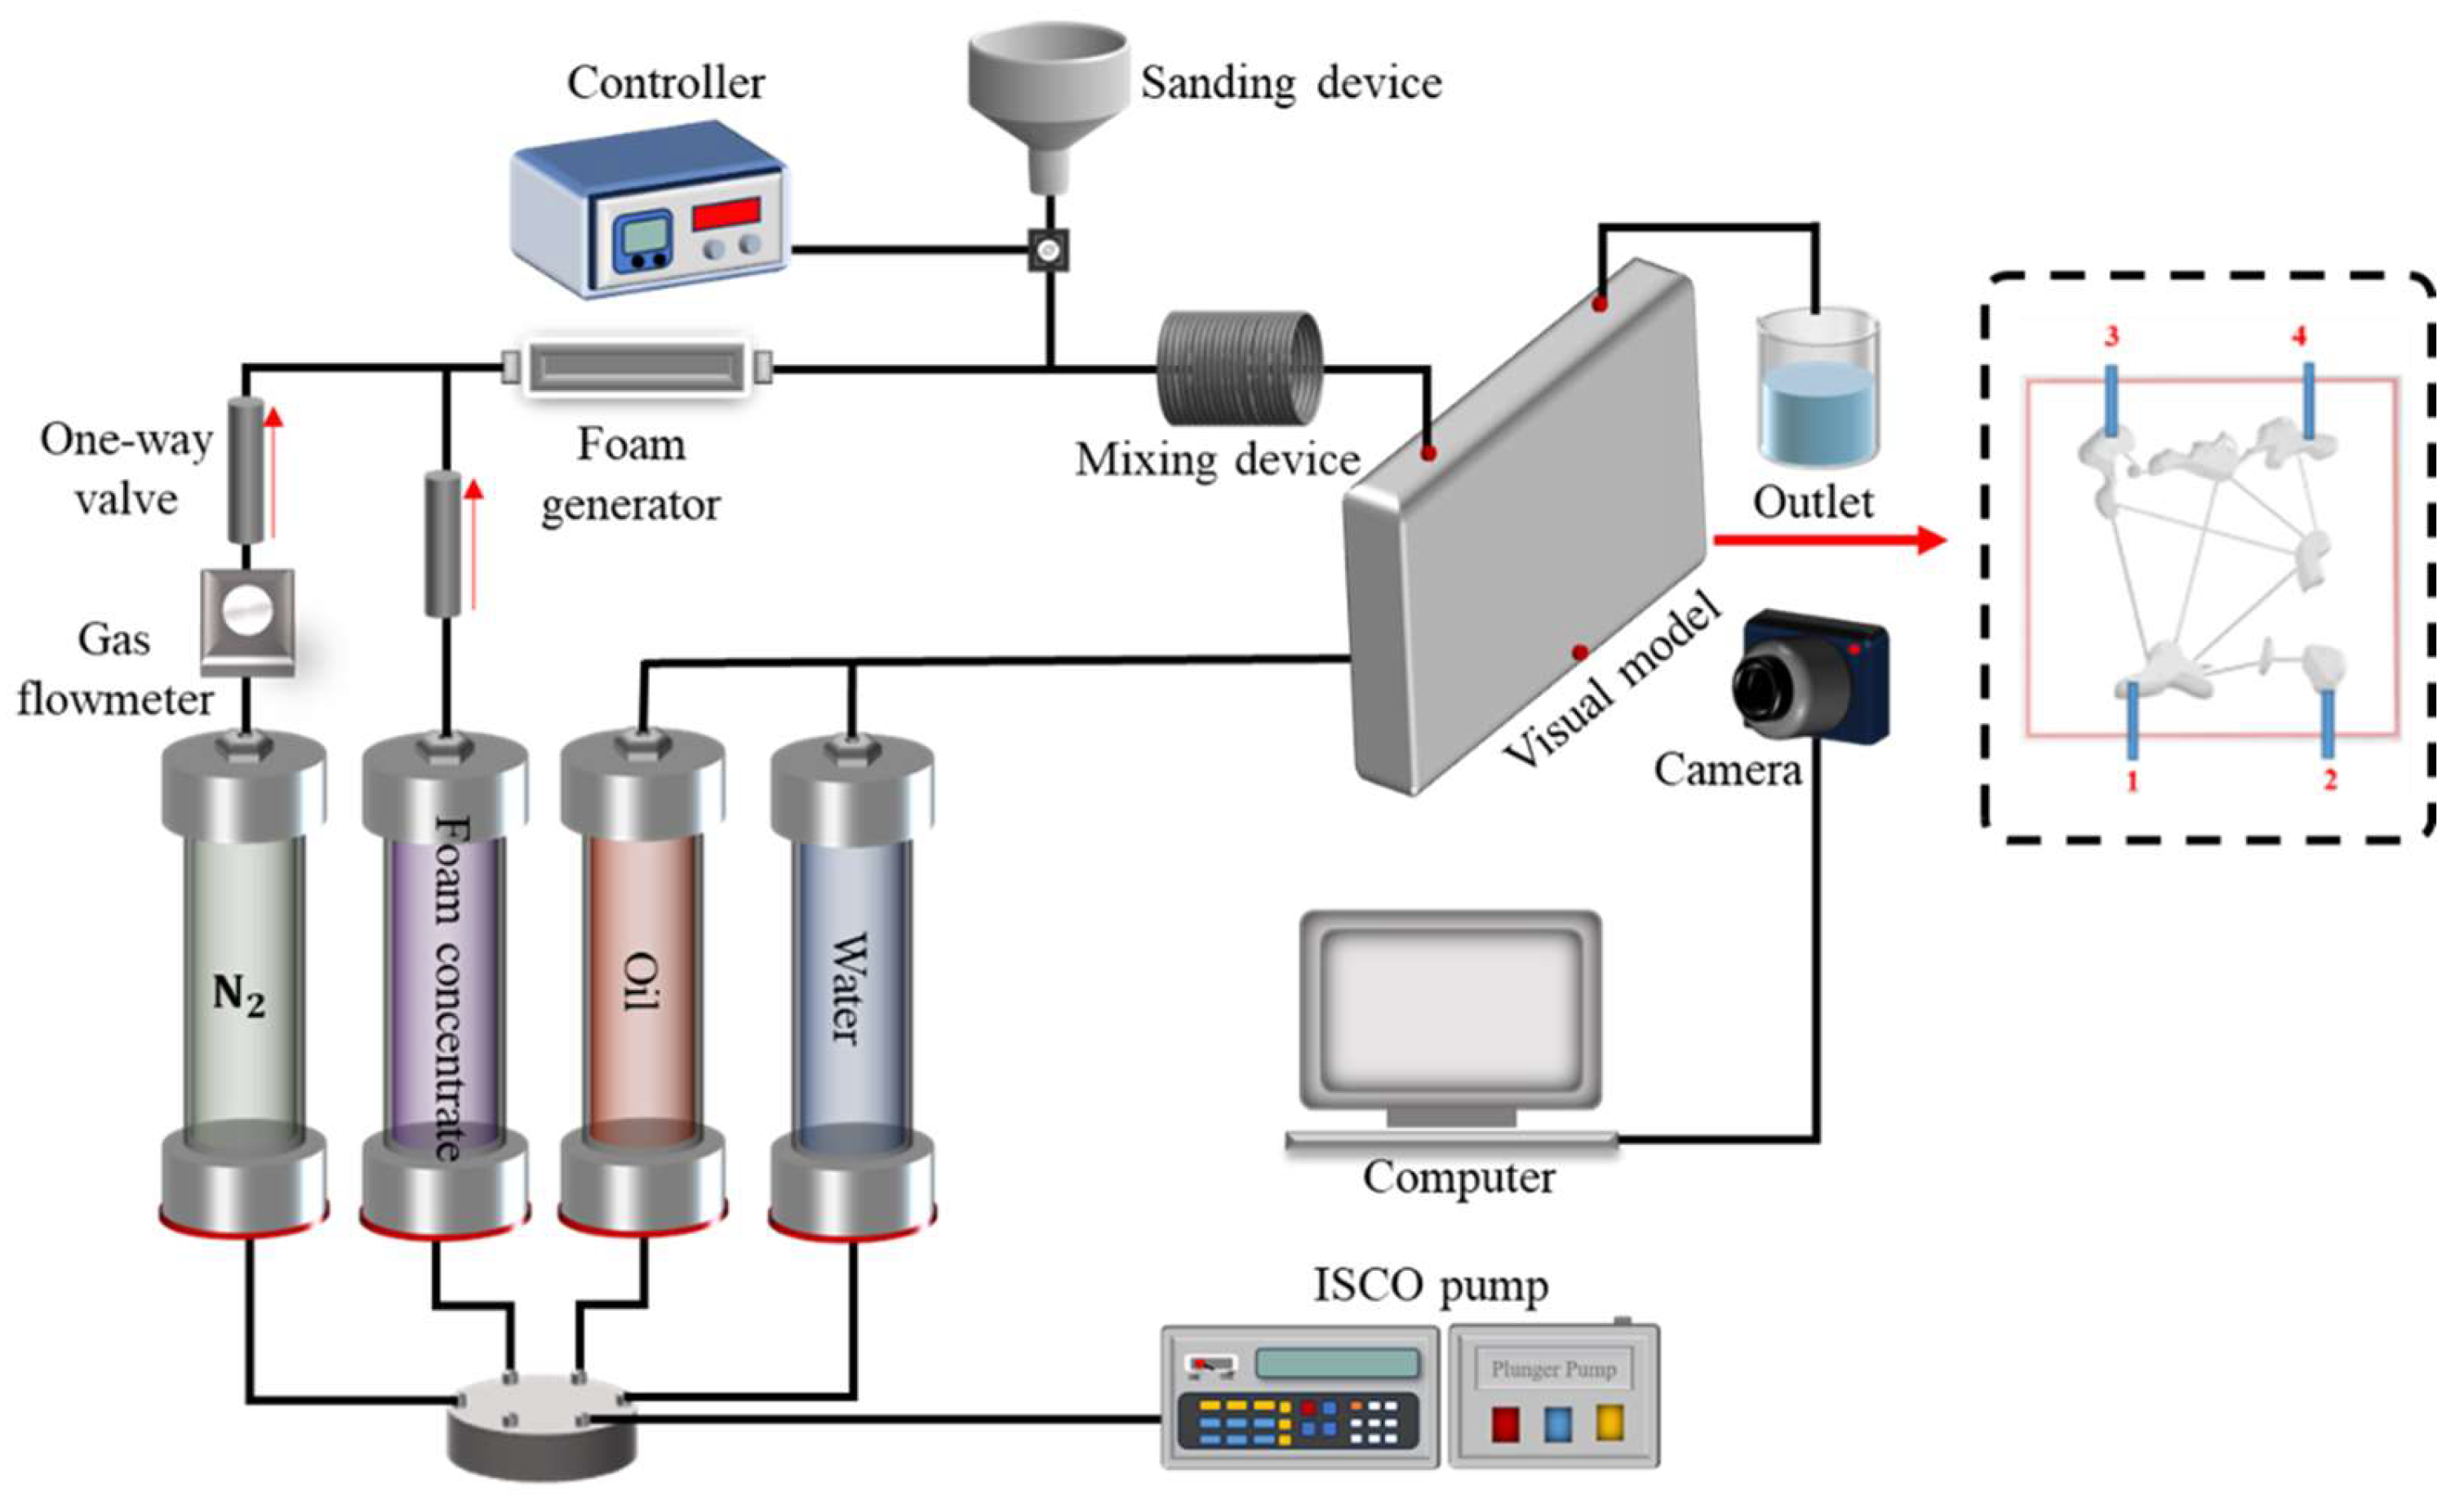
Figure 5.
Experimental flowchart.
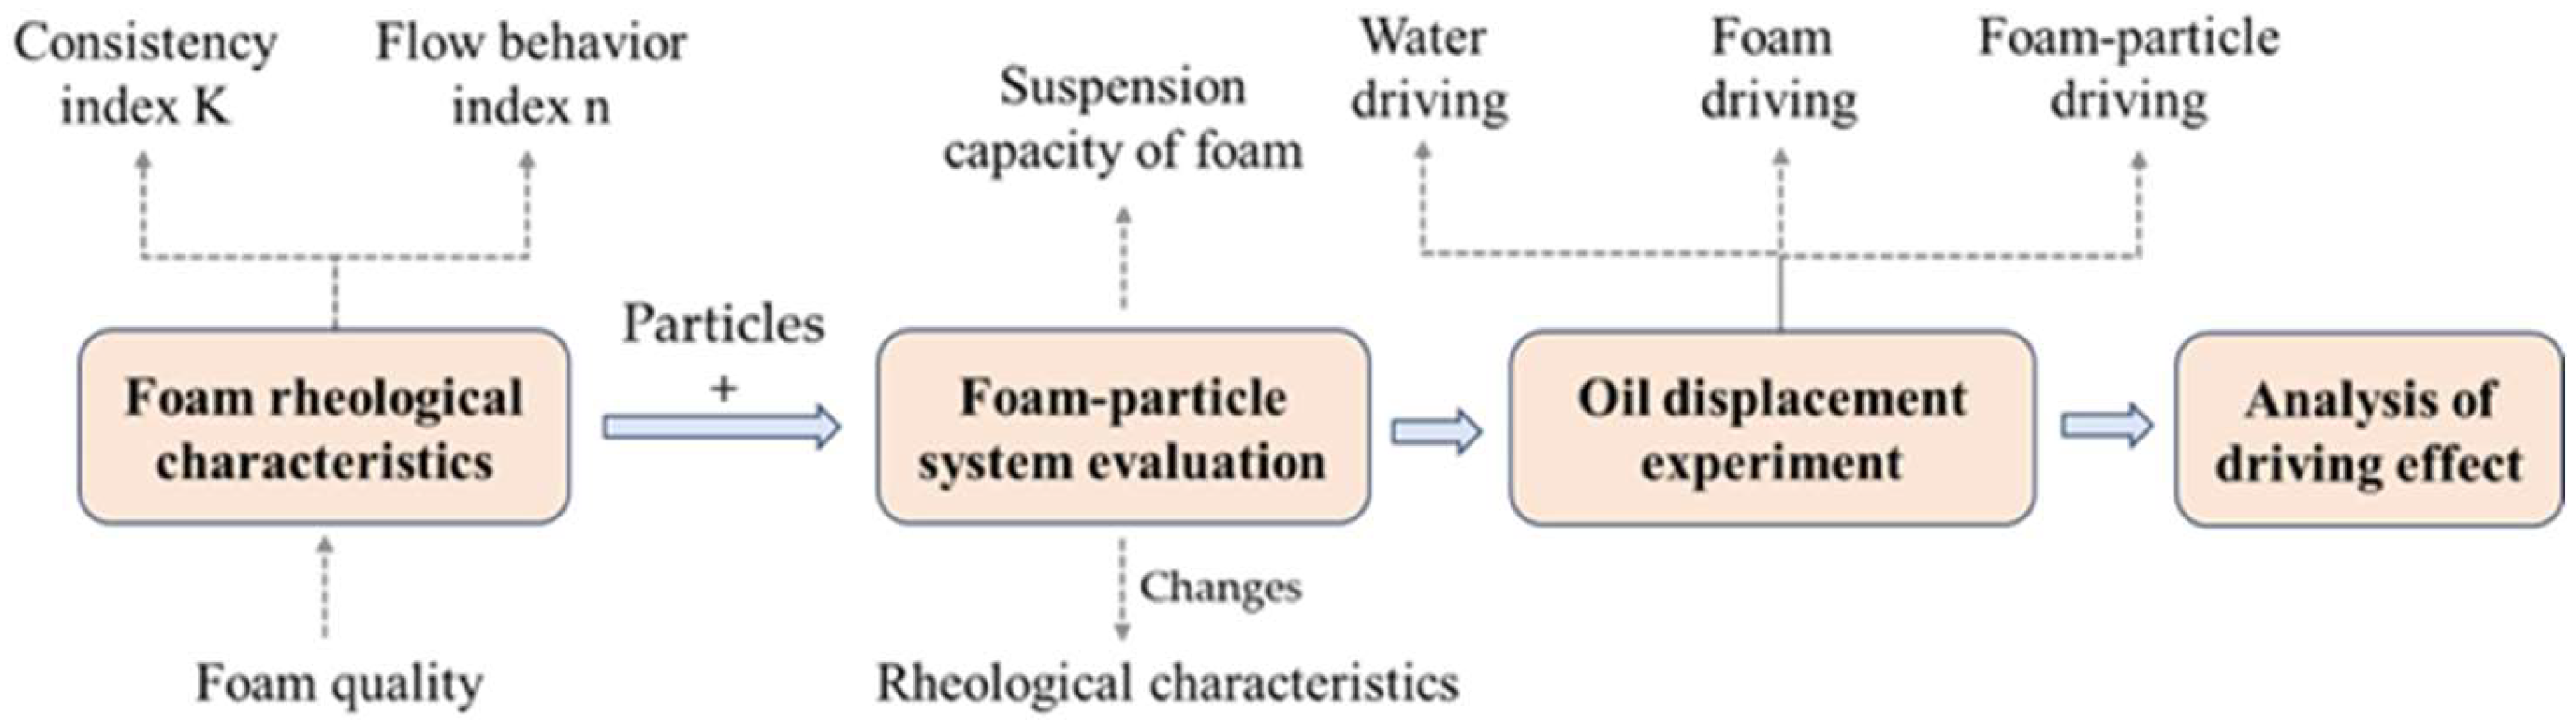
Figure 6.
The rheological curves of N2 foam at different foam quality.
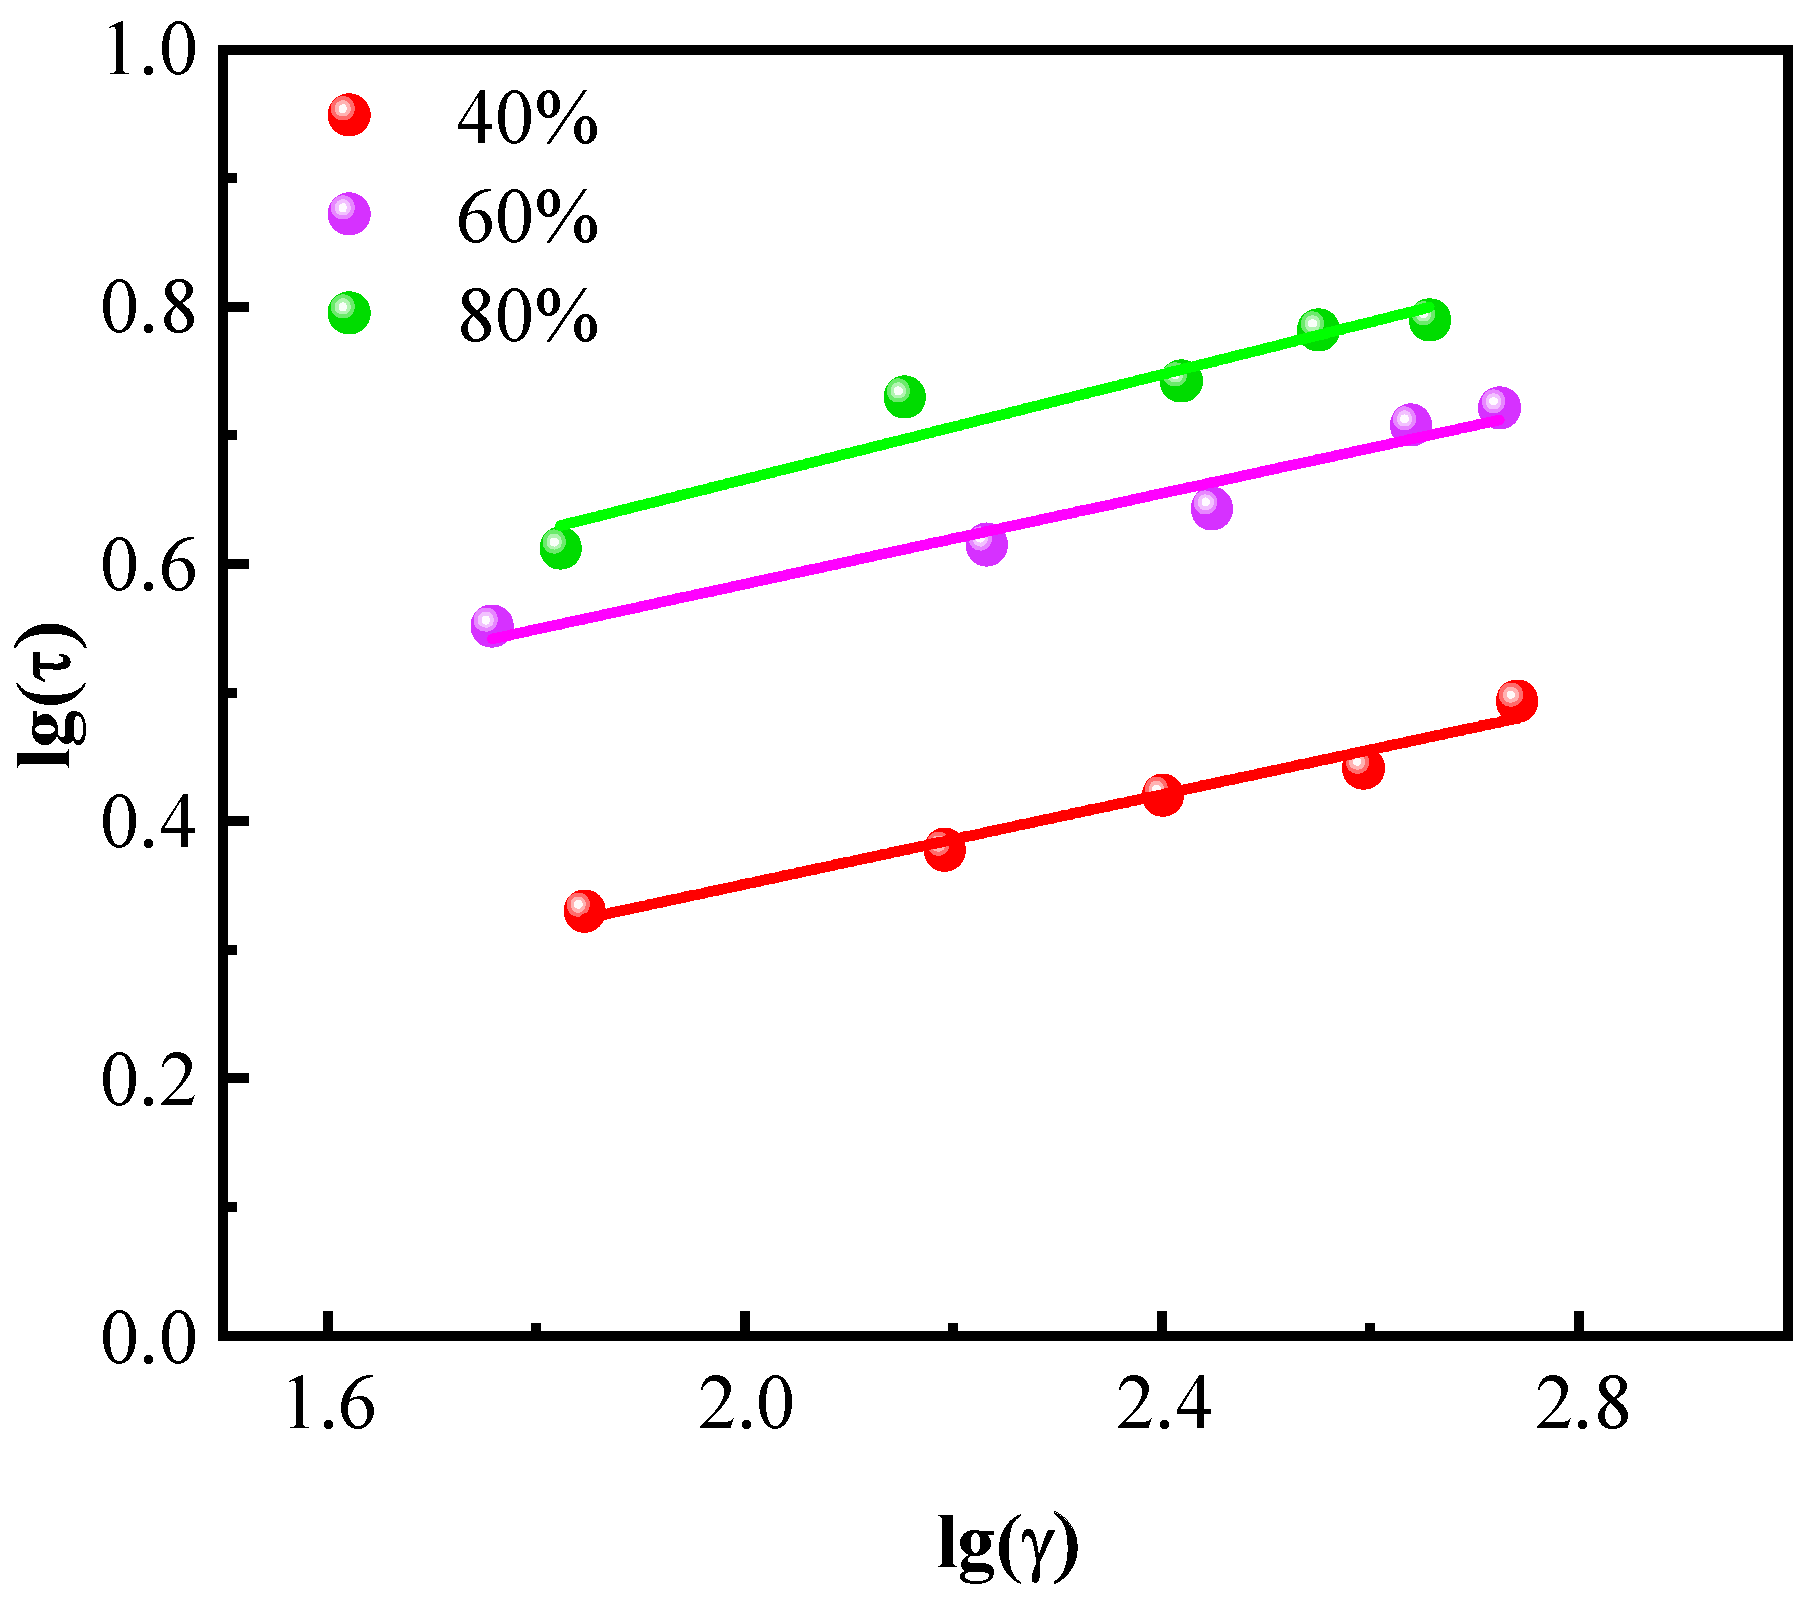
Figure 7.
Effect of foam quality on rheological parameters.

Figure 8.
Solid particle contenton rheological parameters.
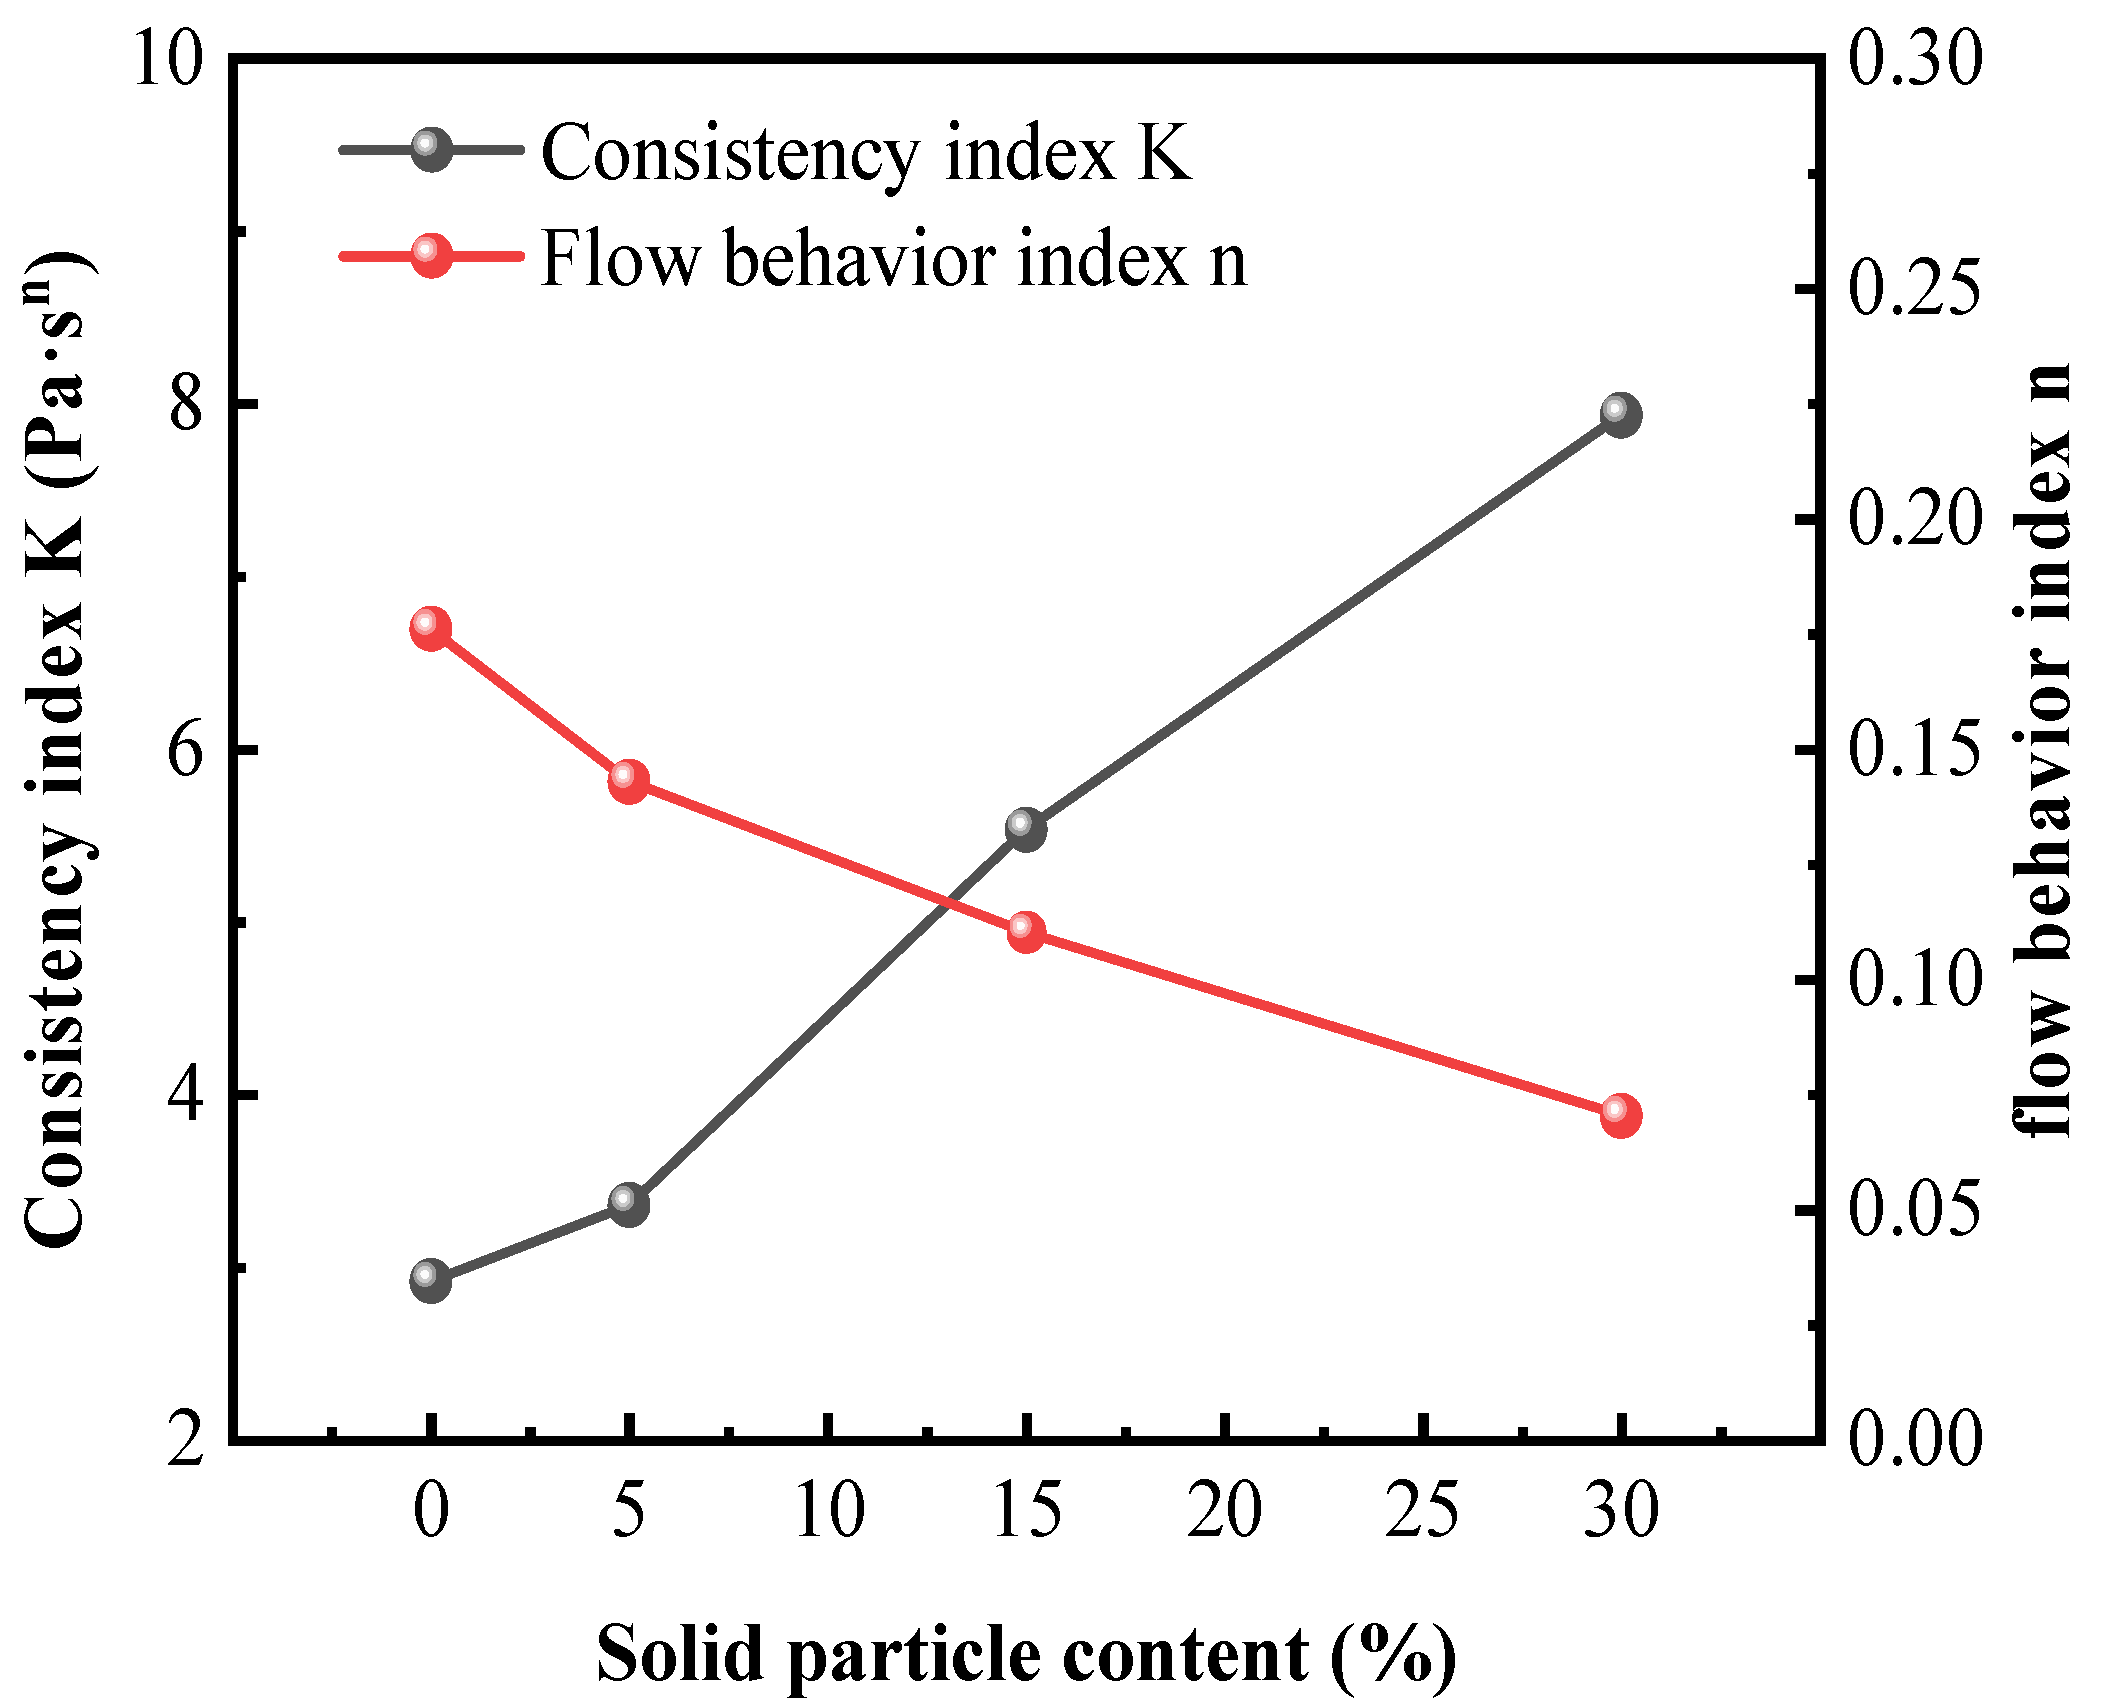
Figure 9.
Particle sedimentation velocity under different foam qualities.
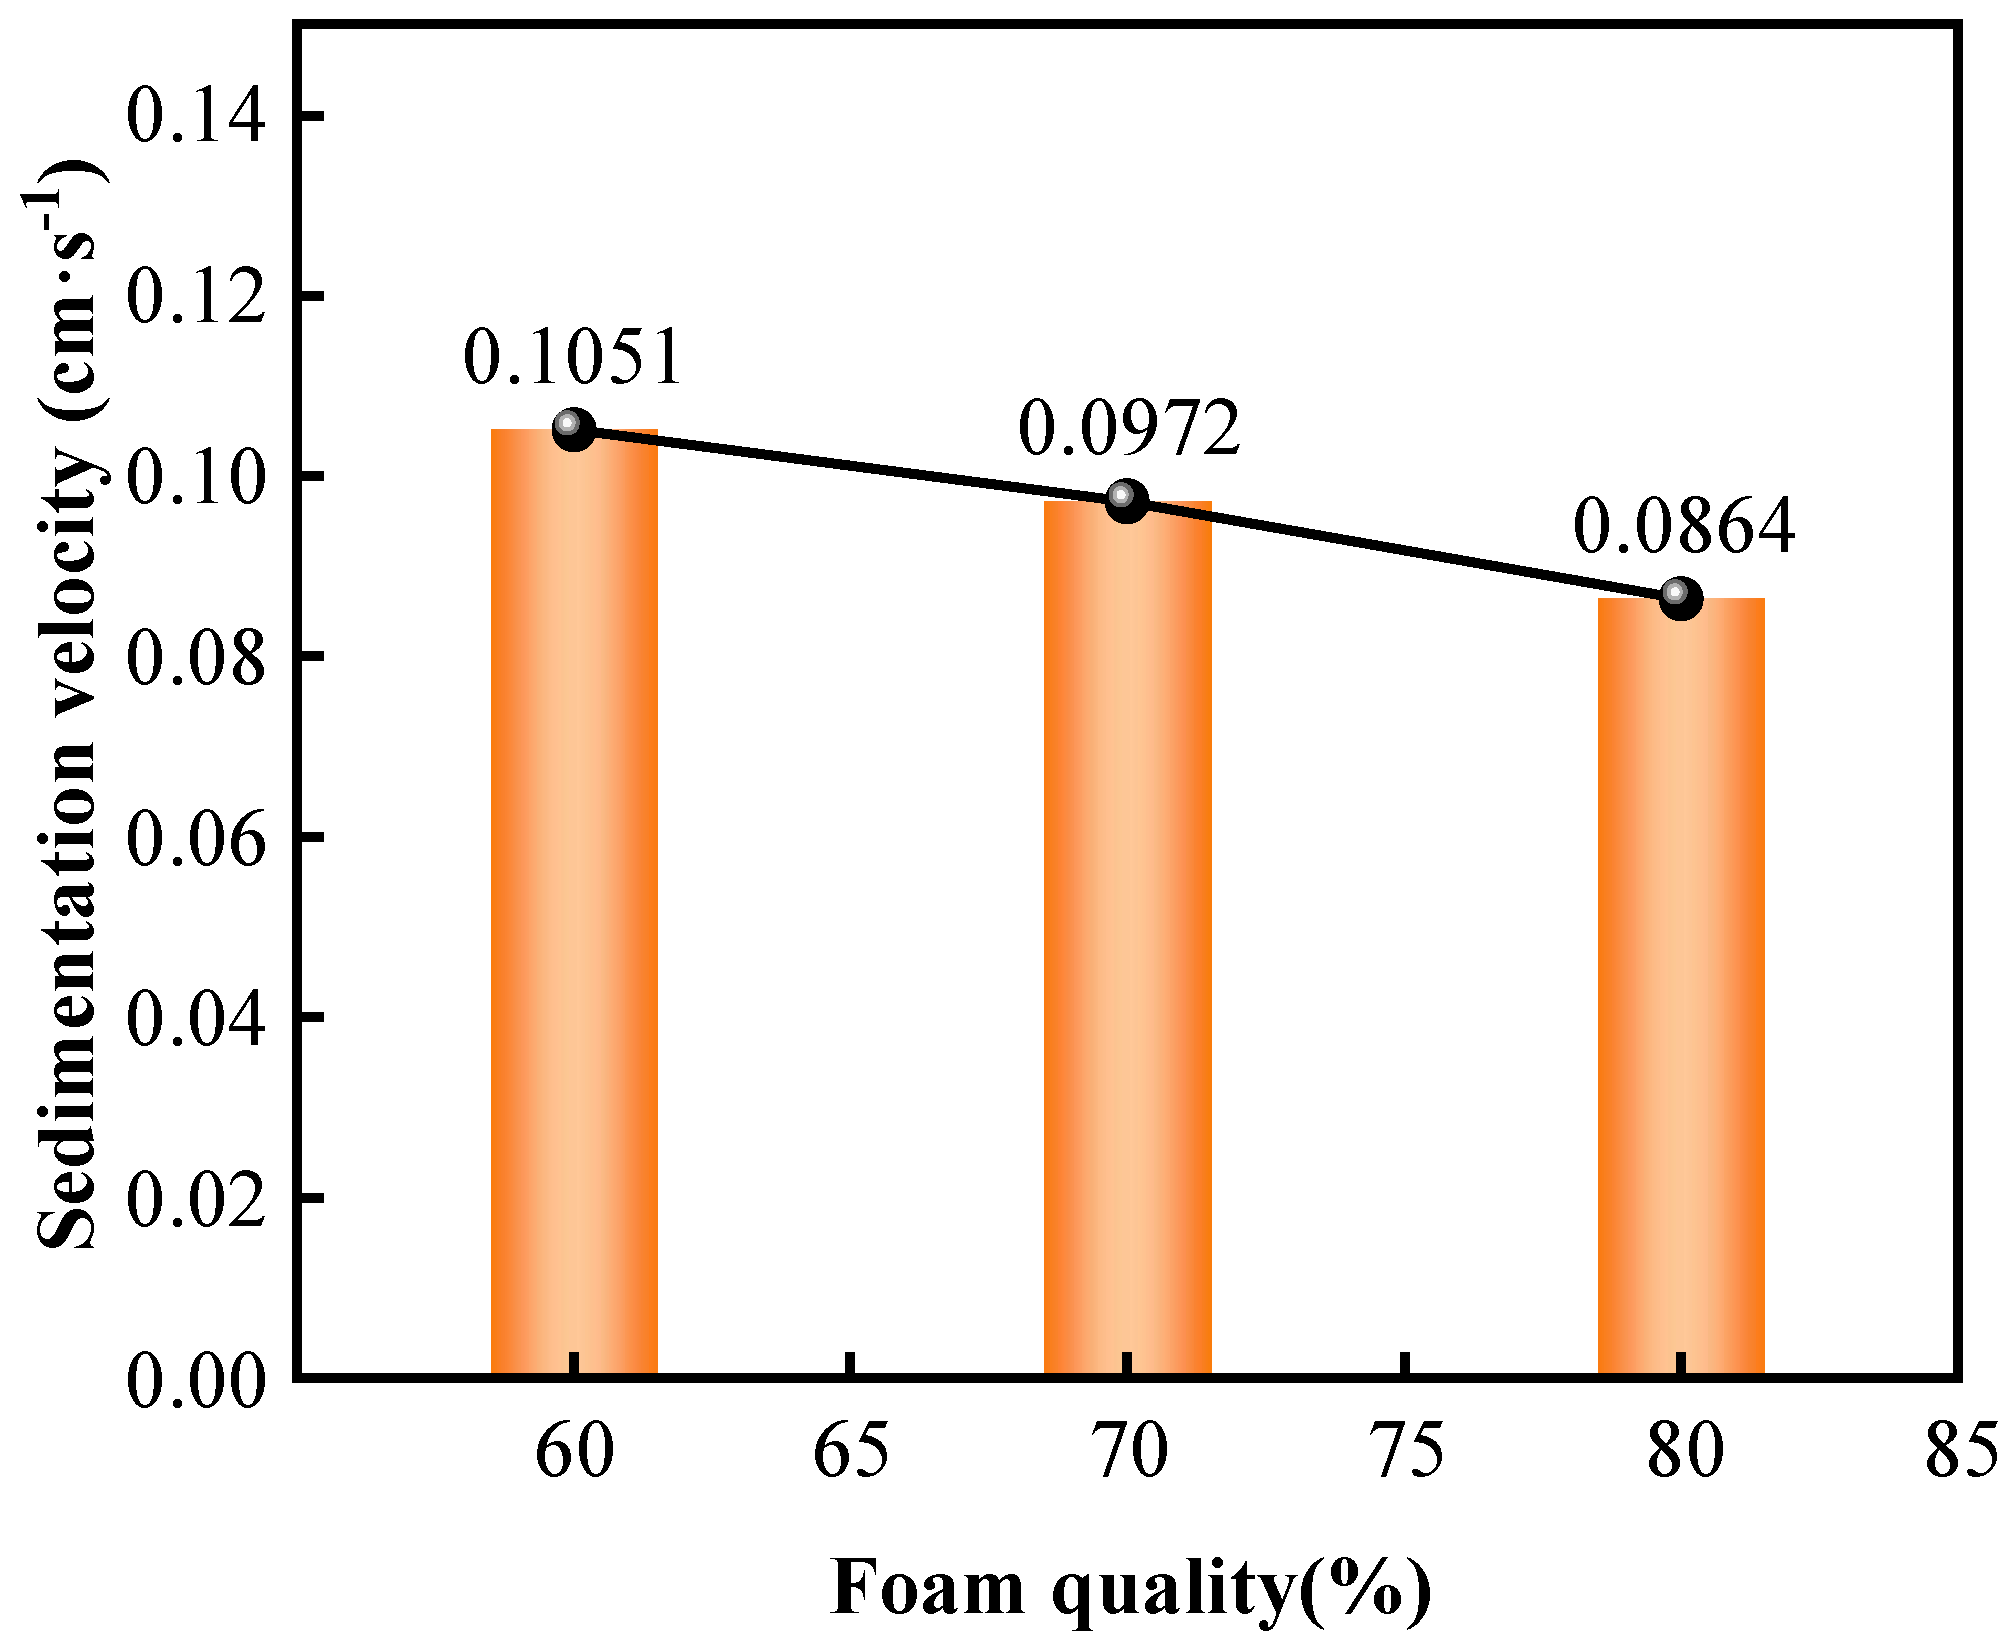
Figure 10.
Mixed state of particles and foam.
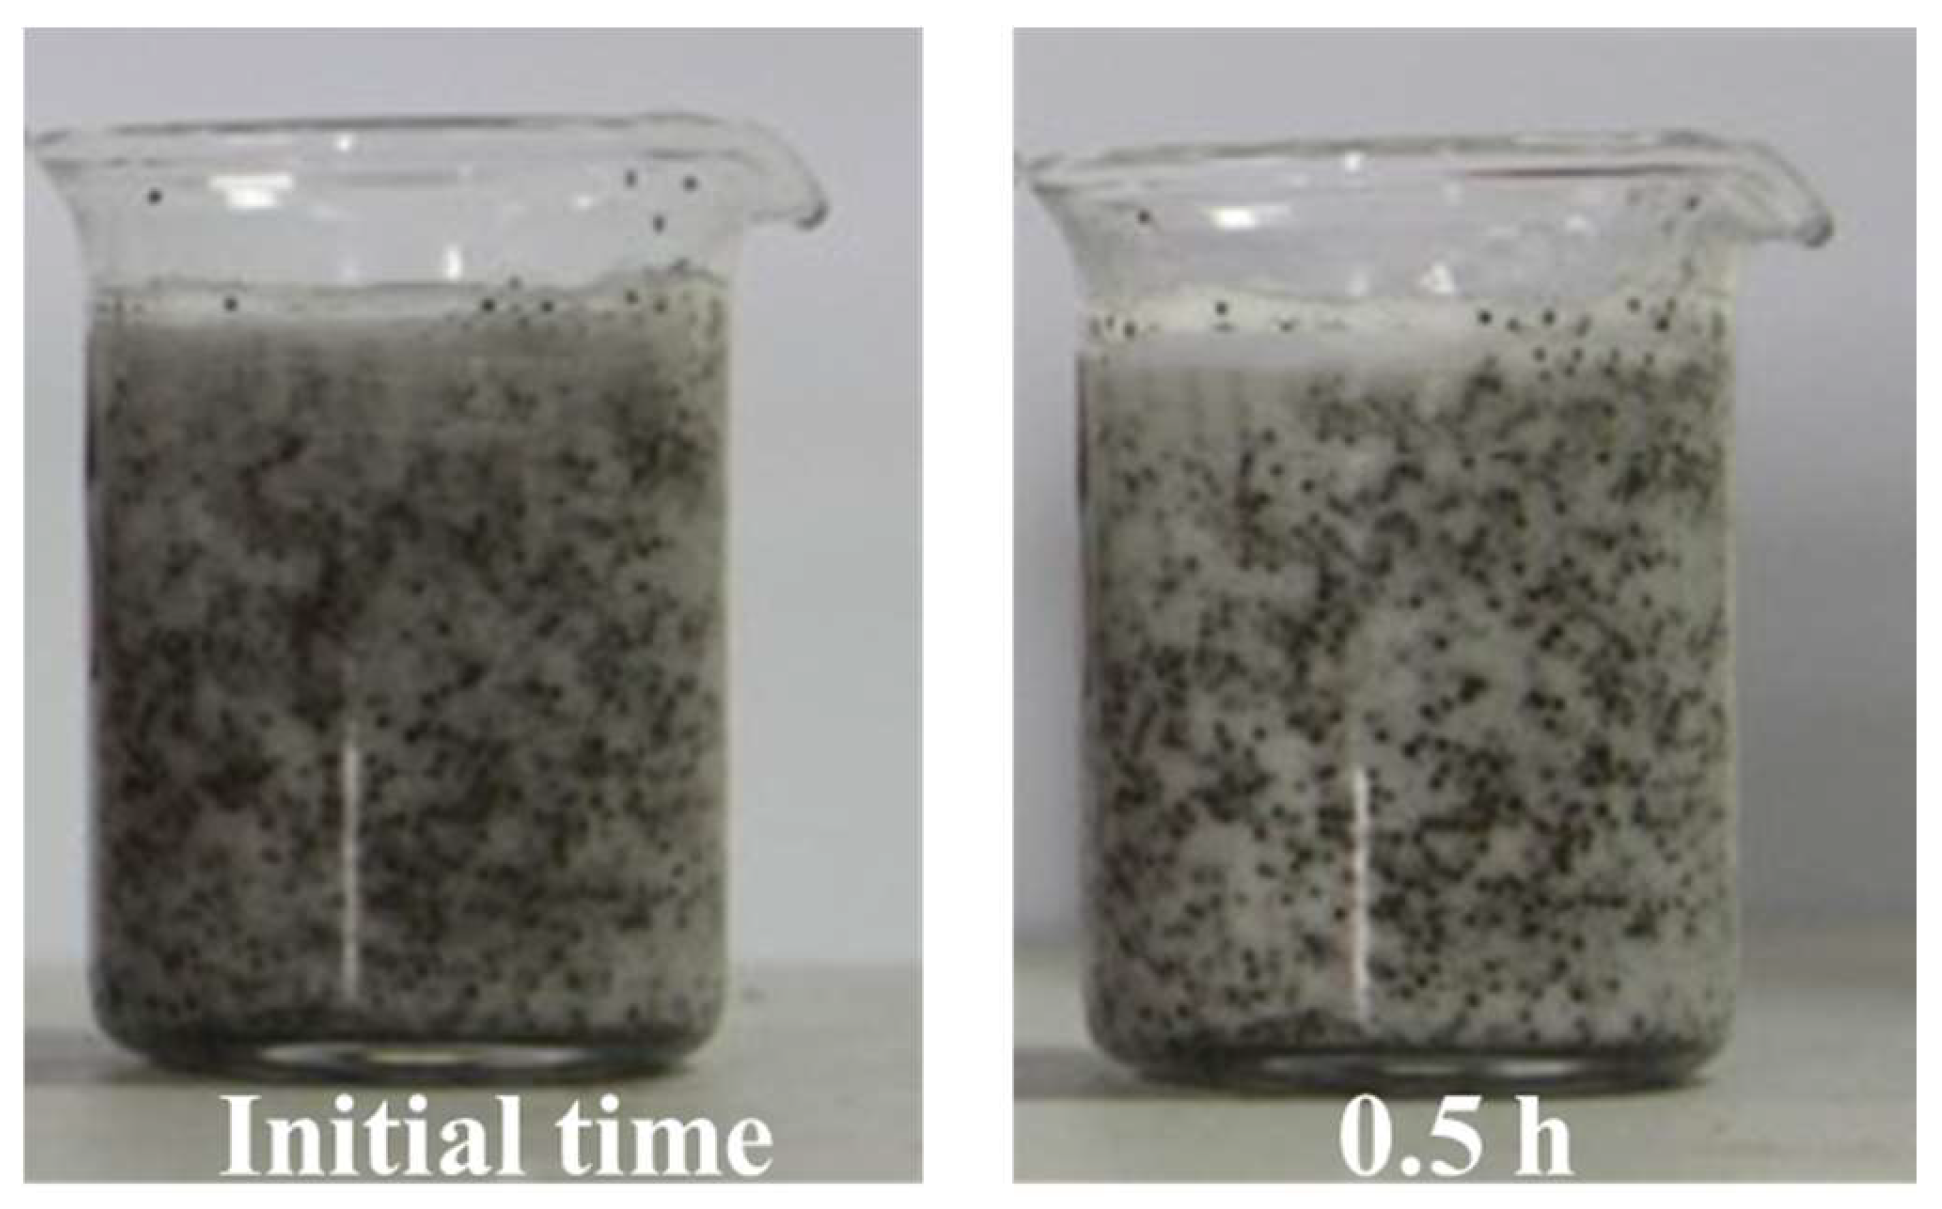
Figure 11.
The coalescence of water droplets during bottom water flooding (red for crude oil, blue for bottom water): (a) 0.1 PV, (b) 0.2 PV.
Figure 11.
The coalescence of water droplets during bottom water flooding (red for crude oil, blue for bottom water): (a) 0.1 PV, (b) 0.2 PV.
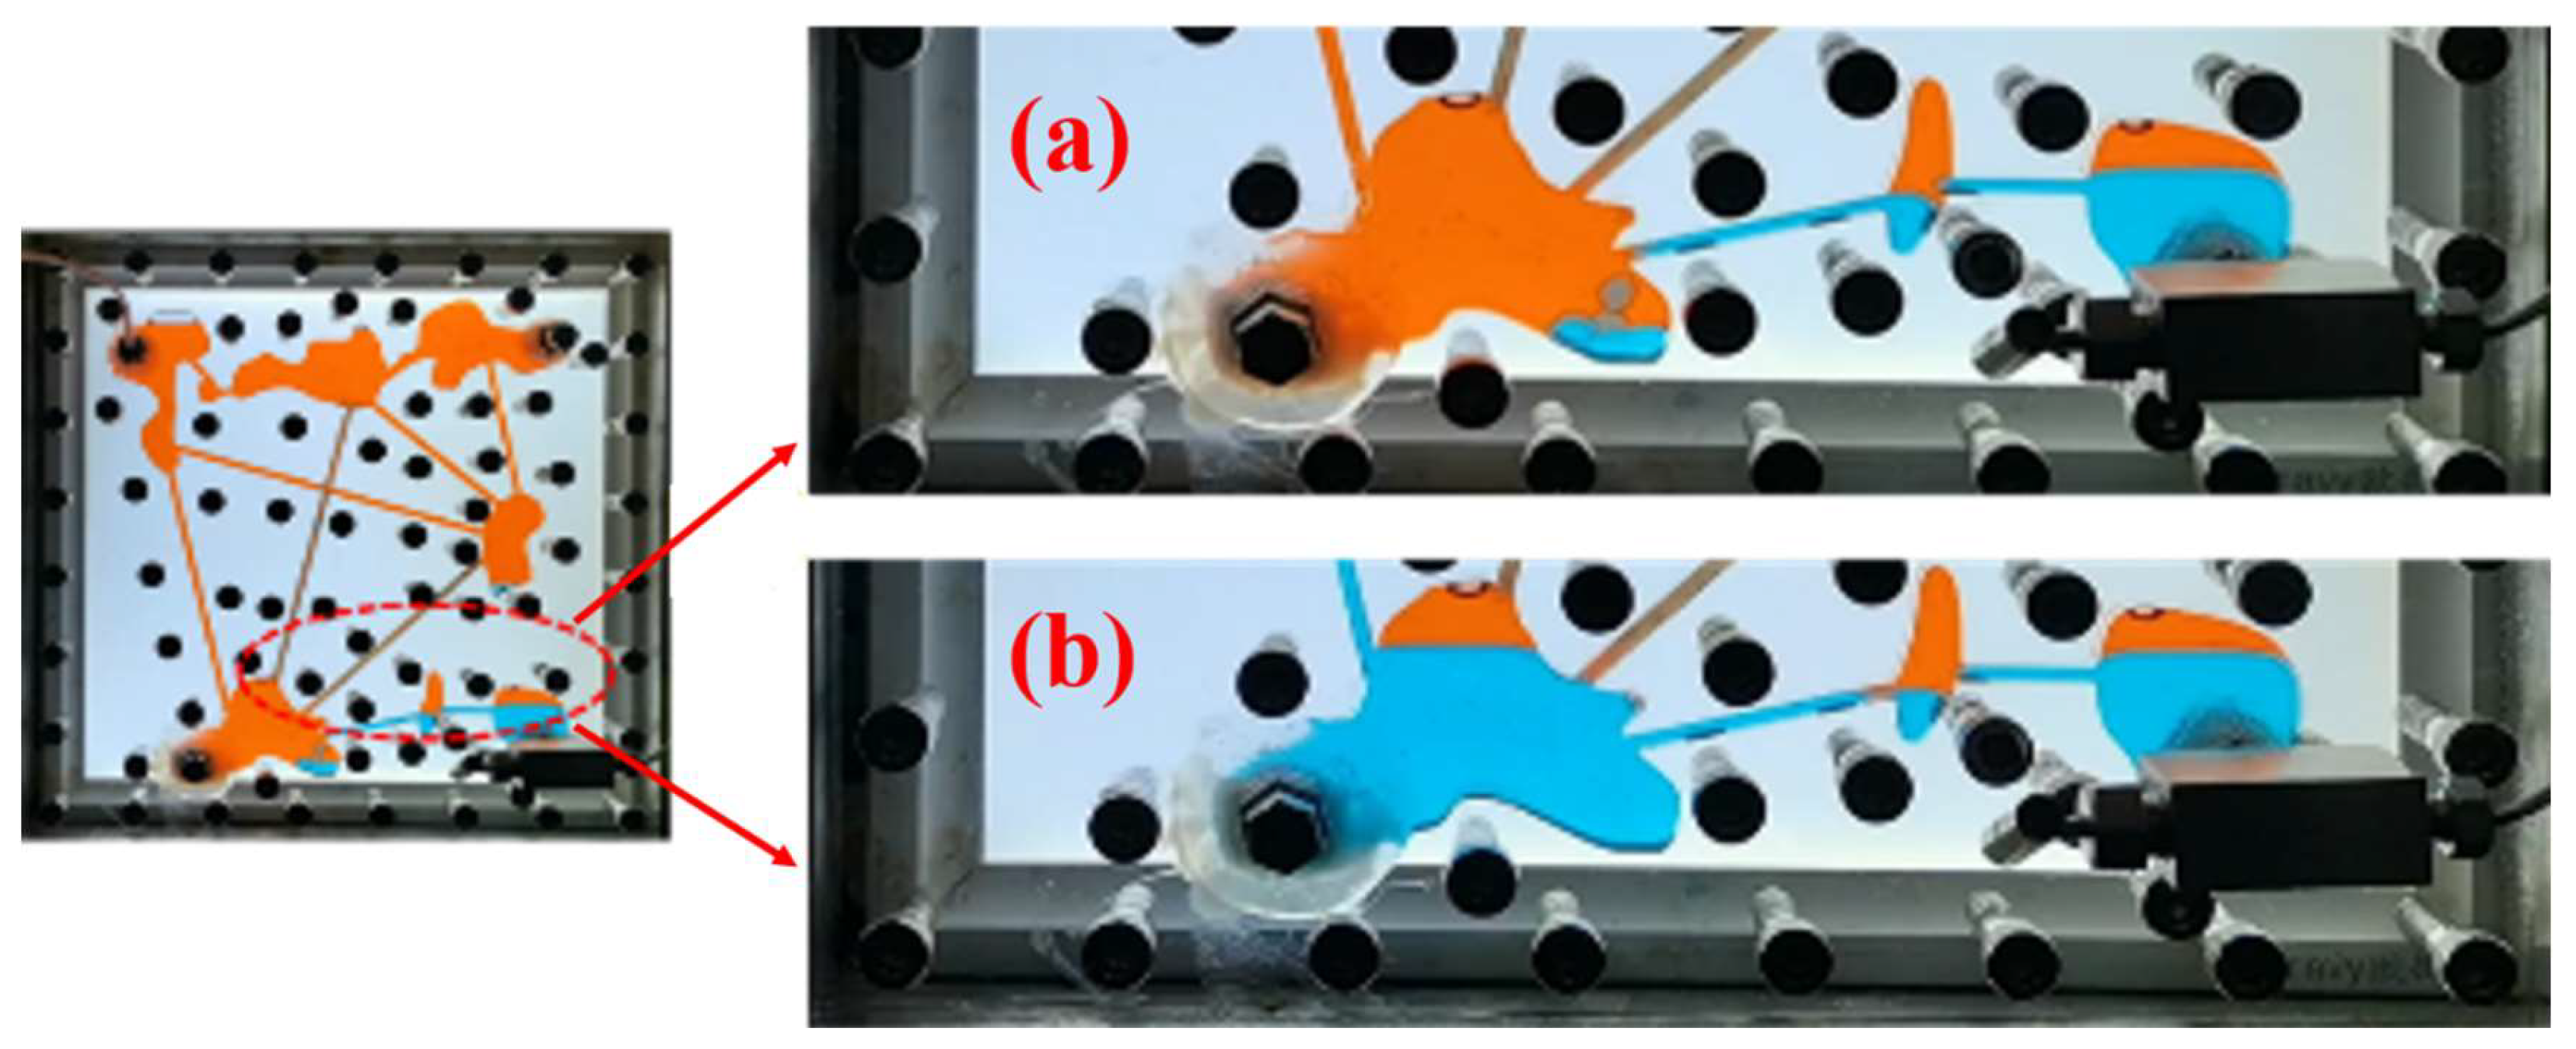
Figure 12.
Schematic diagram of flow process during bottom water displacement (a) and schematic diagram of injection process of foam-carried particles (b).
Figure 12.
Schematic diagram of flow process during bottom water displacement (a) and schematic diagram of injection process of foam-carried particles (b).
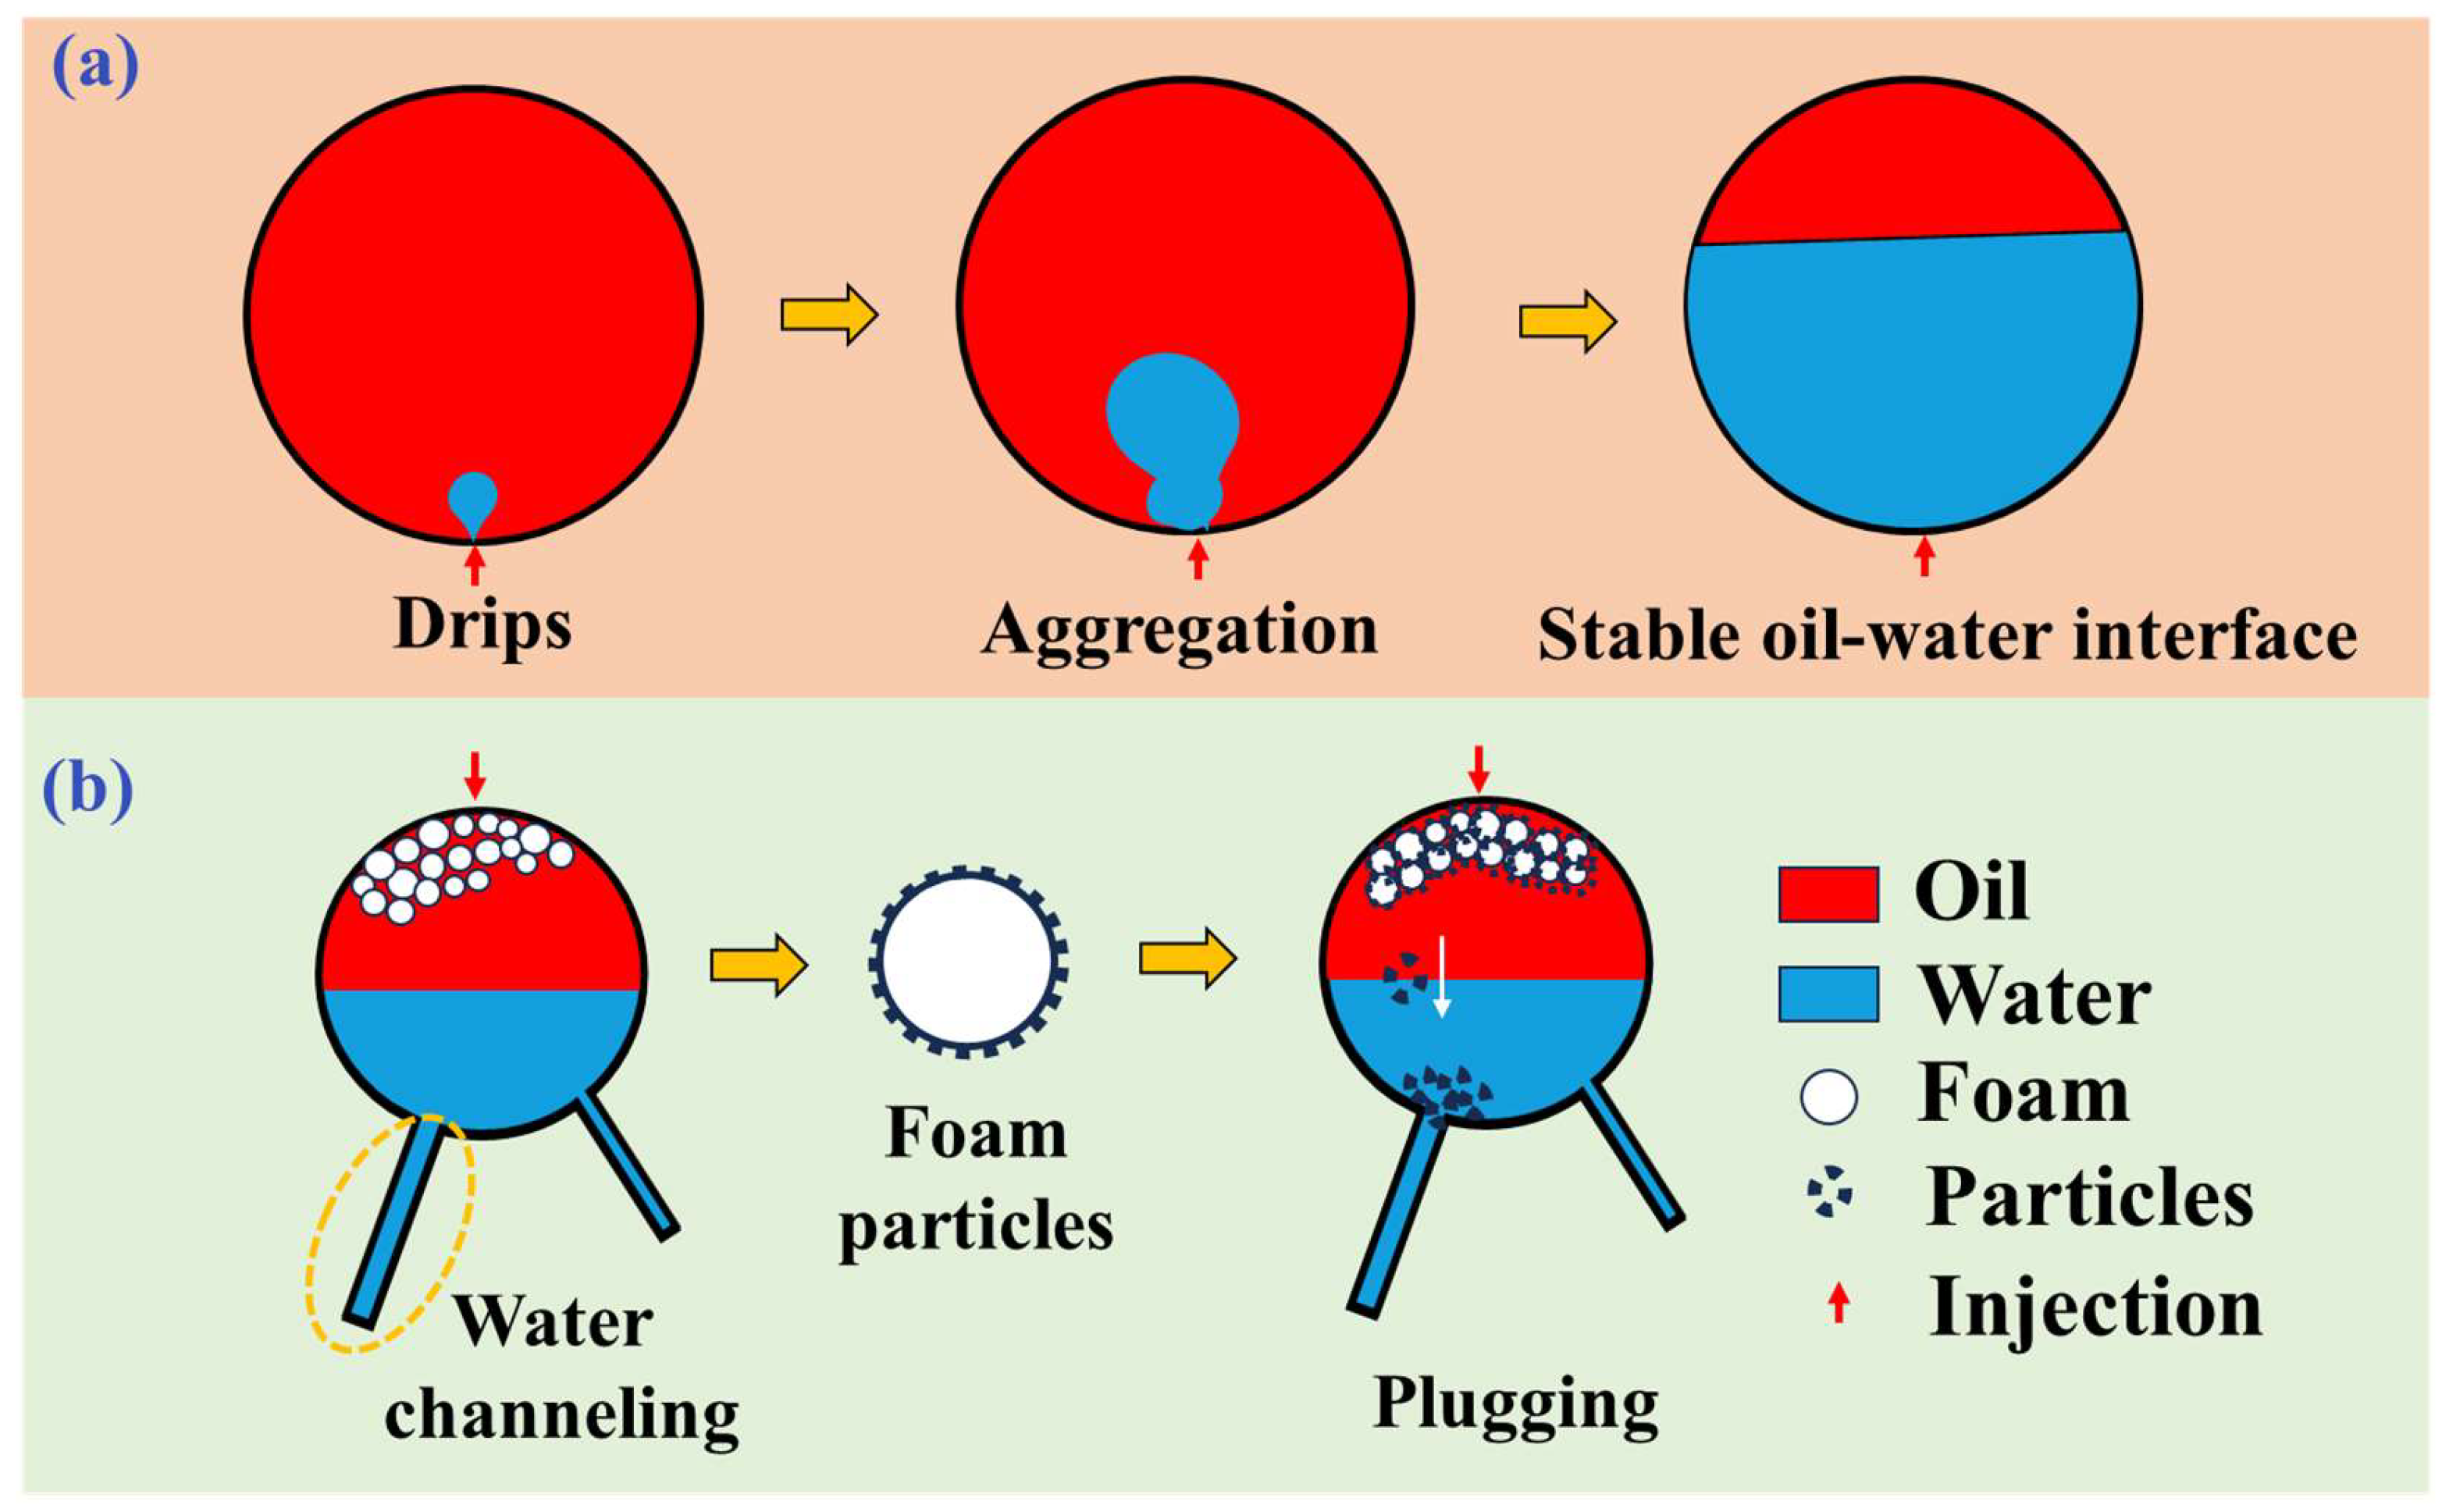
Figure 13.
Oil–water distribution during bottom water flooding (red for crude oil, blue for bottom water, ports 1 and 4 closed, port 2 as bottom water injection, and port 3 as output). Displacement time: (a) 2 min, (b) 3 min, (c) 7.5 min.
Figure 13.
Oil–water distribution during bottom water flooding (red for crude oil, blue for bottom water, ports 1 and 4 closed, port 2 as bottom water injection, and port 3 as output). Displacement time: (a) 2 min, (b) 3 min, (c) 7.5 min.

Figure 14.
Analysis of transporting law of plugging agent in the fractured-vuggy reservoir (red for crude oil, blue for bottom water, port 1 closed, port 2 as bottom water injection, port 3 as foam or foam–particle injection, and port 4 as output). The injection mode: (a) foam, (b) foam–particles.
Figure 14.
Analysis of transporting law of plugging agent in the fractured-vuggy reservoir (red for crude oil, blue for bottom water, port 1 closed, port 2 as bottom water injection, port 3 as foam or foam–particle injection, and port 4 as output). The injection mode: (a) foam, (b) foam–particles.
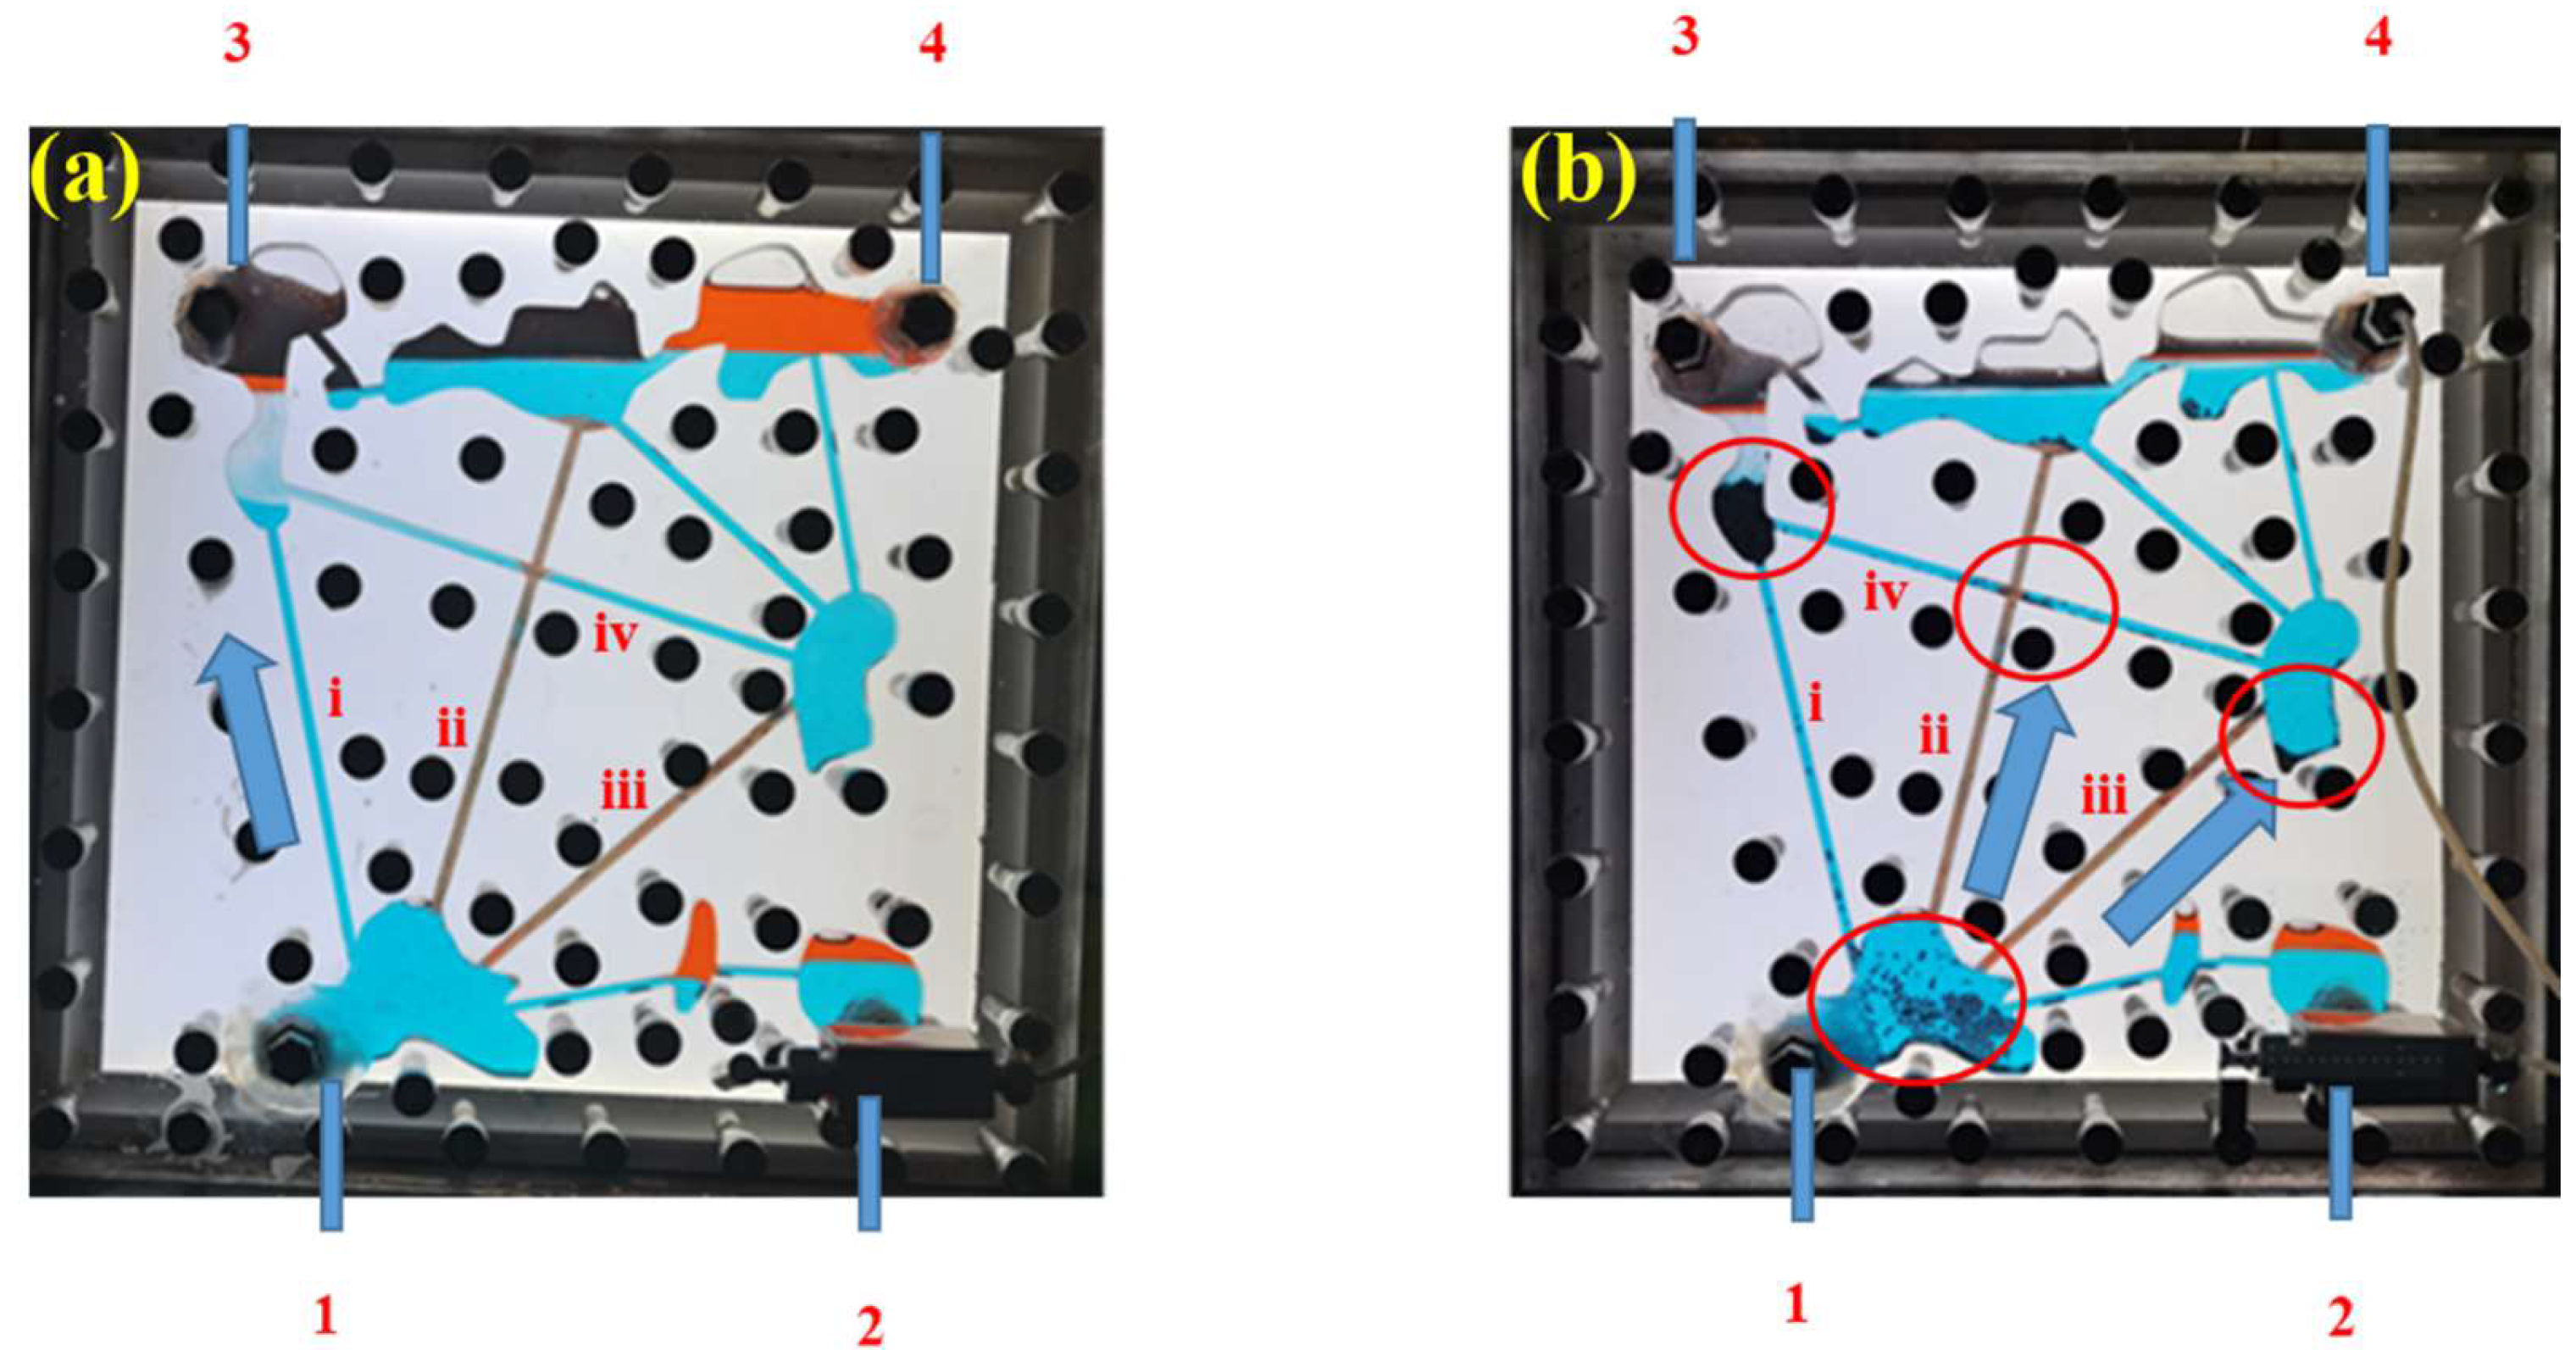
Figure 15.
Cumulative recovery degree under different displacement modes.
Disclaimer/Publisher’s Note: The statements, opinions and data contained in all publications are solely those of the individual author(s) and contributor(s) and not of MDPI and/or the editor(s). MDPI and/or the editor(s) disclaim responsibility for any injury to people or property resulting from any ideas, methods, instructions or products referred to in the content. |
© 2024 by the authors. Licensee MDPI, Basel, Switzerland. This article is an open access article distributed under the terms and conditions of the Creative Commons Attribution (CC BY) license (https://creativecommons.org/licenses/by/4.0/).
Share and Cite
MDPI and ACS Style
Wang, J.; Feng, Y.; Cao, A.; Zhang, J.; Chen, D. Co-Injection of Foam and Particles: An Approach for Bottom Water Control in Fractured-Vuggy Reservoirs. Processes 2024, 12, 447. https://doi.org/10.3390/pr12030447
AMA Style
Wang J, Feng Y, Cao A, Zhang J, Chen D. Co-Injection of Foam and Particles: An Approach for Bottom Water Control in Fractured-Vuggy Reservoirs. Processes. 2024; 12(3):447. https://doi.org/10.3390/pr12030447
Chicago/Turabian StyleWang, Jianhai, Yibo Feng, Aiqing Cao, Jingyu Zhang, and Danqi Chen. 2024. "Co-Injection of Foam and Particles: An Approach for Bottom Water Control in Fractured-Vuggy Reservoirs" Processes 12, no. 3: 447. https://doi.org/10.3390/pr12030447
Note that from the first issue of 2016, this journal uses article numbers instead of page numbers. See further details here.