Abstract
Casing deformation is evident during the development of shale oil and gas wells in the Sichuan and Junggar Basins in China. Their casing deformation characteristics, distribution law of deformation points, and main controlling factors were analyzed. According to the analysis results, shear is the main cause of casing deformation of shale oil and gas wells in the Sichuan and Junggar Basins in China and has the characteristics of “a dense heel end and a sparse toe end”. Faults account for 75% of casing deformation points, and fault slip caused by multi-stage fracturing is the primary factor responsible. The calculation model for fault slip that takes into account fracturing fluid invasion was established, and the dynamic variation law of fault slip was clarified: the fracturing fluid intruded into the fault, the relative dislocation of the damaged fault was caused by gravity, and the fault slippage was caused by the increase in fault activation length. This resulted in a linear increase in fault slippage, and the slippage reached its maximum when the fracturing fluid completely penetrated the fault and reached the fault boundary. The slip amount has a positive correlation with the fault length and the in situ stress difference; it increases first and then decreases with the increase in the fault dip angle. The slip amount reaches its maximum when the fault dip angle reaches 45°.
1. Introduction
The low porosity and low permeability of the shale formation make it difficult to generate commercial value using conventional development methods [1]. Horizontal wells and multi-stage hydraulic fracturing can be used to create an artificial fracture network to obtain commercial oil and gas flow. Therefore, multi-stage fracturing has become a crucial technology for the development of shale gas [2]. However, the casing deformation caused by multi-stage fracturing is significant in the operation process [3,4]. It is necessary to mill the casing or replace smaller bridge plugs to continue fracturing, which greatly reduces the fracturing efficiency and the production of shale gas wells and even scraps the entire wellbore [5]. In Weirong block in Sichuan Province, China, from 2018 to 2022, 128 wells were fractured, and 49 wells showed casing deformation, reaching 38.3% [6]. In the Sichuan Basin, the casing deformation in the Shunan block is more severe: from 2021 to 2022, 93 wells were fractured, 69 were deformed, and the casing deformation percentage reached 74.2% [7]. Casing deformation also occurred during the fracturing process of Jimsar shale oil wells in Xinjiang Oilfield, China; by June 2021, there were 14 casing deformation wells in 100 fractured wells, which accounted for 14% [8]. The above casing deformation phenomenon has gradually become one of the key problems in the safe and efficient development of shale oil and gas.
When Yu et al. [9] used ABAQUS finite element software to establish a numerical model and studied the influencing factors of casing deformation in horizontal shale gas wells, they found that the casing deformation was the result of the combination of formation property change, in situ stress distribution, and high pump pressure. Lian and Lin [10,11] carried out a numerical simulation for the mechanism of casing deformation, the results of which showed that the zero stress area and the tensile stress area are very small. This puts the casing in the “hanging” state, resulting in a large deflection of the casing in the radial direction. King et al. [12] argue that multi-stage fracturing will increase the casing loading. According to the casing deformation encountered in the development of shale gas in China, Wang [13] states that the zipper fracturing process will pose a great challenge to the casing integrity. Jiang et al. [14] believe that when the cement sheath is eccentric and missing, the casing will bear huge, uneven loading, and the failure risk is greatly increased. In terms of the mechanism of multi-stage fracturing-induced fault slippage, Qian et al. [15] explain that shale reservoirs have a high degree of anisotropy and heterogeneity, natural fracture faults are widespread, and the stress field has considerable changes during the fracturing process, leading to the prominent problem of casing deformation. Ge and Ghassemi [16] built analytical models to calculate the induced stress generated and the pore pressure distribution around the hydraulic fracture and to determine the additional pore pressure required for natural fracture reactivation. When Feng et al. [17] evaluated the near-well stress distribution during fracture generation and expansion, they found that the initial defect at the interface of the wellbore assembly can significantly reduce the propagation pressure, allowing the fracture to develop vertically at the bonding surface. Chen et al. [18] suggested that the stress and pressure changes can cause fault slip and induce seismic activity, which may be caused by the direct linkage between the fault and the hydraulic fracturing fluid. Generally, the engineering factors can influence the casing stress but not enough to cause casing deformation [19]; however, the main factors appear to be geological in nature, such as fault slip, lithological interface, and surrounding rock creep [20,21,22]. The researchers comprehensively analyzed the correlation between casing deformation, fault slippage, and lithological interface, and the results of multi-armed caliper logging also indicate that shear deformation is the primary form of casing deformation [23,24,25]. The main cause of casing deformation in the Sichuan Basin is believed to be the large natural fracture zone [26]. Chen et al. (2017) considered that the increase in pore pressure caused by fracturing can lead to natural fracture slippage, which may lead to casing shear deformation [23]. It is generally believed that the multi-stage fracturing causes fault slip, and the slippage process was predicted by Liu Kui using a semi-analytical method [27].
In response to the engineering background of multi-stage fracturing-induced fault slip and shear of casing, this paper establishes a numerical calculation model for multi-stage fracturing-induced fault slippage, analyzes the relative sliding process of rocks above and below the fault after fracturing fluid enters the fault plane, and, based on this, analyzes the factors affecting the fault slippage.
2. Current Situation of Casing Deformation Caused by Multi-Stage Fractionation
2.1. Casing Deformation Characteristics
China’s shale gas industry has experienced prosperity and development since the establishment of the Wei-201 well (Figure 1a), but the safe and efficient production of shale gas wells has been severely impacted by casing deformation during multi-stage fracturing. The statistical results of the casing deformation of shale gas wells in the Sichuan Basin, China, are shown in Figure 1b. China has made progress in shale oil development, but casing deformation has also occurred during multi-stage fracturing of shale oil wells, similar to shale gas development. The statistical results of casing deformation during the development of the Jimsar Shale Oilfield in Xinjiang Oilfield are shown in Figure 1c.
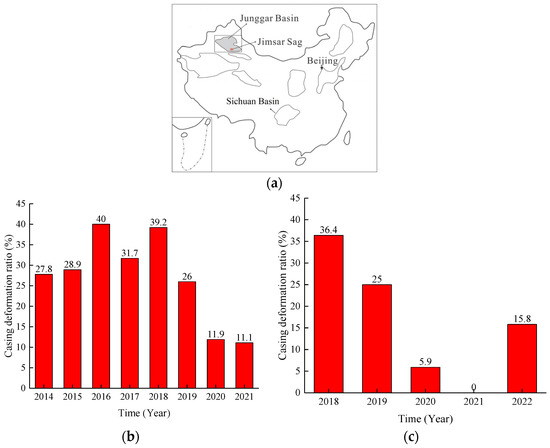
Figure 1.
(a) Shale oil gas development in China; (b) casing deformation in Sichuan Basin, China (June 2020); (c) casing deformation in Jimusaer, China (June 2022).
Figure 1a,b shows that the casing deformation in the process of shale oil and gas development in China is relatively severe; for a long time, the proportion was over 10%, and, in extreme cases, it went up to 30% or even 40%. Therefore, clarifying the mechanism and influencing factors of casing deformation is crucial for developing shale oil and gas resources safely and efficiently.
The landing position of the horizontal section (the hole deviation angle is 90°) is defined as point A, and the end of the flat area is defined as point B. The distribution rules for the casing deformation points of shale gas wells in the Sichuan Basin and Jimusaer shale oil wells are counted, respectively, as shown in Figure 2.
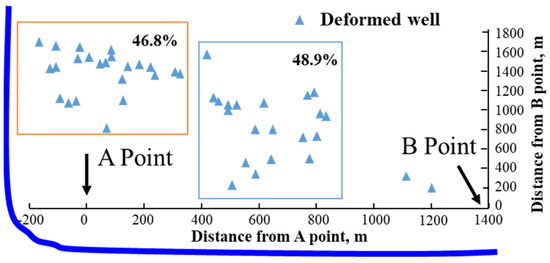
Figure 2.
Distribution of casing deformation points in Sichuan Basin, China.
Figure 2 shows that the casing deformation is mainly concentrated near point A and the middle of the horizontal section, and the casing deformation points near the toe end are relatively few. The position closer to point A in the multi-stage fracturing process is due to the role of bridge plug sealing. The more internal pressure cycles the casing bears, the more significant the decrease in its shear resistance and the more prone it is to shear deformation.
Multi-arm caliper logging and lead printing are generally used to determine the shape of the casing after deformation, as illustrated in Figure 3a,b, which are the results of casing deformation logging in the Weirong and Jimusar blocks.
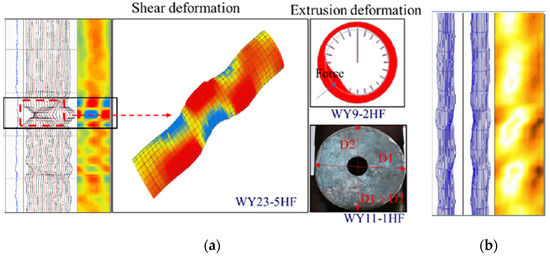
Figure 3.
(a) Deformation morphology in Weirong block; (b) analysis results of forty-arm diameter of Jimusar shale oil well.
It can be seen from Figure 3a,b that the casing deformation in the fracturing process of shale oil and gas wells can be divided into shear and extrusion deformation. The field statistical results indicate that the casing deformation is mainly shear (73%), and that there is a relatively small amount of extrusion deformation (27%). Both shear and extrusion deformations reduce the inner diameter of the casing up to 39 mm, which means the bridge plug cannot pass smoothly under these conditions.
As mentioned above, researchers have conducted thorough research on casing deformation during multi-stage fracturing. With engineering factors such as casing quality, borehole trajectory, cementing quality, fracturing parameters, and others, the parameters have an obvious impact on casing stress. However, these factors will not cause significant casing deformation. The on-site feedback results show that there is a close correlation between casing deformation and geological factors, such as fault slippage and lithological interfaces. As a demonstration, consider the Weiye 43 platform in the Lu203 well area in the Sichuan Basin, China. Figure 4 shows an analysis of the relationship between casing deformation and fault distribution.
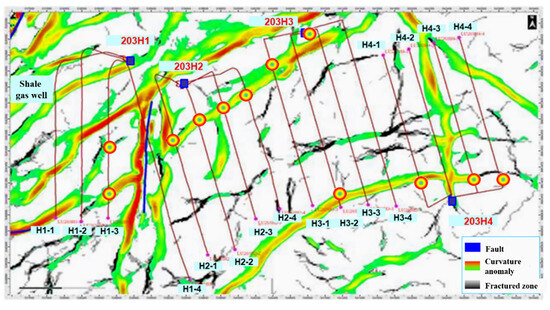
Figure 4.
Relation between fault distribution and casing deformation point of H1–H4 platform in Lu203 well area.
It can be seen from Figure 4 that the casing deformation is closely related to the faults. As a case in point, in the H1–H4 platform in the Lu203 well area, the proportion of casing deformation that overlaps with faults accounts for 100%.
2.2. The Mechanism of Fault Slippage in Casing Deformation
Multi-stage fracturing aims to break rock formations by using a fracturing fluid with high pressure, large displacement, and large liquid volume characteristics to form an artificial fracture network. During the formation of the artificial fracture network, the high-pressure fracturing fluid can enter the fault through the micro-annulus, artificial fracture, and shale bedding. From the perspective of rock mechanics, the high-pressure fracturing fluid entering the fault will lead to a decrease in the normal stress in the fault plane (Figure 5). The risk of fault instability will be increased by the high-pressure fracturing fluid from a fault stability perspective; at the same time, after the high-pressure fracturing fluid enters the fault, it can produce a floating and lubricating effect on the rocks on both sides of the fault plane due to its low viscosity. The relative dislocation of the fault plane under gravity is caused by the decrease in the friction coefficient of the stones on both sides of the fault plane.
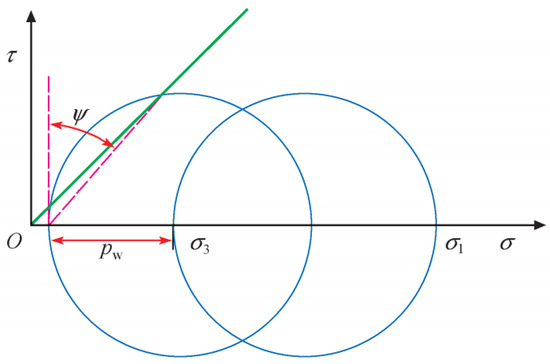
Figure 5.
Fault sliding conditions (where ψ is the angle between the fracture surface and the maximum primary stress; pw is the formation pore pressure; σ1 is the maximum in situ stress; and σ3 is the minimum in situ stress).
In shale oil and gas wells, the cement sheath is used to cement the casing and formation together. Once the formation on both sides of the fault plane is displaced, shear stress is produced on the casing and the cement sheath, which is essentially a brittle and low-strength material. Therefore, the casing will bear the shear stress generated by the relative dislocation of the formation. When the shear stress exceeds the shear strength of the casing, the casing material will yield, resulting in shear deformation, and the inner diameter will decrease geometrically.
The intrusion of fracturing fluid into the fault plane is the factor that causes fault slip in multi-stage fracturing, and the fault plane’s effective stress decreases, resulting in fault slippage. Therefore, this study establishes a model that considers the slip amount caused by the dynamic invasion of fracturing fluid into the fault during the multi-stage fracturing process, in accordance with the CZM (cohesive zone method). Furthermore, the dynamic evolution process of the fault slippage was analyzed, and the influence of the fault angle, fault length, and in situ stress difference on the slip amount of the fault was clarified.
3. Calculation Model of Fault Slippage
3.1. Geometric Model
This study establishes a two-dimensional numerical calculation model of fault slip induced by fracturing fluid invasion. The calculation model is mainly composed of two parts, one of which is the stratum and the other of which is the fault. Because the fault’s distribution in the formation has a certain dip angle and the geometric boundary conditions of the model cannot affect the fault slip, the geometric model must take into account the size effect. The formation’s size is 5–10 times larger than the fault’s size, as illustrated in Figure 6.
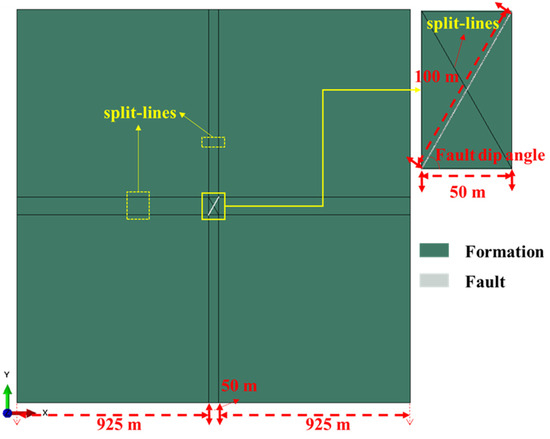
Figure 6.
Calculation model of fault slippage.
The calculation model for the fault slip amount is shown in Figure 6. As an example, the fault has a length of 100 m and an angle of 60° in the X-axis direction. The fault is located in the middle of the stratum model and forms a certain angle with the X-axis. Separation of the geometric model is necessary to divide the grid with the fault as the standard. At the same time, to prevent a size impact on the outer boundary of the formation, the outer boundary of the formation is set to be 20 times the size of the fault.
3.2. Geometrical, Mechanical, and Material Parameters
In this study, the fault slip calculation model is established considering fault dip angles of 30°, 45°, 60°, and 75° and fault lengths of 100 m, 200 m, and 300 m. Although the fault length changes, the size of the formation boundary remains constant at 20 times the fault length. Young’s modulus and Poisson’s ratio of the formation are set at 20 GPa and 0.2 in terms of material parameters, respectively. Since the model involves the percolation of fracturing fluid in the fault and the formation, the related parameters need to be set, and the permeability and porosity are 1 e−7 mD and 0.02, respectively.
In this study, the CZM (cohesive zone method) was used to simulate the fault activation. The CZM parameters in this study are shown in Table 1.

Table 1.
Mechanical properties of the cohesive interface.
3.3. Meshing Method and Boundary Conditions
The model utilizes the grid division method of variable density to gradually thin the grid density from the stratum boundary to the fault position, and the number of grid seeds is reduced from 50 to 2; thus, the purpose of grid division is to save calculation time. When simulating the fracture failure, the model’s convergence is facilitated by the use of uniform-density grid division near the fault, and the grid density is set at 0.3. The fluid–solid coupling unit, CPE4P, is used in the formation because the fracturing fluid will penetrate the formation when it enters the fault. The fault activation is replaced by a CZM unit that has the unit type COH2D3P.
The formation size is much larger than the fault size in the boundary condition setting, so it can be understood that the formation’s boundary will not be affected when the fault is activated. The formation pore pressure remains constant when it is far from the fault; by fixing the formation pore pressure and setting its value equal to the initial formation pore pressure, the formation pore pressure boundary can be limited.
3.4. Loading Conditions and Analysis Step
In the aspect of load setting, the initial ground stress is first applied to the formation, and the vertical ground stress is set in the direction perpendicular to the formation. The magnitude of the vertical ground stress is 70 MPa, and the maximum horizontal in situ stress is set in the horizontal direction. The magnitude of the horizontal maximum in situ stress is 55 MPa, and the initial formation pore pressure is then set to 52 MPa. The process of fault activation means that the fluid enters the fault, and this process is realized using fluid injection; that is, a liquid injection point is set in the middle of the fault, and the fluid is injected into the fault at a constant fluid velocity to simulate the process of fluid intrusion, with the fluid intrusion velocity set at 0.01 m3/s.
The in situ stress balance and fluid–solid coupling analysis steps are used in the step-setting analysis. The in situ stress balance analysis step is primarily utilized to simulate the initial stress state of the formation when the fracturing fluid has not yet entered the fault, and the fluid–solid coupling analysis step is used to simulate the dynamic process of fracturing fluid invading the fault. The analysis step time is set at 300 s, which ensures that the fault invades the entire fault plane and that the fracturing fluid affects the fault slip.
4. Results and Discussion
The model’s correctness is verified by comparing the numerical simulation results with the previous theoretical calculation results based on the above model. Furthermore, the dynamic process of fault slip is examined, and the factors that affect the amount of fault slip are clarified.
4.1. Model Validation
Liu Kui et al. analyzed the specific process of fault slip induced by fracturing fluid entering the fault in the multi-stage fracturing process from an analytical solution perspective [27]. Establishing an analytical model is mainly based on fracture mechanics and the fundamental equation of fault stress equilibrium, and the engineering background behind these calculation methods is identical to that of this paper.
To verify the accuracy of the calculation results in this paper, the relevant parameters of the established calculation model are adjusted, and the formation mechanical parameters and fault geometric parameters are set to correspond with Liu Kui et al. [27]. The comparison results are shown in Figure 7, including the calculation results of the numerical calculation model established in this paper, which are consistent with the analytical calculation results, thus proving the model’s reliability.
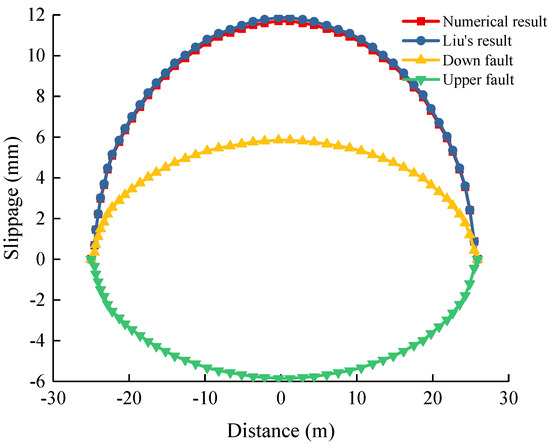
Figure 7.
Analysis of casing deformation results.
The lower part of the fault is defined as a positive displacement along the fault direction in the fault finite element grid, as shown in Figure 8. The upper part of the fault has the opposite displacement and performs the difference operation on the fault units with the same initial state nodes in the fault direction to determine the relative slippage of the rocks on both sides during the fault’s activation. The dip direction of the fault has a negative displacement of the upper rock, which means that the formation rock slides along the dip direction of the fault under gravity during the activation of the fault. The displacement of the lower rock along the dip direction of the fault is positive, and the lower rock of the fault tends to slip upward during the fault’s activation. It can be seen that the slip amount of the fault unit is relatively large near the middle of the fault, and the slip amount at the fault boundary is small, mainly because of the constraint of the surrounding rock on the stratum rock. Comparing the calculation results of this paper with the analysis results, it can be seen that the law for fault slips and the slip amount obtained in this study are similar. The calculation model’s accuracy is proven by the fact that the maximum error is less than 2%.
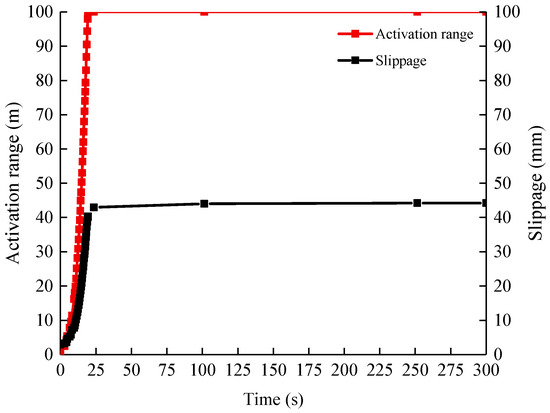
Figure 8.
Dynamic process of fault slippage.
4.2. Analysis of Results
The dynamic fault slip process caused by fracturing fluid invasion during multi-stage fracturing is further clarified in this section. The dynamic fault slip process is the slip amount of the fault under different fracturing fluid invasion ranges, as shown in Figure 9. The abscissa is the range of failure for the fault CZM unit, and the ordinate is the slip amount of the fault. The specific process of fault slippage in the multi-stage fracturing process can be divided into two stages. In the initial slip stage of the fault, it can be observed that the fault is not completely penetrated when the failure range and slip range of the fault are within 100 m and less than 40 mm, respectively. The fault slip increases slowly until it reaches a stable state when the fracturing fluid enters the fault further.
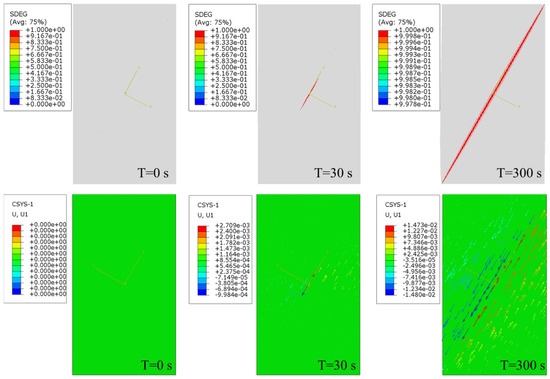
Figure 9.
Fault slippage at different stages.
Figure 9 shows that the fault slippage gradually increases when the fracturing fluid enters the fault. Even though the fracturing fluid penetrates the entire fault, it only increases the fault width and has little impact on fault slippage.
4.3. Analysis of Influence Factors on Fault Slippage
The statistical casing deformation results of shale oil and gas wells in the Sichuan Basin and the Junggar Basin in China show that casing deformation is entirely different when the same fracturing parameters are used in different fracturing sections, even in the same shale oil and gas well. For instance, the J1000X well in the Jimusaer block in China has the same area, cluster, and fracturing parameters for each section. However, casing deformation occurred twice during the fracturing process of this well, and the results were considerably different. The first casing deformation point was located at the 4250 m position, and the multi-arm caliper measurement results showed that the casing deformation was up to 11.2 mm. The second casing deformation point was located at the 4866 m position, but the casing deformation was only 3.8 mm. Fault slippage is the primary cause of casing deformation, and the amount of formation slip directly influences the amount of casing deformation; therefore, analyzing the primary and secondary controlling factors that affect fault slip from the perspective of the fault’s parameters is necessary. The numerical calculation model is used in this study to examine the influence of fault dip, fault length, and in situ stress difference on fault slip.
4.3.1. Fault Dip Angle
To ensure the fault length and in situ stress difference remain unchanged, the fault dip angle is set to change between 30° and 90° in this study. Different fault dip angles are analyzed to examine the dynamic law of fault slip. The results of the calculation are shown in Figure 10.
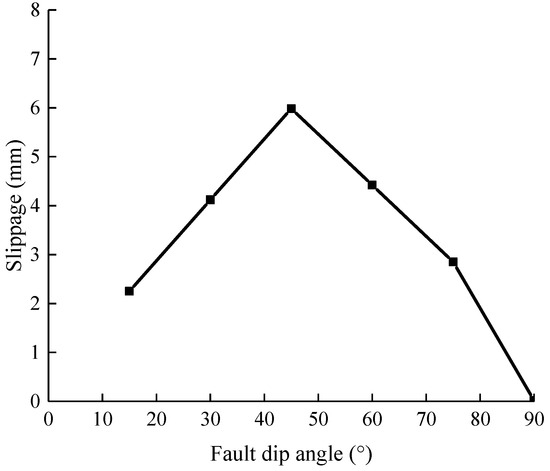
Figure 10.
Fault slip amount under different fault dip conditions.
Figure 10 shows that the slip amount of the fault increases first and then decreases with the increase in the dip angle of the fault; when the dip angle is 45°, the slip amount reaches its maximum. The reason for this is that the rocks on the upper and lower sides of the fault are most likely to have relative dislocation under gravity’s influence at a 45° angle, resulting in the maximum slip amount. When the dip angle of the fault increases further, for instance, at 90°, the vertical state of the rocks on both sides of the fault is present. The rocks on both sides of the fault sink synchronously under gravity after the fault is activated, and there is no slippage difference. When the dip angle is 90°, the slip amount of the fault is the smallest.
4.3.2. Fault Length
The length of the fault is another parameter related to fault slip in the two-dimensional calculation model. The statistical analysis results of the ant body attribute logging on the shale oil and gas well platform indicate that the size of the fault at the location of casing deformation in the Jimusaer and Sichuan Basins in China is generally between 50 m and 500 m. Therefore, it is necessary to quantify the impact of fault length on fault slip. Keeping the parameters of the basic model unchanged, the fault length is set to change between 50 m and 300 m in this study, and the slip amount of the fault is analyzed for different fault lengths. The results of the analysis are shown in Figure 11.
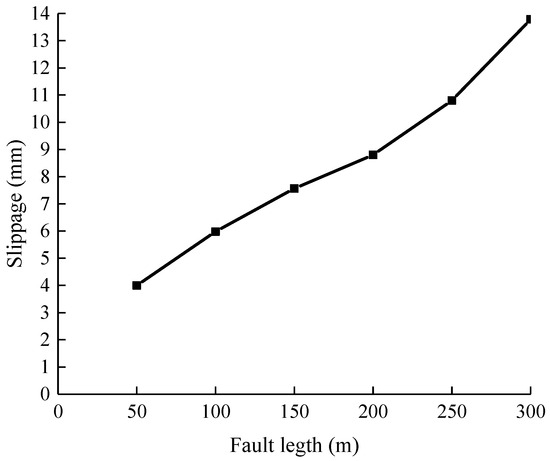
Figure 11.
Fault slip under different fault lengths.
Figure 11 indicates that the fault slip distance and fault length have a linear relationship. The slip amount is approximately 4 cm when the fault length is 50 m, and the fault’s slip can reach 14 cm when the fault size is 300 m. The main reason is that the longer the fault, the smaller the constraint of the rocks above and below the fault on the rocks in the middle of the fault, which causes the fault to slip more easily. The results of this study provide a model to prevent casing deformation and avoid faults as much as possible during drilling. With a focus on faults with significant lengths, the casing will not be sheared even if there is a fault slip.
4.3.3. In Situ Stress Difference
The slip amount of the fault is closely linked to its external stress state, in addition to its parameters. In this study, the stress in the vertical direction is set at 70 MPa, and the maximum horizontal stress varies between 67.5 MPa and 55 MPa. The calculation results for analyzing the slip amount of the fault under different stress differences are shown in Figure 12.
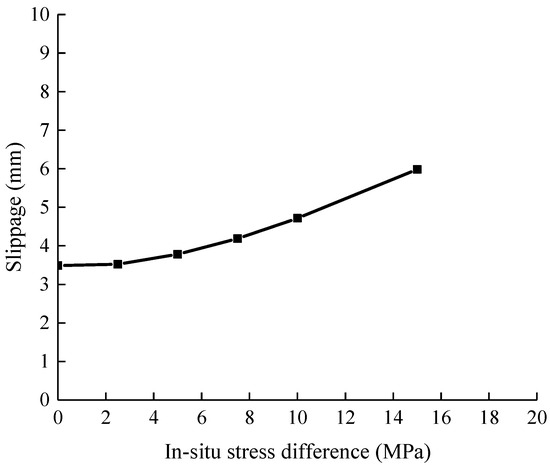
Figure 12.
Fault slip amount under different ground stress difference conditions.
Figure 12 shows that the ground stress difference significantly affects the fault slip, and the fault slip increases as the in situ stress difference increases. The main reason is that when the difference between the vertical stress and the horizontal stress becomes more extensive, the stress state of the fault changes more clearly from a strike–slip fault, and this stress state is more likely to lead to the relative dislocation between the fault planes.
5. Conclusions
- (1)
- The distribution of faults is linked to the casing deformation of shale oil and gas wells in the Sichuan Basin and the Junggar Basin in China, and the casing deformation is mainly shear deformation, characterized by “a dense heel and sparse toe” in space.
- (2)
- The numerical calculation model of the high-pressure fracturing fluid entering the fault that causes fault slippage was established, with the results showing that after the fracturing fluid enters the fault, the damaged fault relatively dislocates under the influence of gravity, thus leading to fault slippage.
- (3)
- The longer the fault length is, the greater the fault slippage, and the relationship between them is linear. The fault slippage increases first and then decreases with the increase in the fault dip, and the slippage reaches its maximum when the fault dip reaches 45°; the fault slippage increases gradually with the rise in the difference between the vertical and horizontal in situ stress.
Author Contributions
Conceptualization, software, writing—original draft preparation: Z.L. and J.L.; software: W.L.; writing—review and editing: N.W. All authors have read and agreed to the published version of the manuscript.
Funding
This research was funded by the National Natural Science Foundation of China, grant numbers 52204018, U22B6003, and U22A20164; the Innovative Environment Construction Plan (Innovative Talents) Project at Karamay, grant numbers 20212022hjcxrc0029 and 20212022hjcxrc0037; and the Research Foundation of China University of Petroleum-Beijing at Karamay, grant number XQZX20220006.
Data Availability Statement
Data are contained within the article.
Acknowledgments
This work was jointly supported by the Research Foundation of the China University of Petroleum-Beijing at Karamay and the Natural Science Foundation of the Xinjiang Uygur Autonomous Region.
Conflicts of Interest
Author Zongyu Lu was employed by the company Xinjiang Oil Field Company. The remaining authors declare that the research was conducted in the absence of any commercial or financial relationships that could be construed as a potential conflict of interest.
References
- Adams, N.J.; Mitchell, R.F.; Eustes, A.W.; Sampaio, J.H.B., Jr.; Antonio, A.O. A Causation Investigation for Observed Casing Failures Occurring during Fracturing Operations. In Proceedings of the SPE Hydraulic Fracturing Technology Conference and Exhibition, The Woodlands, TX, USA, 24–26 January 2017. [Google Scholar]
- Wu, X.; Han, L.; Yang, S.; Yin, F.; Teodoriu, C.; Wu, X. Numerical Study on Casing Integrity during Hydraulic Fracturing Shale Formation. In Proceedings of the SPE Oklahoma City Oil and Gas Symposium, Oklahoma City, OK, USA, 9–10 April 2019. [Google Scholar]
- Zhang, X.; Liu, J.; Cheng, W.; Jiang, W.; Jin, J.; Shen, L. New Type of Casing Deformation Rising in Weiyuan Changning Shale Gas Play. In Proceedings of the International Petroleum Technology Conference (IPTC 2022), Dhahran, Saudi Arabia, 21–23 February 2022. [Google Scholar]
- Yin, F.; Shi, B.; Huang, G.; Wu, X. Integrity assessment methodology of casing ovality deformation in shale gas wells. Geoenergy Sci. Eng. 2023, 224, 211643. [Google Scholar] [CrossRef]
- Li, H.T.; Li, Z.; Li, G.; Yu, H.; Jiang, Z.J.; He, L.; Guo, B.Y.; Dong, M.Z. Casing deformation mechanisms of horizontal wells in Weirong shale gas field during multistage hydraulic fracturing. J. Nat. Gas Sci. Eng. 2020, 84, 103646. [Google Scholar] [CrossRef]
- Dong, K.; Liu, N.; Chen, Z. Geomechanical analysis on casing deformation in Longmaxi shale formation. J. Pet. Sci. Eng. 2019, 177, 724–733. [Google Scholar] [CrossRef]
- Hu, G.; Deng, S.Y.; Wang, D. Effect of fault slip on the casing passability of horizontal shale oil and gas wells. SPE Drill. Complet. 2023, 38, 370–380. [Google Scholar] [CrossRef]
- Yang, S.Y.; Han, L.H.; Wang, J.J.; Wang, H.; Wu, X. Laboratory study on casing deformation during multistage horizontal well fracturing in shale gas development and strain based casing design. J. Nat. Gas Sci. Eng. 2021, 89, 103893. [Google Scholar] [CrossRef]
- Yu, H.; Lian, Z.H.; Lin, T.J. Finite element analysis of failure mechanism of casing during shale gas fracturing. China Pet. Mach. 2014, 42, 84–88. [Google Scholar]
- Lian, Z.H.; Yu, H.; Lin, T.J.; Guo, J.H. A study on casing deformation failure during multi-stage hydraulic fracturing for the stimulated reservoir volume of horizontal shale wells. J. Nat. Gas Sci. Eng. 2015, 23, 538–546. [Google Scholar] [CrossRef]
- Lin, T.J.; Yu, H.; Lian, Z.H.; Yi, Y.G.; Zhang, Q. Numerical simulation of the influence of stimulated reservoir volume on in-situ stress field. J. Nat. Gas Sci. Eng. 2016, 36, 1228–1238. [Google Scholar] [CrossRef]
- King, G.E.; Valencia, R.L. Well Integrity for Fracturing and Re-Fracturing: What Is Needed and Why? In Proceedings of the SPE Hydraulic Fracturing Technology Conference, The Woodlands, TX, USA, 6–8 February 2016; Society of Petroleum Engineers: Houston, TX, USA, 2016; p. 201614. [Google Scholar]
- Wang, Y.H.; Tian, Z.H.; Yang, X.M.; Yi, X.B.; Lu, H.B.; Duan, Y.Y. What We Have Learned on Shale Gas Fracturing During the Past Five Years in China; Society of Petroleum Engineers: Houston, TX, USA, 2016. [Google Scholar]
- Jiang, K.; Li, Q.; Chen, Y.L.; Guo, X.L.; Fu, Y.Q.; Li, J. Influence of cementing quality on casing failures in horizontal shale gas wells. Nat. Gas Ind. 2015, 35, 77–82. [Google Scholar]
- Qian, B.; Yin, C.B.; Li, Y.C.; Xu, B.; Qin, G. Diagnostics of Casing Deformation in Multi-Stage Hydraulic Fracturing Stimulation in Lower Silurian Marine Shale Play in Southwestern China. In Proceedings of the Unconventional Resources Technology Conference, San Antonio, TX, USA, 20–22 July 2015; Society of Exploration Geophysicists, American Association of Petroleum Geologists, Society of Petroleum Engineers: Houston, TX, USA, 2015; p. 201514. [Google Scholar]
- Ge, J.; Ghassemi, A. Analytical Modeling on 3D Stress Redistribution and Fault Reactivation during Hydraulic Fracturing Stimulation. In Proceedings of the 48th U.S. Rock Mechanics/Geomechanics Symposium, Minneapolis, MN, USA, 1–4 June 2014; American Rock Mechanics Association: Alexandria, VA, USA, 2014; p. 20147. [Google Scholar]
- Feng, Y.; Arlanoglu, C.; Podnos, E.; Becker, E.; Gray, K.E. Finite-Element Studies of Hoop-Stress Enhancement for Wellbore Strengthening. SPE Drill. Complet. 2015, 30, 38–51. [Google Scholar] [CrossRef]
- Chen, C.W.; Wang, P.F.; Xiang, D.G. Analysis of casing deformation in the Changning-Weiyuan block Based on focal mechanism. Pet. Drill. Tech. 2017, 45, 110–114. [Google Scholar]
- Chen, Z.W.; Xiang, D.G.; Zhang, F.S.; An, M.K.; Yin, Z.R.; Jiang, Z.Y. Fault slip and casing deformation caused by hydraulic fracturing in Changning-Weiyuan Blocks, Sichuan: Mechanism and prevention strategy. Pet. Sci. Bull. 2019, 4, 364–377. [Google Scholar]
- Tong, H.; Zhang, P.; Zhang, H.X.; Liu, Z.P.; Ren, X.H.; Xiao, K.Z.; Zhou, Y.B.; Deng, C. Geomechanical mechanisms and prevention countermeasures of casing deformation in shale gas horizontal wells. Nat. Gas. Ind. B 2021, 41, 189–197. [Google Scholar]
- Liu, K.; Chen, C.W.; Zeng, Y.J.; Cao, H.; Tao, Q.; Wang, Z.; Zhang, H. Casing Shearing Failure in Shale Gas Wells Due to Fault Slippage Caused by Hydraulic Fracturing-Case Study. In Proceedings of the Abu Dhabi International Petroleum Exhibition & Conference, Abu Dhabi, United Arab Emirates, 9–12 November 2020. [Google Scholar]
- Meng, L.D.; Fu, X.F.; Lv, Y.F.; Li, X.L.; Cheng, Y.B.; Li, T.W.; Jin, Y.J. Risking fault reactivation induced by gas injection into depleted reservoirs based on the heterogeneity of geomechanical properties of fault zones. Pet. Geosci. 2016, 23, 29–38. [Google Scholar] [CrossRef]
- Chen, Z.W.; Zhou, L.; Walsh, R.; Zoback, M. Case Study: Casing Deformation Caused by Hydraulic Fracturing Induced Fault Slip in the Sichuan Basin. In Proceedings of the Unconventional Resources Technology Conference (URTEC), American Association of Petroleum Geologists, Houston, TX, USA, 23–25 July 2018. [Google Scholar]
- Zhang, X.; Li, J.; Zhang, H.; Han, M.T.; Han, L.H. Analysis of casing deformation failure mechanism based on fault slip. Eng. Fail. Anal. 2021, 127, 105430. [Google Scholar] [CrossRef]
- Taghipour, M.; Ghafoori, M.; Lashkaripour, G.R.; Hafezi, M.N.; Molaghab, A. A Geomechanical Evaluation of Fault Reactivation Using Analytical Methods and Numerical Simulation. Rock Mech. Rock Eng. 2020, 54, 695–719. [Google Scholar] [CrossRef]
- Meng, H.; Ge, H.K.; Bai, J.; Wang, X.Q.; Zhang, J.L.; Shen, Y.H.; Zhang, Z.D. Variation of induced stress field during hydraulic fracture closure and its influence on subsequent fracture. Energy Rep. 2021, 7, 7785–7803. [Google Scholar] [CrossRef]
- Liu, K.; Taleghani, A.D.; Gao, D.L. Semianalytical model for fault slippage resulting from partial pressurization. SPE J. 2020, 25, 1489–1502. [Google Scholar] [CrossRef]
Disclaimer/Publisher’s Note: The statements, opinions and data contained in all publications are solely those of the individual author(s) and contributor(s) and not of MDPI and/or the editor(s). MDPI and/or the editor(s) disclaim responsibility for any injury to people or property resulting from any ideas, methods, instructions or products referred to in the content. |
© 2024 by the authors. Licensee MDPI, Basel, Switzerland. This article is an open access article distributed under the terms and conditions of the Creative Commons Attribution (CC BY) license (https://creativecommons.org/licenses/by/4.0/).