Article

Configuration Strategy and Performance Analysis of Combined Heat and Power System Integrated with Biomass Gasification, Solid Oxide Fuel Cell, and Steam Power System

1
School of Energy and Power Engineering, University of Shanghai for Science and Technology, Shanghai 200093, China
2
Shanghai Key Laboratory of Multiphase Flow and Heat Transfer in Power Engineering, Shanghai 200093, China
3
School of Optical-Electrical and Computer Engineering, University of Shanghai for Science and Technology, Shanghai 200093, China
*
Author to whom correspondence should be addressed.
Processes 2024, 12(3), 446; https://doi.org/10.3390/pr12030446
Submission received: 29 December 2023 / Revised: 16 February 2024 / Accepted: 21 February 2024 / Published: 22 February 2024
(This article belongs to the Section Environmental and Green Processes)

Abstract

:
Renewable energy integration is a crucial approach for achieving a low-carbon energy supply in industrial utility systems. However, the uncertainty of user demand often leads to a mismatch between the system’s real operating conditions and the optimal operating points, resulting in energy wastage and high emissions. This study presents a multi-source heat and power system that integrates biomass gasification, solar collecting, solid oxide fuel cell (SOFC), gas turbine, and steam power systems. A scheduling strategy that varies the heat-to-power ratio is proposed to accommodate changes in user requirements. A simulation model of this multi-source system is established and validated. The influence of three key parameters on system performance under different configurations is explored. Energy and economic evaluations are conducted for three different configurations, and the system’s energy production and adjustable range are determined. The analysis reveals that, under the optimal configuration, the system can achieve an energy efficiency of 64.51%, and it is economically feasible with the levelized cost of electricity (LCOE) of USD 0.16/kWh. The system is capable of producing an output power ranging from 11.52 to 355.53 MW by implementing different configuration strategies. The heat-to-power ratio can be adjusted from 0.91 to 28.09.

1. Introduction

Energy is essential for social and economic development. With the depletion of fossil resources and the increasing issue of environmental pollution, the search for developing an effective, affordable, and environmentally friendly energy system is crucial [1]. Combined heat and power (CHP) systems are increasingly being recognized as an energy-saving and sustainable technology [2]. CHP systems represent an efficient energy utilization approach that can meet various energy demands. With a growing emphasis on energy conservation and emissions reductions, CHP systems have significant potential for applications in industry and construction [3].
Renewable energy represents a sustainable and environmentally friendly alternative to fossil fuels, making it well suited as an energy source for cogeneration systems. Within the realm of renewable energy, biomass energy and solar energy are particularly appealing due to their renewability, environmental protection, and economic viability [4]. Biomass, as the fourth largest energy source globally, is carbon neutral and readily available in abundant reserves. China, being an agricultural and densely populated country, possesses ample forestry resources, agricultural waste, and residue that can be utilized for biomass energy production [5]. In the 14th Five-Year Plan for the Development of Renewable Energy [6], the Chinese government set a target of increasing renewable energy generation by over 50% by 2025. Furthermore, the plan emphasizes the orderly development of agricultural and forestry biomass power generation as a means to accelerate the transformation and upgrade of biomass power generation into cogeneration systems.
Among biomass utilization methods, biomass gasification has the advantages of reducing environmental pollution, improving energy utilization efficiency, and enhancing energy supply flexibility [7]. Solar-driven biomass gasification offer a promising solution to the challenges associated with traditional gasification systems, such as low efficiency and syngas pollution. By utilizing solar energy, it is possible to convert solar energy into chemical energy storage and thereby enhance the energy grade [8]. Moreover, to address potential limitations posed by weather fluctuations or nighttime conditions that may impact the stability of energy supplies, solar/autothermal hybrid gasification (SAHG) technology has been developed to ensure continuous energy assurance and enhance the reliability of the system [9]. Given the rapidly declining costs of renewable energy sources, such as that of solar energy [10], this pathway is also attracting increasing interest in terms of research and demonstrations. Wu et al. [11] proposed a solar-driven biomass gasification CHP system and included economic research to evaluate the feasibility of the system. Their results show that the payback period of the system is 3.94 years shorter than that of the traditional gasification system. He et al. [12] proposed a new green power plant scheme based on 100% renewable energy. Taking provincial regions of China as case studies, their assessment results show that the proposed scheme had technical and economic feasibility for practical applications.
In recent years, there has been increasing concern about the utilization of synthetic gas generated through biomass gasification. Various proposals have been presented over the last decade aimed at enhancing the performance of biomass gasification systems by integration with fuel cells [13]. Among these proposals, solid oxide fuel cells (SOFCs) have distinct characteristics due to their high efficiency, fuel flexibility, low emissions, silent operation, and suitability for distributed energy applications [14]. SOFCs are efficient energy conversion technologies that directly convert chemical energy into electricity, without being limited by the Carnot cycle. Shayan et al. [15] conducted a study on the economic performance of a biomass gasification–SOFC system under two different gasification agents: steam and air. Their results demonstrated that using steam as a gasification agent resulted in the best operating condition, leading to the payback period being shortened by 1 year. Wang et al. [16] evaluated the economics of a biomass gasification and solid oxide fuel cell CHP system, which demonstrated superior performance with lower emissions under various operating conditions. The system achieved an energy efficiency of 59% with a payback period of 10 years. The current operating temperature of SOFCs ranges from 600 to 1000 °C [17], which aligns with the operating temperature of gasifiers. The exhaust gas of SOFCs contains a large amount of waste heat that can be effectively utilized by other subsystems to form an efficient cogeneration system. Consequently, researchers have begun to explore further applications of SOFCs. Kumar et al. [18] designed a cogeneration system integrating SOFCs, a gas turbine, absorption refrigeration, and the organic Rankine cycle and presented a thermoeconomic analysis. Their results show that the system achieves a waste gas recycling efficiency of 68.79%, and the cost of electricity per unit power output is 1939.93 USD/kW. Fu et al. [19] designed a fuel cell multigeneration system based on biomass gasification and comprehensively evaluated different system configurations in terms of energetic, economic, and environmental aspects. They concluded that the integration of biomass gasification, a fuel cell, and a gas turbine achieves the best comprehensive performance. The above studies confirm the feasibility and promise of coupling SOFCs with biomass gasification, as well as their integration with other forms of power generation in terms of economic and other aspects.
In practical applications, energy demands are often variable. To ensure the applicability of a multi-source energy system, system configuration strategies and optimization techniques play a crucial role. Table 1 provides an overview of studies conducted under the conditions of uncertain energy demand in terms of the energy source, system configurations, operational strategies, number of structures, and heat-to-power ratios used.
Some of these studies consider optimization-based strategies for the operation of polygeneration systems. In an optimization-based strategy, the scheduling of each component is carried out according to the solution of the objective function [20]. Pan et al. [21] proposed a two-stage planning and design method for a multi-energy cogeneration system. In the first stage, the optimal equipment capacity is obtained based on cost minimization. The second stage updates the energy load according to the demand response. Liu et al. [22] examined a system’s economic planning considering energy storage and demand response with mixed-integer linear programming (MILP) as the optimization method for two different system structures. Alabi et al. [23] proposed a mathematical model of MILP optimization allocation considering the economy to allocate energy for multi-energy systems and improve the efficiency of the integrated energy infrastructure as a whole. Yang et al. [24] proposed a two-layer optimization model considering the demand response and optimized the integrated energy system configuration based on the NSGA-II method. The first layer solves the optimal configuration according to the minimum investment, and the second layer finds the optimal schedule considering minimum carbon emissions. Liu et al. [25] proposed an optimization method based on NSGA-II for the design of high-performance integrated energy systems. This method allows for a flexible energy supply by adjusting the output ratio of energy conversion equipment.
Table 1. Main attributes of related studies concerning the configuration strategy of energy system.
StudyInput EnergySystem ConfigurationStrategyNo. of StructuresVariable Heat-To-Power Ratio
Pan et al. (2019) [21]Natural gas–solar energy–gridGas turbine–photovoltaics–gas boiler–battery–absorption chillerOptimization-based1Yes
Liu et al. (2020) [22]Solar energy–natural gasPhotovoltaics–SOFC–gas turbine–gas boilerOptimization-based2Yes
Alabi et al. (2020) [23]Solar energy–wind–gridPhotovoltaics–wind turbine–PEMFCOptimization-based1Yes
Yang et al. (2021) [24]Wind–natural gas–gridWind turbine–gas turbine–absorption chillerOptimization-based1Yes
Liu et al. (2023) [25]Solar energy–wind–natural gas–gridPhotovoltaics–wind turbine–gas turbineOptimization-based1Yes
Mei et al. (2021) [26]Natural gasSOFC–thermoelectric generator–absorption heat pompDispatching components4Yes
Fu et al. (2024) [19]BiomassBiomass gasification–SOFC–gas turbine–absorption refrigerating–organic Rankine cycleDispatching components7Yes
Li et al. (2023) [8]Biomass–solar energy–gridSolar driven biomass gasification–gas turbine1No
This studyBiomass–solar energy–gridSolar driven biomass gasification–SOFC–gas turbine–steam power systemDispatching components3Yes
To meet different energy needs, researchers also explored various configuration strategies that involve altering the piping and component locations within a system. Mei et al. [26] proposed a novel system configuration strategy that involves repositioning waste heat recovery components. By implementing this strategy, the heat-to-power ratio of the cogeneration system can be adjusted. Additionally, the study investigated the influence of water resource utilization modes on the system. Fu et al. [19] developed seven alternative system configurations based on different waste heat utilization methods. They also introduced exergy cost and carbon footprint models to analyze the sensitivity of the system’s operation time, carbon footprint, and interest rate to exergy costs and carbon emissions.
Based on the survey in Table 1, it can be inferred that the majority of studies have focused on analyzing a single system configuration without comparing different potential configurations. Moreover, the dynamic nature of the energy demand suggests that the heat-to-power ratio is subjective to variation. From a practical application standpoint, having a system capable of adjusting the heat-to-power ratios within a certain range would enhance the applicability of polygeneration systems.
In our previous work [8], we proposed regional energy supply systems for biomass and solar cogeneration and performed energy, exergy, economic, and emissions (4E) analyses. However, one limitation of the system was its lack of flexibility to meet varying demands. To address this issue, this study introduces a new CHP system that includes a solar-driven biomass gasification system (SBG), a solid oxide fuel cell–gas turbine system (SOFC-GT), a steam power system (SPS), and throttle valves to improve the cascade utilization of biomass energy. This paper fills the gap between previous studies in the field of renewable polygeneration and utility steam power systems (SPSs), and its main contributions and innovations are as follows:
(1)
A CHP system integrating solar-driven biomass gasification, SOFC-GT, and SPS is proposed based on the cascade utilization principle of renewable energy, efficiently promoting the utilization of renewable energy.
(2)
To enhance the flexibility of the system, a configuration strategy is proposed that allows us to adjust the system’s output by manipulating the valve opening. This approach enables precise control over the system’s operation and allows for dynamic adjustments based on the changing energy demand, thereby optimizing the system performance and ensuring efficient energy utilization.
(3)
The system simulation model is established using Aspen Plus V11, a chemical process simulation software. In this simulation model, a variable efficiency model is employed for the turbine. Unlike the constant efficiency model [27,28], the influence of load variation on equipment efficiency is considered.
(4)
The impact of the gasification temperature, steam-to-biomass ratio, and fuel cell temperature on the performance of the system is examined. Energy and economic evaluations under different configurations are performed for systems with different configurations, then the systems’ energy production and adjustable range are given.
The sections of this paper are structured as follows: Section 2 provides a detailed description of the proposed CHP system and outlines various configuration strategies. In Section 3, the system model is established, and the evaluation index for the energy and economic analysis is defined. Section 4 focuses on the verification of the model and discusses the influence of three key parameters on the system as well as the adjustable range of energy output. Finally, Section 5 summarizes the main conclusions and limitations of this study.

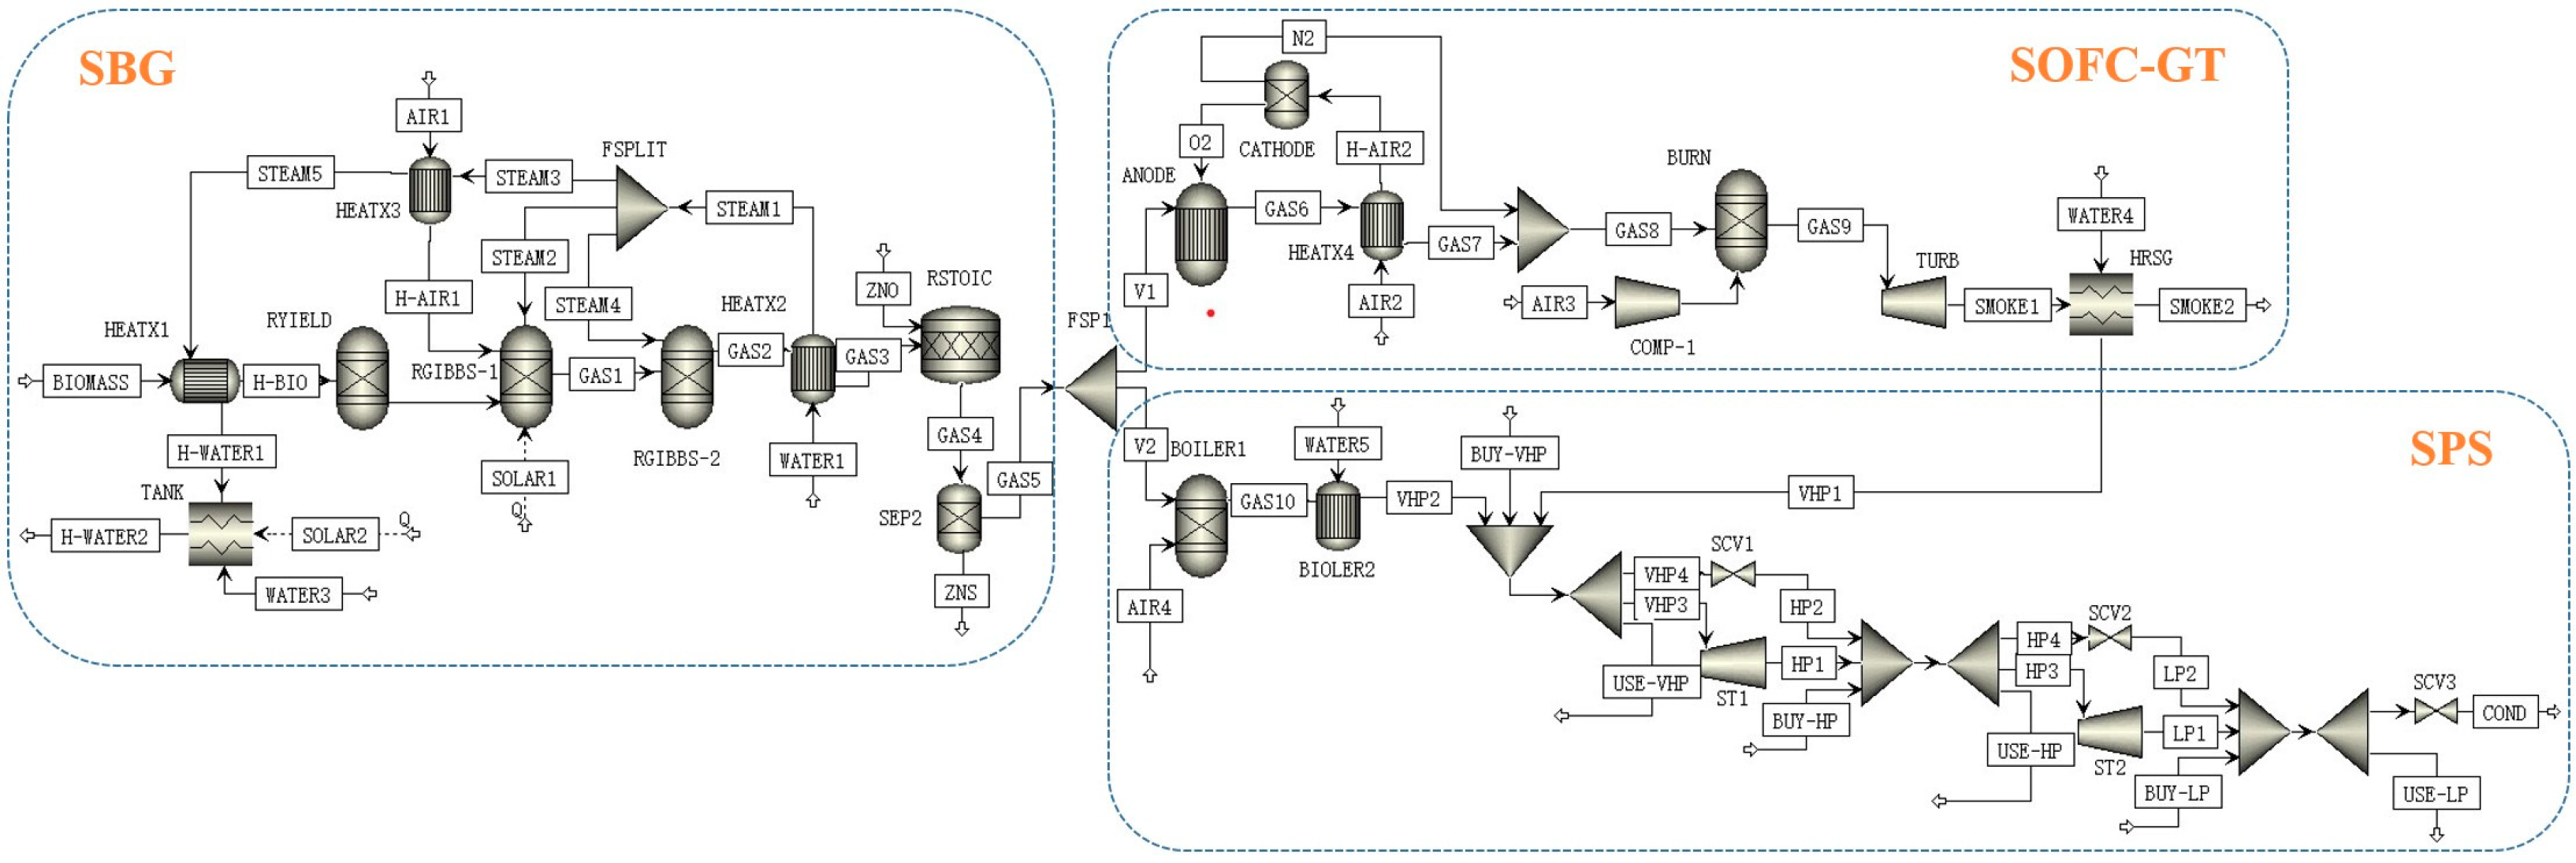
2. System Description

The energy supply system proposed in this paper primarily consists of a solar-driven biomass gasification system (SBG), solid oxide fuel cell–gas turbine system (SOFC-GT), steam power system (SPS), and throttle valves. Figure 1 illustrates the flowchart of the SBG-SOFC-GT-SPS system. The proposed energy system relies on renewable energy sources (biomass and solar) to fulfill the requirements of the utility system. Each subsystem will be described in detail below.

2.1. Solar-Driven Biomass Gasification (SBG)

The SBG system consists of two subsystems: biomass gasification and solar heat collection. The solar heat collection system comprises a solar collector and thermal tanks, which provide heat for both the biomass gasification process and domestic hot water. The biomass gasification system includes an SAHG gasification reactor, a liquid split, and a syngas cleaning system. The intermittency of solar energy is addressed by utilizing the SAHG gasification reactor. When sunlight is available, gasification is driven by solar energy; otherwise, it is driven by biomass spontaneous combustion [9].
The high-temperature syngas produced during gasification passes through a heat exchanger to convert thermal energy into steam. Then the liquid split separates the vapor into three streams. One stream is sent back to the gasifier as a gasifying agent, while another preheats the air-gasifying agent and biomass. The remaining stream is used for syngas humidification to prevent carbon deposition in downstream equipment [29]. The gasifying agent uses a mixture of air and steam, which increases the H2 content and calorific value of the syngas while reducing tar production [30,31].
The cooled syngas enters the cleaning system to remove possible particles, fly ash, and sulfur compounds. The specific steps of the syngas cleaning system are illustrated in Figure 2. Firstly, a high-temperature reaction is simulated in the gasifier using dolomite to reduce tar. Fly ash and coarse particles are then removed through a cyclone separator. The syngas is subsequently cooled through heat exchange to a temperature suitable for further cleaning (~500 °C). Sintered metal filters are employed to remove fine particles and solid by-products. Finally, a zinc oxide bed is used to eliminate H2S, resulting in clean gas. The clean syngas is divided into two streams: one enters the SOFC controlled by valve V−1, and the other enters the SPS controlled by valve V−2.

2.2. Solid Oxide Fuel Cell and Gas Turbine (SOFC-GT)

The syngas is used as fuel and enters the SOFC anode through V−1, where it undergoes an internal reforming reaction to produce hydrogen-rich products and CO. Air is introduced at the cathode, and oxygen ions are transferred from the cathode to the anode, where they mix with H2 to convert the chemical energy of the syngas into electrical energy via an electrochemical process. This electrochemical reaction is exothermic, and some of the heat generated is utilized to meet the thermal demand of the reforming reaction, while the remaining heat is used to warm the residual reactants and products.
After the electrochemical reaction, the remaining air and products are sent to the combustion chamber and blended with compressed air for combustion. The generated gas is then directed to the turbine for expansion to generate electricity. When the gas pressure reaches atmospheric pressure, it exits the steam turbine and enters the heat recovery steam generator (HRSG), which provides heat load for the utility system.

2.3. Steam Power System (SPS)

The SPS system has three steam pressure classes: low pressure (LP), high pressure (HP), and very high pressure (VHP). Every grade of steam is extracted and utilized for heating utility systems. Syngas, the main fuel for the SPS, enters the gas boiler (GB) via V−2 to generate VHP steam. Steam turbines (STs) are installed at each steam header in the SPS system to provide mechanical work. The transfer of the steam mass flow between different pressure levels is regulated by the temperature and pressure reducers. Additionally, Mp stands for purchased steam, which is utilized to supplement steam requirements at different pressures.

2.4. Throttle Valve

The ratio of the syngas flow to the SOFC-GT system and the SPS system can be easily adjusted by varying the opening of the throttle valves (V−1 and V−2). This enables the system to switch between different energy output modes based on the user’s requirements. The mass flow of the syngas to the two subsystems is regulated by throttle valves V−1 and V−2, respectively. As shown in Table 2, the system can be categorized into three configuration strategies by adjusting the valve opening ratio. The three scenarios are as follows: valve V−1 is entirely closed (Config−1), V−1 is fully open (Config−3), and V−1 and V−2 are open at the same time (Config−2).

3. Modeling and Evaluation Criteria

3.1. Model Assumptions

The following basic assumptions are considered when modeling the SBG-SOFC-GT-SPS system in order to simplify the model:
  • Biomass gasification is assumed to be complete.
  • Both the gasification reaction and the reforming reaction in the SOFC are assumed to be steady-state processes.
  • H, O, N, and S in biomass are converted into gaseous products.
  • CO is transformed to H2 by the reforming reaction, without taking into account the electrochemical reaction of CO.
  • The mass fraction of N2 and O2 in the air is assumed to be 79% and 21%, respectively.
  • All gases are assumed to be ideal.
  • All steam is assumed to be saturated steam.

3.2. System Modeling

The conventional gasification system, which is driven by biomass spontaneous combustion, has been the subject of extensive studies [32,33]. Therefore, this paper primarily focuses on the system’s operating state when sunlight is available, specifically the solar-driven gasification mode. The average annual sunshine duration is set to 2500 h (an annual total running time of 8760 h). The proposed system is modeled using the process simulation software Aspen Plus, which is widely used in various industrial fields, such as chemicals, coal, and medicine, to analyze and calculate the mass–energy balance and chemical balance [34]. Figure 3 illustrates the simulation flow chat of the SBG-SOFC-GT-SPS system. The main design parameters of the system are shown in Table 3.

3.2.1. SBG Modeling

Cotton, which is a prevalent crop in China, is selected as the raw material. The proximate and ultimate analyses of cotton can be found in Supplementary Materials [41]. In previous research [8], an Aspen Plus model of the SBG system was developed and validated using published experimental data. The SBG model employed in this work is consistent with that model, and the specific details are not elaborated here.

3.2.2. Syngas Cleaning Modeling

The RGIBBS−2 module is utilized in the syngas cleaning system to simulate the reaction of dolomite removing tar from the gasifier. To prevent carbon deposition in downstream equipment, the syngas ‘GAS1’ is humidified with the stream ‘STREAM4’. The mass flow rate of STREAM4 is regulated by the distribution fraction of FSPLIT, which is implemented through the ‘Design Specs’ function in Aspen Plus. The distribution fraction is dependent on the steam-to-carbon ratio, which is the molar ratio of steam to CO in the fuel [42]. It is recommended to maintain the steam-to-carbon ratio at approximately 2.5 (with the ‘tolerance’ set to 0.1), as this is the optimal ratio for preventing carbon deposition [29].
Since the model does not consider particulate or solid by-products, the two steps of the cyclone separator and metal sintered filter are excluded from the modeling. The humidified syngas GAS3 is then passed through the RSTOIC module to simulate the removal of H2S using ZnO. The alterations in the composition of the syngas after passing through the cleaning system are presented in Table 4. It can be seen that the H2S content is ultimately reduced to 0.3 ppm.

3.2.3. SOFC-GT Modeling
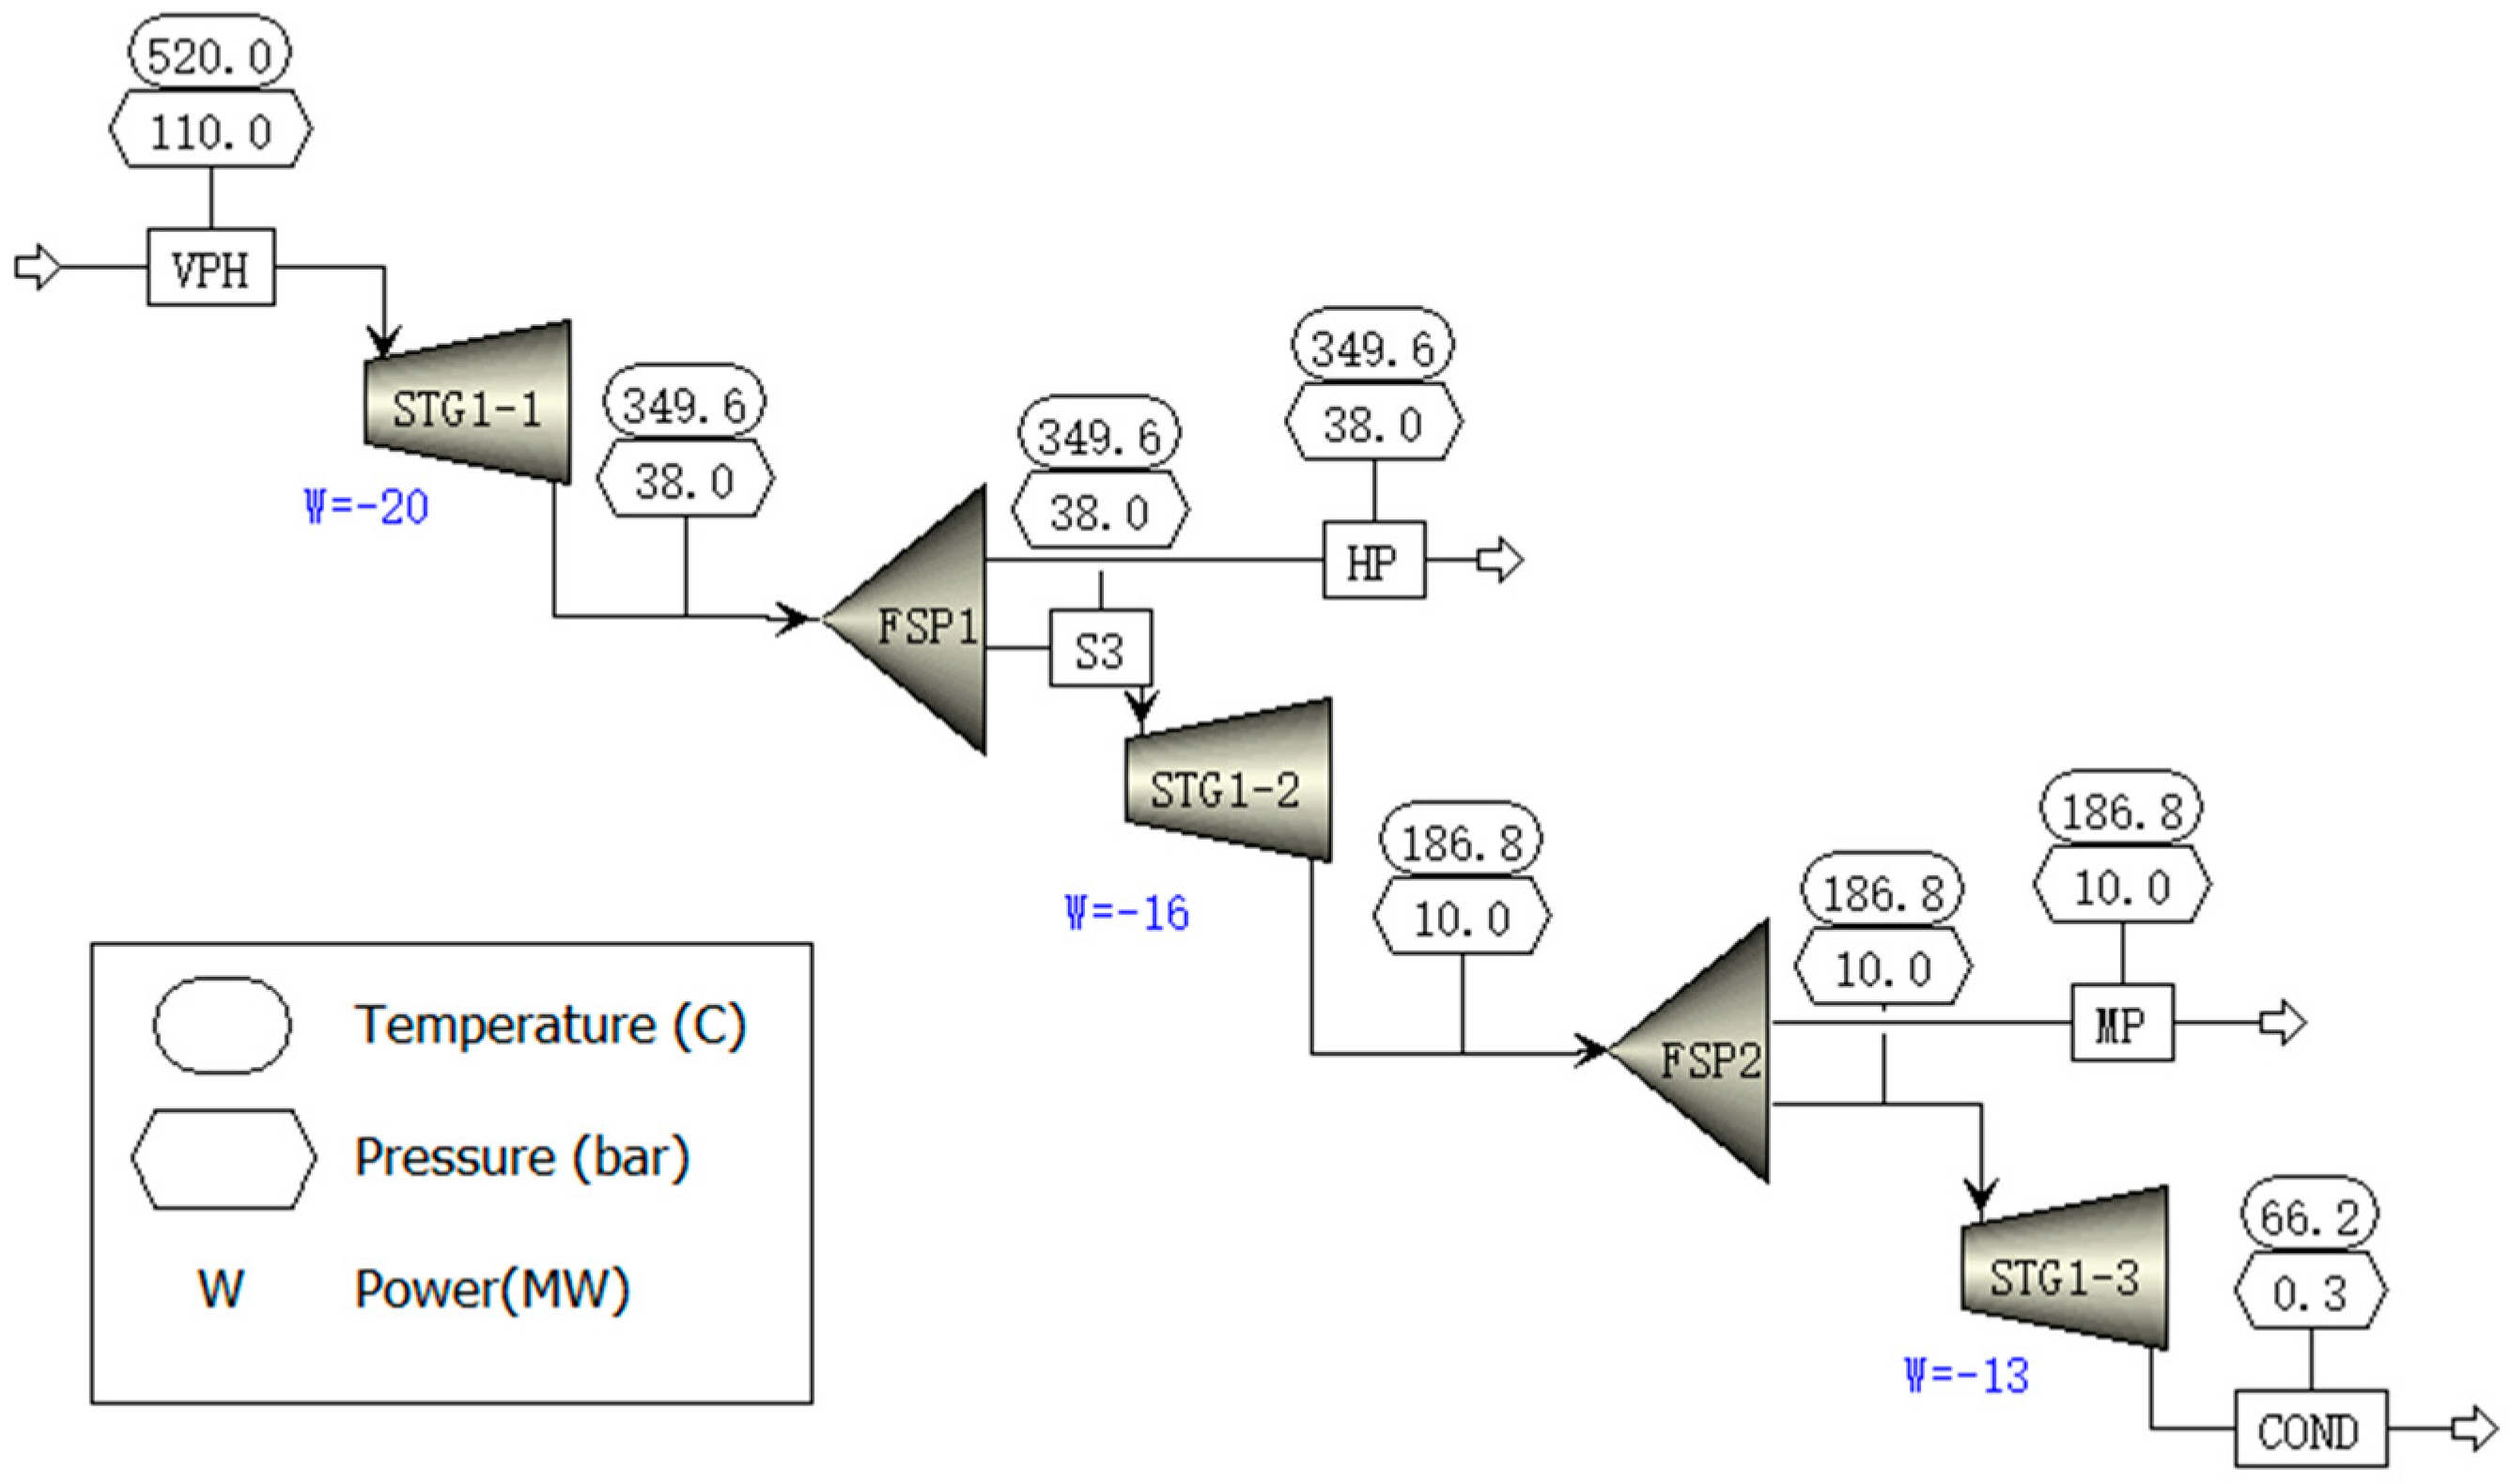
The modeling of the SOFC in Aspen Plus is a simplified representation based on the model developed by Doherty et al. [43]. By utilizing chemical software modeling, it eliminates the need for an in-depth analysis of the fuel cell’s physical structure. The anodes and cathodes of the SOFC are simulated using the REquil balancing reactor and Sep component separator, respectively. The reforming reaction equation in the anode can be found in Supplementary Materials. The air at the cathode inlet is preheated using the high-temperature gas at the SOFC output, which is simulated by HEATX4. The separation of oxygen ions in the cathode is simulated using the Seq module. The air molar flow entering the cathode n a i r , c a t h o d e is related to the hydrogen equivalent of the anode fuel n H 2 , e q , the fuel utilization efficiency u f , and the air utilization factor u a , which can be calculated as follows:
n a i r , c a t h o d e = 0.5 u f · n H 2 , e q 0.21 · u a
n H 2 , e q = n H 2 + n C O + 4 n C H 4
where, n H 2 , n C O , and n C H 4 represent the molar flow rates of H2, CO, and CH4 in the syngas, respectively.
The system performance is calculated by connecting and calling the Aspen interface using Matlab commands. The relevant parameters are then determined using the following methods. The SOFC model uses experimental data to predict the voltage based on the performance curve. The formula used to calculate the SOFC voltage (VSOFC) is as follows:
V S O F C = V N V l o s s
where V N is the Nernst voltage and V l o s s is the voltage loss. The empirical formula of V N is shown in Equation (4) [35]:
V N = 1.25 2.4516 × 10 4 T a v g + R T a v g 2 F ln p H 2 p O 2 p H 2 O
where T a v g (K) and p i (bar) are the average temperature and partial pressures, respectively, which are the average values of the inlet and outlet gas flows in and out of the anode and cathode. R is the molar gas constant with a value of 8.3145 J/(mol∙K). F is Faraday’s constant, 96,485 C/mol.
The voltage loss V l o s s includes activation loss V a c t , ohmic loss V o h m , and concentration loss V c o n . The detailed voltage loss equations can be seen in Supplementary Materials [44,45].
The current density i is calculated using the following formula:
i = I A · N = 2 F · u f · n H 2 , e q A · N
where A denotes the surface area of a single SOFC cell, m2; and N indicates the number of SOFCs.
The power generation of SOFCs is as follows:
W S O F C = 2 F · u f · n H 2 , e q · V S O F C · η D C / A C
where η D C / A C indicates the conversion efficiency of the SOFC inverter.

3.2.4. SPS Modeling

In the SPS model, the RGibbs module (BOOLER1) and the HEATX module (BOOLER2) are used to simulate the gas boiler. The VALVE module (SCV) simulates a temperature and pressure reducer, and the COMPR module (ST) simulates steam turbines. The input and performance parameters of the system are set to constants by default since Aspen Plus uses a fixed efficiency module. However, in reality, the equipment’s specifications often change due to variable operation conditions. Turbine efficiency is one of the most important factors. It directly influences the accuracy of system simulation and can significantly change depending on factors such as the operating load, design load, ambient temperature, inlet flow rate, and equipment temperature [46]. To enhance the simulation accuracy of the system effectively, the SPS model takes into account the impact of different operating conditions on the isoentropic efficiency and designs a variable efficiency prediction model to replace the constant efficiency model. Sun et al. [47] proposed a turbine efficiency model based on the Willans line. After testing 104 steam turbines ranging from 8 to 60 MW, the average error of power prediction is 2.68%, and the expression of turbine efficiency is as follows:
η t u r b = 1 a 1 b m i n · H i n
a = 1.19 2.96 × 10 4 P i n + 4.65 × 10 3 P o u t
b = 449.98 + 5.67 P i n 11.51 P o u t
where m i n and H i n are the mass flow and enthalpy of the input stream, respectively; and P i n and P o u t are the inlet and outlet pressures of the turbine, respectively.

3.3. Energy Performance

The energy analysis of the suggested SBG-SOFC-GT-SPS system is performed using the first law of thermodynamics. The thermodynamic performance of the system, including the system energy conversion efficiency η e n and heat-to-power ratio λ h p , is calculated as follows. The system’s energy conversion efficiency is defined as the ratio of the total energy output to the total energy input, which can be stated as follows:
η e n = W S O F C + W G T + W S T + Q h e a t Q s t e a m , b u y Q s o l a r + m b L H V b
where W S O F C and W G T are the output power of the SOFC and GT, respectively. W S T represents the output mechanical work of the steam turbine; Q h e a t indicates the heat energy output by the system, including steam and domestic hot water; Q s t e a m , b u y is the heat of the purchased steam; Q s o l a r is the solar energy input by the system; m b is the mass flow of biomass import, kg/s; and L H V b is the low calorific value of biomass, MJ/kg, which can be calculated according to the results of the proximate analysis and ultimate analysis of biomass [48]:
L H V b = 0.35 w C 20.8 w H 0.1 w O 0.016 w N + 0.1 w S 0.02 w A
where w i is the mass fraction of carbon, hydrogen, oxygen, nitrogen, sulfur, and ash.
The heat-to-power ratio is an important index to evaluate the matching degree of supply and demand and the system flexibility of a polygeneration system [49]. The expression is as follows:
λ h p = Q h e a t W S O F C + W G T + W S T

3.4. Economic Performance

The viability of the SBG-SOFC-GT-SPS system can be evaluated in terms of the net present value (NPV) and levelized cost of electricity (LCOE). For the economic assessment, the total cost is calculated by adding the total direct cost and the total indirect cost of the system. Direct costs include equipment purchase costs and installation costs. The installation includes steel structures, painting, and piping. Indirect costs include engineering/consulting and construction costs. The formula for calculating the C t o t a l project capital expenditure is as follows:
C t o t a l = C e q + C i n s t a l l + C i n d i r e c t
where C e q is the cost of each piece of equipment, and the specific calculation formula is in Supplementary Materials [35,50,51,52,53]. The chemical economic plant cost index (CEPCI) is utilized to adjust the calculation of the equipment costs and convert them to 2022 values. The conversion equation is expressed as Equation (14). C i n s t a l l and C i n d i r e c t are device installation costs and indirect costs, respectively. Table 5 summarizes the related calculation parameters.
C e q , i = C r e f C E P C I C E P C I 0
In addition, the net cash flow (NCF) of the system is determined by adding up all revenues and subtracting the sum of all annual costs. Annual costs include fuel costs, taxes, labor costs, operation and maintenance costs, and environmental emissions costs. The NCF reflects the operating capacity of the system and is calculated as follows:
N C F = P e + P w + P s + P D H W C V C C F C C C O 2
C C O 2 = m C O 2 c C O 2
where P i represents the income generated from the system’s output of electricity, mechanical work, steam, and hot water; and C V C and C F C represent the variable cost and fixed cost, respectively. C C O 2 is the penalty cost of CO2, calculated based on the amount of CO2  m C O 2 emitted into the atmosphere and the CO2 unit penalty factor c C O 2 . Table 5 provides additional details regarding the parameters required for the aforementioned economic calculations.
The net present value (NPV) of a system represents its profitability over its life cycle. The economic viability of the system is considered favorable when the NPV is positive. The calculation formula for the NPV is as follows [15]:
N P V = 1 n N C F n 1 + i n C t o t a l
where i and n represent the interest rate and the life of system, respectively.
The LCOE is defined as the ratio of the overall costs evaluated during the entire project period to the total amount of electricity and heat generated in the same period [59]. The formula for the LCOE can be written as follows:
L C O E = C t o t a l + 1 n C V C + C F C + C C O 2 1 + i n 1 n ( W S O F C + W G T + W S T + Q h e a t Q s t e a m , b u y )

4. Results and Discussion

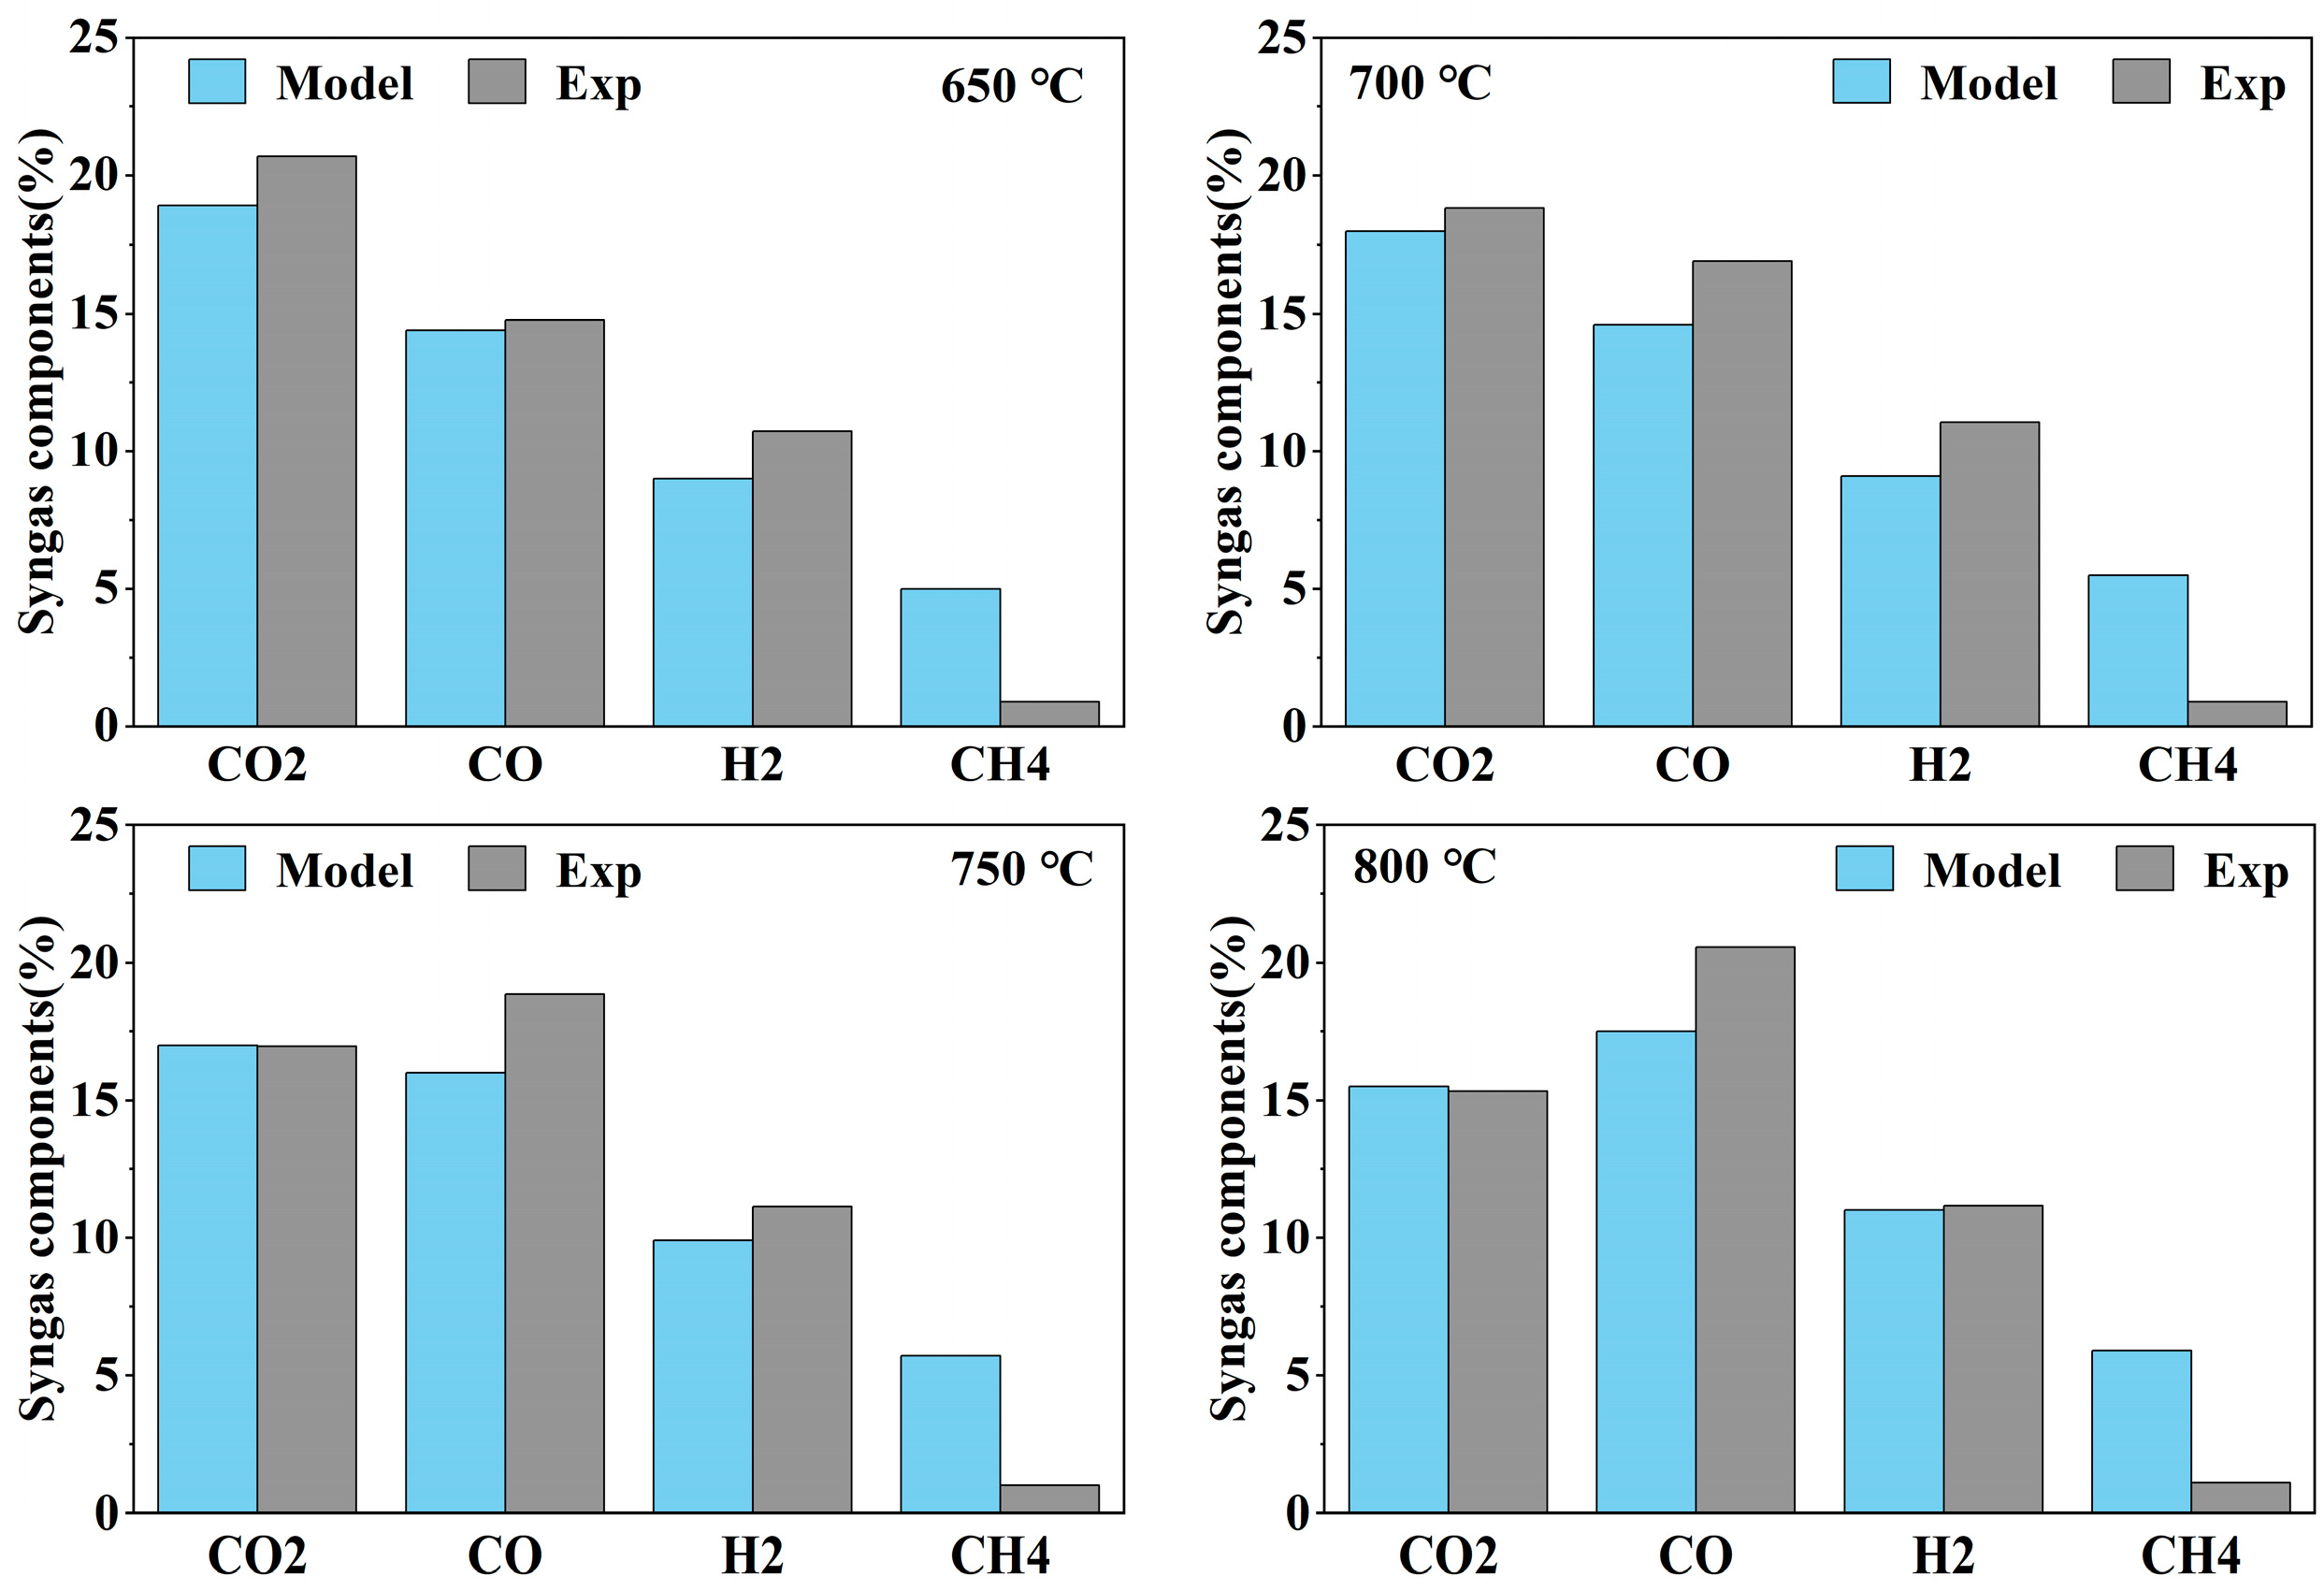
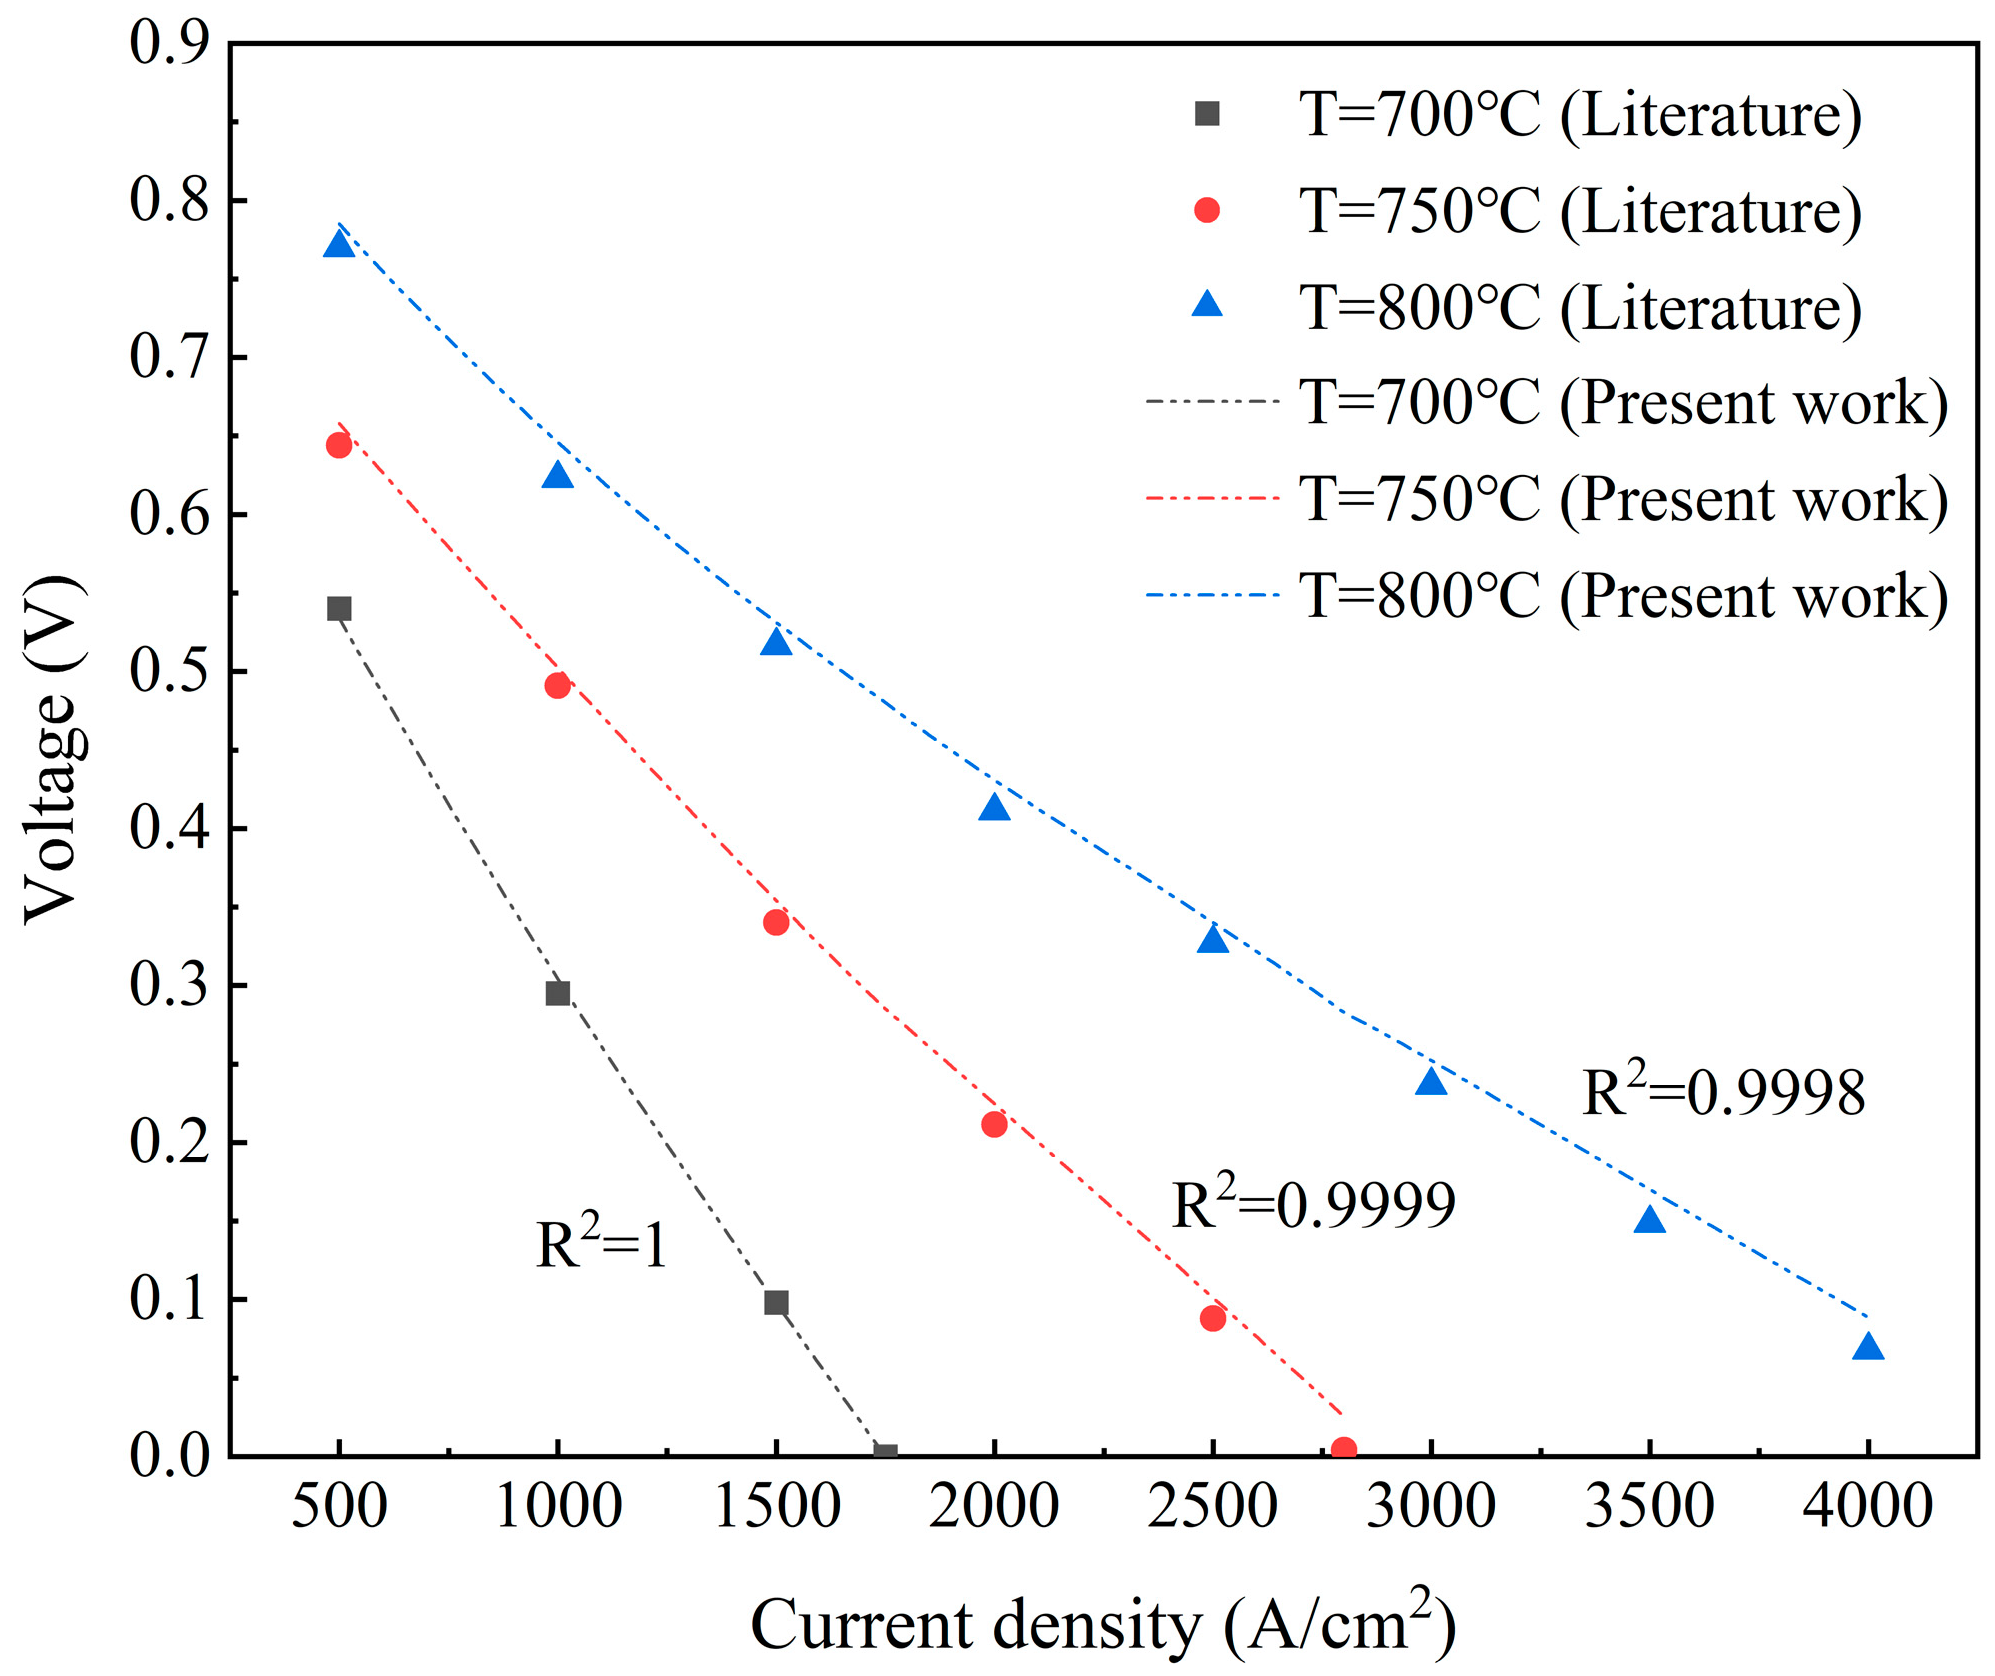
4.1. Model Validation

The verification of the proposed system is carried out in three main parts: the biomass gasification subsystem, SOFC subsystem, and SPS subsystem.
(1) To validate the gasification model, it is compared with the experimental data of Lan [60] at 650–800 °C, and the results are shown in Figure 4. The root mean square error (RMSE) is used to quantify the difference in the gas proportion between the simulated and experimental results. It is expressed as follows:
RMSE = ( Z i e Z i p ) 2 N
where N is the number of experimental points, which is four in this experiment; and Z i e and Z i p stand for the experimental and simulation compositions’ content of synthesis gas, respectively.
The average RMSE value of CO2, CO, H2, and CH4 from 650 to 800 °C is 2.34, which is deemed acceptable considering that the simulation model does not account for gasification-related factors, such as system kinetics and fluid dynamics. In addition, the significant deviation in the percentage of CH4 is due to the short residence time, which prevents the gasifier from reaching thermodynamic equilibrium in the actual reaction. Therefore, the error analysis demonstrates the reliability of this model.
(2) The SOFC model is verified by the published experimental data in the Fuel Cell Handbook [61]. The model’s input and results are shown in Table 6. It can be seen that the gas composition of the anode outlet aligns well with the literature data, with an average error of 3.4%. The exhaust temperature and voltage also exhibit close agreement. However, it should be noted that the input fuel composition and SOFC operating temperature can influence performance, necessitating further model verification.
An electrochemical model that included the mass and energy balance, temperature, voltage, current density, and other relevant fuel cell variables was developed by Aguiar et al. [62]. We adopt identical conditions as Aguiar, utilizing fully reformed CH4 (S/C = 2) as the input fuel. A comparison between the simulation model and the working results of Aguiar within the temperatures range of 700 °C to 800 °C is illustrated in Figure 5. R2 (coefficient of determination) is used to evaluate the correlation degree of the two data series, and the closer R2 is to 1, the higher the consistency between the simulation and experiment. It can be seen that the simulation results are basically consistent with the literature results, and the R2 ranges from 0.9998 to 1. These results affirm the suitability of the model for estimating SOFC power.
(3) The SPS model is validated based on an actual refinery [63], and the model’s accuracy is evaluated via a simulation on a single turbine. Figure 6 displays the flow chart for the modeling process. Table 7 compares the simulation and the original data, demonstrating variance less than 2% between the data and the standard extraction condensing turbine model. Therefore, the SPS model is reliable.

4.2. Key Parametric Analysis

This section discusses the effects of three key input parameters: the gasification temperature T b i o , steam-to-biomass ratio S/B (steam-to-biomass ratio), and fuel cell temperature T a v g on system performance.

4.2.1. Effect of Gasification Parameters on SOFC Output Power

The composition ratio of syngas is influenced by two essential factors: the gasification temperature T b i o and the ratio of S/B. Increasing T b i o leads to higher H2 and CO contents and a decrease in the CH4 content in syngas. As S/B increases, the concentration of H2 and CO2 in syngas increases while the CO content drops. The output power of the SOFC will be impacted by changes in the syngas composition ratio, which will also have an impact on the reforming process. Figure 7 displays the effect of T b i o and S/B on the SOFC output power W S O F C . When S/B is constant, the increase in gasification temperature causes W S O F C to initially decline gradually, then gradually increase to 800~950 °C, and finally stabilize. The reason is that with the increasing temperature, the amount of CH4 in the gas decreases, slowing down the methane steam reforming reaction, which in turn increases the amount of H2O in the anode gas and ultimately results in a decline in SOFC performance. The findings are consistent with those of Doherty et al. [43]. After 800 °C, the CH4 content stays constant, and an increase in H2 and CO stimulates the electrochemical process and water-to-gas conversion reaction, causing the power to climb once more until it reaches its maximum value at 950 °C, at which point it tends to level out. On the other hand, at a constant gasification temperature, as S/B increases, the effect of the CO drop outweighs the rise in H2, leading to a decrease in output power. Therefore, the SOFC output power can be improved at a low S/B ratio and high gasification temperature. The optimal value of the SOFC power is obtained when the gasification temperature is 950 °C and S/B is 0.2.

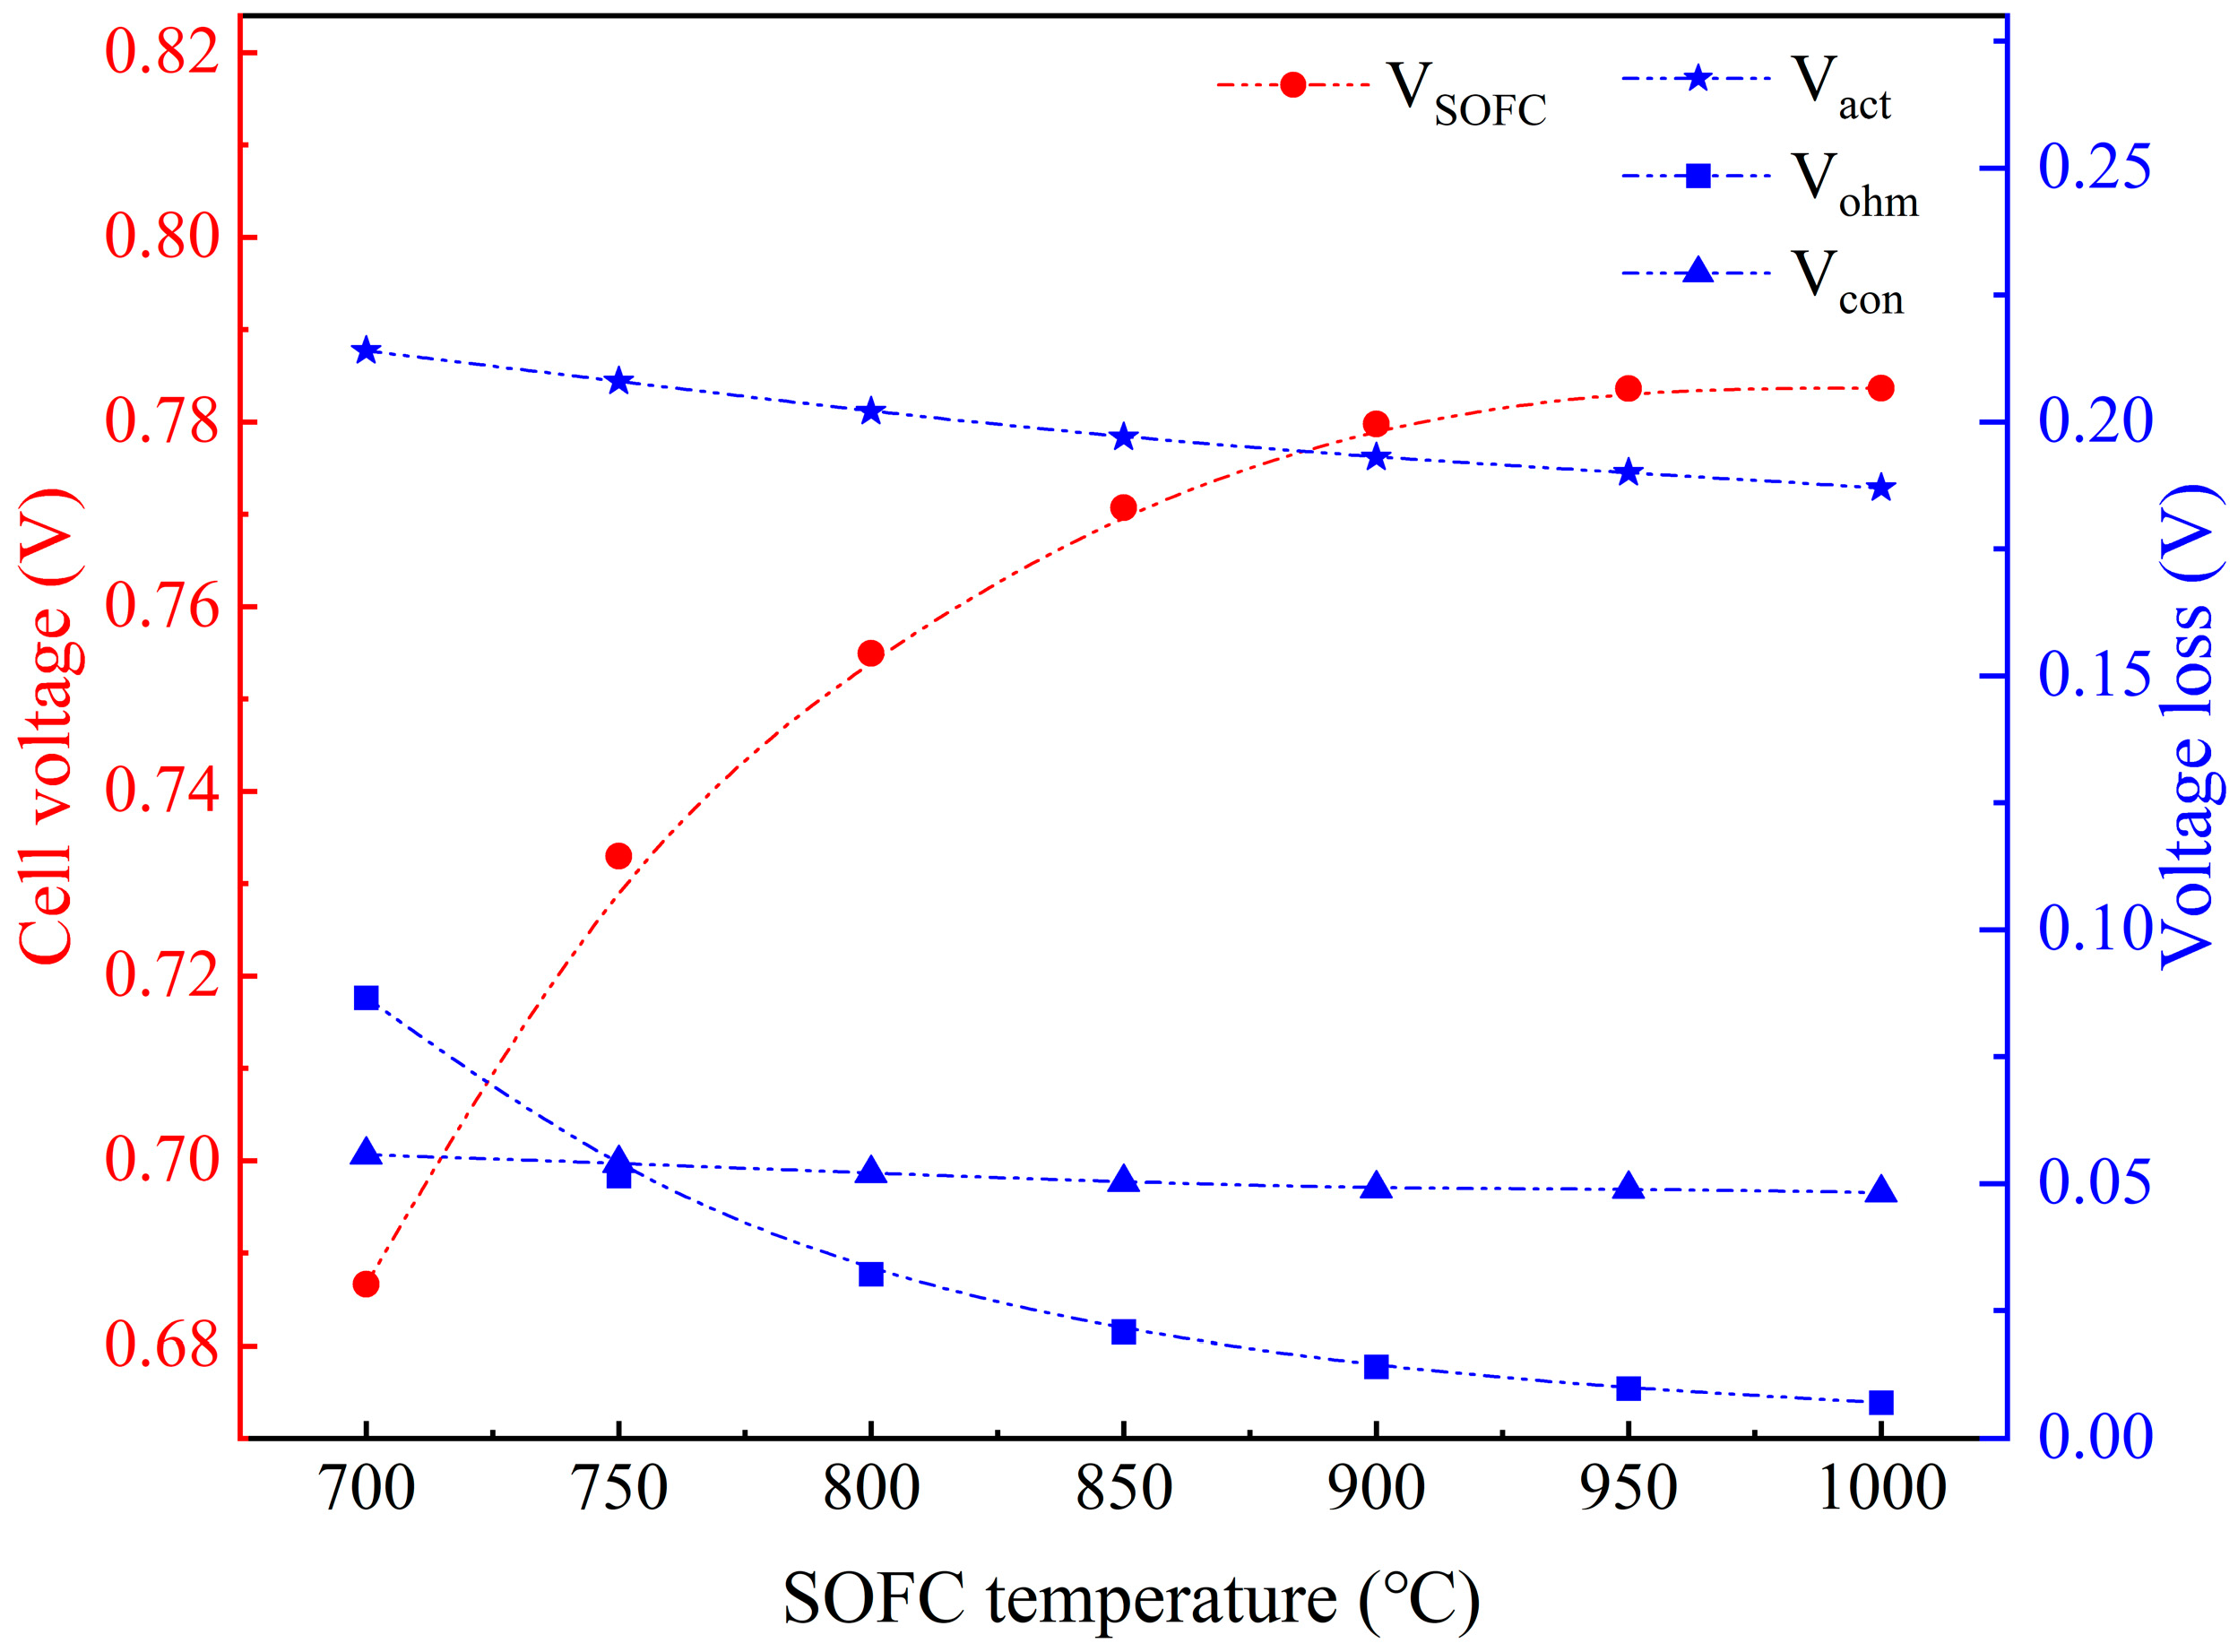
4.2.2. Effect of SOFC Operating Temperature

The performance of the SOFC varies with its operating temperature, as depicted in Figure 8. As the temperature increases, the voltage V N rises from 0.686 V to 0.783 V and tends to flatline after reaching 950 °C. This can be attributed to two factors. Firstly, the temperature increase promotes the internal reforming reaction within the SOFC, leading to an increase in voltage. Secondly, as illustrated in Figure 8, the activation loss V a c t and ohmic loss V o h m both show a decreasing trend with the increase in temperature. It can be seen that the concentration loss V c o n is almost constant with increasing temperature since the electrode resistance does not vary much in the temperature range. The specific parameters for the voltage calculation can be found in Supplementary Materials. It can be concluded that increasing the operating temperature of the SOFC can increase the voltage of the cell and thereby the energy output. Still, the voltage increase is limited after reaching a specific temperature.

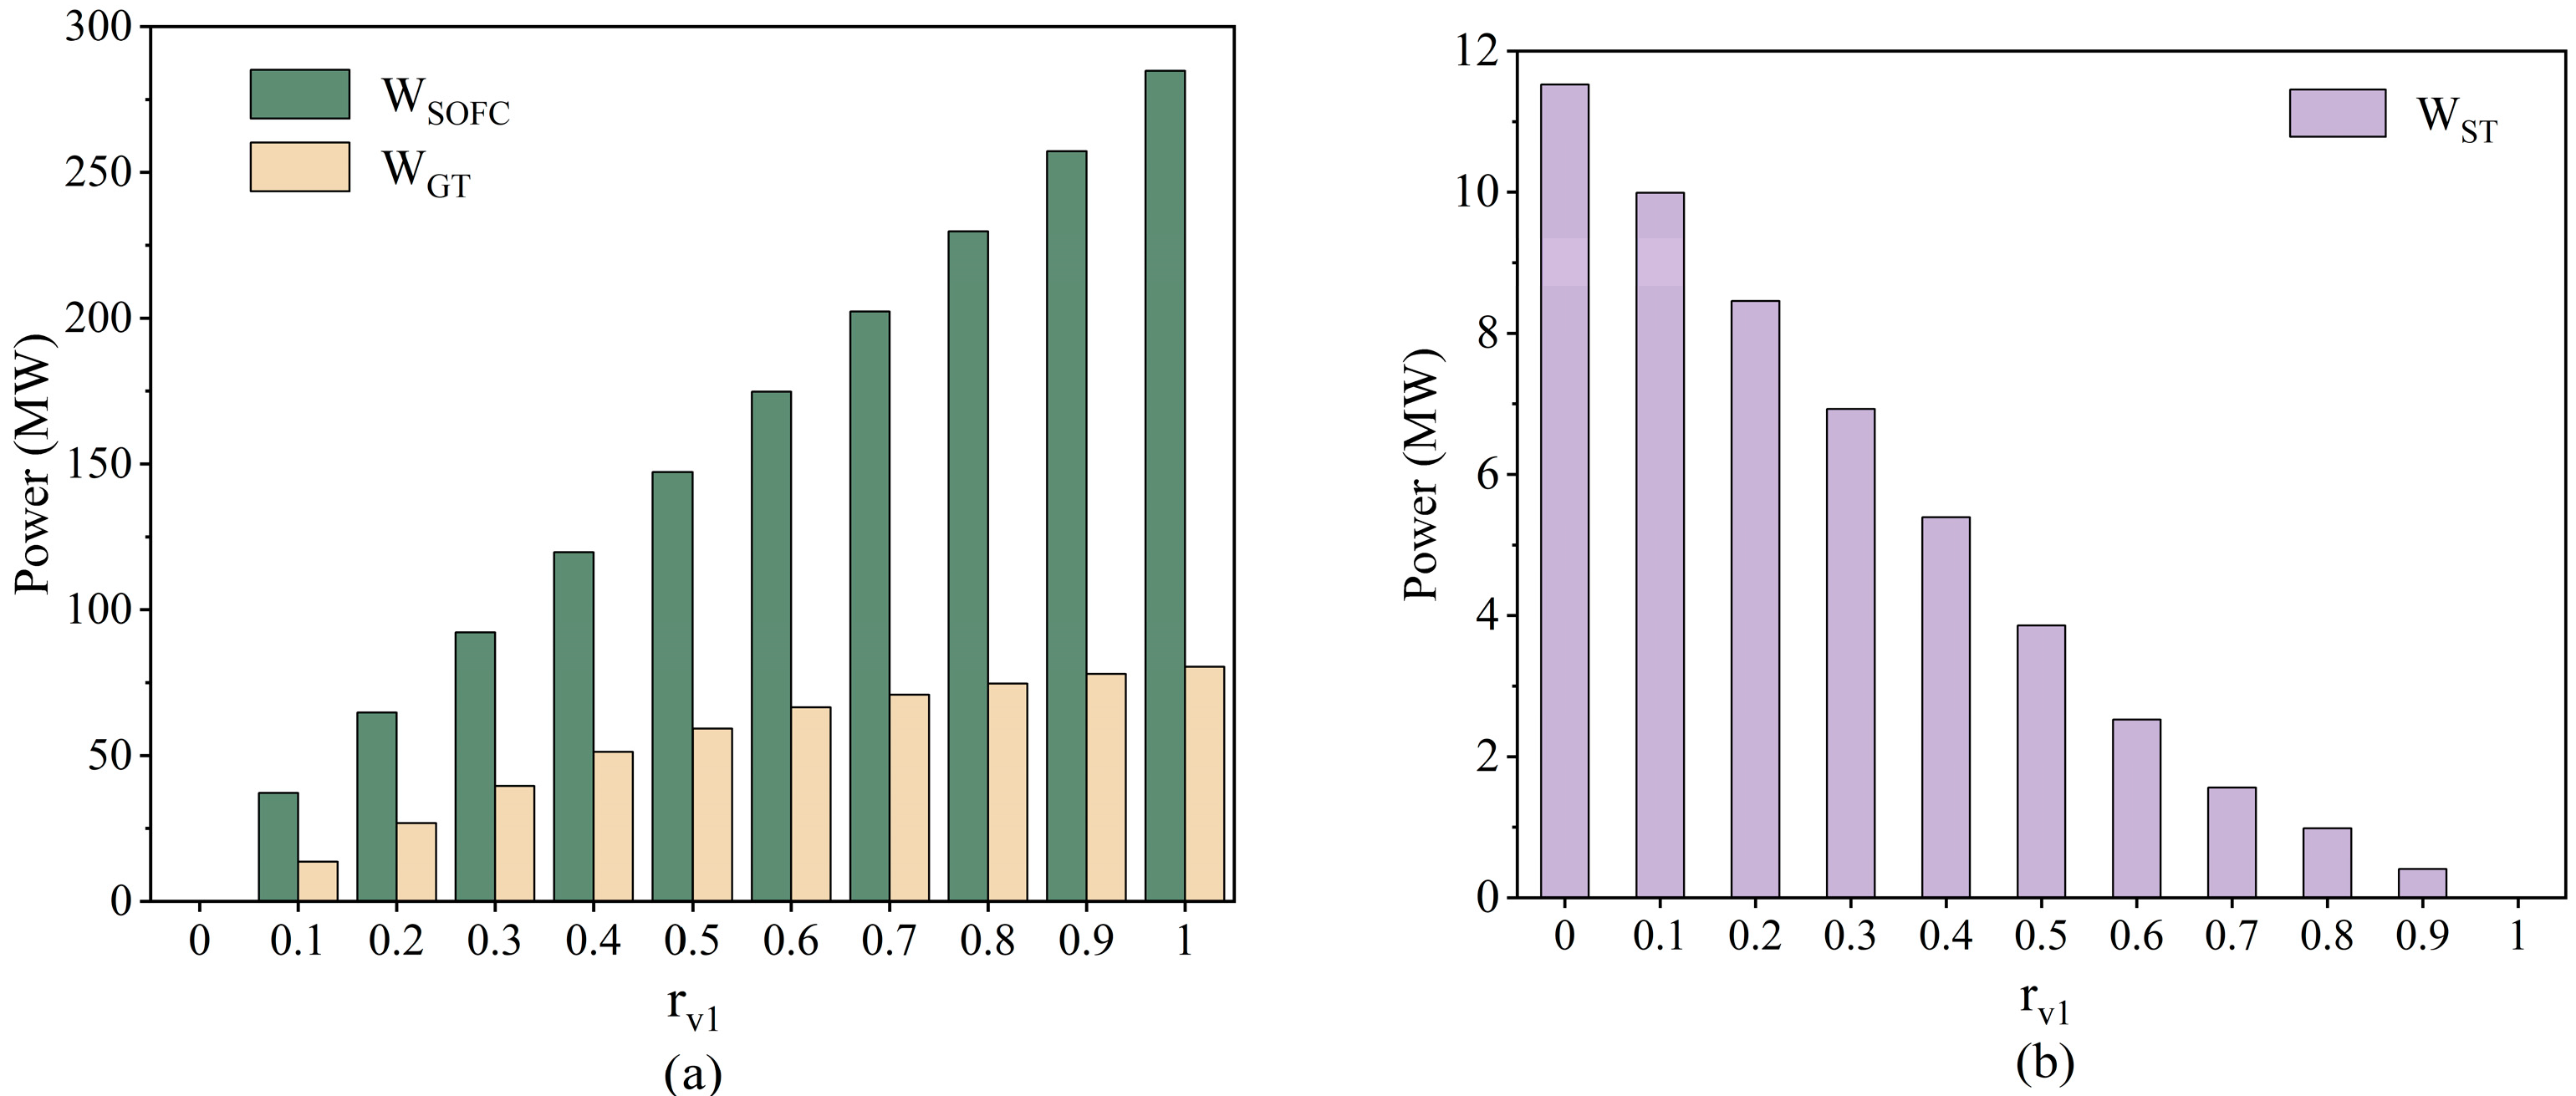
4.3. Scope of System Regulation

Compared with the conventional energy supply system, the proposed BSG-SOFC-GT-SPS multigeneration system can adjust the energy output form to meet the needs of users by adjusting the opening of valves V−1 and V−2. The SPS system provides steam and mechanical work for the process plant, and the system proposed in this paper can also provide power for the entire plant. When the power is insufficient, it is purchased from the grid, and the remaining power is connected to the grid. The heat demand data in the analysis section below come from an actual refinery steam system in China [40], as shown in Table 8. This section analyzes the system regulation range in terms of energy and economy.

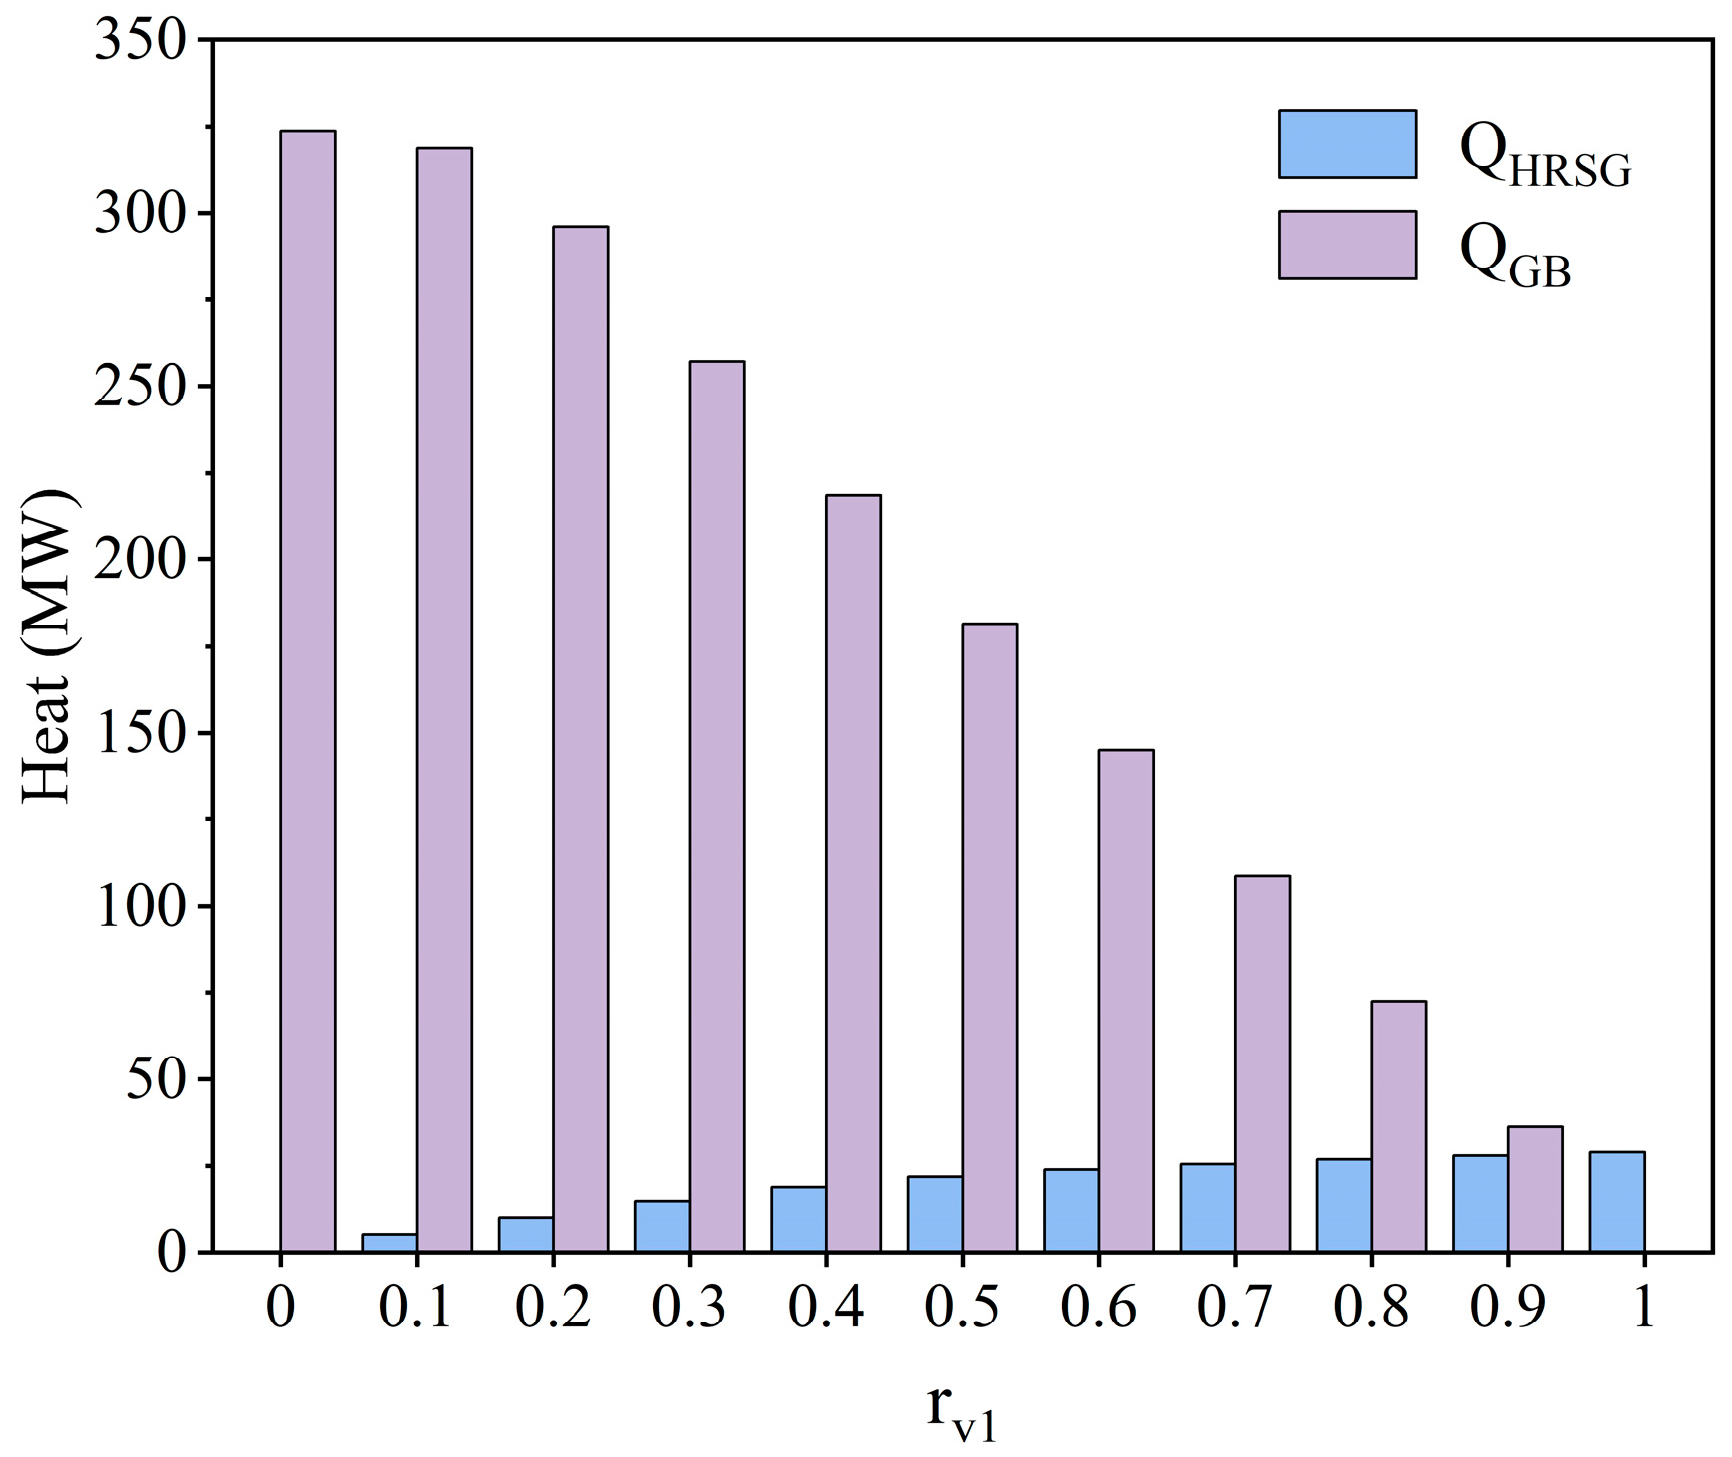
4.3.1. Energy Analysis

Figure 9 shows the influence of valve opening on the system output power. As can be seen from Figure 9a, with the change in the V−1 valve opening from 0 to 1, the SOFC power increased from 0 to 284.78 MW. The power of the GT is also positively correlated with rv1, but because the isentropic efficiency of the gas turbine is affected by the flow rate change at the inlet, the power increase of the GT gradually slows down. The adjustment range of the total output power of the system is 11.52~365.21 MW. It can be seen from Figure 9b that the mechanical work output of the two steam turbines decreases with the increase in rv1. This is because as rv1 increases, the flow to the SPS system decreases, and the user’s thermal demand is gradually met by purchased steam, as shown in Figure 10. At Config−2, the system generates only 0.03 kg/s of VHP steam in the HRSG, and the remaining heat demand is made up by purchased steam. Therefore, there is no excess steam to drive the steam turbine, resulting in a gradual decrease in the output of mechanical work.
The influence of valve opening on the system heat output is shown in Figure 11. Although the amount of steam generated by the recovery of waste heat from the exhausted gas of the GT increases with the increase in rv1, the heat production of the SPS system decreases significantly. Therefore, the heat-to-power ratio of the system also changes. Figure 12 shows the effect of valve opening on the heat-to-power ratio and energy conversion efficiency of the system. According to the results, the system’s heat-to-power ratio gradually drops as the V−1 opening increases, decreasing from 28.09 to 0.89. The heat-to-power ratio is an important statistic for characterizing the system’s configuration strategy. The results demonstrate that, in order to satisfy the energy demand, the proposed system can flexibly adjust the heat-to-power ratio in a given range. The rule of building energy demand states that there is often a high demand for power in the summer and a high demand for heating in the winter. Therefore, the system configuration is better suited for the winter when the rv1 ratio is small and better suited for the summer when the rv1 ratio is large. It can also be seen from Figure 12 that with the increase in rv1, the energy conversion efficiency of the system first increases rapidly and then decreases slowly. This shows that when rv1 is 0–0.4, the sum of the growth rates of W S O F C and W G T is greater than the rate of W S T and the purchased steam change and less than them when rv1 is greater than 0.4. When rv1 is 0.4, the maximum efficiency reaches 66.05%, which indicates that the hybrid system has more advantages in energy efficiency than the single system. Based on the findings of another work [8], the SBG-GT cogeneration energy efficiency is 42.57%, lower than the efficiency of 61.3% (when rv1 is 0.1), which suggests that incorporating SOFCs can enhance the efficiency of conventional biomass gasification systems. Consequently, the analysis demonstrates that the proposed system has the ability to adjust the heat-to-power ratio as needed, enhance overall system efficiency, and achieve an optimal match between energy supply and demand.
When rv1 = 0 and rv1 = 1, the maximum operating capacities of the SOFC-GT system and the SPS system are obtained, respectively, as shown in Table 9. This is the foundation for the economic analysis in the following section.

4.3.2. Economic Analysis

Figure 13 illustrates the capital expenditure composition and allocation ratio of the proposed system. The total system capital expenditure, including equipment costs, installation costs, and indirect costs, totaled USD 402 million. Equipment costs accounted for a larger proportion of the total capital expenditure: 73.3%. The SOFC is the core power generation component of the system, accounting for the largest proportion of the total cost: 59.9%. The second is the installation cost, including pipeline construction and steel costs, accounting for 22% of the total cost.
The system capital expenditure remains constant under different configuration strategies, while the NCF varies with the opening of valve V−1, as illustrated in Figure 14. The system income varies along with the heat-to-power ratio of the output due to the varied valve openings. The Figure 14 shows that the NCF has a positive correlation with rv1 and rises as rv1 increases. The NPV indicates the system’s investment income during its lifetime, and the system is economical only when the NPV is positive. The NPV is negative at rv1 of 0 and 0.1, since in both cases, a large amount of syngas leads to the SPS system producing steam and a small amount of mechanical work, resulting in less benefit than the SOFC-GT system in terms of the production of electricity. When rv1 is 0.2~1, the NPV of the system is positive, and the maximum value is USD 2.334 billion when rv1 is 1. However, in actual operations, rv1 can change with changes in demand. By calculating the NPV of the system when rv1 is [0,0.1,0.2], it is found that when the time proportion of rv1 at 0 or 0.1 does not exceed 86.7% of the system’s running time, the NPV is positive during the life cycle. Therefore, as long as the system does not keep the V−1 valve open at 0 or 0.1 for more than this time, the system will be beneficial, and it will increase with the increase in the V−1 opening.
In order to further explore the relationship between the system parameters and economy, the maximum energy efficiency rv1 of 0.4 is selected as the annual operation configuration. Figure 15 shows the impact of interest rate i and system life n on the economy. The results show that increasing the interest rate and reducing the system life will reduce the NPV. When the i is raised from 5% to 12%, the NPV dropped by 50.88%. Conversely, when the system life is extended from 12 to 20 years, there is a maximum increase in the NPV of 57.92%.
The comparative analysis results of the proposed system and the reference system in the literature [18,59] are shown in Table 10. The CHP plant proposed in this paper and Seo [59] is economically feasible as the NPV is greater than zero. The LCOE of the SBG-SOFC-GT-SPS CHP plant is USD 0.16/kWh, lower than that of the SOFC-GT CCHP plant proposed by Kumar [18] but higher than that of the SBG CHP plant [59], which is due to the fact that compared to the former, the system replenished biomass and solar energy, significantly reducing the annual fuel cost. However, compared to the latter, higher capital costs are required for the SOFC equipment. In short, the SBG-SOFC-GT-SPS CHP plant is economically viable. This system can be integrated with petrochemical clusters in areas rich in biomass and solar energy resources (such as Xinjiang, China, etc.) for satisfying the electricity and steam demands of different processes.

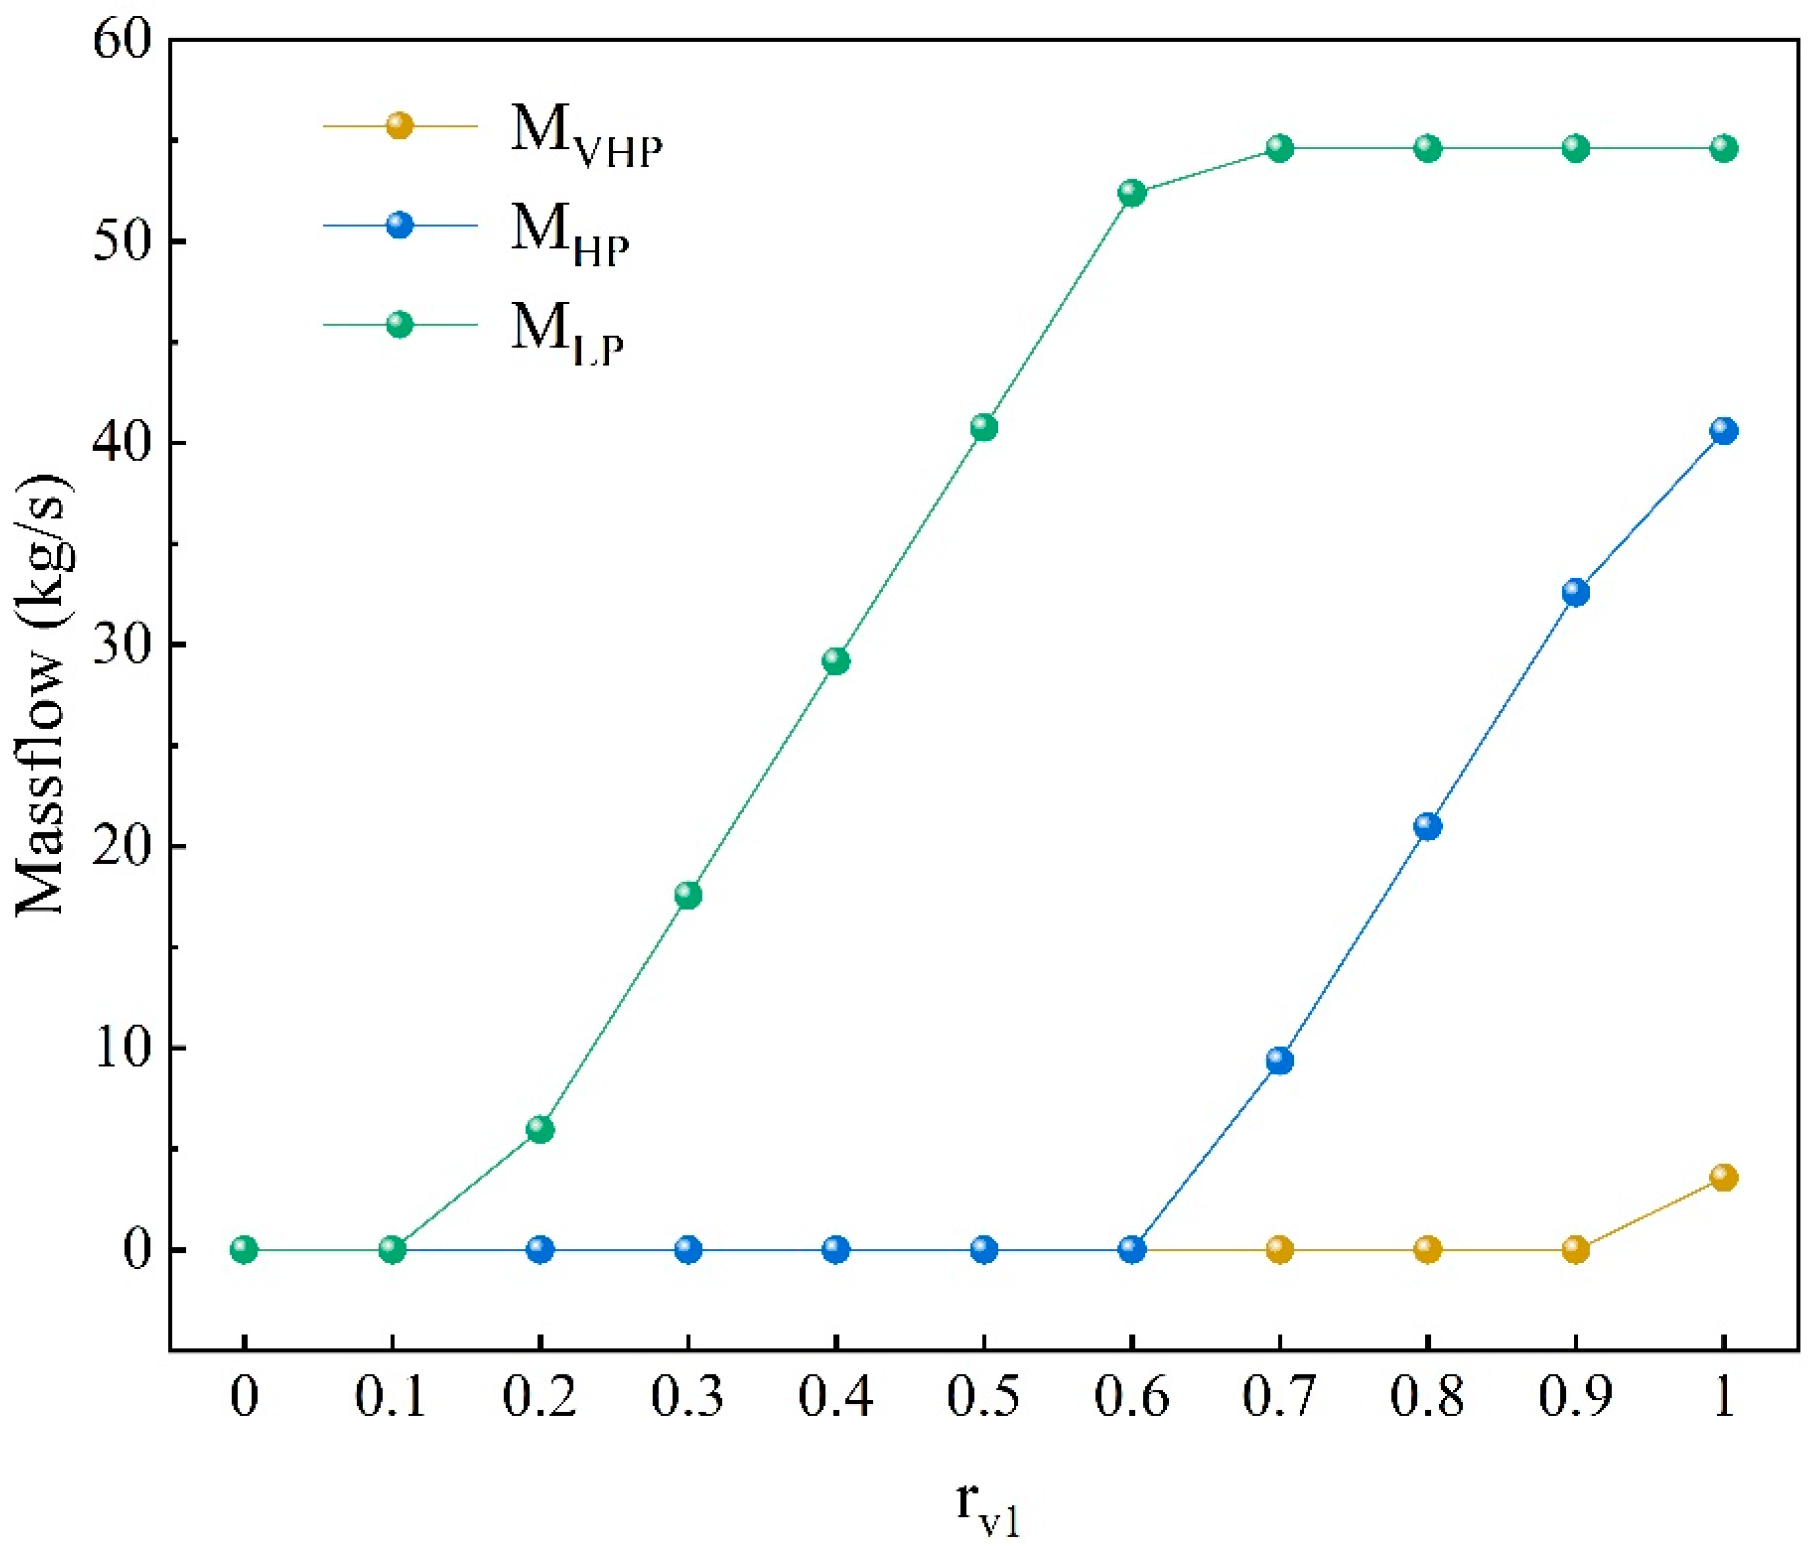
4.3.3. Simulation Results of SPS

Figure 16 depicts the SPS simulation results of a steam network system with the goal of obtaining the maximum energy efficiency (rv1 of 0.4). The graphic fully displays the input and output parameters for each operation. In this instance, the heating of the system is dominant. The ST1 and ST2 steam turbines have respective output shaft powers of 4.23 MW and 1.16 MW. The temperature and pressure reducer achieves cooling and decompression by releasing high-temperature and -pressure fluids into the environment. While this process is crucial for the system’s safety and protection, some of the fluid’s heat and kinetic energy will be lost, leading to waste and energy loss. Therefore, we minimize the use of temperature and pressure reducers during the modeling process, and the excess steam is passed into STs in order to reduce the energy loss.

5. Conclusions

This paper presents a combined heat and power system that integrates biomass gasification, solar collection, a solid oxide fuel cell, a gas turbine, and a steam power system. Compared with the conventional cogeneration system, a configuration strategy is proposed to adjust the heat-to-power ratio of the system by manipulating the valve opening (rv1, rv2). This allows for customized modifications of the output energy ratio to increase system flexibility according to user requirements. A sensitivity analysis is performed to assess the impact of operational parameters on the system. A thermodynamic analysis is performed to assess energy production and regulatory capabilities under various configurations. Furthermore, an energy and economic assessment is also carried out. The following conclusions are drawn:
(1)
By studying the influence of system operating parameters, it is observed that the output power of the SOFC can be enhanced by maintaining a low S/B ratio and a high gasification temperature. Specifically, the maximum SOFC power is reached at a gasification temperature of 950 °C and an S/B of 0.2. Additionally, increasing the operating temperature of the SOFC contributes to an increase in its voltage and output power, but after 950 °C, this growth trend slows down.
(2)
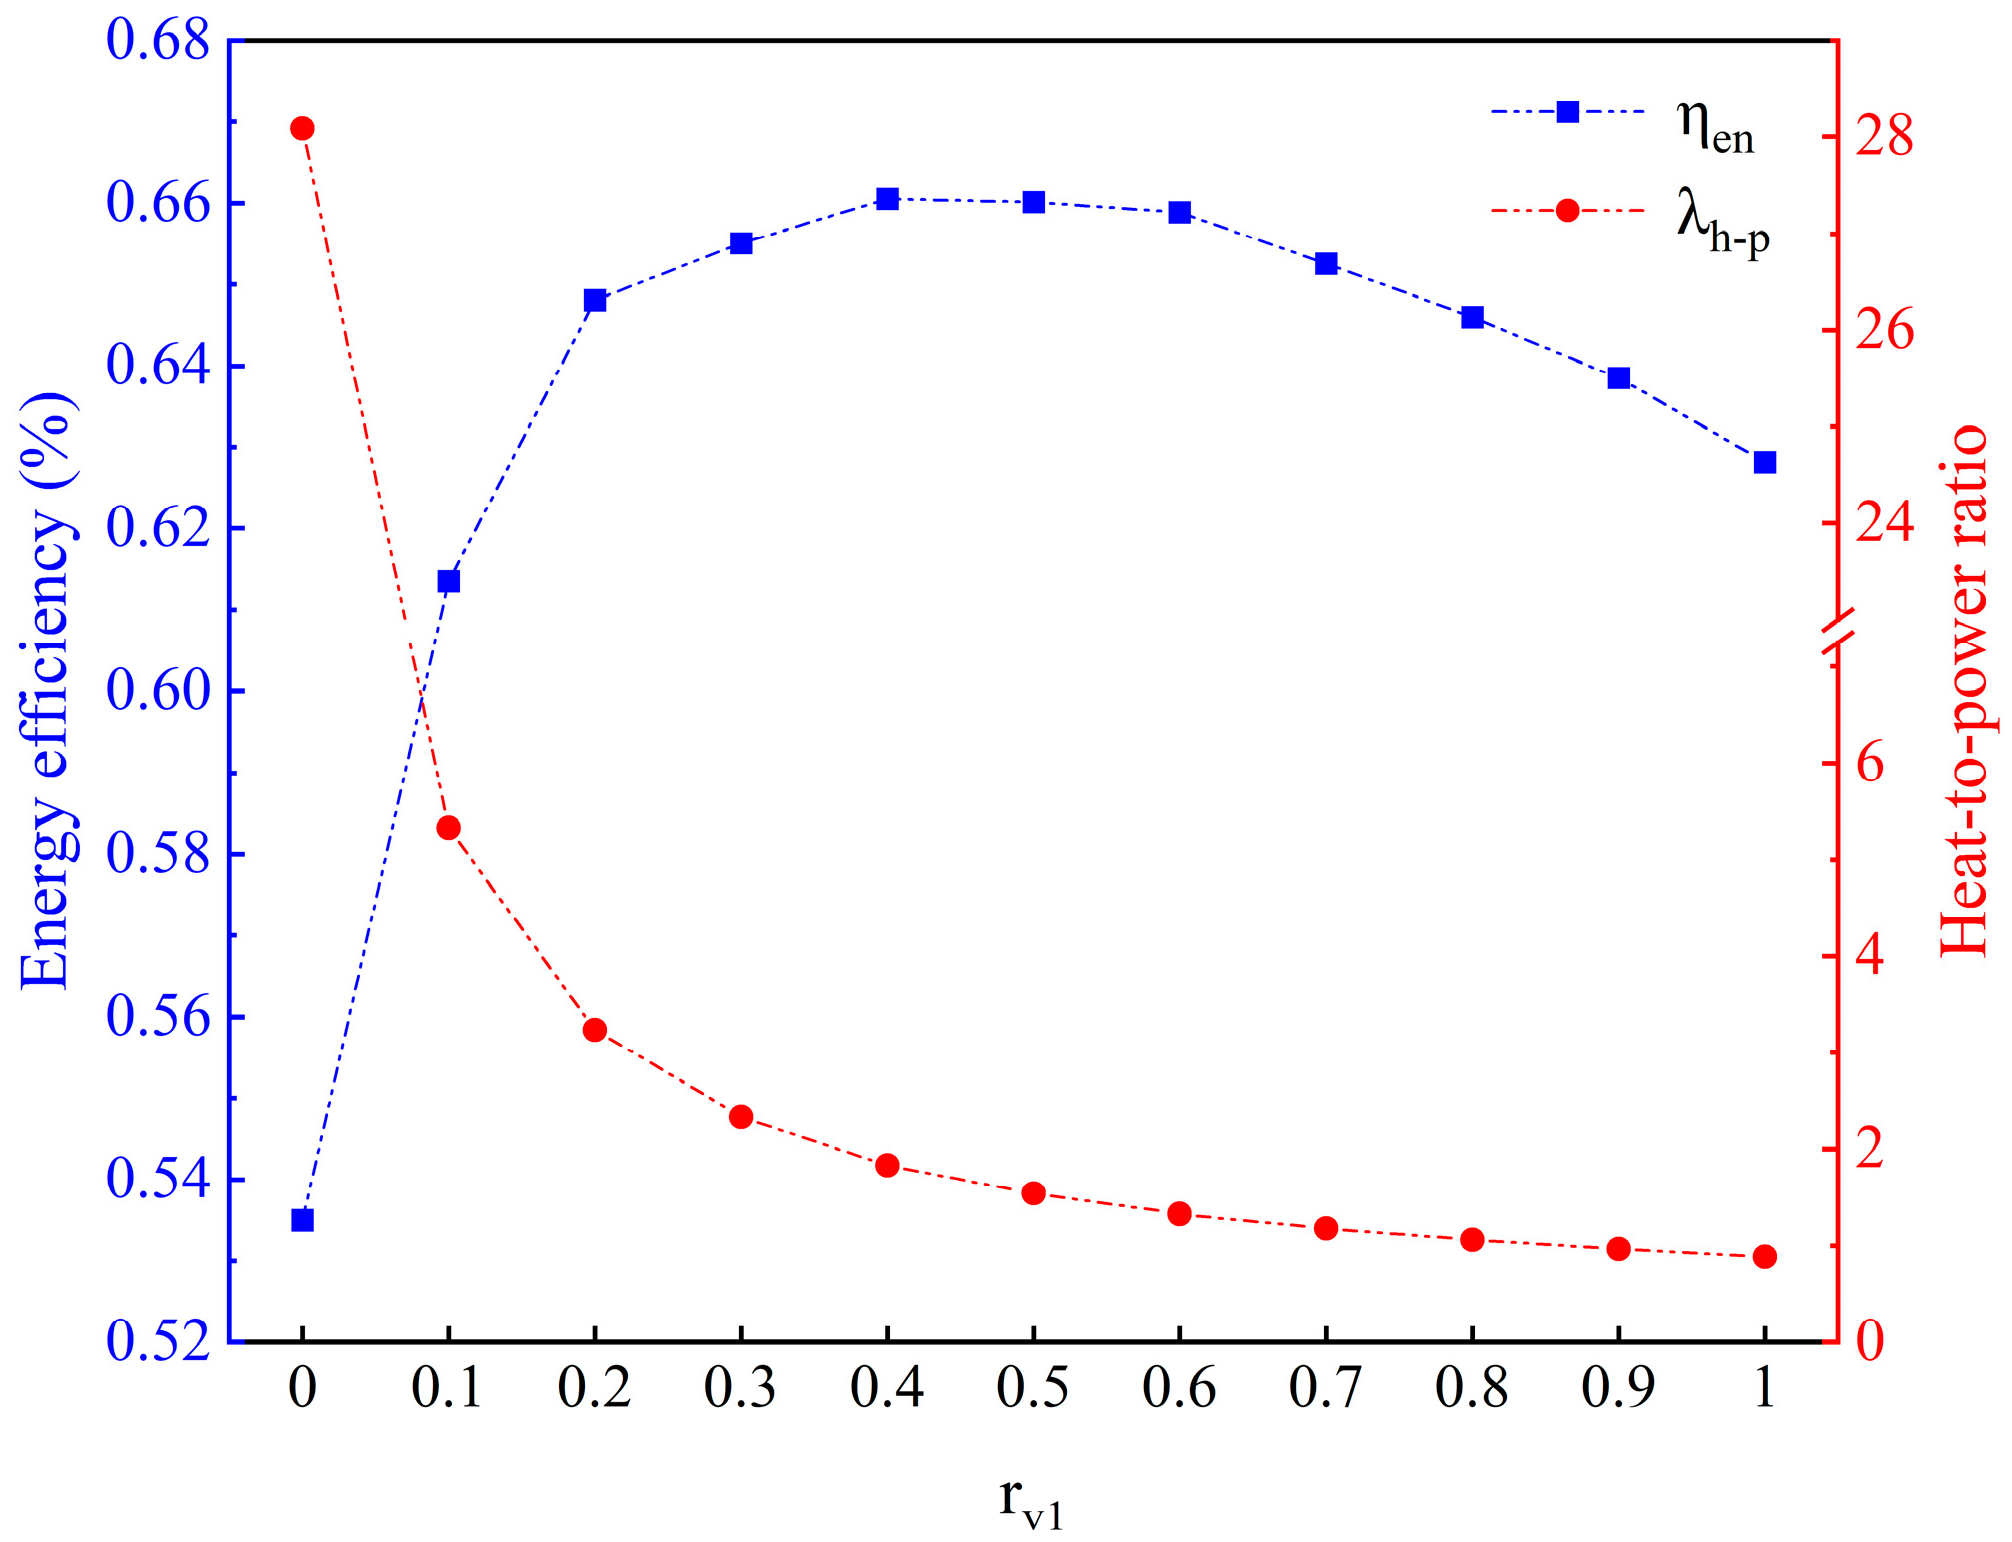
Within a specified range of operating conditions, the system exhibits an adjustable output power range of 11.52 MW to 365.21 MW. The energy efficiency reaches its peak at 66.05% when rv1 is set to 0.4, indicating that the hybrid system has more advantages in terms of energy efficiency than the single system. The heat-to-power ratio of the system can be adjusted within the range of 0.89 to 28.09 in order to effectively meet varying energy demand.
(3)
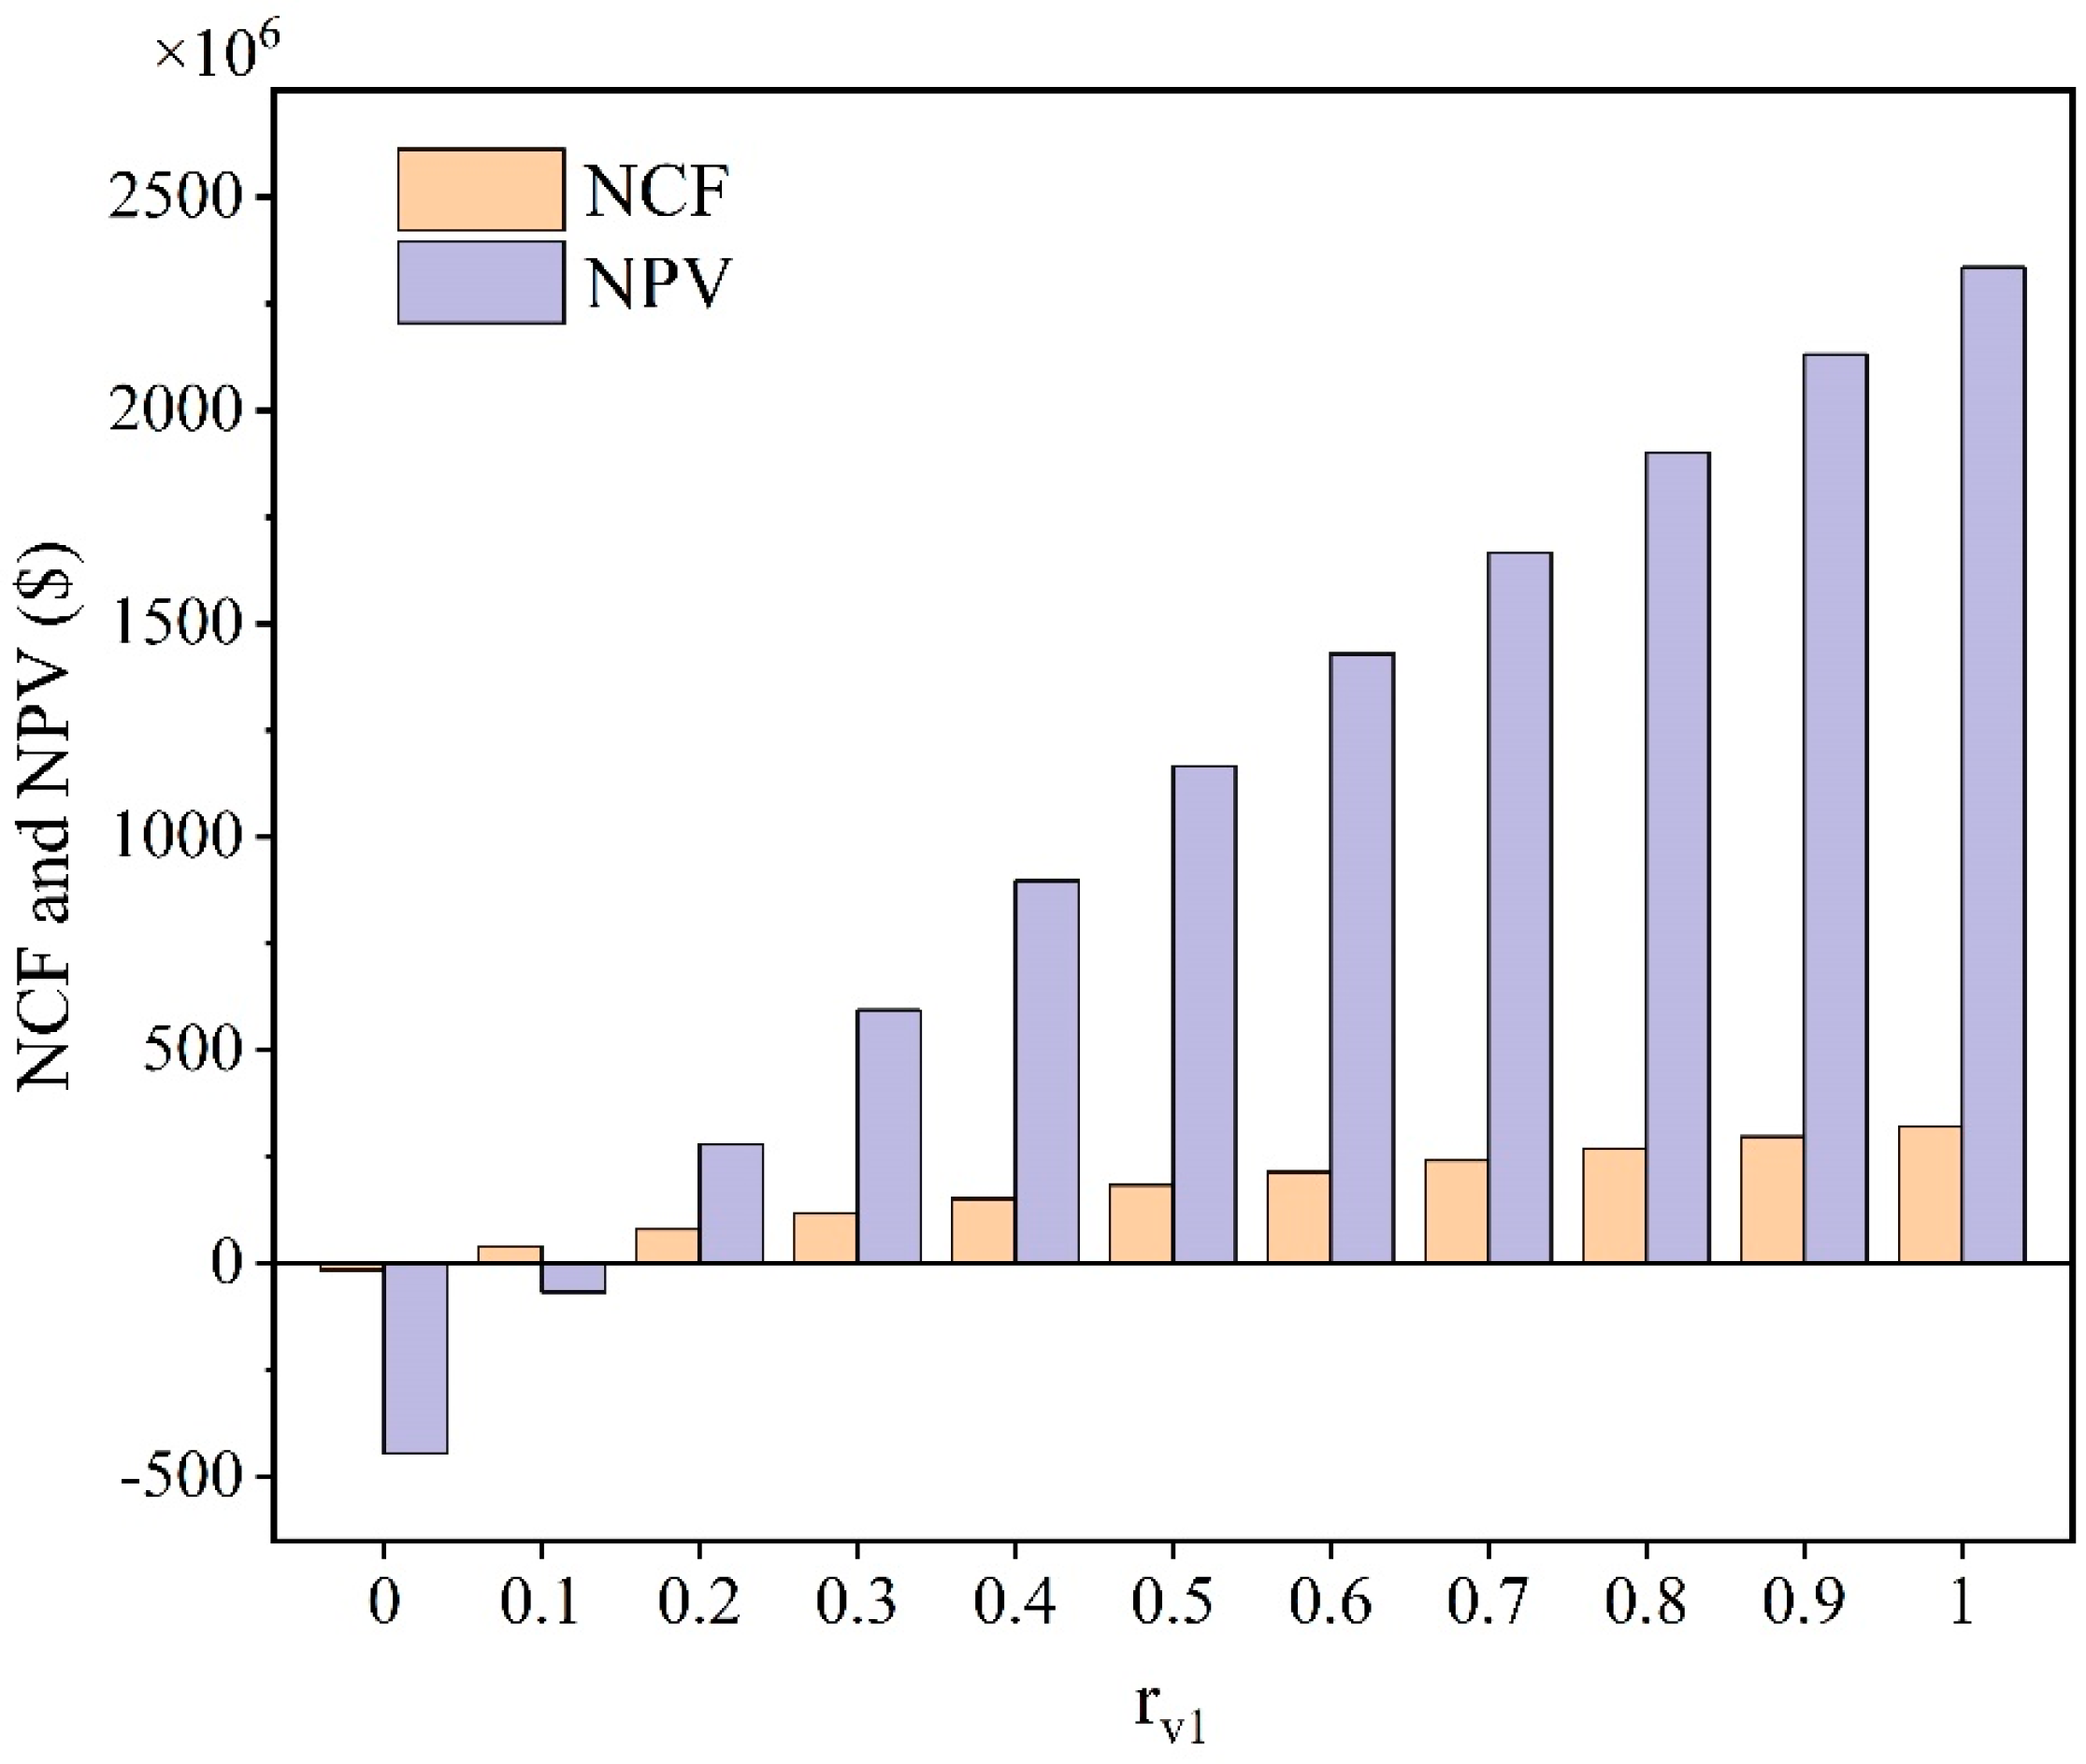
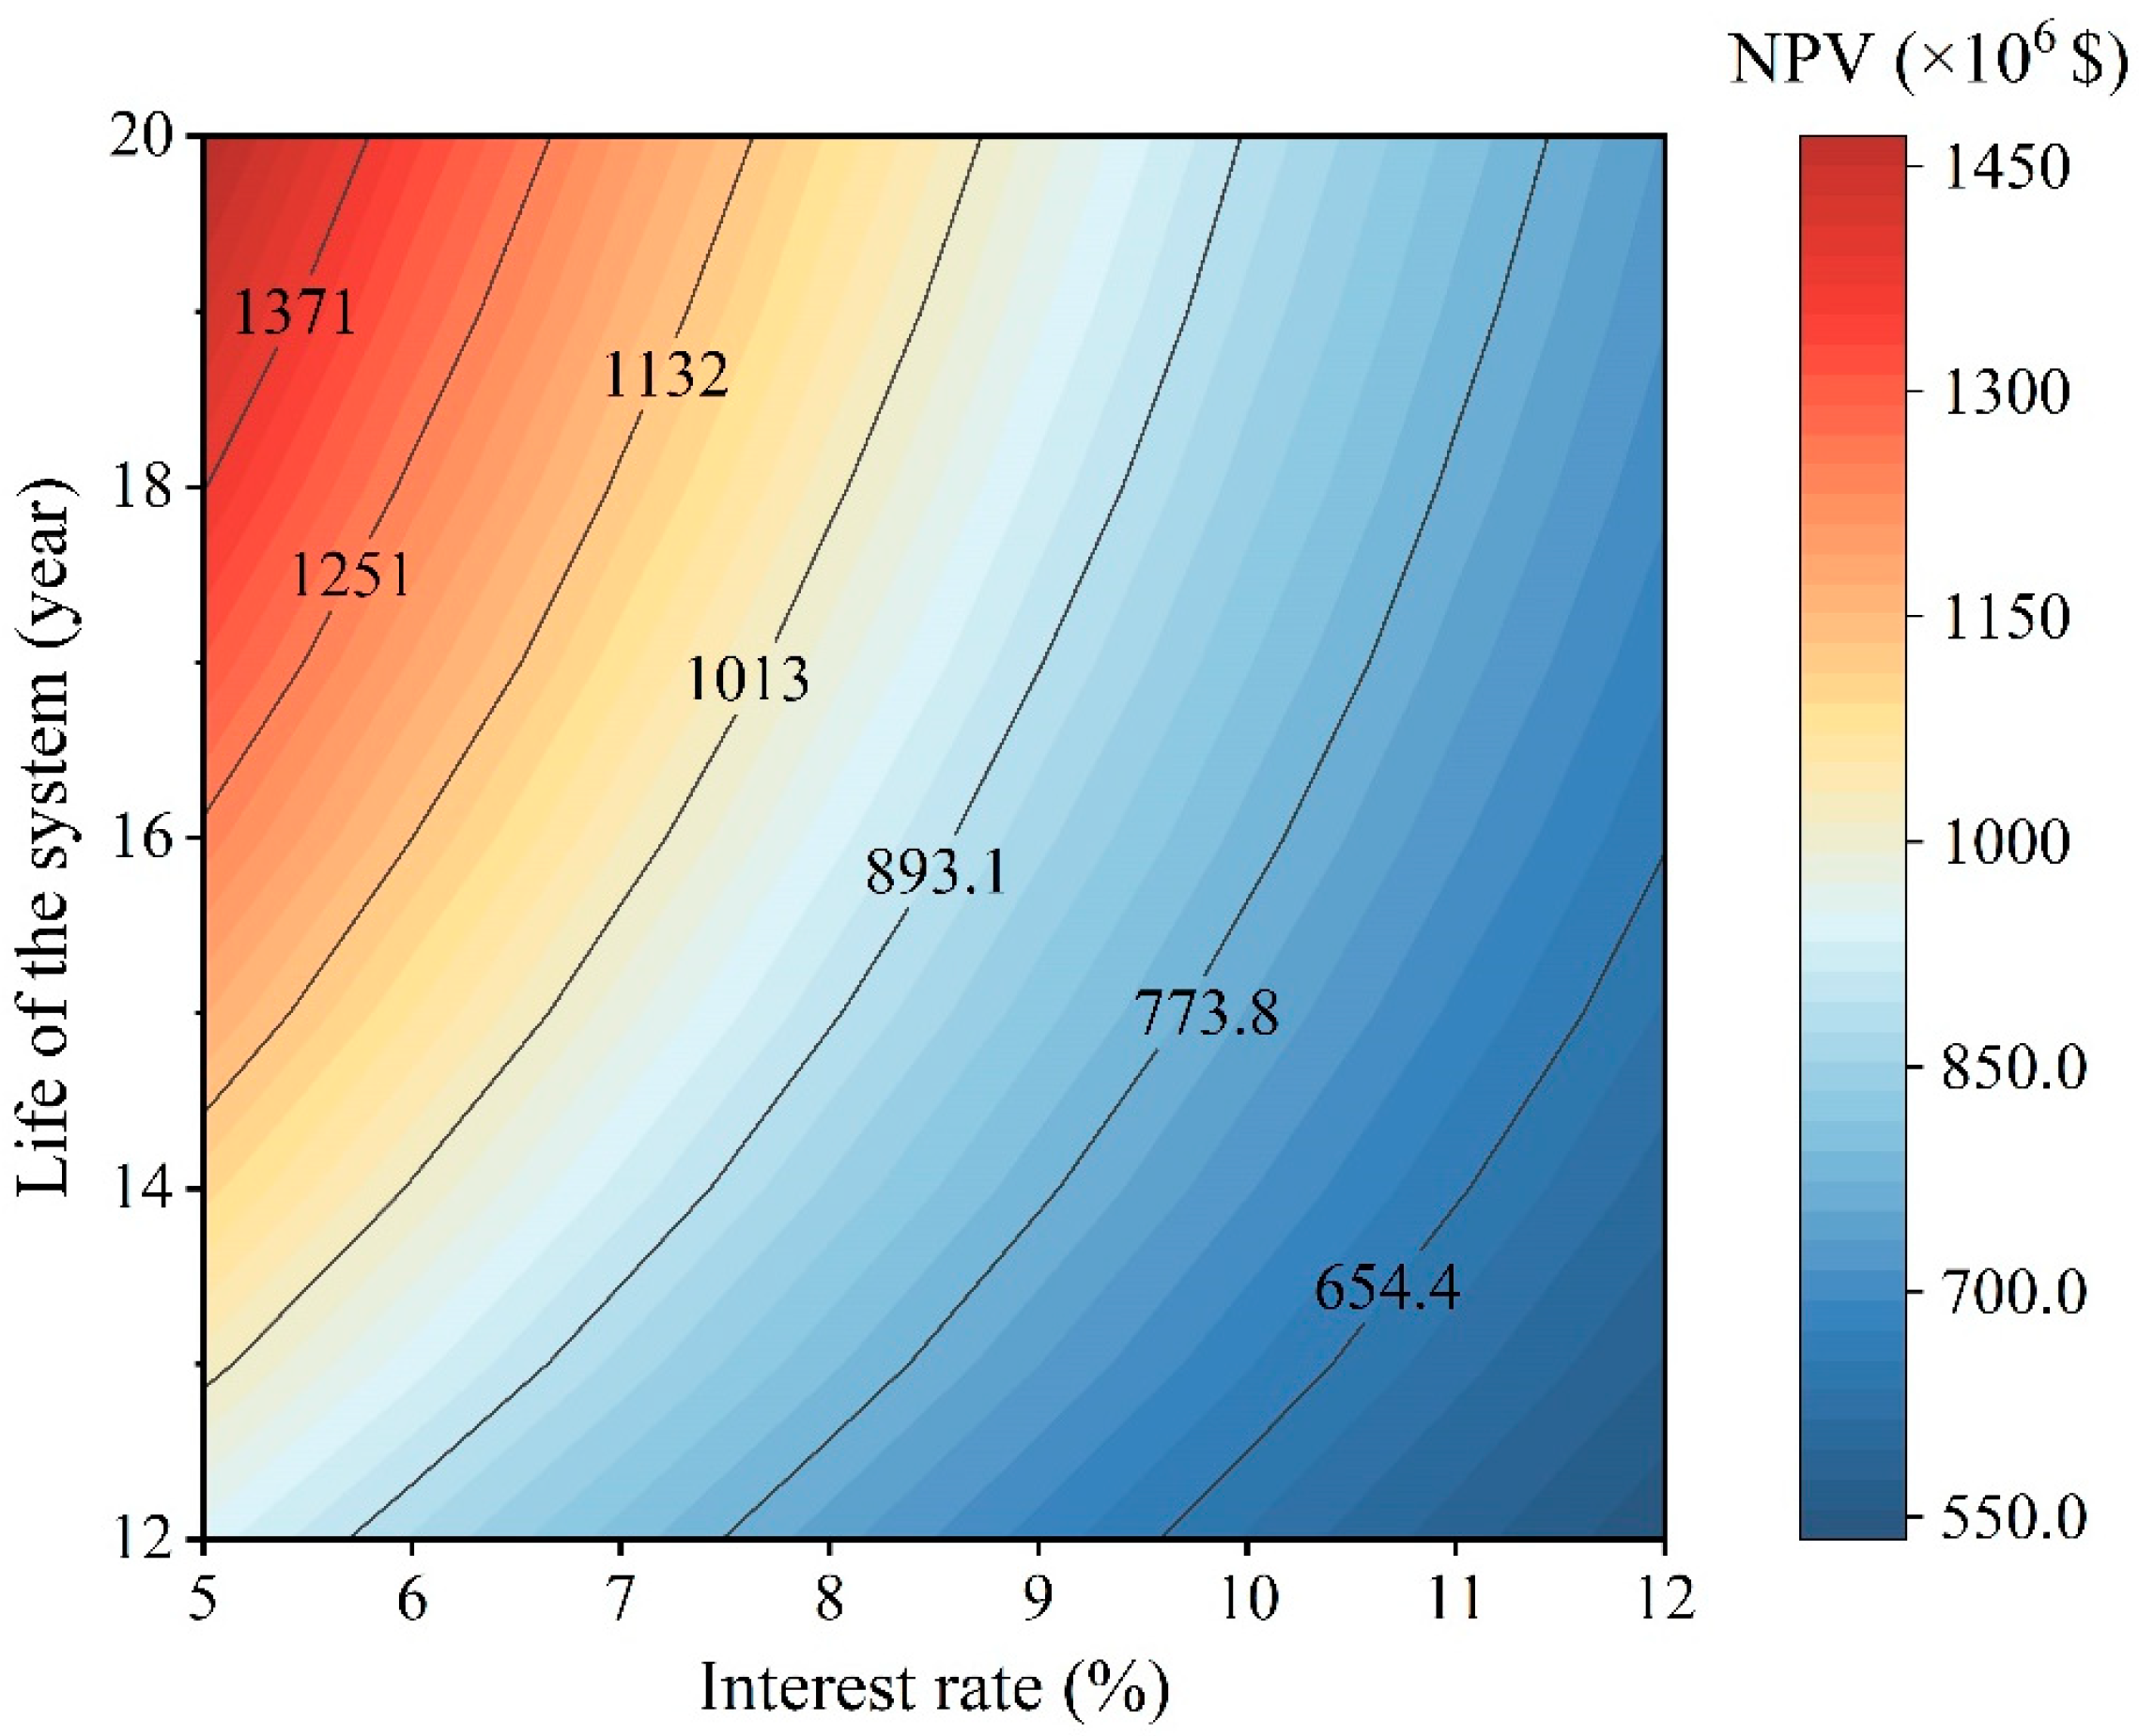
Our economic analysis reveals that the system is economically feasible as the NPV is greater than zero, and the LCOE is USD 0.16/kWh. The interest rate and system lifespan have an impact on the economy index. Specifically, increasing the interest rate and decreasing the system lifespan lead to a decrease in the NPV.
In this study, the model assumptions (e.g., not considering the formation of particulate or solid by-products) are not conducive to practical applications of the system. Future research should further improve the gasification and fuel cell simulation model. Based on the authors’ current knowledge, the current scheme has not yet been found in a real case due to implementation limitations. Therefore, the feasibility of combining this system with the existing process infrastructure could be a future research direction.

Supplementary Materials

The following supporting information can be downloaded at: https://www.mdpi.com/article/10.3390/pr12030446/s1, Table S1. Proximate analysis and ultimate analysis of cotton; Table S2. Reactions involved in the SOFC model; Table S3. Voltage loss equations of SOFC; Table S4. Cost equation of the components; Table S5. Parameter for cell voltage.

Author Contributions

Conceptualization, X.Z. and Z.L.; methodology, Z.L.; software, X.Z.; validation, X.Z. and X.H.; formal analysis, Y.T.; investigation, Y.T.; resources, Z.L.; writing—original draft preparation, X.Z.; writing—review and editing, Z.L.; visualization, X.Z.; funding acquisition, Z.L., Y.T. and X.H. All authors have read and agreed to the published version of the manuscript.

Funding

This research was funded by the National Natural Science Foundation of China, grant numbers 62003215, 61903251, and 22308217.

Data Availability Statement

The data are contained within the article.

Conflicts of Interest

The authors declare that they have no known competing financial interests or personal relationships that could have appeared to influence the work reported in this paper.

References

  1. Saboori, H.; Mehrjerdi, H. Techno-economic-environmental modeling, joint optimization, and sensitivity analysis of a combined water desalination-hybrid renewable supply system. Int. J. Energy Res. 2022, 46, 12323–12340. [Google Scholar] [CrossRef]
  2. Piña-Martinez, A.; Lasala, S.; Privat, R.; Falk, V.; Jaubert, J.-N. Design of Promising Working Fluids for Emergent Combined Cooling, Heating, and Power (CCHP) Systems. ACS Sustain. Chem. Eng. 2021, 9, 11807–11824. [Google Scholar] [CrossRef]
  3. Zhao, P.; Gou, F.; Xu, W.; Shi, H.; Wang, J. Energy, exergy, economic and environmental (4E) analyses of an integrated system based on CH-CAES and electrical boiler for wind power penetration and CHP unit heat-power decoupling in wind enrichment region. Energy 2023, 263, 125917. [Google Scholar] [CrossRef]
  4. Yun, H.; Dai, J.; Tan, T.; Bi, X. Accelerate Large-Scale Biomass Residue Utilization via Cofiring to Help China Achieve Its 2030 Carbon-Peaking Goals. Env. Sci Technol 2023, 57, 9163–9173. [Google Scholar] [CrossRef]
  5. Yan, P.; Xiao, C.; Xu, L.; Yu, G.; Li, A.; Piao, S.; He, N. Biomass energy in China’s terrestrial ecosystems: Insights into the nation’s sustainable energy supply. Renew. Sustain. Energy Rev. 2020, 127, 109857. [Google Scholar] [CrossRef]
  6. NDRC; Development and Reform Commission of the Peoples Republic of China. 14th Five-Year Plan for Renewable Energy Development (2021–2025); NDRC: Beijing, China, 2021.
  7. Yu, D.; Hu, J.; Wang, W.; Gu, B. Comprehensive techno-economic investigation of biomass gasification and nanomaterial based SOFC/SOEC hydrogen production system. Fuel 2023, 333, 126442. [Google Scholar] [CrossRef]
  8. Li, Z.; Zhu, X.; Huang, X.; Tian, Y.; Huang, B. Sustainability design and analysis of a regional energy supply CHP system by integrating biomass and solar energy. Sustain. Prod. Consum. 2023, 41, 228–241. [Google Scholar] [CrossRef]
  9. Xu, D.; Gu, X.; Dai, Y. Concentrating solar assisted biomass-to-fuel conversion through gasification: A review. Front. Energy Res. 2023, 10, 1029477. [Google Scholar] [CrossRef]
  10. IRENA. Renewable Power Generation Costs in 2021; International Renewable Energy Agency: Abu Dhabi, United Arab Emirates, 2022. [Google Scholar]
  11. Wu, H.; Liu, Q.; Bai, Z.; Xie, G.; Zheng, J.; Su, B. Thermodynamics analysis of a novel steam/air biomass gasification combined cooling, heating and power system with solar energy. Appl. Therm. Eng. 2020, 164, 114494. [Google Scholar] [CrossRef]
  12. He, Y.; Guo, S.; Dong, P.; Lv, D.; Zhou, J. Feasibility analysis of decarbonizing coal-fired power plants with 100% renewable energy and flexible green hydrogen production. Energy Convers. Manag. 2023, 290, 117232. [Google Scholar] [CrossRef]
  13. Ahmed, K.; Föger, K. Analysis of equilibrium and kinetic models of internal reforming on solid oxide fuel cell anodes: Effect on voltage, current and temperature distribution. J. Power Sources 2017, 343, 83–93. [Google Scholar] [CrossRef]
  14. Choudhury, A.; Chandra, H.; Arora, A. Application of solid oxide fuel cell technology for power generation—A review. Renew. Sustain. Energy Rev. 2013, 20, 430–442. [Google Scholar] [CrossRef]
  15. Shayan, E.; Zare, V.; Mirzaee, I. On the use of different gasification agents in a biomass fueled SOFC by integrated gasifier: A comparative exergo-economic evaluation and optimization. Energy 2019, 171, 1126–1138. [Google Scholar] [CrossRef]
  16. Wang, J.; Al-attab, K.A.; Yew Heng, T. Techno-economic and thermodynamic analysis of solid oxide fuel cell combined heat and power integrated with biomass gasification and solar assisted carbon capture and energy utilization system. Energy Convers. Manag. 2023, 111, 280. [Google Scholar] [CrossRef]
  17. Timurkutluk, B.; Timurkutluk, C.; Mat, M.D.; Kaplan, Y. A review on cell/stack designs for high performance solid oxide fuel cells. Renew. Sustain. Energy Rev. 2016, 56, 1101–1121. [Google Scholar] [CrossRef]
  18. Kumar, P.; Singh, O. Thermoeconomic analysis of SOFC-GT-VARS-ORC combined power and cooling system. Int. J. Hydrogen Energy 2019, 44, 27575–27586. [Google Scholar] [CrossRef]
  19. Fu, C.; Wang, J.; Shen, Q.; Cui, Z.; Ding, S. Determining the optimal biomass-gasification-based fuel cell trigeneration system in exergy-based cost and carbon footprint method considering energy level. Energy Convers. Manag. 2024, 299, 117802. [Google Scholar] [CrossRef]
  20. Li, B.; Roche, R.; Paire, D.; Miraoui, A. Sizing of a stand-alone microgrid considering electric power, cooling/heating, hydrogen loads and hydrogen storage degradation. Appl. Energy 2017, 205, 1244–1259. [Google Scholar] [CrossRef]
  21. Pan, G.; Gu, W.; Wu, Z.; Lu, Y.; Lu, S. Optimal design and operation of multi-energy system with load aggregator considering nodal energy prices. Appl. Energy 2019, 239, 280–295. [Google Scholar] [CrossRef]
  22. Liu, Z.; Zhao, Y.; Wang, X. Long-term economic planning of combined cooling heating and power systems considering energy storage and demand response. Appl. Energy 2020, 279, 115819. [Google Scholar] [CrossRef]
  23. Alabi, T.M.; Lu, L.; Yang, Z.; Zhou, Y. A novel optimal configuration model for a zero-carbon multi-energy system (ZC-MES) integrated with financial constraints. Sustain. Energy Grids Netw. 2020, 23, 100381. [Google Scholar] [CrossRef]
  24. Yang, X.; Chen, Z.; Huang, X.; Li, R.; Xu, S.; Yang, C. Robust capacity optimization methods for integrated energy systems considering demand response and thermal comfort. Energy 2021, 221, 119727. [Google Scholar] [CrossRef]
  25. Liu, J.; Li, Y.; Ma, Y.; Qin, R.; Meng, X.; Wu, J. Two-layer multiple scenario optimization framework for integrated energy system based on optimal energy contribution ratio strategy. Energy 2023, 285, 128673. [Google Scholar] [CrossRef]
  26. Mei, S.; Lu, X.; Zhu, Y.; Wang, S. Thermodynamic assessment of a system configuration strategy for a cogeneration system combining SOFC, thermoelectric generator, and absorption heat pump. Appl. Energy 2021, 302, 117573. [Google Scholar] [CrossRef]
  27. Fan, S.; Li, Z.; Wang, J.; Piao, L.; Ai, Q. Cooperative Economic Scheduling for Multiple Energy Hubs: A Bargaining Game Theoretic Perspective. IEEE Access 2018, 6, 27777–27789. [Google Scholar] [CrossRef]
  28. Wang, A.; Liu, J.; Wang, W. Flexibility-based improved model of multi-energy hubs using linear weighted sum algorithm. J. Renew. Sustain. Energy 2018, 10, 015901. [Google Scholar] [CrossRef]
  29. Yari, M.; Mehr, A.S.; Mahmoudi, S.M.S.; Santarelli, M. A comparative study of two SOFC based cogeneration systems fed by municipal solid waste by means of either the gasifier or digester. Energy 2016, 114, 586–602. [Google Scholar] [CrossRef]
  30. Bocci, E.; Di Carlo, A.; McPhail, S.J.; Gallucci, K.; Foscolo, P.U.; Moneti, M.; Villarini, M.; Carlini, M. Biomass to fuel cells state of the art: A review of the most innovative technology solutions. Int. J. Hydrogen Energy 2014, 39, 21876–21895. [Google Scholar] [CrossRef]
  31. Ud Din, Z.; Zainal, Z.A. Biomass integrated gasification–SOFC systems: Technology overview. Renew. Sustain. Energy Rev. 2016, 53, 1356–1376. [Google Scholar] [CrossRef]
  32. AlNouss, A.; McKay, G.; Al-Ansari, T. Production of syngas via gasification using optimum blends of biomass. J. Clean. Prod. 2020, 242, 118499. [Google Scholar] [CrossRef]
  33. Singh, D.K.; Tirkey, J.V. Modeling and multi-objective optimization of variable air gasification performance parameters using Syzygium cumini biomass by integrating ASPEN Plus with Response surface methodology (RSM). Int. J. Hydrogen Energy 2021, 46, 18816–18831. [Google Scholar] [CrossRef]
  34. Kombe, E.Y.; Lang’at, N.; Njogu, P.; Malessa, R.; Weber, C.-T.; Njoka, F.; Krause, U. Numerical investigation of sugarcane bagasse gasification using Aspen Plus and response surface methodology. Energy Convers. Manag. 2022, 254, 115198. [Google Scholar] [CrossRef]
  35. Wang, J.; Cui, Z.; Yao, W.; Huo, S. Regulation strategies and thermodynamic analysis of combined cooling, heating, and power system integrated with biomass gasification and solid oxide fuel cell. Energy 2023, 266, 126430. [Google Scholar] [CrossRef]
  36. Mehrabadi, Z.K.; Boyaghchi, F.A. Exergoeconomic and exergoenvironmental analyses and optimization of a new low-CO2 emission energy system based on gasification-solid oxide fuel cell to produce power and freshwater using various fuels. Sustain. Prod. Consum. 2021, 26, 782–804. [Google Scholar] [CrossRef]
  37. Bessette, N.F.; Wepfer, W.J.; Winnick, J. A Mathematical Model of a Solid Oxide Fuel Cell. J. Electrochem. Soc. 1995, 142, 3792. [Google Scholar] [CrossRef]
  38. Doherty, W.; Reynolds, A.; Kennedy, D. Computer simulation of a biomass gasification-solid oxide fuel cell power system using Aspen Plus. Energy 2010, 35, 4545–4555. [Google Scholar] [CrossRef]
  39. Lan, W.; Chen, G.; Zhu, X.; Wang, X.; Liu, C.; Xu, B. Biomass gasification-gas turbine combustion for power generation system model based on ASPEN PLUS. Sci. Total Environ. 2018, 628–629, 1278–1286. [Google Scholar] [CrossRef] [PubMed]
  40. Li, A.H.; Ren, X.Y.; Varbanov, P.; Liu, Z.Y. Parametric optimization of steam turbine networks by using commercial simulation software. Chem. Eng. Res. Des. 2022, 184, 246–255. [Google Scholar] [CrossRef]
  41. Liu, Q.; Bai, Z.; Wang, X.; Lei, J.; Jin, H. Investigation of thermodynamic performances for two solar-biomass hybrid combined cycle power generation systems. Energy Convers. Manag. 2016, 122, 252–262. [Google Scholar] [CrossRef]
  42. Campanari, S. Thermodynamic model and parametric analysis of a tubular SOFC module. J. Power Sources 2001, 92, 26–34. [Google Scholar] [CrossRef]
  43. Doherty, W.; Reynolds, A.; Kennedy, D. Process simulation of biomass gasification integrated with a solid oxide fuel cell stack. J. Power Sources 2015, 277, 292–303. [Google Scholar] [CrossRef]
  44. Sadeghi, M.; Mehr, A.S.; Zar, M.; Santarelli, M. Multi-objective optimization of a novel syngas fed SOFC power plant using a downdraft gasifier. Energy 2018, 148, 16–31. [Google Scholar] [CrossRef]
  45. Kim, J.W.; Virkar, A.V.; Fung, K.Z.; Mehta, K.; Singhal, S.C. Polarization Effects in Intermediate Temperature, Anode-Supported Solid Oxide Fuel Cells. J. Electrochem. Soc. 1999, 146, 69. [Google Scholar] [CrossRef]
  46. Wang, Q.; Han, X.; Zhao, L.; Ye, Z. Sustainable Retrofit of Industrial Utility System Using Life Cycle Assessment and Two-Stage Stochastic Programming. ACS Sustain. Chem. Eng. 2022, 10, 13887–13900. [Google Scholar] [CrossRef]
  47. Sun, L.; Smith, R. Performance Modeling of New and Existing Steam Turbines. Ind. Eng. Chem. Res. 2015, 54, 1908–1915. [Google Scholar] [CrossRef]
  48. Loha, C.; Chattopadhyay, H.; Chatterjee, P.K. Thermodynamic analysis of hydrogen rich synthetic gas generation from fluidized bed gasification of rice husk. Energy 2011, 36, 4063–4071. [Google Scholar] [CrossRef]
  49. Amiri, H.; Sotoodeh, A.F.; Amidpour, M. A new combined heating and power system driven by biomass for total-site utility applications. Renew. Energy 2021, 163, 1138–1152. [Google Scholar] [CrossRef]
  50. Habibollahzade, A.; Gholamian, E.; Behzadi, A. Multi-objective optimization and comparative performance analysis of hybrid biomass-based solid oxide fuel cell/solid oxide electrolyzer cell/gas turbine using different gasification agents. Appl. Energy 2019, 233–234, 985–1002. [Google Scholar] [CrossRef]
  51. Lee, Y.D.; Ahn, K.Y.; Morosuk, T.; Tsatsaronis, G. Exergetic and exergoeconomic evaluation of an SOFC-Engine hybrid power generation system. Energy 2018, 145, 810–822. [Google Scholar] [CrossRef]
  52. Moradi, M.; Mehrpooya, M. Optimal design and economic analysis of a hybrid solid oxide fuel cell and parabolic solar dish collector, combined cooling, heating and power (CCHP) system used for a large commercial tower. Energy 2017, 130, 530–543. [Google Scholar] [CrossRef]
  53. Zhang, X.; Zeng, R.; Mu, K.; Liu, X.; Sun, X.; Li, H. Exergetic and exergoeconomic evaluation of co-firing biomass gas with natural gas in CCHP system integrated with ground source heat pump. Energy Convers. Manag. 2019, 180, 622–640. [Google Scholar] [CrossRef]
  54. National Bureau of Statistic. China Statistical Yearbook-2021; China Statistic Press: Beijing, China, 2021. [Google Scholar]
  55. Zhao, L.; Zhong, W.; Du, W. Data-Driven Robust Optimization for Steam Systems in Ethylene Plants under Uncertainty. Processes 2019, 7, 744. [Google Scholar] [CrossRef]
  56. Almpantis, D.; Zabaniotou, A. Technological Solutions and Tools for Circular Bioeconomy in Low-Carbon Transition: Simulation Modeling of Rice Husks Gasification for CHP by Aspen PLUS V9 and Feasibility Study by Aspen Process Economic Analyzer. Energies 2021, 14, 2006. [Google Scholar] [CrossRef]
  57. Su, B.; Han, W.; Qu, W.; Liu, C.; Jin, H. A new hybrid photovoltaic/thermal and liquid desiccant system for trigeneration application. Appl. Energy 2018, 226, 808–818. [Google Scholar] [CrossRef]
  58. Zhang, G.; Li, Y.; Zhang, N. Performance analysis of a novel low CO2-emission solar hybrid combined cycle power system. Energy 2017, 128, 152–162. [Google Scholar] [CrossRef]
  59. Seo, S.B.; Go, E.S.; Ling, J.L.J.; Lee, S.H. Techno-economic assessment of a solar-assisted biomass gasification process. Renew. Energy 2022, 193, 23–31. [Google Scholar] [CrossRef]
  60. Lan, W.J. Experimental Study and Simulation of Biomass Gasification Coupled with Gas Turbine for Power Generation; Tianjin University: Tianjin, China, 2013. [Google Scholar]
  61. EG&G Technical Services, Inc., Science Applications International Corporation. Fuel Cell Handbook, 6th ed.; National Energy Technology Laboratory, U.S. Department of Energy: Morgantown, WV, USA, 2002.
  62. Aguiar, P.; Adjiman, C.S.; Brandon, N.P. Anode-supported intermediate temperature direct internal reforming solid oxide fuel cell. I: Model-based steady-state performance. J. Power Sources 2004, 138, 120–136. [Google Scholar] [CrossRef]
  63. Zhang, J.; Gu, D.; Lou, Y.; Lu, J.; Li, G.; Rao, P.; Zhang, N. Configuration optimization of driving devices in a steam and power system for carbon emission reduction. J. Clean. Prod. 2023, 408, 137168. [Google Scholar] [CrossRef]
Figure 1. Flow charts of the proposed SBG-SOFC-GT-SPS system.
Processes 12 00446 g001
Figure 2. Composition of syngas cleaning system.
Processes 12 00446 g002
Figure 3. Process flow of the proposed SBG-SOFC-GT-SPS system using Aspen Plus.
Processes 12 00446 g003
Figure 4. The comparison and validation of present gasification model with the experimental results of Lan [60].
Processes 12 00446 g004
Figure 5. The comparison and validation of present SOFC model with electrochemical models [62].
Processes 12 00446 g005
Figure 6. Model of the steam turbine.
Processes 12 00446 g006
Figure 7. Effects of different gasification temperatures and S/B values on power of SOFC.
Processes 12 00446 g007
Figure 8. Effects of different SOFC operating temperatures on voltage and voltage loss.
Processes 12 00446 g008
Figure 9. Effect of valve opening of V−1 on (a) output power of SOFC and GT and (b) output power of ST.
Processes 12 00446 g009
Figure 10. Effect of valve opening of V−1 on mass flow of purchased steam.
Processes 12 00446 g010
Figure 11. Effect of valve opening of V−1 on output heat.
Processes 12 00446 g011
Figure 12. Effect of valve opening of V−1 on energy efficiency and heat-to-power ratio.
Processes 12 00446 g012
Figure 13. Composition of capital cost and cost ratio of the system.
Processes 12 00446 g013
Figure 14. Effect of valve opening of V−1 on NCF and NPV.
Processes 12 00446 g014
Figure 15. Effect of interest rate and life of the system on NPV.
Processes 12 00446 g015
Figure 16. Simulation results of SPS for maximal energy efficiency (rv1 is 0.4).
Processes 12 00446 g016
Table 2. The system configuration strategies under different valve opening ratios.
rV1rV2
Config−101
Config−210
Config−30~11−rV1
Table 3. Main design parameters of the proposed system.
ComponentParameterValue
SBG [8]Biomass flow rate25 kg/s
Gasification temperature and pressure1000 °C, 1 bar
Air-gasifying agent temperature200 °C
Steam-gasifying agent temperature500 °C
Domestic hot water80 °C
SOFC [35,36,37,38]SOFC operating temperature, TSOFC700–1000 °C
SOFC operating pressure, PSOFC1 bar
Active surface area of cell, A0.01 m2
Exchange current density at the anode, i O , A 6500 A/m2
Exchange current density at the cathode, i O , C 2500 A/m2
Effective diffusivity coefficient on the anode side, D A , e f f 0.2 cm2/s
Effective diffusivity coefficient on the cathode side, D C , e f f 0.05 cm2/s
Anode resistivity, ρ a 2.98 × 10⁻⁵ exp(−1392/Tavg) Ωm
Cathode resistivity, ρ c 8.114 × 10⁻⁵ exp(600/Tavg) Ω m
Electrolyte resistivity, ρ e 2.94 × 10⁻⁵ exp(10,350/Tavg) Ω m
Thickness of anode, L a 0.5 mm
Thickness of cathode, L c 0.01 mm
Thickness of electrolyte, L e 0.05 mm
Thickness of interconnection3 mm
Efficiency of DC to AC, η D C / A C 97%
Fuel utilization factor, u f 85%
Air utilization factor, u a 16.7%
GT [39]Air compressor pressure17 bar
Combustion chamber temperature and pressure1400 °C
Gas turbine discharge pressure1 bar
SPS [40]VHP steam101 bar, 550 °C
HP steam20.6 bar, 295 °C
LP steam4.5 bar, 150 °C
Table 4. Composition change in syngas.
ComponentOut of Gasifier RGIBBS−1
(Stream GAS1)
Out of the Sorbent
Reactor RGIBBS−2
(Stream GAS2)
Out of the Sulphur Removal
(Stream GAS5)
H2 (%)10.810.910.9
CO (%)28.028.228.2
CO2 (%)11.912.112.1
CH4 (%)1.11.11.1
H2O (%)23.223.723.7
CnHm (%)0.160.00040.0004
NH3 (ppm)429.821.620.5
H2S (ppm)571.886.20.3
Table 5. Economic data.
ItemParameter
Installation   cost   ( C i n s t a l l ) [15]
Erection, steel structures, and painting (USD) 0.25 C e q
Piping (USD) 0.05 C e q
Indirect   cost   ( C i n d i r e c t ) [15]
Engineering/consulting costs (USD) 0.03 ( C e q + C i n s t a l l )
Miscellaneous (USD) 0.02 ( C e q + C i n s t a l l )
Variable   cost   ( C V C ) [15]
Biomass fuel cost [54]40.09 USD/t
Purchased steam cost [55]VHP: 40.41 USD/t; HP: 19.13 USD/t; LP: 18.43 USD/t
Fixed   cost   ( C F C ) [15]
Property, taxes, and insurance (USD) 0.02 C t o t a l
Labor cost (USD) 0.01 C t o t a l
Operation and maintenance cost (USD) 0.06 C t o t a l
Income
Electricity / mechanical   work   income   ( P e , P w ) [56]0.128 USD/kWh
Steam   income   ( P s ) [55]VHP: 40.41 USD/t; HP: 19.13 USD/t; LP: 18.43 USD/t
DHW   income   ( P D H W ) [57]0.036 USD/kWh
Other
Unit   CO 2   penalty   cost   ( c C O 2 ) [46]10 USD/t
Interest rate (i) [58]8%
Life of the system (n)15 years
Table 6. Validation results for SOFC.
Literature [61]Model ResultsError
Input
Anode inlet gas component (%)H2 27, CO 5.6, CH4 10.1,
H2O 27.9, CO2 23.1, N2 6.2
H2 27, CO 5.6, CH4 10.1,
H2O 27.9, CO2 23.1, N2 6.2
Anode inlet temperature (K)809.15809.15
Cathode inlet temperature (K)1094.471094.47
Output
Anode exhaust gas component (%)H2 11.6, CO 7.4, H2O 50.9,
CO2 24.9, N2 5.1
H2 11.1, CO 8.1, H2O 51.4,
CO2 24.3, N2 5.1
3.4%
Stack exhaust temperature (K)11071158.544.7%
Voltage (mV)7007486.8%
Table 7. Verification of header temperature for SPS.
Pressure of HeaderTemperature of Header (°C)
Literature [63]Present ModelError
VHP5205200
HP349349.60.17%
MP184186.81.52%
Table 8. Steam demands of the SPS system.
DemandPressure (bar)Amount (kg/s)
VHP1013.6
HP20.640.6
LP4.554.6
Table 9. Capacity of the SBG-SOFC-GT-SPS system.
ParameterValue
Biomass flow rate (kg/s)25
Solar heat collecting system (MW)188.4
SOFC capacity (MW)284.8
GT capacity (MW)80.4
GB capacity (MW)295.4
HRSG capacity (MW)28.95
ST1 capacity (MW)5.6
ST2 capacity (MW)6.0
Table 10. The comparative analysis results for the proposed system and the reference system [18,59].
SBG-SOFC-GT-SPS CHP (rv1 = 0.4)SBG CHP [60]SOFC-GT CCHP [18]
NPV (kUSD)897,35056,815
LCOE (USD/kWh)0.160.060.24
Disclaimer/Publisher’s Note: The statements, opinions and data contained in all publications are solely those of the individual author(s) and contributor(s) and not of MDPI and/or the editor(s). MDPI and/or the editor(s) disclaim responsibility for any injury to people or property resulting from any ideas, methods, instructions or products referred to in the content.

