
Gout Staging Diagnosis Method Based on Deep Reinforcement Learning
1
School of Computer Science and Technology, Harbin University of Science and Technology, Harbin 150080, China
2
Heilongjiang Province Cyberspace Research Center, Harbin 150090, China
*
Author to whom correspondence should be addressed.
Processes 2023, 11(8), 2450; https://doi.org/10.3390/pr11082450
Submission received: 4 May 2023
/
Revised: 24 July 2023
/
Accepted: 24 July 2023
/
Published: 15 August 2023
(This article belongs to the Special Issue Application of Artificial Intelligence in Medical Assisted Decision System)
Abstract
:In clinical practice, diseases with a prolonged course and disease characteristics at the time of diagnosis are often classified into specific stages. The precision of disease staging significantly impacts the therapeutic and curative outcomes for patients, and the diagnosis of multi-clinical-stage diseases based on electronic medical records is a problem that needs further research. Gout is a multi-stage disease. This paper focuses on the research of gout and proposes a staging diagnosis method for gout based on deep reinforcement learning. This method firstly uses the candidate binary classification model library for accurate diagnosis of gout, and then corrects the results of the binary classification through the set medical rules for diagnosis of gout, and then uses the machine learning model to diagnose different stages of corrected accurate data. In the course of the experiment, deep reinforcement learning was introduced to solve the hyperparameter tuning problem of the staging model. Through experiments conducted on 24,872 electronic medical records, the accuracy rate of gout diagnosis was found to be 90.03%, while the accuracy rate for diagnosing different stages of gout disease reached 86.85%. These findings serve as a valuable tool in assisting clinicians with accurate staging and diagnosis of gout. The application of deep reinforcement learning in gout staging diagnosis demonstrates a significant enhancement in diagnostic accuracy, thereby validating the effectiveness and feasibility of this method.
1. Introduction
In recent years, with the rapid development of Internet technology, the penetration of mobile Internet into medical treatment has led to the rapid progress of Internet Healthcare. As a rigid industry, under the concept of Internet Healthcare, the traditional medical service industry has changed and new challenges have emerged. At present, electronic medical records have gradually replaced handwritten medical records as a carrier containing a large amount of medical information. At the same time, clinical diseases with long course and phased characteristics are often given specific stages at the time of diagnosis, and it is an urgent problem to diagnose multi-clinical-staged diseases based on electronic medical records.
In the actual consultation process, clinicians often stage diseases that are likely to persist, deteriorate progressively and may lead to premature death in the clinical phase. For most diseases, early-stage disease is relatively stable and has a high clinical cure rate, while late-stage disease progresses rapidly and has a low cure rate. If patients can be detected and treated at an early stage of disease development, the clinical setting, patients often suffer from multiple comorbidities rather than a single disease. Therefore, the prime problem that clinical physicians need to solve before staging is how to accurately diagnose a certain disease. This paper breaks down the process of gout staging diagnosis into two steps based on the real clinical diagnosis process: diagnosis first, then staging. Consequently, the medical record data set used for gout staging diagnosis can be further concentrated, ensuring that it comes from patients who have already been diagnosed with gout. This approach reduces the interference of medical record data from undiagnosed patients on the staging task and improves the precision of the diagnosis.
This paper focuses on the problem of gout staging diagnosis for patients in the context of Internet Healthcare. It can be considered a multi-classification problem in machine learning. We propose a gout staging diagnosis method based on deep reinforcement learning. Specifically, we first use a “candidate binary classification model library” to perform binary classification on whether gout disease is diagnosed, and the binary classification results are divided into two categories: “healthy” and “diseased.” Subsequently, using medical domain expertise provided by doctors, namely gout diagnosis rules, we screen out the feature values that have a decisive impact on gout and find the data set in the “healthy” data set that shows “disease” based on these feature values. We then combine these data sets with the “diseased” data set and finally use a staging diagnosis model to model the “diseased” data set. Moreover, we introduce deep reinforcement learning into the model to perform automated tuning, further improving the accuracy of gout staging diagnosis prediction.
This paper first describes the current state of machine learning applications in the medical field as well as the concept of reinforcement learning and commonly used algorithms as the background and technical foundation for proposing the method. The paper then provides a detailed introduction of the specific implementation process of the gout staging diagnosis method based on deep reinforcement learning. The diagnosis results of this method are then presented in detail. Finally, the paper concludes with a summary of the research and suggestions for the next steps in furthering this work.
2. Related Work
With the popularization of electronic medical records, a large amount of medical information is contained in medical data with text and numbers as the main data type. The combination of artificial intelligence and medical treatment has become a new research field. It is possible to use machine learning classification models to realize the diagnosis of multi-clinical-stage diseases. With the development of machine learning models, the types and complexity of models are gradually increasing, and the optimization of models and the adjustment of hyperparameters have become two major difficulties. The combination of various parameters makes the number of rounds of parameter tuning increase exponentially. If manual parameter tuning is used, it will consume a lot of training time and human resources. This paper combines deep learning with the environment [1]. Utilizing this feature, it can help the machine learning and uses the strong perception ability of deep learning and the strong decision-making ability of reinforcement learning to help the gout staging diagnosis model automatically adjust parameters in repeated decisions and finally obtain a super parameter set, thereby improving the accuracy of disease stage diagnosis and prediction.
2.1. Applications of Machine Learning in the Medical Field
With the further development of machine learning algorithms, their applications in the medical field have gradually become more and more extensive. Among these applications, assisting doctors in disease diagnosis has become the main direction of combining machine learning and the medical industry. Many scholars have made contributions in this field. Li et al. [2] proposed the Xrare for rare disease diagnosis; this method uses GBDT to sort causative genetic variants of rare diseases to improve the accuracy of the clinical diagnosis of rare diseases. However, the current method still has some limitations. The Monarch Initiative is continuing to develop and integrate other models, which will continue to improve the accuracy of the method. Hsu et al. [3] proposed the GA-CFS algorithm to determine the best eigenvalue set for different cancer stages in view of the characteristics of breast cancer, cervical cancer and lung cancer that present different clinical manifestations at different stages of the disease. The results have achieved good prediction results on DT, SVM and MLP-NN models. Weng et al. [4] used the deep learning model CafeNet to recognize Chinese herbal medicine pictures after preprocessing, such as the deformation and brightening of Chinese herbal medicine pictures, and the recognition accuracy reached 96%.
In addition to the contributions of machine learning and deep learning models in the medical field, reinforcement learning also has extraordinary performance in disease diagnosis and medical imaging tasks. Komorowski et al. [5] explored the optimal treatment strategies of intravenous fluids and vasopressors in the treatment of sepsis, introducing reinforcement learning to address medication decisions in personalized sepsis. This method divides intravenous and vasopressor drugs into 25 combined doses, rewarded by whether the patient survives within 90 days of admission. Validated on two ICU databases, MIMIC-III and eRI, the value of the optimal treatment strategies determined by reinforcement learning reached more than 80%. However, the current research has limitations. Although the data set is large, the data quality is poor and the degree of missing is high. Future research work will expand the high-quality data set and continue the experiment. Ghesu et al. [6] proposed the use of deep reinforcement learning to analyze the key points of medical images in anatomy. They use a multi-scale analysis method to capture the key points in 3D images so as to solve the impact of uneven image quality on diagnostic results and reduce radiation damage. Physicians view a large workload of 3D-CT. Finally, this method was verified on 49 key points in 5043 3D-CT images, and the average detection accuracy reached 2.78 mm. The biggest challenge at present is to scale to anatomical structures with a larger amount of data. In future work, we will address this limitation in two steps. First, we will design a search mechanism to locate specific parts and then further optimize the search model.
2.2. Reinforcement Learning
Reinforcement learning (RL) is a research field of machine learning by using a Markov decision process. It is designed to enable the agent to learn decision-making strategies by interacting with the environment in a way that maximizes cumulative rewards. In reinforcement learning, an agent adjusts its behavior by observing feedback from the environment to maximize the reward over a long-term period.
As shown in Figure 1, the agent investigates the current environment and executes the strategy function π(s) according to s to generate action a. Then, the environment executes the transformation rule P, which is converted from the current state s to s′, and generates a reward r to let the agent update the strategy, and the agent makes the next action according to the latest strategy, and so on, until it is in a certain state, and the agent can make the most valuable action [1].
Reinforcement learning algorithms can be divided into two categories: model-based and model-free. Modeled reinforcement learning algorithms rely on a model of the environment to make predictions. Model-free reinforcement learning does not make prior judgments but finds the optimal strategy in constant attempts. For example, the classic algorithm Q-learning in reinforcement learning belongs to the model-free category.
The Q-learning algorithm uses a Q table to estimate the state and value. A Q table is a two-dimensional table Q(S,A) of state S and action A; each Q value represents the reward obtained by choosing action in a certain state and when selecting an action, is selected from this table that maximizes the Q value of the current [7]. The goal of Q-learning algorithm training is to use the data stored in the Q table to find the strategy for obtaining the maximum cumulative reward time; is shown in the following Formula (1).
means that under the premise of the policy function, the cumulative reward is obtained by the agent in the process of executing action in state until exiting the loop. The calculation function of follows the Bellman equation, and the corresponding formula is shown in (2).
where is the discount factor, which is used to attenuate the reward at time t + 1.
Due to the real-time update of the Markov process, the Q table also needs to be updated in real time [8]. The update method of the Q table is shown in Formula (3).
The gout staging diagnosis model is a problem that requires a large number of model parameter configurations. A large number of hyperparameters need to be tuned effectively, which is usually an extremely complicated process. Reinforcement learning methods can provide a new solution for tuning hyperparameters through their ability to self-learn and adapt to the environment. By interacting with the environment, the agent continuously self-optimizes its strategy to achieve better results, which is more efficient and accurate than traditional manual parameter tuning methods.
In this topic, the state space is composed of all the hyperparameter configuration spaces included in the classification model, and the behavior space is the behavior set that changes the hyperparameter values in the hyperparameter combination. The specific mapping relationship is as follows:
State S: The state is an abstract description of the environment by the agent. In the problem of hyperparameter tuning, the state space refers to the hyperparameter set composed of all hyperparameter configuration spaces in the classification model, which is the state S.
Action A: An action is an operation performed by the agent after examining the state of the environment. In the hyperparameter tuning problem, an action refers to selecting a parameter space from the hyperparameter set at a certain moment t to adjust its value. For example, for XGBoost, each action of the max_depth parameter of the tree’s maximum depth is to increase or decrease the max_depth within the range of available values; that is, within the acceptable range of hyperparameters, each action is a set of hyperparameters, A, and the parameter value is changed.
Reward R: After the agent chooses an action according to the environment, the environment will reward the agent according to this action, and the agent will adjust the next choice according to the reward situation of this feedback. In this project, the reward R is the k-fold value of the staged model at the two moments before and after, the k-fold value of the staged model at time on the hyperparameter combination is , the k-fold value of the staged model at time t on the hyperparameter combination is , and the reward at time is .
The learning ability of the agent in the traditional model-free reinforcement learning method depends on the function approximation ability, and the powerful function approximation ability of deep learning provides convenience for the learning process of the agent in the reinforcement learning, so the deep reinforcement learning (DRL) [9,10] which combines the advantages of both parties’ reinforcement learning has become a new research hotspot. This paper uses the characteristics of the agent in DRL to perceive the environment more efficiently, make decisions to solve the problem of more and more hyperparameters in the staging diagnosis model and then efficiently realize the diagnosis of gout staging.
3. Gout Staging Diagnosis Method Based on Deep Reinforcement Learning
3.1. Overall Process Design
In view of the problem background and related work introduced above, the flow chart of the gout staging diagnosis method designed in this paper is shown in Figure 2.
The patient’s electronic medical record is derived from the hospital’s electronic medical record system, and the physical examination data such as pain degree, height and weight and biochemical test results such as hematuria in the electronic medical record are used as an eigenvalue set. Firstly, the medical record data are preprocessed.
Then, the multiple diseases diagnosed by doctors are simplified into two categories, confirmed or “healthy”, and the “candidate binary classification model library” on the predicted medical records is used to predict whether to diagnose gout. The samples diagnosed as “disease” in the binary classification are , and the samples diagnosed as “healthy” are . The gout diagnosis rules provided by the doctor are used to screen the characteristic values that have a decisive impact on the diagnosis of gout. The set of such characteristic values is set as F′, the health samples are , and the data set is selected and displayed as gout on F′. Then, is combined with to form the samples for multi-classification. The specific pseudo-code is shown in Table 1.
The stage of gout is predicted on , and deep reinforcement learning is introduced to solve the parameter adjustment problem of the stage model so as to realize the stage diagnosis of gout.
3.2. Data Preprocessing
Considering that mistakes in the manual entry of electronic medical records may lead to some incorrect data in the patient’s electronic medical record, we set up data cleaning rules based on common sense in the medical field. For example, the patient’s weight range during physical examination should be within the range of 20 kg to 150 kg, to clean the electronic medical records. Afterwards, the eigenvalues of the electronic medical records are processed, including two directions of absence analysis and correlation analysis.
We first obtain the missing degree of each eigenvalue in the existing eigenvalue set through the calculation of the missing degree, and then determine the threshold of the missing degree and use this threshold as the limit to classify the eigenvalues, which are mainly divided into “categories with more missing values” and “Few classes with missing values”. The threshold we set for this experiment is 70%. For eigenvalues with a missing degree greater than 70%, we delete them. For the eigenvalues with a missing degree less than 70%, the missing data can be divided into completely random missing, random missing and non-random missing according to different reasons for missing. The specific complete random missing value means that the missing value of the feature value is not related to other feature values, such as the missing heart rate feature value; random missing means that the missing value is random, and the missing of the data depends on other feature values, such as underage smoking. Most of the time feature values are null, and this feature value is related to the patient’s age. Non-random missing means that the missing values in the data set do not appear randomly, but there is a certain pattern. For example, the number of abortions in young female patients is partially missing. This characteristic value involves patient privacy, and some patients can choose not to fill in. For the eigenvalues of the first two missing cases, we fill them in by estimating them. For non-randomly missing eigenvalues, we use the random-forest-based missing value filling method to fill. The specific pseudo-code is shown in Table 2.
In order to further improve the accuracy of model prediction, we comprehensively consider the two aspects of the chi-square test and discrete category interaction information to analyze the correlation degree of the feature value set. The eigenvalues with low correlation are deleted to obtain the feature set after preliminary optimization.
The chi-square test method is a hypothesis testing method, which mainly compares the correlation analysis of two or more sample rates and two categorical variables. The test formula is as follows (4):
where represents the actual value and represents the expected value. is the absolute size of the deviation between the actual value and the expected value, and the larger the , the greater the influence of the characteristic value on the stage of gout. For example, in this topic, the quantitative assignment of gout is one of the characteristic values. We assume that the quantitative assignment of gout has no correlation with the results of gout staging. According to the distribution of sample data, in each category where the rows and columns cross, the expected value is calculated, that is (Sum of this row * Sum of this column)/Total amount of data set. Finally, the expected value and actual value are substituted into the Formula (4) to calculate the chi-square value. The larger the chi-square value, the greater the impact of gout quantification on the results of gout staging, and vice versa, the smaller the impact.
Discrete category interaction information is an indicator used to measure the degree of interaction between features in a classification model. It can help us understand the impact of input features on model prediction and select the most important features to improve the performance of the model. The test formula is shown as (5).
If are mutually independent variables , the above is 0, so the larger the value of becomes, the correlation between the two variables is becoming bigger and bigger.
Considering the chi-square test and the interactive information results of discrete categories, we sort the result values from large to small. The larger the result value, the greater the impact of the feature value on the gout stage, and we reserve the greater influence on the gout stage. By deleting the eigenvalues that have little influence on the gout staging, a further optimized eigenvalue set can be obtained, which is finally used for the diagnosis and prediction of gout staging.
Finally, the gout staging data of the electronic medical records of patients diagnosed in the hospital were counted; a total of 4043 “healthy” patient medical records were obtained, and a total of 20,829 electronic medical records were diagnosed as gout, Among them, 8115 were in the chronic arthritis period, 1800 were in the acute arthritis period, and 10,914 were in the intermittent period., and the distribution of each sample in the specific data set is shown in Table 3.
3.3. Gout Diagnosis
In order to better predict the stage of gout, we first predict whether gout is diagnosed or not. This is a binary classification problem. The purpose of this is to reduce the interference of “healthy” data sets on the prediction of the gout stage. In order to better predict whether gout is diagnosed or not, the concept of the “candidate binary classification model library” is proposed. Multiple binary classification models are executed at the same time, and then the most suitable binary classification model is selected according to the actual test results. Commonly used binary classification algorithms include logistic regression, K nearest neighbors (KNN), support vector machines (SVM), and more. In addition to the mainstream binary classification algorithm, random forest and XGBoost also perform well in classification problems. This article uses KNN, SVM and XGBoost for the “candidate binary classification model library”.
K nearest neighbor (KNN) is based on the sample set containing eigenvalues and labels, calculates the distance between the eigenvalues of new samples without labels and the eigenvalues of samples with existing labels, and then selects the nearest sample. The corresponding label is used as the label of the new sample. In this paper, Euclidean distance is used to calculate the similarity between eigenvalues; the coordinates of eigenvalue A of the existing label sample on the two-dimensional plane are and the coordinates of the eigenvalue A of the new sample on the two-dimensional plane are . The distance between them is calculated as Formula (6).
Support vector machines (SVM) are a class of models that classify data in a supervised learning manner. The basic idea is to map the sample space to the high-dimensional feature space so that the optimal hyperplane can be found in the feature space for classification [11]. The optimal hyperplane refers to the hyperplane with the largest classification interval. In the sample space, the calculation method of distance l from any point x to the hyperplane is as follows (7):
The linear equation that divides the hyperplane is assumed to be , where is the normal vector, which determines the direction of the hyperplane, and b is the displacement term, which determines the distance between the hyperplane and the source point.
XGBoost is an optimized distributed gradient boosting model. Compared with the gradient boosting framework, the processing speed and efficiency have been greatly improved, and it is suitable for binary or multi-classification problems of large-scale data. The objective function of XGBoost is Formula (8).
where n is the number of medical record samples, is the true diagnosis of the i-th medical record, is the predicted diagnosis of the i-th sample by the model, represents the kth decision tree, each classification process is the process of learning a new and l is the loss function. XGBoost is characterized by approximately expressing the loss function through the second-order Taylor expansion to ensure that the of each decision tree is as close as possible to the real ; is the regularization item, which is also the complexity of the decision tree [12]. The specific expression is the Formula (9).
T is the number of leaf nodes, uses to prune when there are too many leaf nodes and controls the overfitting problem that occurs when the cumulative sum is too large. The objective function is Formula (10).
where is the value of the leaf node where the sample falls into the ith regression tree in the optimal case. The sum of the predicted scores of the corresponding leaf nodes in each decision tree is the predicted value of the sample.
The input variables of the Obj objective function include the medical record data set participating in the training, the number and depth of the decision tree, the minimum value of the leaf node weight and the learning rate.
The decision variable for minimizing the objective function Obj is determined by the split point and split rules of the decision tree. Specifically, at each node, XGBoost needs to select an optimal feature as the basis for splitting. In order to determine the optimal feature, XGBoost calculates the gain of each feature and selects the feature with the largest gain, as the splitting feature is one of the decision variables. After selecting the best features, XGBoost needs to determine how to distribute the samples to the left and right child nodes. The decision variables include the threshold of the split point and the direction of the split. After selecting the best features and splitting rules, XGBoost can construct a subtree with the minimum objective function value on each node, thereby gradually optimizing the structure of the entire decision tree.
The principle of the “candidate binary classification model library” is to use multiple binary classification machine models to train simultaneously on the medical records and use the best performing binary classification model as the final diagnostic model.
On the basis of the binary classification results, the gout diagnostic rules provided by doctors are introduced, and the feature value set and its conditions that have a decisive impact on the prediction results are selected from the feature value set to calibrate the binary classification results. The data set S2 diagnosed as “healthy” after the above two classifications is found, the data S2’ that meets the diagnosis conditions of F1 are found, and then S2’ is added to the data set “diagnosed” as gout to form a data set S3 for multi-classification. For example, the score f1 of the gout quantitative assignment table has a decisive impact on whether gout is diagnosed, and f1 is the set of feature values of the detection fields corresponding to the table. The medical record data that meet the diagnosis conditions in F1 in the “healthy” data set are found, and this part of the data is added to the data set “diagnosed” as gout to form the original data set S3 for further staging.
3.4. Deep Reinforcement Learning Model for Gout Staging Diagnosis
After being diagnosed and calibrated by the “candidate binary classification model library”, the specific stage diagnosis of gout is carried out. In order to realize automatic parameter tuning of multi-classification models, we introduce deep reinforcement learning to solve the problem of parameter tuning of staging models.
Reinforcement learning is based on the Markov process. In the Markov process, the agent selects an action to execute according to the state of the current environment. After the action is executed, the environment state will change and return the reward value of this action to the agent. The agent will choose the next action according to the reward value. In the hyperparameter tuning problem of the classification model, the mapping between the problem and the Markov process is established. In this paper, the state space is composed of all the hyperparameter configuration spaces contained in the classification model, and the behavior space is the hyperparameter value in the hyperparameter combination of the collection of behaviors.
The Markov process of the specific hyperparameter tuning problem is as follows:
- According to the characteristics of the staging diagnosis model currently used, the agent forms a hyperparameter set of all hyperparameter configuration spaces, that is, the current state at time t. Assuming that there are n hyperparameters in the hyperparameter set, the state is .
- A certain hyperparameter of the hyperparameter space set St is adjusted; that is, use the ε-greedy algorithm to make an action selection and then obtain the F1-Score value of the staging diagnosis model under the hyperparameter combination at this moment, which is recorded as , and set the staging at the previous moment. The F1-Score value of the diagnostic model is , then the reward value generated by the environment at time t is . State transitions to after action is complete.
- The above steps are repeated until the cumulative discount reward is the largest.
Every action of the agent will be rewarded by the environment, and the sum of the accumulated discount rewards obtained by the agent after the learning is over satisfies Formula (11) [13]:
represents the sum of cumulative discounted rewards; is the time step, starting from 0; is the discount factor, ranging from 0 to 1; and rt represents the immediate reward obtained by the agent at time step t. The sum of cumulative discounted rewards in the formula represents the sum of rewards obtained by the agent from the initial state, performing a series of actions until the end. The immediate reward at each time step is multiplied by the discount factor ; represents the attenuation of future rewards, because the reward after each new action is executed cannot be determined. If the reward is not discounted for each time, the total reward sum will approach infinity with the increase in time, making learning enter an endless loop.
The accumulation process of the maximum reward sum is inseparable from the value of each moment of behavior. The mapping of the agent from the environment state to the behavior at each moment is called the strategy function , and the optimal strategy satisfies Formula (12):
The process of obtaining the optimal policy can be recorded through the action value function. The action value function, denoted as , represents the cumulative reward expectation obtained after taking an action a under a certain state s using the policy function . The value function of the optimal action needs to satisfy Formula (13):
The process of the agent finding the optimal strategy is the process of optimizing the action value function. In order to obtain the optimal action value function, we use the deep Q-network (DQN for short) [14]. The classic Q-learning algorithm is usually only suitable for situations where the state space is relatively simple, and its performance may be poor in scenarios where the state space is relatively complex, mainly because in complex state spaces, Q-learning produces Q. The number of tables will be very large, resulting in very slow convergence of the algorithm, and it is difficult to find the optimal solution. Deep neural networks can better handle high-dimensional state spaces by learning hierarchical representations of state features. DQN is like the Q-learning algorithm, which requires a Q table to record the learning process. DQN uses the neural network instead of , where is the weight of the network, and implements the update according to Formula (14)
In the hyperparameter tuning problem, in order to prevent the waste of learning resources caused by choosing the same behavior every time, this paper uses “exploration” in the selection of behavior. Exploration means that the agent will first think about the environment and then take actions, so as to avoid repeated action choices. In this paper, the ε-greedy algorithm is used to realize the exploration. The ε-greedy greedy algorithm is defined as Formula (15):
In Formula (15), is a very small value, and the value of will decrease with time. Therefore, according to the ε-greedy algorithm, actions will be randomly selected at the initial stage of training. When the number of trainings increases, the Q network can already reflect the expected value of the action, so the action will be determined by the Q network. The ε-greedy algorithm can ensure that the large action of the value function is selected first and avoid the occurrence of repeated actions.
In order to better train the Q network, this paper uses the memory pool D to save the path of each exploration and updates the Q network after reaching the specified number of steps. According to the above process, the pseudo-code of the staged diagnosis model algorithm based on deep reinforcement learning designed in this paper is shown in Table 4:
4. Experiment and Result Analysis
4.1. Evaluation Index
Since the diagnosis of gout and the stage diagnosis of gout in this paper belong to the classification problem, in order to verify the classification results, this paper introduces four evaluation indicators of Accuracy, Precision, Recall and F1-Score.
Accuracy refers to the percentage of the predicted correct results in the total samples, and its formula is shown in (16)
Among them, represents a positive sample that is correctly predicted, represents a negative sample that is correctly predicted, represents a positive sample that is incorrectly predicted, and represents a negative sample that is incorrectly predicted.
Precision refers to the proportion of samples that are predicted to be positive and the actual result is also positive. In this topic, the accuracy of the diagnosis task refers to the proportion of the amount of data that is predicted to be diagnosed as gout, and the actual result is also diagnosed as gout. The accuracy rate of the staging task refers to the proportion of the amount of data predicted as a certain staging that the actual result is also the proportion of the staging. The formula is shown in (17)
The recall rate (Recall) refers to the proportion of the samples whose predicted results are also positive among the samples whose actual results are positive. In this topic, the recall rate of the diagnosis task refers to the proportion of the predicted results of the confirmed gout disease in the data set whose actual result is the diagnosis of gout disease. The result predicted in the data set is also the proportion of this stage. and its formula is shown in (18)
F1-Score is the harmonic mean of the precision rate and the recall rate, so that the precision rate and the recall rate can reach the highest and maintain balance at the same time, and its formula is shown in (19)
4.2. Experimental Results and Analysis
This paper conducts an experiment on gout among 24,872 medical records provided by a hospital in Shandong. Since the field types of electronic medical records are mainly numerical types, this paper uses a binary classification algorithm for numerical data to determine the diagnosis of gout. Commonly used binary classification algorithms include logistic regression, K nearest neighbor (KNN), support vector machine (SVM), etc. In addition to the mainstream binary classification algorithm, Random Forest and XGBoost also perform well in classification problems. In this paper, KNN, SVM and XGBoost are used in the “candidate binary classification model library”, and the performance effects are shown in Table 5.
It can be seen from the results in the above table that the two classification effects of the three classification models of KNN, SVM and XGBoost on the four indicators are all higher than 80%. Among them, the XGBoost model has a better classification effect than the other two models, and the four indicators all reach more than 89%.
In the prediction of gout stage diagnosis, we mainly use the XGBoost–DRL hybrid model based on deep reinforcement learning to realize the stage prediction of gout patients.
XGBoost hyperparameters can be divided into three categories: general parameters, booster parameters and learning target parameters. The XGBoost–DRL hybrid model mainly performs automatic parameter adjustment on the second type of booster parameters. Booster parameters are used to control the performance and calculation consumption of the model, and the list of hyperparameters included in it is shown in Table 6.
The XGBoost model without parameter adjustment was compared with the XGboost–DRL hybrid model using deep reinforcement learning to realize automatic parameter adjustment. To verify the accuracy of the XGBoost–DRL model, the specific performance effect is shown in Figure 3.
Through the above analysis, it can be seen that the classification effect of the three types of gout stages after parameter adjustment has been significantly improved, and the three evaluation dimensions of precision, recall and F1-Score have all increased by about 10%.
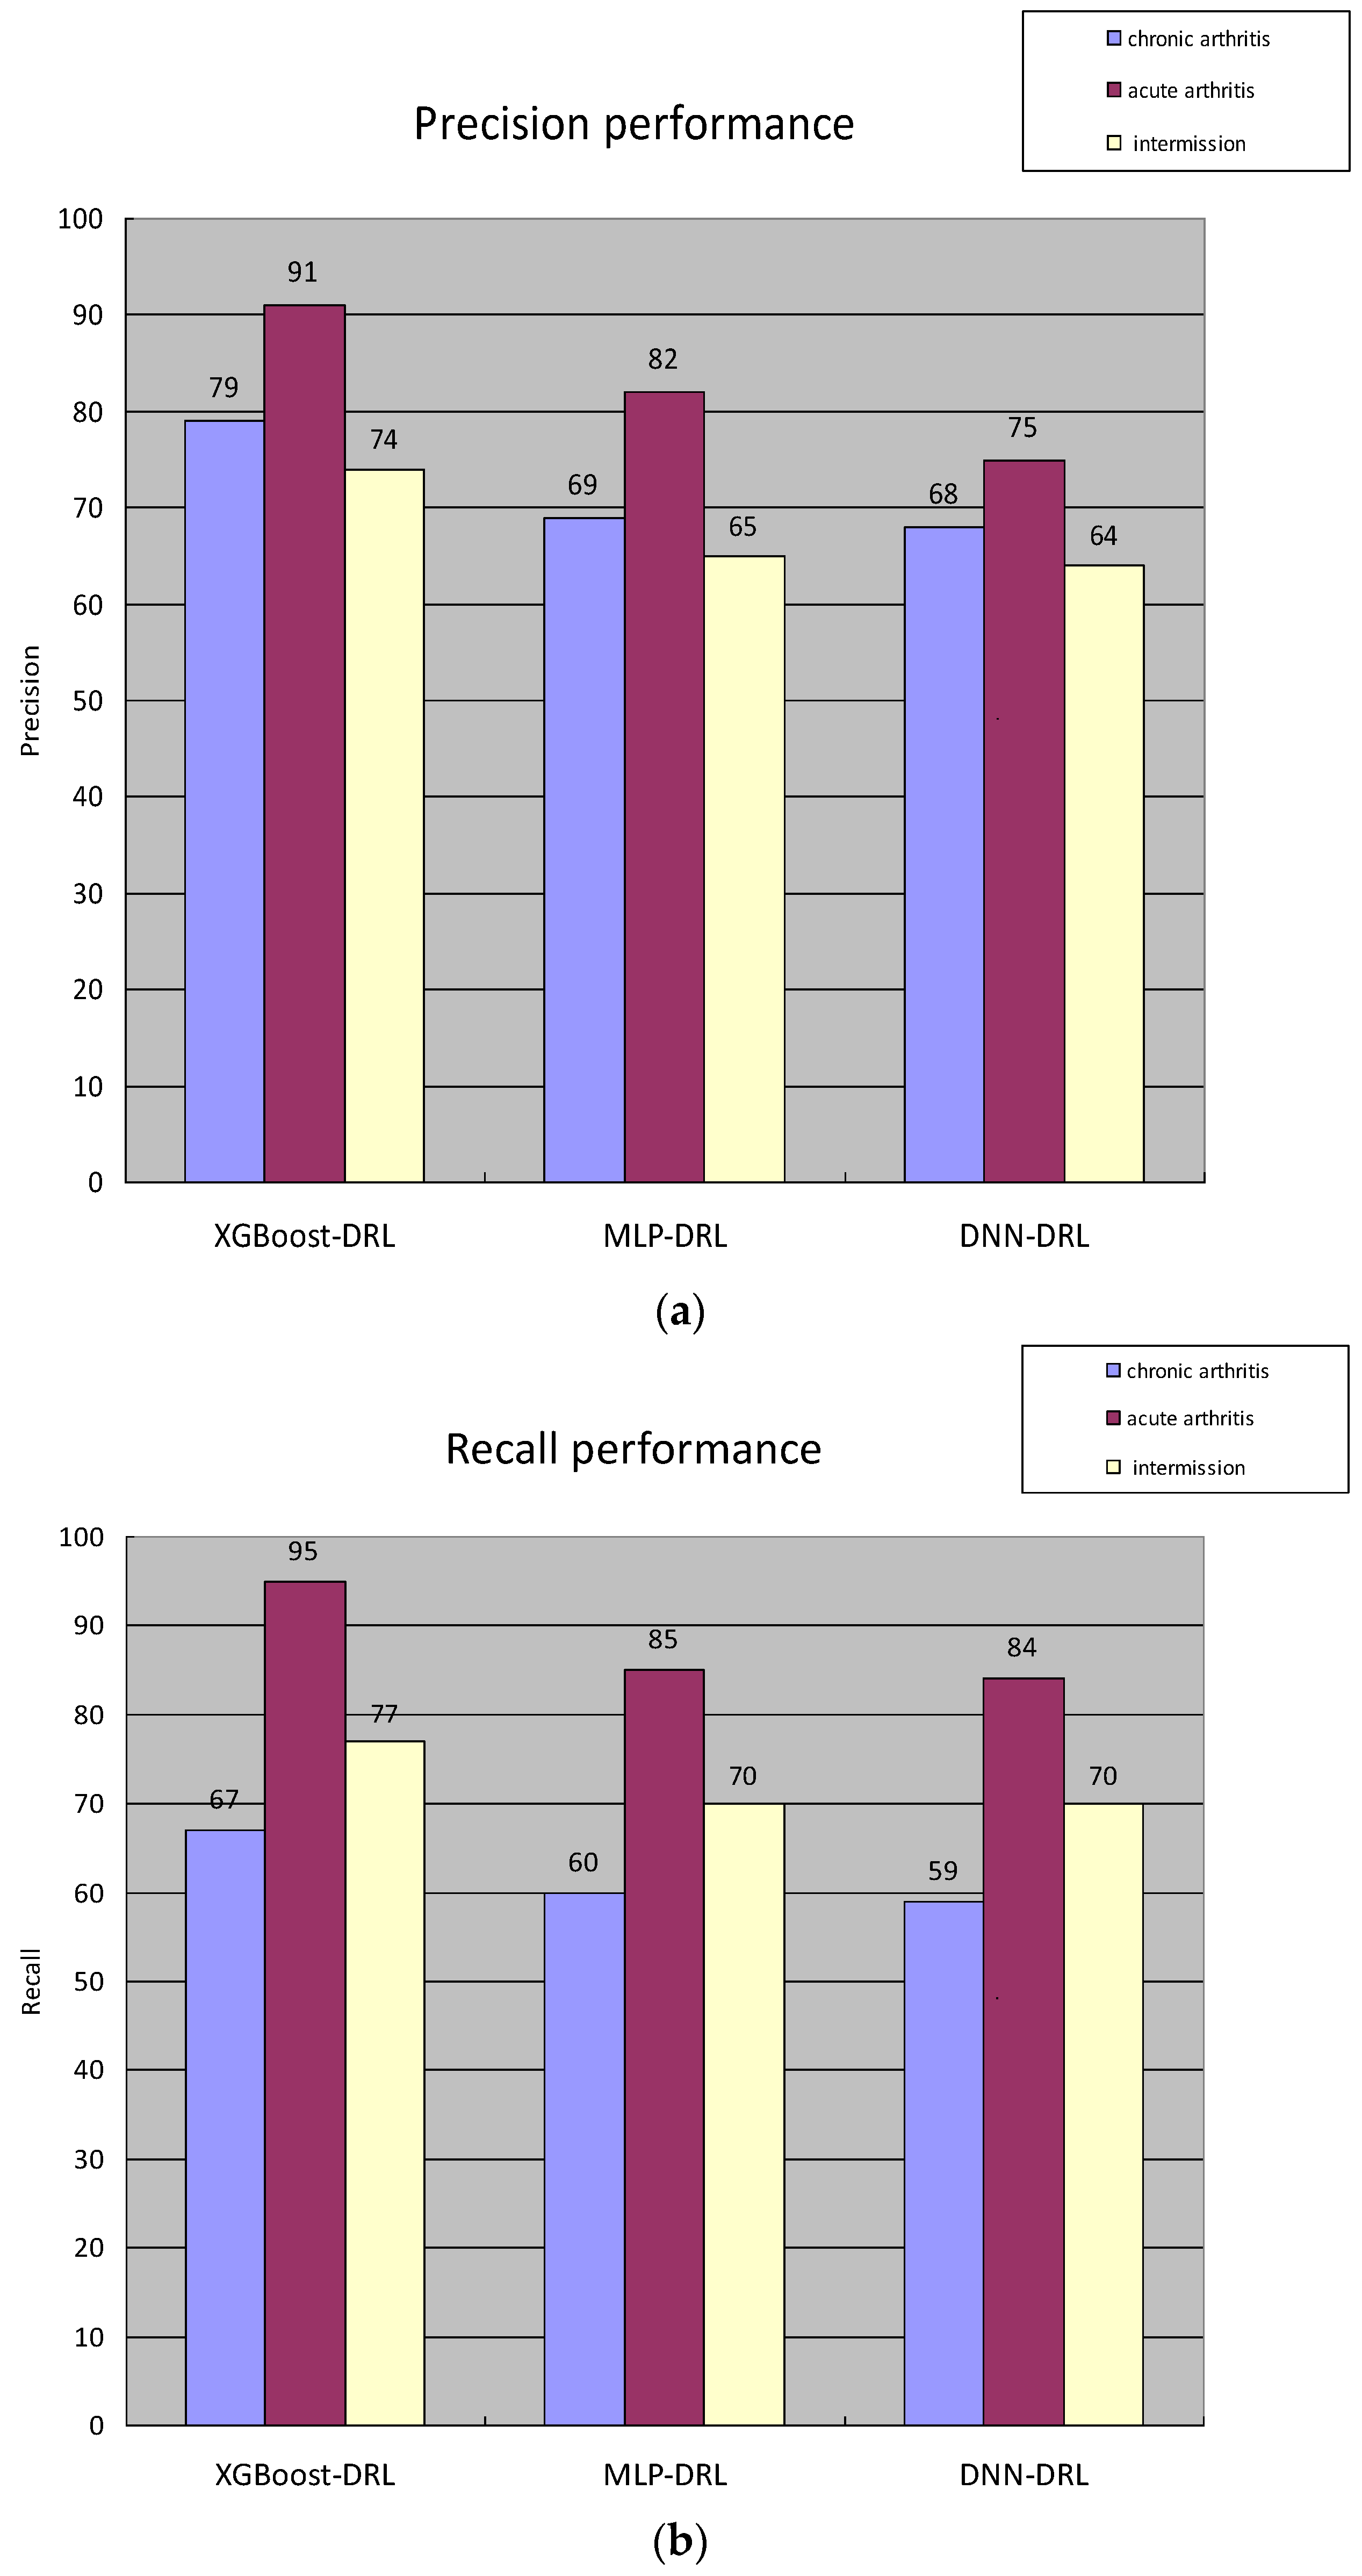
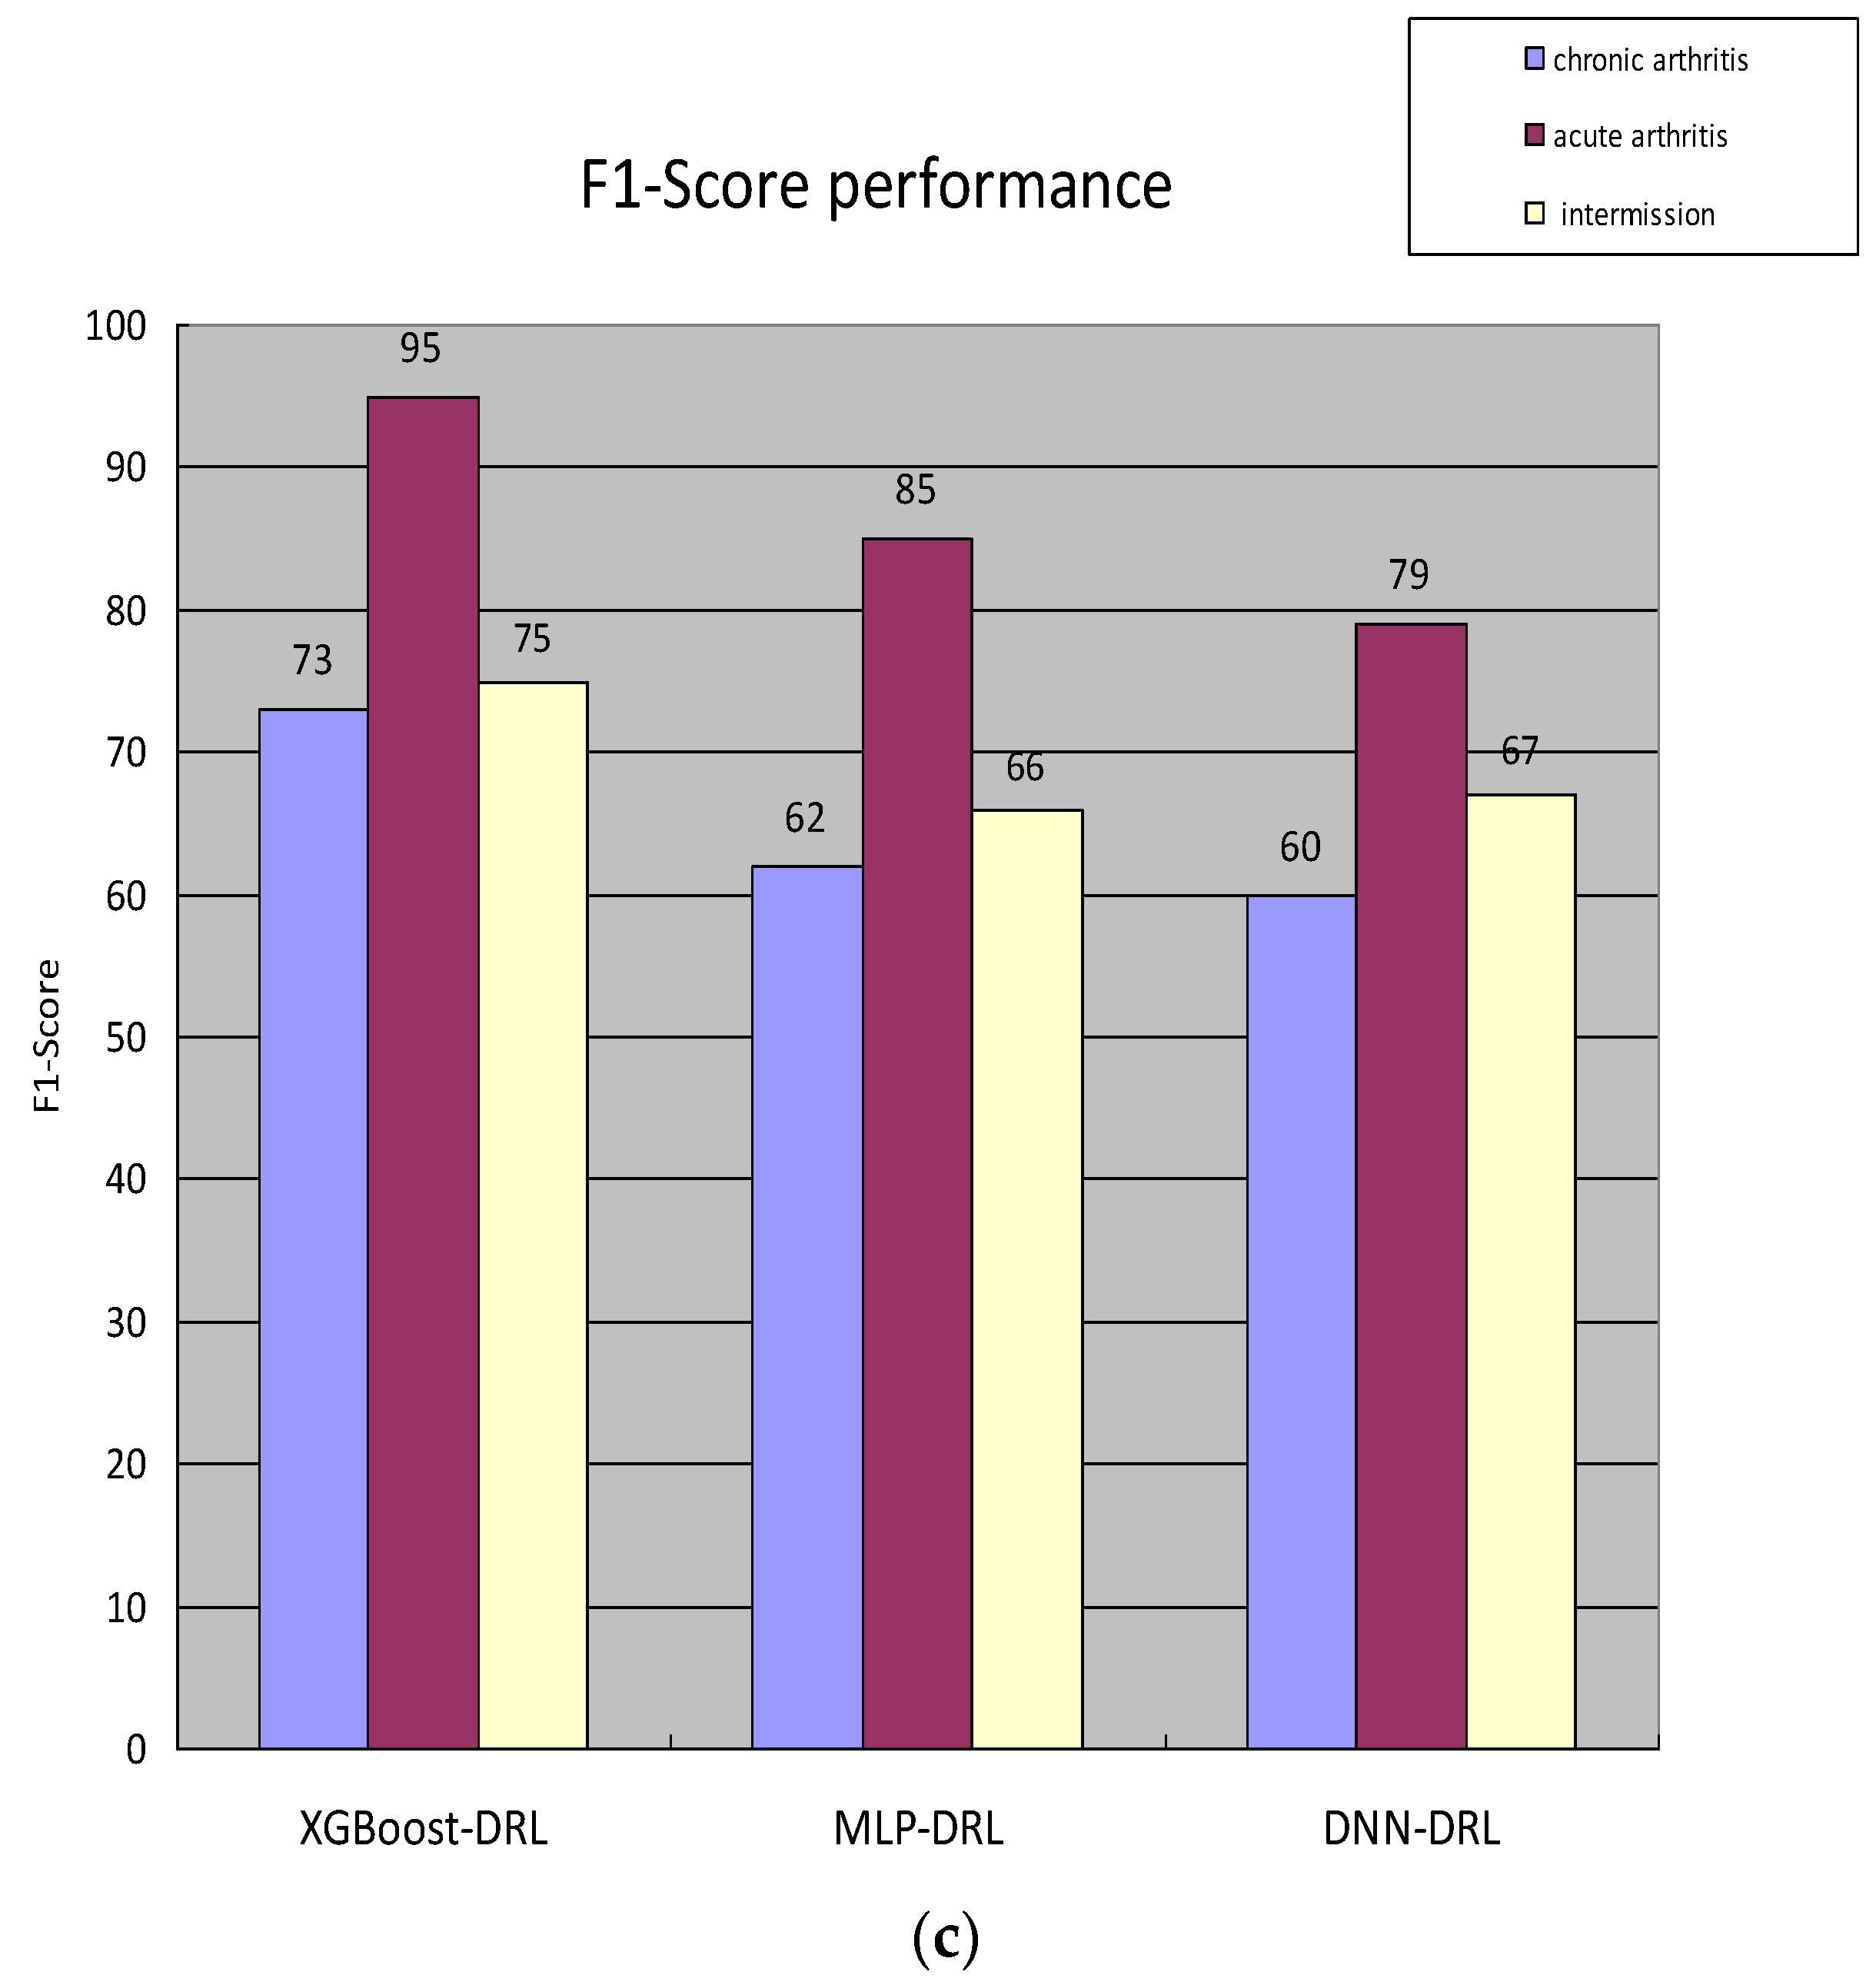
In order to test the classification effect of the disease staging diagnosis model based on deep reinforcement learning, we introduced and added MLP and DNN, two deep learning models, and the XGBoost model for comparative experiments. In addition, we introduced automatic hyperparameter tuning for the above three models based on deep reinforcement learning. Since gout has three stages, namely the acute stage, chronic stage and intermittent stage, the final effects of the above three models on the three evaluation criteria of precision, recall and F1-Score are shown in Figure 4.
In order to verify the generalization ability of the model, this paper uses k-fold cross-validation to test the performance of the three classification models after tuning, the XGBoost–DRL hybrid model and the MLP after tuning, and the DNN model after k-fold cross-validation, as shown in Table 7.
The above experiments show that for the disease of gout, the accuracy of the binary classification of whether gout is diagnosed or not in 24,872 medical records reaches up to 90%, and the classification accuracy of the XGBoost–DRL hybrid model in the gout staging task reaches 86.85%. It can be seen that the proposal of a staging diagnosis method for gout based on deep reinforcement learning can effectively provide assistance and reference for clinicians to diagnose.
5. Conclusions and Future Work
Aiming at the problems of the complex diagnosis process and low accuracy rate of current multi-clinical-stage disease, this paper proposes a gout stage diagnosis method based on deep reinforcement learning. The method uses hospital electronic medical records as the data source, first using the “candidate binary classification model library” containing a variety of binary classification models to determine whether gout is diagnosed, and then introduces medical field knowledge, that is, gout diagnosis rules, to analyze the diagnosis results of the binary classification. The model is calibrated, and finally a deep-reinforcement-learning-based gout staging diagnosis method is used for final staging diagnosis. The experimental results show that the gout staging diagnosis method based on deep reinforcement learning is superior to other traditional methods in performance, as it not only improves the accuracy of diagnosis and staging but also provides effective assistance for clinicians in the staging diagnosis of gout. The electronic medical records in this experiment contain many feature items. In order to further improve the accuracy of model diagnosis, in future research we will explore more efficient feature engineering solutions and further reduce the number of feature values.
Author Contributions
Conceptualization, Formal analysis, Software, Validation, Writing—original draft, C.M.; Methodology, Writing—original draft, Conceptualizatio, C.P.; Conceptualization, Supervision, Writing—review & editing, Z.Y.; Conceptualization, Methodology, Software, H.R.; Data curation, Investigation, Resources, H.H.; Funding acquisition, Project administration, J.Q. All authors have read and agreed to the published version of the manuscript.
Funding
This research was supported by the National Natural Science Foundation, 62172123; Key Research and Development Program of Heilongjiang (Grant No. 2022ZX01A36); Special projects for the central government to guide the development of local science and technology, China (No. ZY20B11); Harbin Manufacturing Science and Technology Innovation Talent Project (CXRC20221104236).
Data Availability Statement
These data are electronic medical records of patients obtained by the gout outpatient department of a hospital in ShanDong.
Conflicts of Interest
The authors declare that they have no known competing financial interest or personal relationships that could have appeared to influence the work reported in this study.
References
- Liu, S.; Ngiam, K.Y.; Feng, M. Deep Reinforcement Learning for Clinical Decision Support: A Brief Survey. arXiv 2019, arXiv:1907.09475. [Google Scholar]
- Qigang, L.; Keyan, Z.; Carlos, D.B.; Ma, X.; Wong, W.H. Xrare: A machine learning method jointly modeling phenotypes and genetic evidence for rare disease diagnosis. Genet. Med. 2019, 21, 2126–2134. [Google Scholar]
- Hsu, C.H.; Chen, X.; Lin, W.; Jiang, C.; Zhang, Y.; Hao, Z.; Chung, Y.C. Effective multiple cancer disease diagnosis frameworks for improved healthcare using machine learning. Measurement 2021, 175, 109145. [Google Scholar] [CrossRef]
- Hu, M.; Chen, X.; Sun, Y.; Shen, X.; Wang, X.; Yu, T.; Mei, X.; Xiao, L.; Cheng, W.; Yang, J.; et al. Disease Prediction Model Based on Dynamic Sampling and Transfer Learning. Chin. J. Comput. 2019, 42, 2339–2354. [Google Scholar]
- Komorowski, M.; Celi, L.A.; Badawi, O.; Gordon, A.C.; Faisal, A.A. The Artificial Intelligence Clinician learns optimal treatment strategies for sepsis in intensive care. Nat. Med. 2018, 24, 1716–1720. [Google Scholar] [CrossRef] [PubMed]
- Ghesu, F.C.; Georgescu, B.; Grbic, S.; Maier, A.; Hornegger, J.; Comaniciu, D. Towards intelligent robust detection of anatomical structures in incomplete volumetric data. ScienceDirect 2018, 48, 203–213. [Google Scholar]
- Clifton, J.; Laber, E. Q-Learning: Theory and Applications. Annu. Rev. 2020, 7, 279–301. [Google Scholar]
- Qi, X.; Zhao, L.; Bao, Z. Hyper-parameter Optimization of Neural Networks using Q-learning. In Proceedings of the 40th Chinese Control Conference, Shanghai, China, 26–28 July 2021; pp. 9022–9024. [Google Scholar]
- Botvinick, M.; Ritter, S.; Wang, J.X.; Kurth-Nelson, Z.; Blundell, C.; Hassabis, D. Reinforcement Learning, Fast and Slow. ScienceDirect 2019, 23, 408–416. [Google Scholar] [CrossRef] [Green Version]
- Wu, J.; Chen, S.-P.; Chen, X.-Y. Reinforcement Learning for Model Selection and Hyperparameter Optimization. J. Univ. Electron. Sci. Technol. China 2020, 48, 256–259. [Google Scholar]
- Ali, J.; Aldhaifallah, M.; Nisar, K.S.; Aljabr, A.A.; Tanveer, M. Regularized Least Squares Twin SVM for Multiclass Classification. Big Data Res. 2022, 27, 100295. [Google Scholar] [CrossRef]
- Li, Z.; Liu, Z. Feature selection algorithm based on XGBoost. J. Commun. 2019, 40, 101–104. [Google Scholar]
- Qi, X.; Zhao, L.; Ban, X. Optimization of Neural Network Hyperparameters Based on Q-learning. In Proceedings of the 40th China Control Conference, Shanghai, China, 26–28 July 2021; pp. 759–762. [Google Scholar]
- Zhu, F.; Wu, W.; Fu, Y.; Liu, Q. Safe Deep Reinforcement Learning Method Based on Dual Deep Networks. J. Comput. 2019, 42, 1812–1826. [Google Scholar]
Figure 1.
Reinforcement learning process.
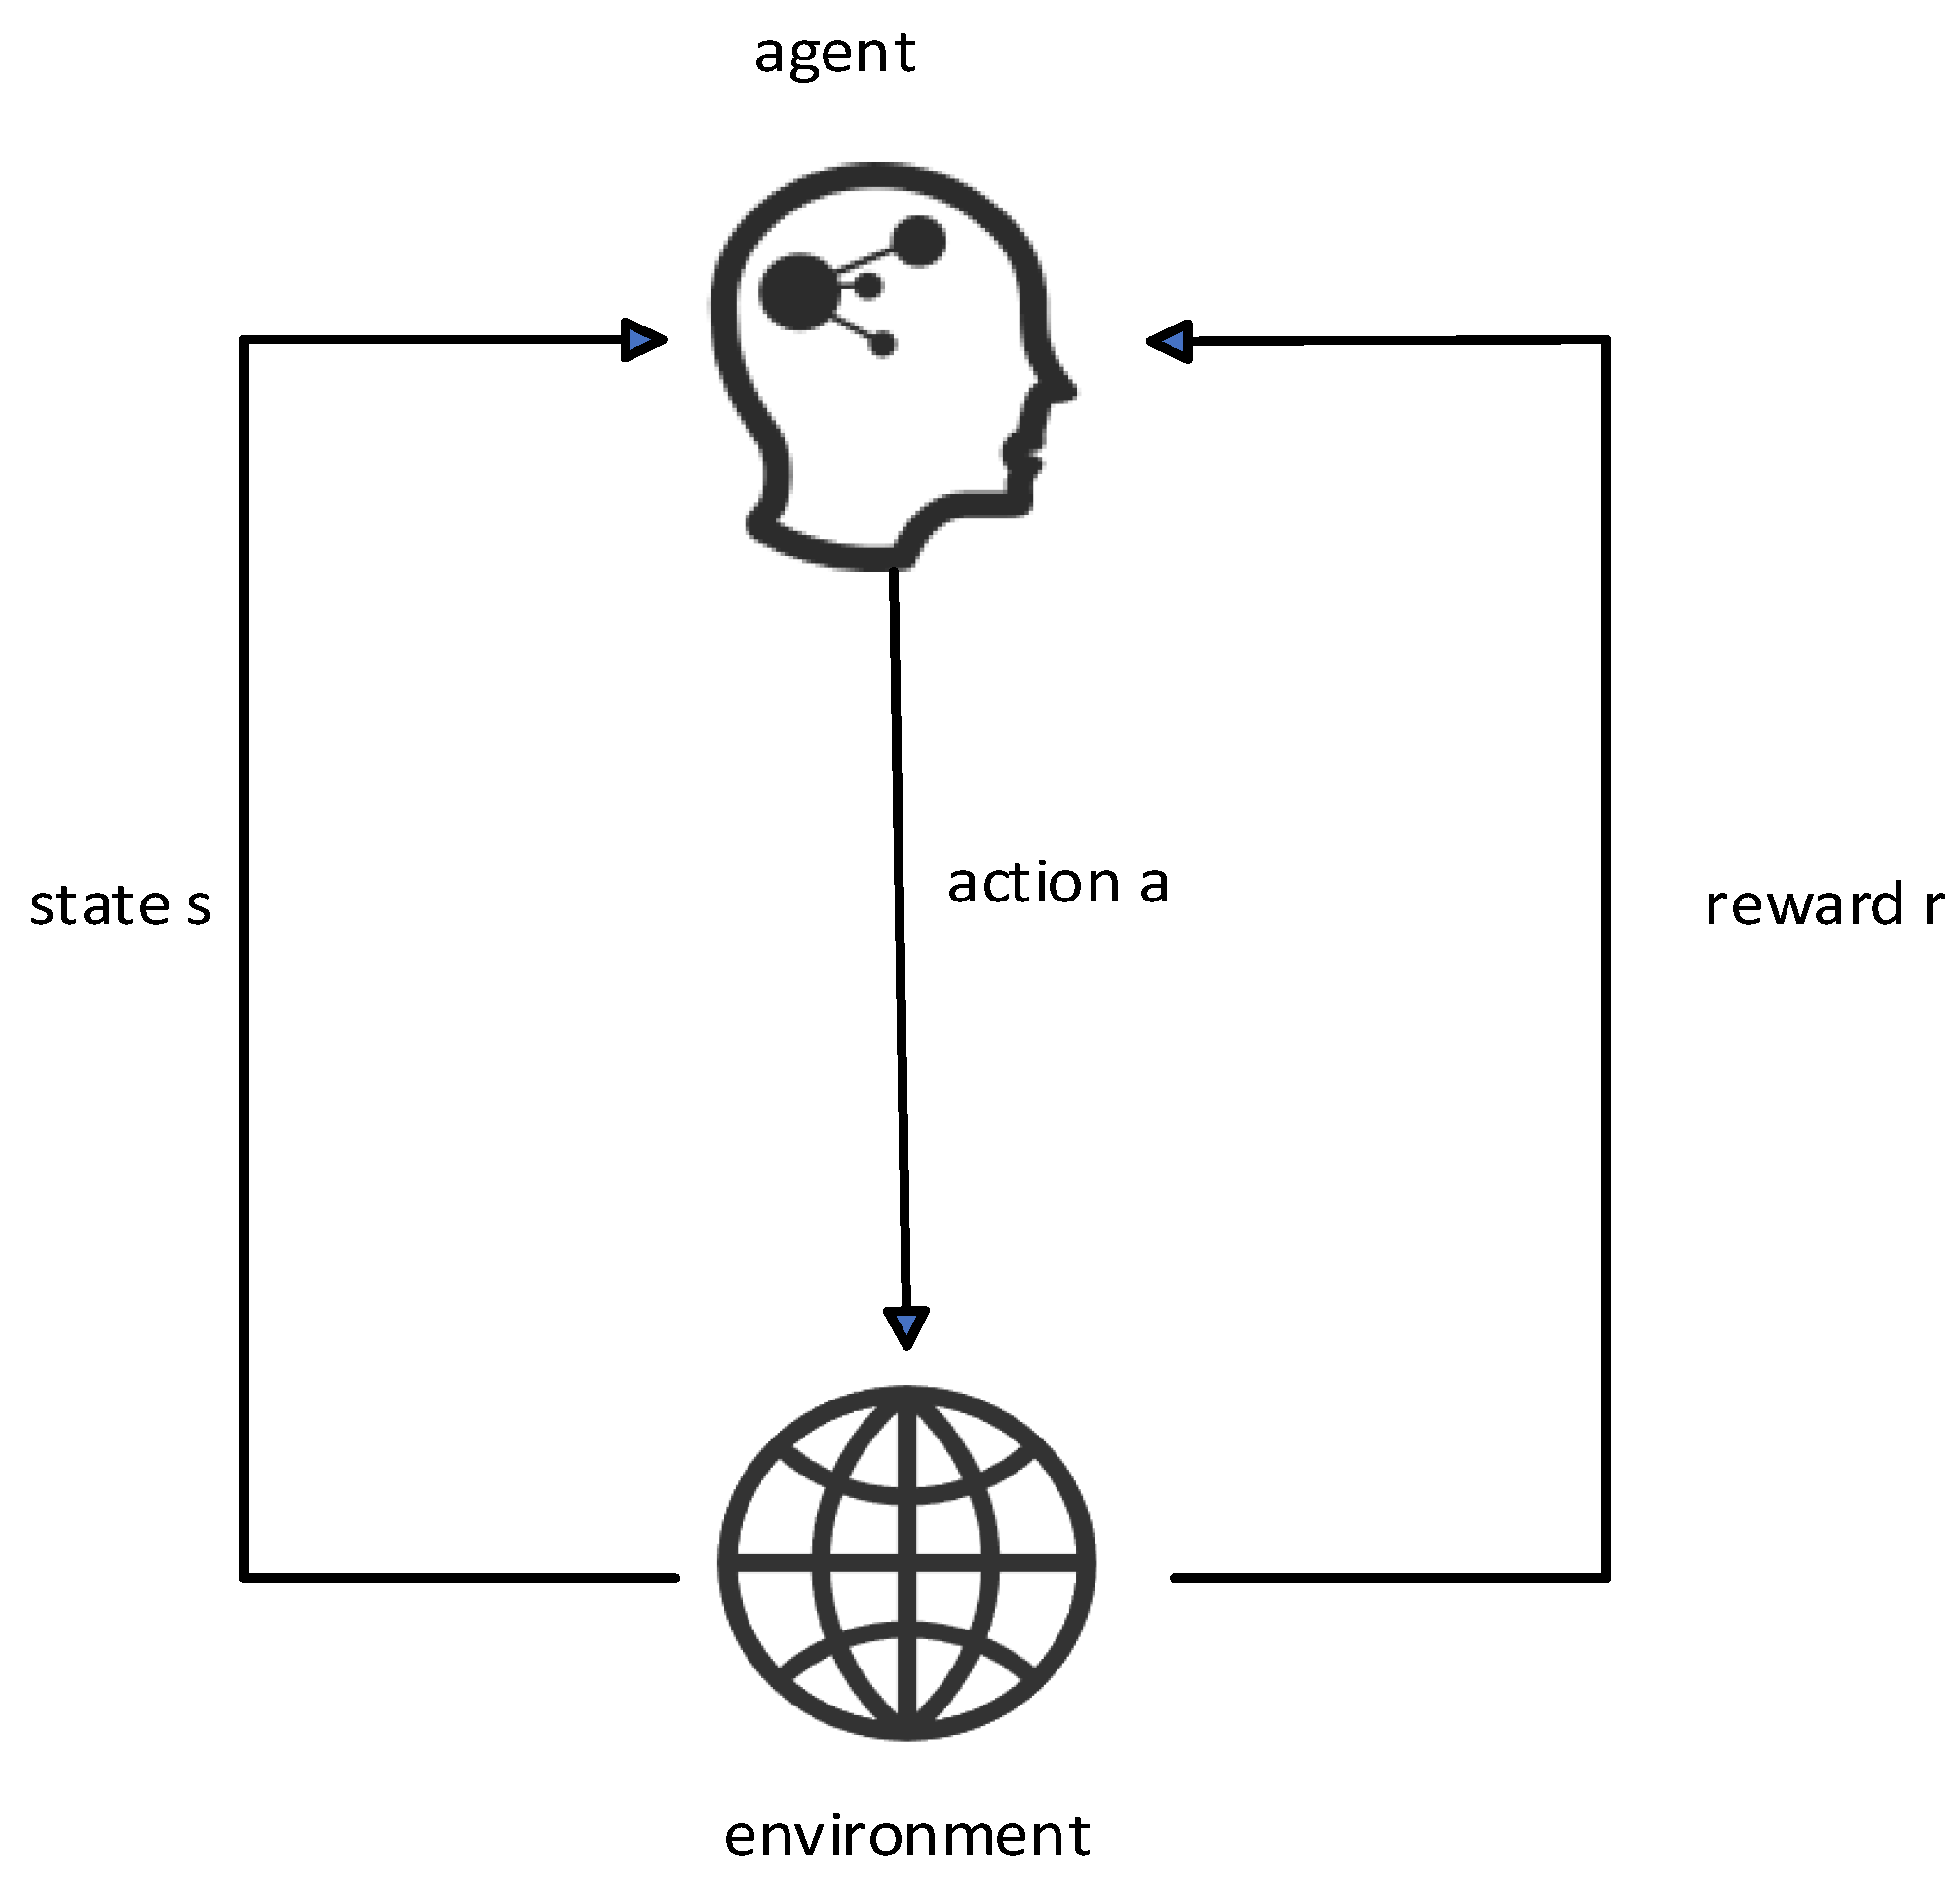
Figure 2.
Gout staging diagnosis method flow chart.
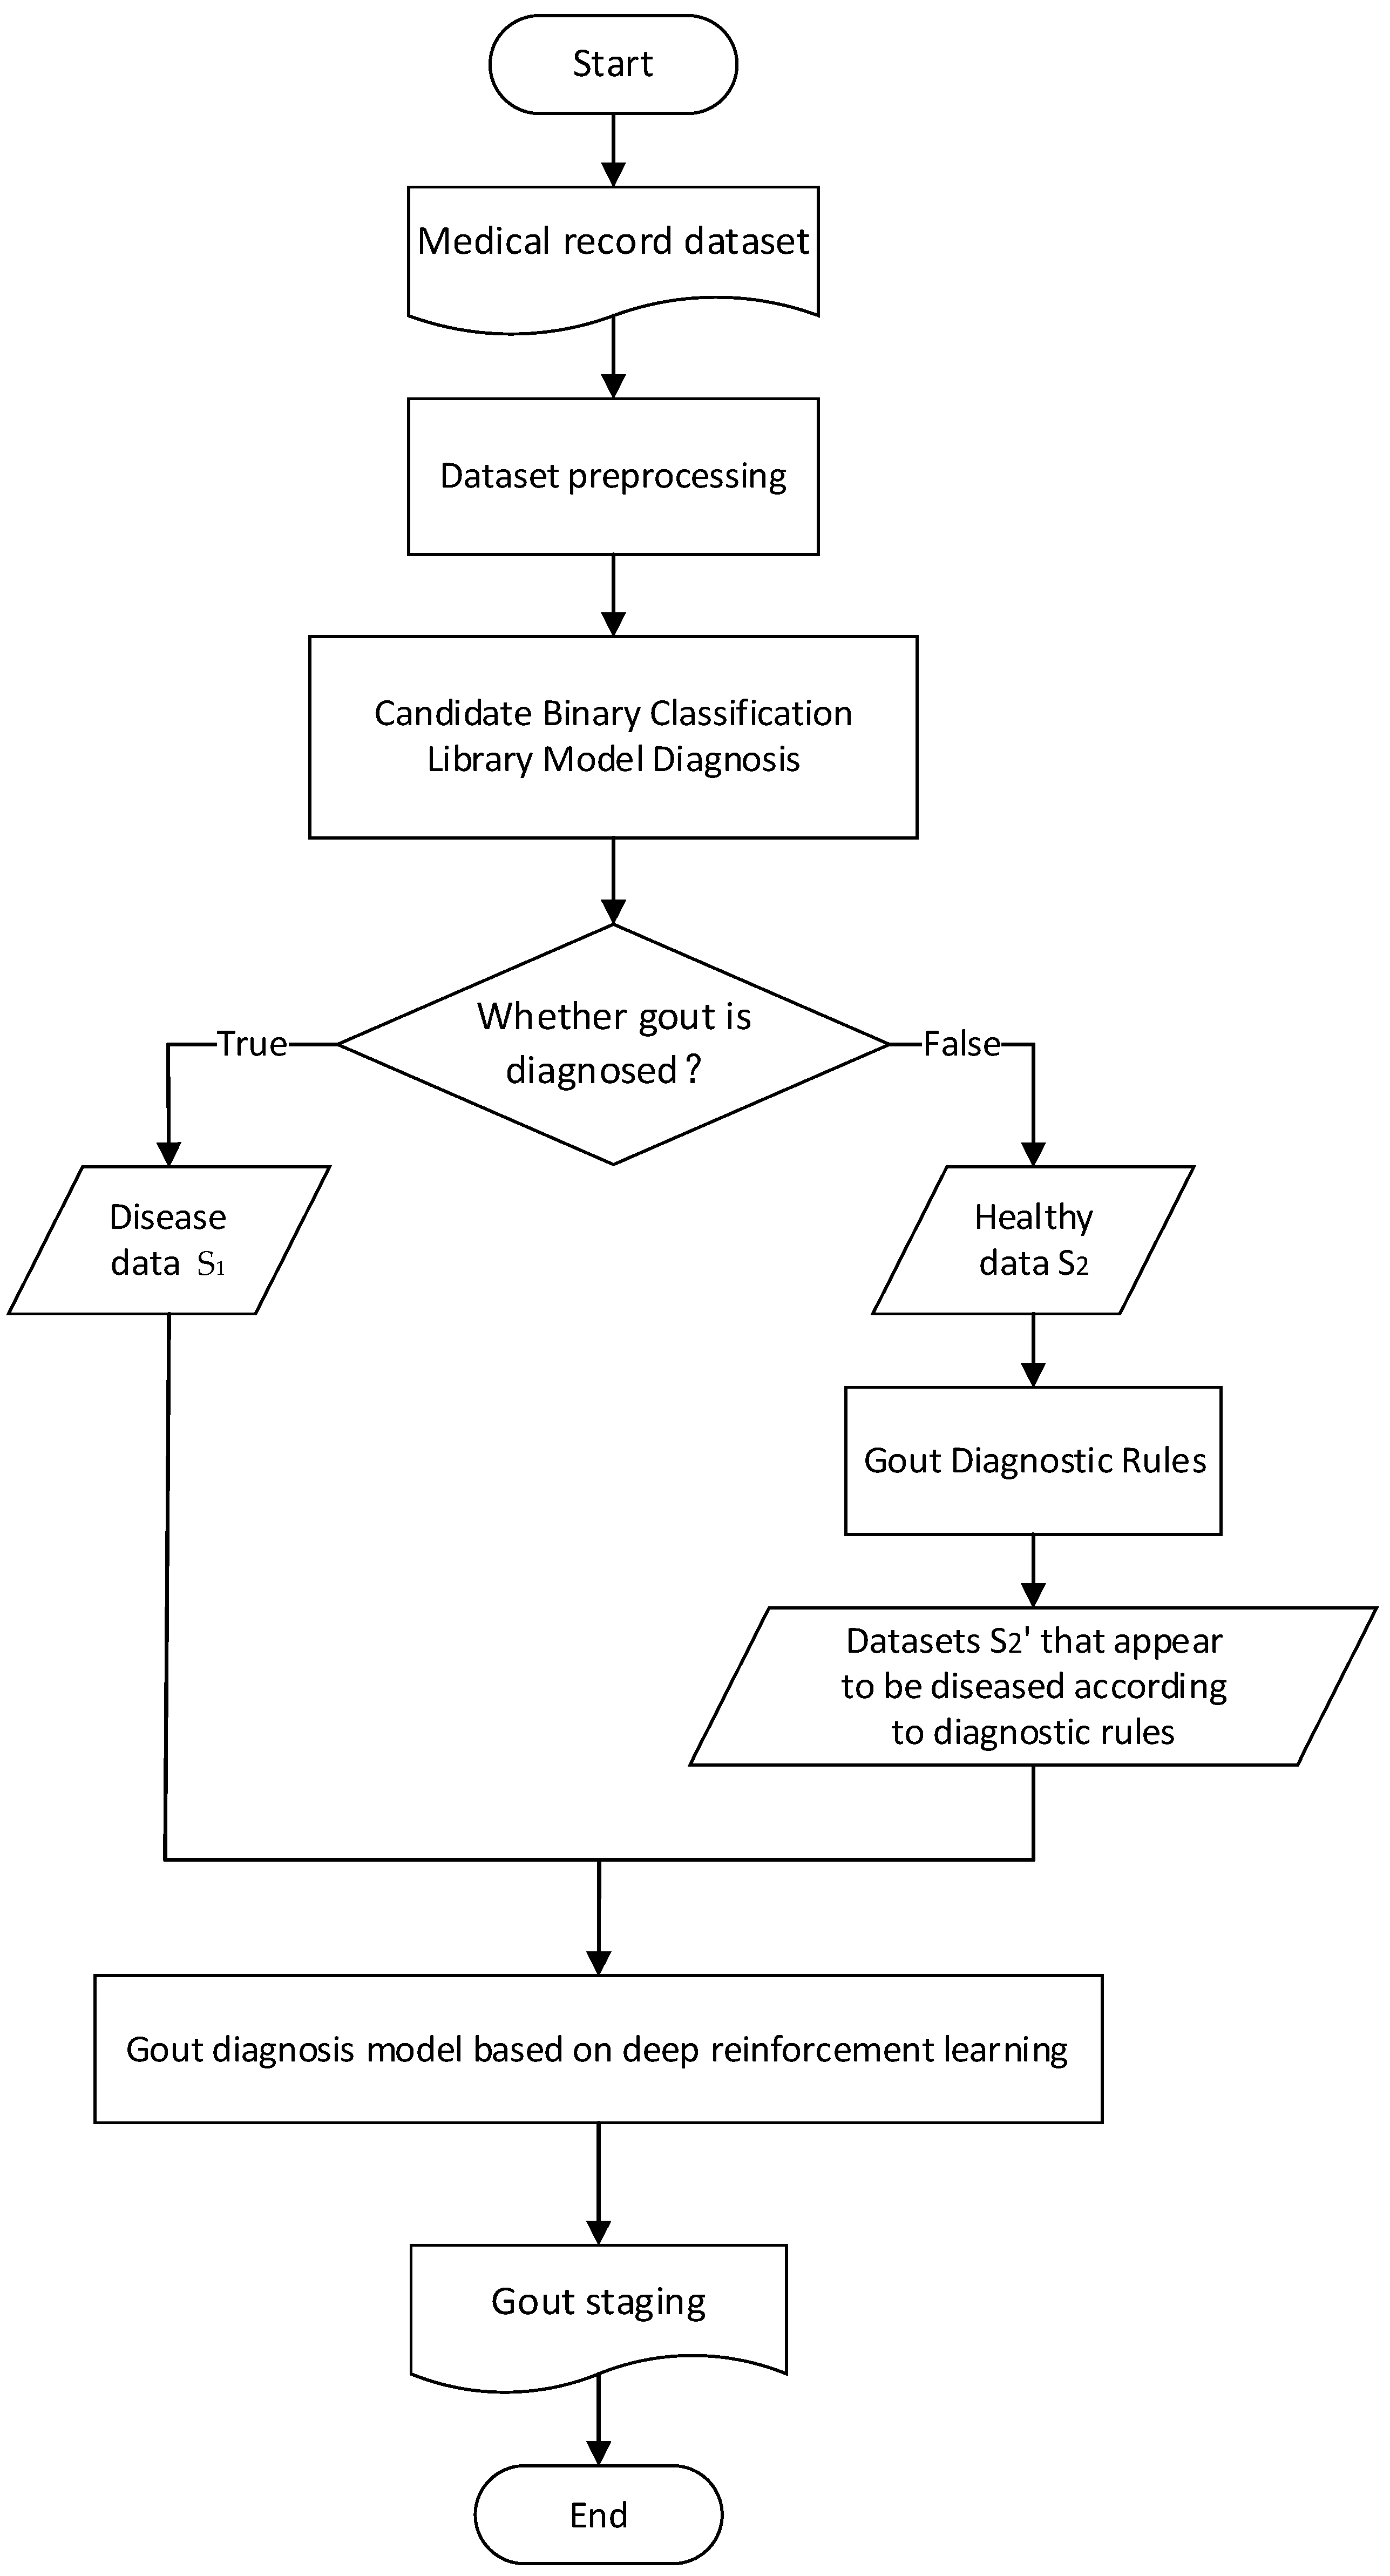
Figure 3.
Comparison before and after hyperparameter adjustment: (a) precision; (b) recall; (c) F1-Score.
Figure 3.
Comparison before and after hyperparameter adjustment: (a) precision; (b) recall; (c) F1-Score.
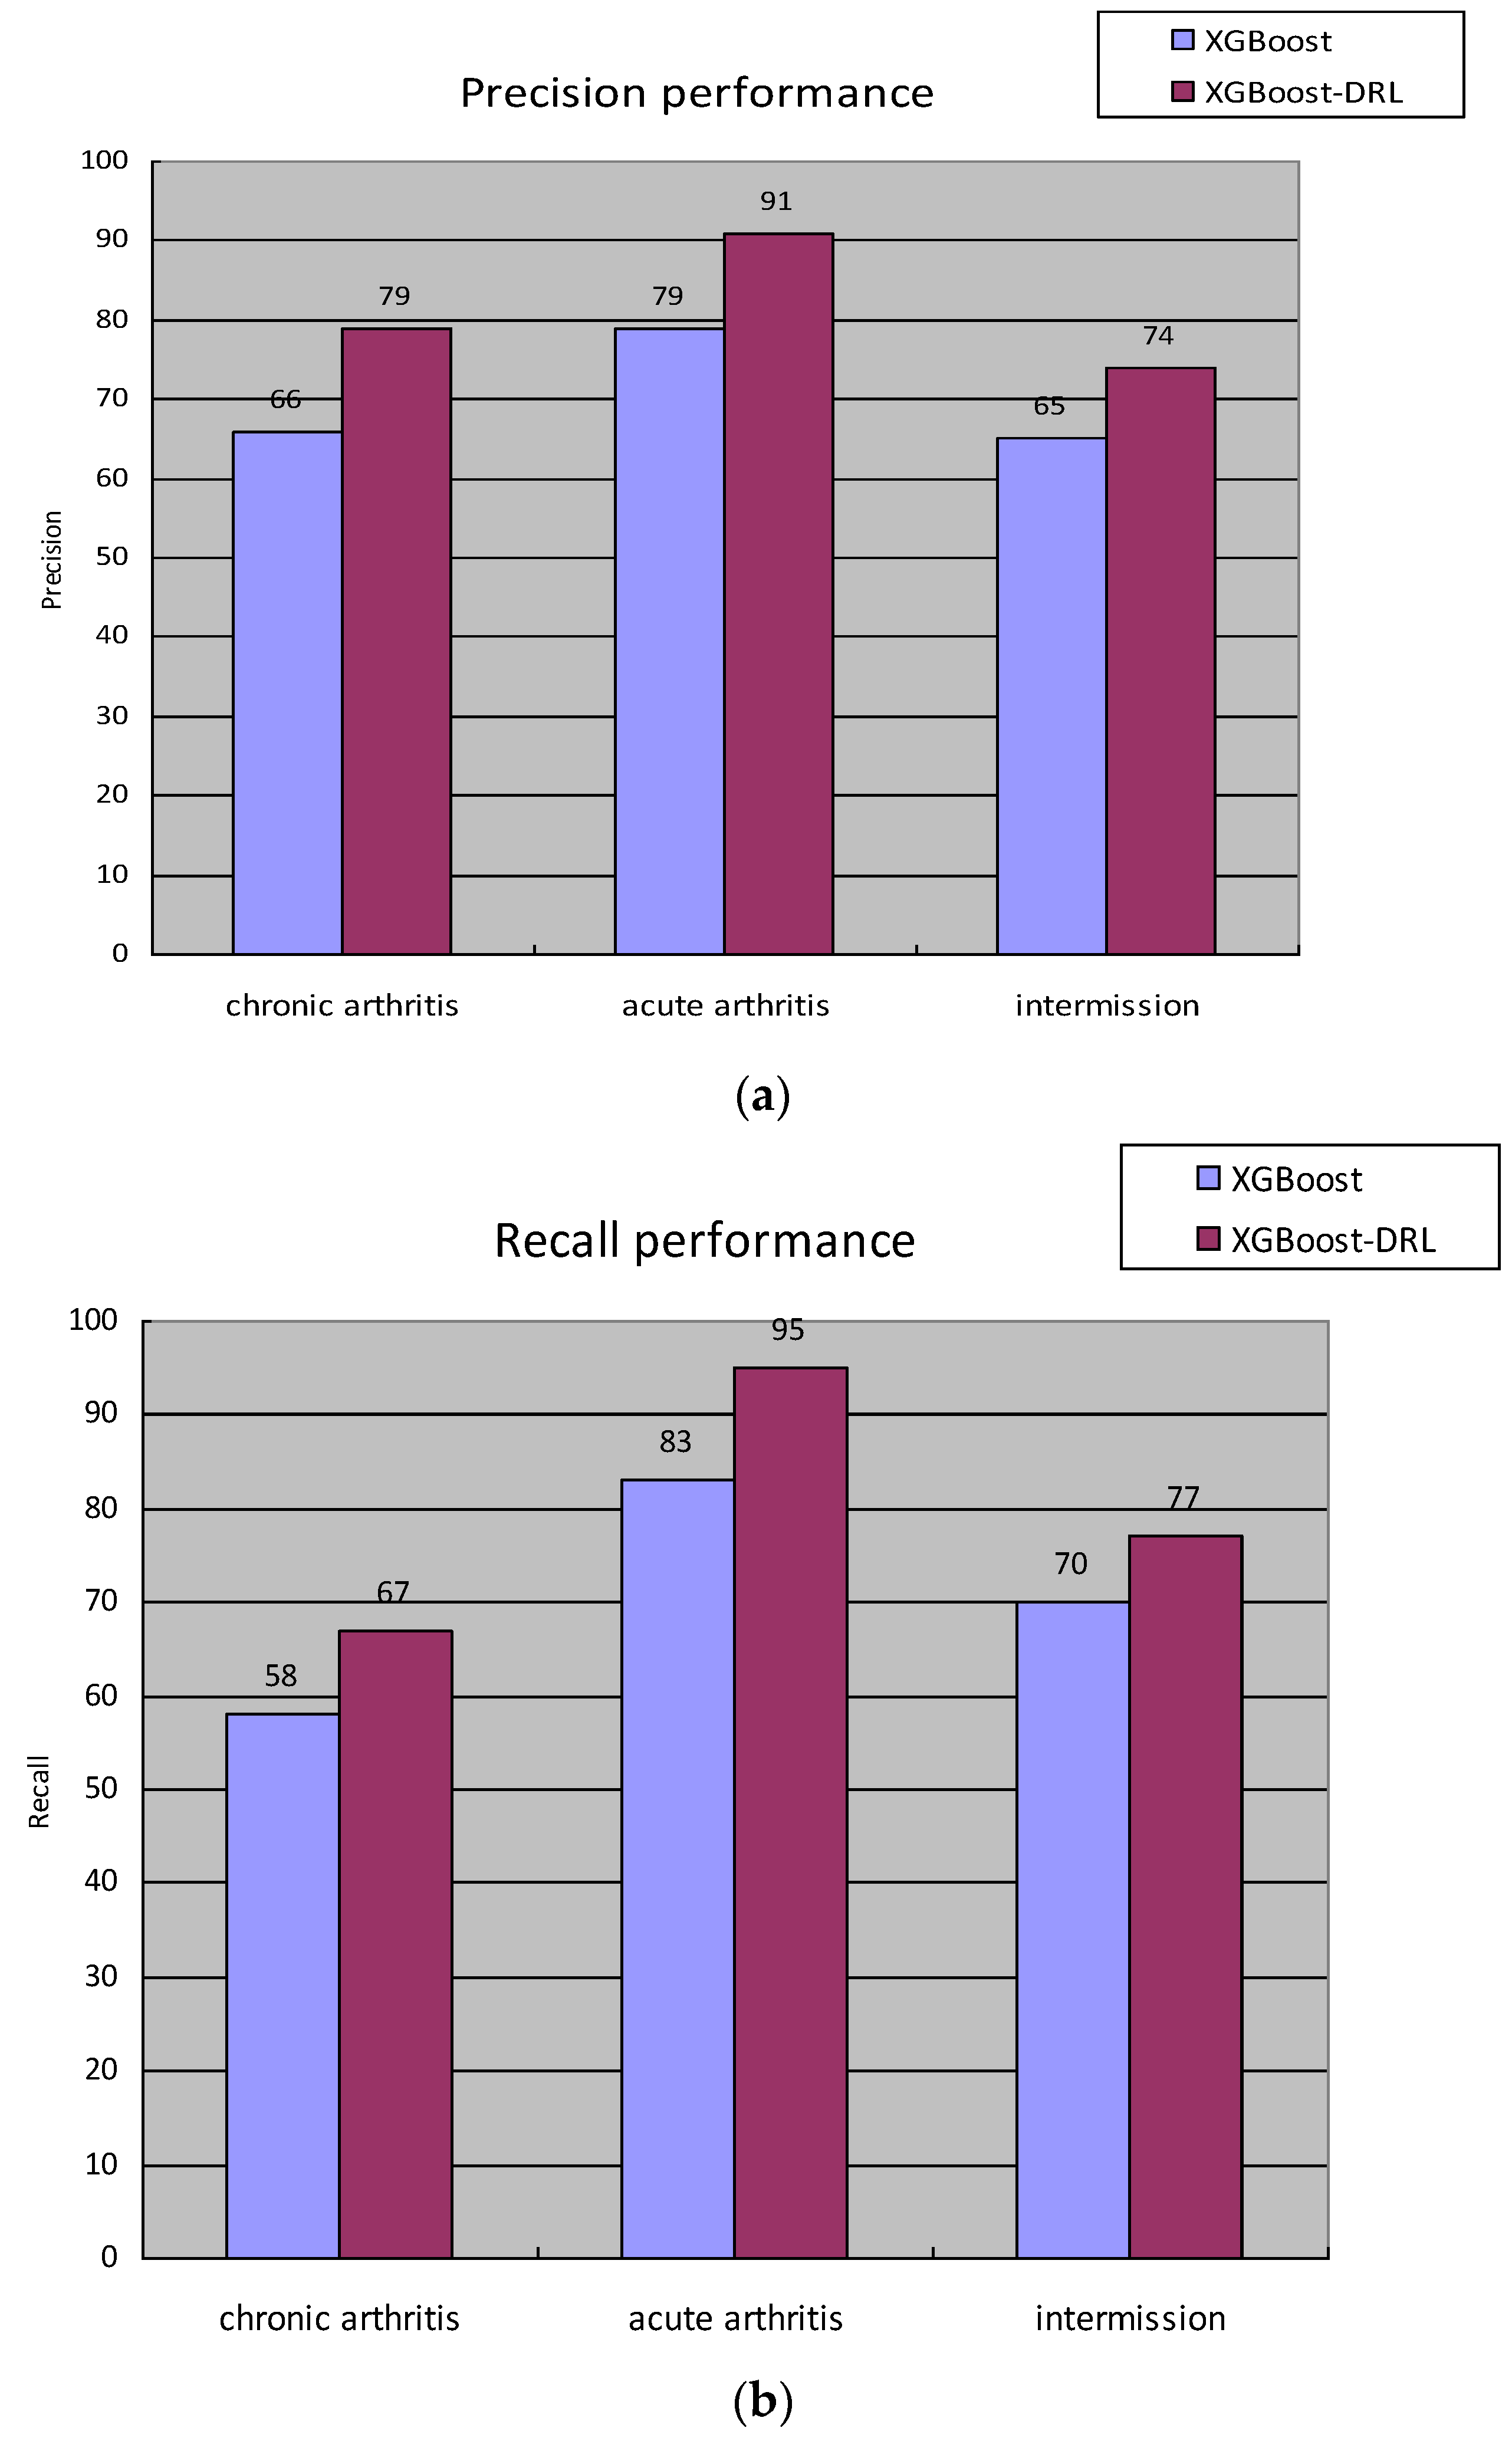
Figure 4.
Effect comparison of deep reinforcement learning models for disease staging diagnosis: (a) precision; (b) recall; (c) F1-Score.
Figure 4.
Effect comparison of deep reinforcement learning models for disease staging diagnosis: (a) precision; (b) recall; (c) F1-Score.

Table 1.
Gout diagnostic rules correct dichotomous results.
| Gout Diagnostic Rules Correct Dichotomous Results |
|---|
| Input: The “disease” data set , the “healthy” data set in the binary classification results and the gout diagnosis rules provided by doctors |
| Output: Data set for multi-classification |
| 1: According to the gout diagnostic rules provided by the doctor, the feature value set F′ that has a decisive impact on gout is screened out. |
| 2: In the “healthy” data set , select the data sample with gout on F′. |
| 3: Merge the data sample into the “disease” data set to form a multi-classification sample . |
Table 2.
Missing value filling of medical record data set.
| Missing Value Filling of Medical Record Data Set |
|---|
| Input: Medical record data set |
| Output: Medical record data set with missing values filled |
| 1: Calculate the missing degree of all eigenvalues in the medical record data set: P = {p1, p2, p3, …, pn}, where p represents the magnitude of the missing degree, and n represents the eigenvalue index. |
| 2: if (pn > 70%) |
| 3: The eigenvalue has a large missing degree, delete the eigenvalue |
| 4: else if (n is completely missing at random or missing at random) |
| 5: The method of estimation is used for filling, specifically mean value filling and mode filling. |
| 6: else use the random forest filling method to fill |
Table 3.
Sample distribution table.
| Type | Quantity | |
|---|---|---|
| Healthy | 4043 | |
| Diagnosed with gout | chronic arthritis | 8115 |
| acute arthritis | 1800 | |
| intermission | 10,914 | |
Table 4.
Staging diagnostic method for multi-clinical-stage disease.
| Staging Diagnostic Method for Multi-Clinical-Stage Disease |
|---|
| Input: discount factor γ, initial state St, total rounds of training E, limit the number of explorations M, number of tasks T |
| Output: The combination of hyperparameters that performed best for the classification model Hmax |
| 1: Initialize the optimal reward value Rmax = 0; Initialize the memory pool DHmax = St |
| 2: for e = 1 to E do |
| 3: Initialize the cumulative sum of rewards for this round R = 0 |
| 4: for t = 1 to T do: |
| 5: ε-greedy choose At |
| 6: //The environment state transitions to after the behavior |
| 7: train the staging model, |
| 8: obtain the accuracy Ft after k-fold cross-validation |
| 9: |
| 10: to D |
| 11: |
| 12: if (t > M) then |
| 13: Randomly select k samples from memory pool D |
| 14: update Q network//according to Formula (14) |
| 15: end if |
| 16: end for |
| 17: if (R > Rmax) then |
| 18: Rmax = R |
| 19: Hmax = St |
| 20: end if |
| 21: end for |
| 22: return Hmax |
Table 5.
Performance of “candidate binary classification model library” on binary classification tasks.
Table 5.
Performance of “candidate binary classification model library” on binary classification tasks.
| Accuracy | Precision | Recall | F1-Score | |
|---|---|---|---|---|
| KNN | 80.25% | 82.13% | 81.57% | 81.57% |
| SVM | 80.71% | 81.21% | 81.85% | 81.85% |
| XGBoost | 90.03% | 91.21% | 89.71% | 89.71% |
Table 6.
Details of the booster parameters.
| Parameter Name | Meaning |
|---|---|
| learning_rate | The learning rate |
| gamma | The lowest value of the loss function, which determines whether to prune |
| max_depth | The maximum depth of the decision tree |
| min_child_weight | The weight sum of the leaf nodes of the decision tree |
| subsample | Sample proportion for random sampling in decision trees |
| colsample_bytree | Proportion of randomly sampled features in a decision tree |
| scale_pos_weight | Help the model converge quickly when the sample is unbalanced |
| lambda | L2 regularization penalty coefficient |
| alpha | L1 regularization penalty coefficient |
Table 7.
ACC performance before and after k-fold cross-validation.
| Model | Time | Accuracy |
|---|---|---|
| XGBoost–DRL | Before k-fold | 87.82% |
| After k-fold | 86.85% | |
| MLP-DRL | Before k-fold | 77.26% |
| After k-fold | 76.15% | |
| DNN-DRL | Before k-fold | 74.33% |
| After k-fold | 73.96% |
Disclaimer/Publisher’s Note: The statements, opinions and data contained in all publications are solely those of the individual author(s) and contributor(s) and not of MDPI and/or the editor(s). MDPI and/or the editor(s) disclaim responsibility for any injury to people or property resulting from any ideas, methods, instructions or products referred to in the content. |
© 2023 by the authors. Licensee MDPI, Basel, Switzerland. This article is an open access article distributed under the terms and conditions of the Creative Commons Attribution (CC BY) license (https://creativecommons.org/licenses/by/4.0/).
Share and Cite
MDPI and ACS Style
Ma, C.; Pan, C.; Ye, Z.; Ren, H.; Huang, H.; Qu, J. Gout Staging Diagnosis Method Based on Deep Reinforcement Learning. Processes 2023, 11, 2450. https://doi.org/10.3390/pr11082450
AMA Style
Ma C, Pan C, Ye Z, Ren H, Huang H, Qu J. Gout Staging Diagnosis Method Based on Deep Reinforcement Learning. Processes. 2023; 11(8):2450. https://doi.org/10.3390/pr11082450
Chicago/Turabian StyleMa, Chao, Changgang Pan, Zi Ye, Hanbin Ren, Hai Huang, and Jiaxing Qu. 2023. "Gout Staging Diagnosis Method Based on Deep Reinforcement Learning" Processes 11, no. 8: 2450. https://doi.org/10.3390/pr11082450
Note that from the first issue of 2016, this journal uses article numbers instead of page numbers. See further details here.