Article

An Adaptive Peak Power Prediction Method for Power Lithium-Ion Batteries Considering Temperature and Aging Effects

1
School of Energy Science and Engineering, Nanjing Tech University, Nanjing 211816, China
2
School of Automation, Nanjing University of Science and Technology, Nanjing 210094, China
*
Author to whom correspondence should be addressed.
Processes 2023, 11(8), 2449; https://doi.org/10.3390/pr11082449
Submission received: 14 July 2023 / Revised: 2 August 2023 / Accepted: 12 August 2023 / Published: 14 August 2023

Abstract

:
The battery power state (SOP) is the basic indicator for the Battery management system (BMS) of the battery energy storage system (BESS) to formulate control strategies. Although there have been many studies on state estimation of lithium-ion batteries (LIBs), aging and temperature variation are seldom considered in peak power prediction during the whole life of the battery. To fill this gap, this paper aims to propose an adaptive peak power prediction method for power lithium-ion batteries considering temperature and aging is proposed. First, the Thevenin equivalent circuit model is used to jointly estimate the state of charge (SOC) and SOP of the lithium-ion power battery, and the variable forgetting factor recursive least squares (VFF-RLS) algorithm and extended Kalman filter (EKF) are utilized to identify the battery parameters online. Then, multiple constraint parameters including current, voltage, and SOC were derived, considering the dependence of the polarization resistance of the battery on the battery current. Finally, the verification experiment was carried out with LiFePO4 battery. The experimental results under FUDS operating conditions show that the maximum SOC estimation error is 1.94%. And the power prediction errors at 20%, 50%, and 70% SOC were 5.0%, 8.1% and 4.5%, respectively. Our further work will focus on the joint estimation of battery state to further improve the accuracy.

1. Introduction

With the progress of new energy technology and the demand for environmental protection, the electric vehicle industry has developed rapidly in recent years [1]. Compared to gasoline powered vehicles, electric vehicles cause less environmental pollution and have the advantages of high efficiency and low noise [2]. Battery management system (BMS) technology is one of the most critical technologies in electric vehicles. BMS can monitor the battery status and ensure safety operation [3]. The battery energy storage systems (BESSs) composed of lithium batteries is also used in the micro-grids using Renewable Energy Source (RES) [4,5,6].The state of charge (SOC), state of health (SOH), and state of power (SOP) of lithium-ion batteries are the basic indicators for BMS to develop strategies for controlling new energy vehicles and BESS [7]. However, due to the changing operating conditions and working environment of electric vehicles, the electrochemical reaction mechanism inside the batteries is complex [8]. Therefore, how to accurately obtain the internal state of these batteries has become a key factor for the reliable operation of BMS.
Among various electrochemical energy storage devices, power lithium-ion batteries have the advantages of high power density, high voltage, and long service life compared to other batteries. The positive electrode materials of power lithium-ion batteries include LiFePO4, LiCoO2, ternary lithium material, and so on. The negative electrode of a battery is generally made of graphite material [9]. SOP describes the maximum power that lithium-ion batteries can release or absorb over a period of time, which can be used to determine whether the power battery can meet the power requirements of electric vehicles during acceleration and climbing, or whether the battery can recover energy to the maximum extent during braking, thereby avoiding overcharging or discharging of the battery pack during operation and extending its service life [10]. I It should be noted that SOP cannot be directly measured through sensors on the battery, as it will vary depending on factors such as battery operating temperature, battery SOC and SOH [11]. For power lithium-ion batteries, the power that can be released or absorbed is limited by the internal resistance. In addition, the working temperature environment and aging of the battery can also affect the power supply capacity. Therefore, accurately identifying the model parameters of batteries under different operating conditions is of great significance for power prediction.
At present, the major methods for estimating SOP include characteristic maps (CM), machine learning based methods, equivalent circuit model (ECM) based methods [12]. The method based on feature mapping utilizes the correlation between battery power, battery parameters, and working state. The SOP of the battery under different SOCs, temperatures, and other conditions is obtained offline through experimental methods such as HPPC testing [13] or constant power testing [14], and the SOP corresponding to the previous working state is searched in practical applications. However, due to the fact that the performance of batteries is related to their aging and working history, and there are countless working states of batteries in practical applications, the adaptability of this method is relatively poor.
Based on machine learning methods, a black box model is constructed using a large amount of data to predict SOP. Ref. [15] uses Feedforward neural network (FFNN) to model the polarization resistance and terminal voltage of the battery, proposed a method for long-term prediction of SOP that combines the advantages of black box models and equivalent circuit models. A model-based extreme learning machine algorithm is proposed to predict the temperature, voltage and SOP of the battery in Ref. [16], and the main advantage is that the influence of battery temperature variations in long-term on battery power prediction is considered. The use of machine learning algorithms can eliminate the step of parameter recognition, but requires a large amount of experimental data and computational complexity.
ECM based SOP estimation methods were first proposed by Plett et al. [17]. These methods simulate the state of a battery during operation through a battery model, and then set constraints based on battery characteristic parameters such as voltage, current, and SOC to calculate the maximum charging or discharging power of the battery under these constraints. The accuracy of these methods depends on whether an accurate battery model can be established and whether model parameters can be accurately identified. A first-order Thevenin equivalent circuit model was used and the SOC of the battery was estimated using the UKF method in Ref. [18]. The battery parameters were updated using the adaptive parameter estimation method, and the SOP was estimated under voltage and SOC constraints. Ref. [19] takes the open circuit voltage (OCV) in the model as a function of temperature, aging factors, and hysteresis effects to better describe the actual operating characteristics of the battery. Ref. [20] used a novel polarization voltage model (NPV) based on electrochemical principles. The polarization voltage model starts from the electrochemical mechanism of the battery and describes the polarization voltage of the battery as a function of current. NPV can better express the dynamic characteristics of the battery, but it can only describe the process of polarization voltage variation when the current flows unidirectionally and is not suitable for working conditions with changes in current direction. The fractional order battery model used to estimate SOP in Ref. [21] has a clear physical significance compared to the circuit equivalent model, and can reflect the dynamic characteristics of lithium-ion batteries. In the lower SOC range, the state estimation is accuracy using a fractional order battery model, but identifying the parameters of the fractional order model is more complex compared to the equivalent circuit model. After establishing a battery model, the parameters of the model must be identified before using it. The methods for obtaining parameters of battery models are mainly divided into offline identification and online identification. The offline parameter identification of ECM is usually obtained through HPPC tests [22]. For fractional order models, particle swarm optimization algorithm is used to identify their parameters in Ref. [21]. Online parameter identification updates the model parameters in real-time through the collected voltage, current and other information. The methods used for online parameter identification include Dual Kalman Filter algorithm (DEKF) [23], extreme searching algorithm [24], and Improved Adaptive Forgetting Factor Recursive Least Squares algorithm (IAFFBCRLS) Method with Bias Compensation [25].
Based on existing research, the problems in battery power prediction are as follows: (1) It is necessary to obtain battery parameters under different aging and temperature states through a large number of experiments, which requires a large amount of preliminary work. (2) The polarization internal resistance of the battery will change with the current rate, which will result in large prediction error without online parameters identification.
Most existing research focuses on offline parameter identification, with seldom little consideration given to the influence of temperature and aging on parameters. To achieve adaptive power prediction for temperature and aging effects, in this paper, the Thevenin equivalent circuit model of the battery is established, and the parameters of the battery model are identified online using the least square algorithm based on variable forgetting factor (VFF-RLS) and extended Kalman filter (EKF). Real time reflection of battery aging and environmental temperature during battery operation as the basis for adaptive battery power prediction in the battery model reduces the workload of battery testing experiments. At the same time, the dependence of battery polarization resistance on current was considered in power prediction, which improved the accuracy of battery power prediction.
The reason for considering the effects of temperature and aging is that aging accompanies the entire life cycle of the battery, and the change in internal resistance is more significant throughout the entire life cycle. Secondly, the electrochemical reactions inside the battery are complex and easily affected by temperature. Low temperature increases internal resistance, while high temperature accelerates aging. After aging, it also manifests as an increase in internal resistance. Therefore, this paper focuses on the impact of temperature and aging on power prediction.
The reminder of this paper is organized as follows. Section 2 introduces battery modeling and parameter identification methods. Section 3 introduces the SOP estimation method. Section 4 presents the experimental results and discussion. Section 5 concludes the whole paper.

2. Battery Modeling and Parameter Identification

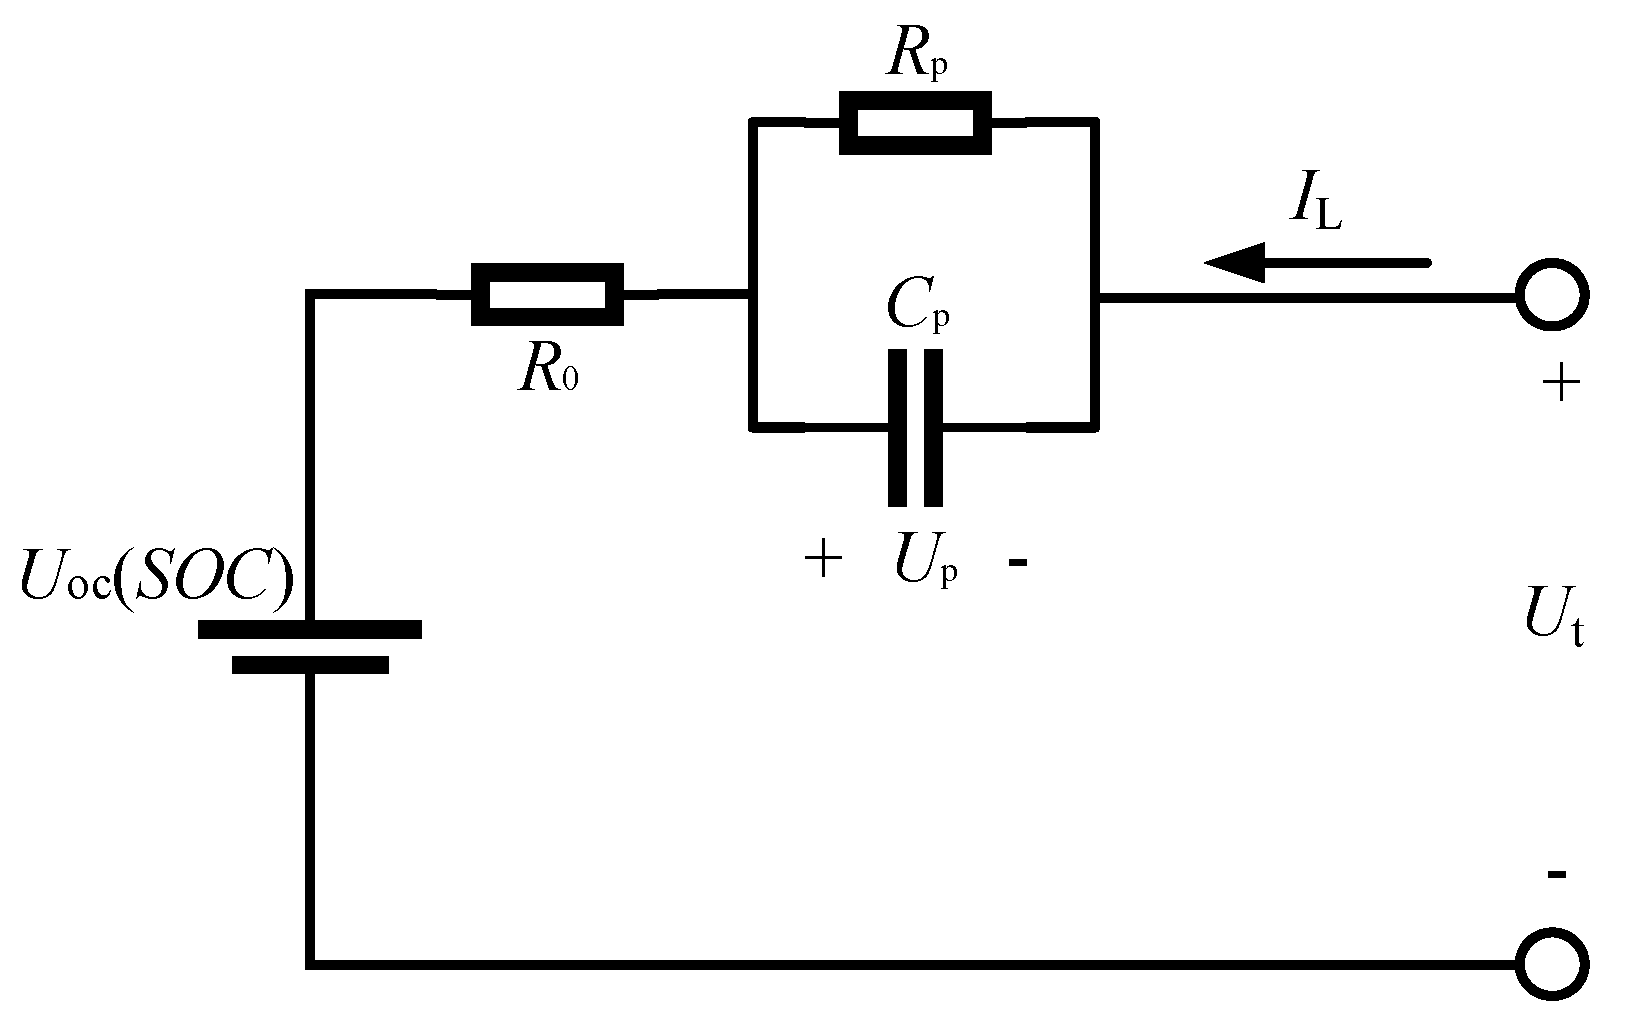
2.1. Battery Equivalent Circuit Model

The battery model is the foundation of state estimation and prediction, and the ECM is widely used due to its simple structure and easy parameter identification. The model can more accurately describe battery performance when the order of ECM is higher. But at the same time, the computational complexity will also greatly increase. Taking the complexity of the calculation and the accuracy of the model into account, this paper selects the most widely used Thevenin equivalent circuit model, considering factors such as model effectiveness and complexity. The model circuit is shown in Figure 1. In the model, Uoc(SOC) is the open circuit voltage of the battery, which can be expressed as a function of SOC; R0 is the ohmic internal resistance of the battery; Rp is the polarization internal resistance of the battery; Cp is the polarization capacitance of the battery; Up is the polarization voltage; IL is the current flowing through the battery. Here, it is specified that the charging current is positive, and Ut is the terminal voltage of the battery.
According to Kirchhoff voltage law (KVL) and Kirchhoff current law (KCL), the relationship between capacitor voltage and current, the electrical characteristics of the Thevenin equivalent circuit model in the continuous time domain can be described as:
U ˙ p = U p R p C p + I L C p U t = U O C ( S O C ) U p I L R 0
SOC is usually calculated by the ampere hour integration method, as shown in Equation (2), where Q is the nominal capacity of the battery, η is the coulombic efficiency of the battery, and SOC0 is the initial SOC of the battery, t is the duration of the charging and discharging process.
S O C = S O C 0 0 t η I L d t Q
Combined with the ampere time integration method, the Equation (3) of state and output Equation (4) of the Thevenin equivalent circuit model can be obtained:
U ˙ p S O ˙ C = 1 R p C p 0 U p S O C + 1 C p η Q I L
U t = U O C ( S O C ) U p I L R 0
The state space equation and output equation after discretization using the Euler method are shown in Equations (5) and (6), where Δt is the sampling period.
U p ( k + 1 ) S O C ( k + 1 ) = e Δ t R p C p 1 U p ( k ) S O C ( k ) + R p ( 1 e Δ t R p C p ) η Δ t Q I L ( k )
U t ( k + 1 ) = U O C ( S O C ) ( k + 1 ) U P ( k + 1 ) R 0 I L ( k + 1 )
The relationship Uoc(SOC) between OCV and SOC can be fitted using the function as follows [26]:
U O C ( S O C ) = K 0 + K 1 S O C + K 2 S O C 2 + K 3 S O C 3 + K 4 S O C 4 + K 5 S O C 5 + K 6 l n ( S O C )
In the Equation (7), K0~K6 are coefficients obtained by fitting the OCV-SOC curve through software. The method for obtaining the OCV-SOC curve is introduced in Section 4.2.

2.2. Online Identification of Model Parameters

The reaction mechanism inside the battery changes with the aging of the battery and the temperature of the working environment. In order to reflect the changes in the internal mechanism of the battery in real time, the Variable Forgetting Factor-Recursive Least Squares (VFF-RLS) algorithm is used to identify various parameters in the Thevenin model online.
Recursive Least Squares (RLS) is an identification method that seeks the optimal matching of battery equivalent circuit model parameter values while ensuring the minimum sum of error squares. VFF-RLS algorithm utilizes an iterative recursive method to update the model parameters of the battery. When the identified system is in operation, the last estimation result is modified based on the newly introduced measurement data. At the same time, a forgetting factor is introduced to reduce the impact of historical data, estimate new battery model parameters, and update the forgetting factor to improve the algorithm’s dynamic tracking ability to parameter changes.
In Formula (8), U(s) is the sum of the voltage on the polarization internal resistance and the ohmic internal resistance. Calculate the frequency domain transfer function between U(s) and IL(s) as shown in Equation (9). The discrete domain transfer function obtained by z-transformation of Equation (9) is shown in Equation (10). In Formulas (10) and (11), τ1 is the time constant, a1~a3 is the coefficient of the intermediate variable, Ts is the sampling time. Further, the battery parameters can be obtained as shown in Formula (12).
U ( s ) = U t ( s ) U O C ( S O C )
G ( s ) = U ( s ) I L ( s ) = R 0 + R p τ 1 s + 1
G ( z ) = a 2 + a 3 z 1 1 a 1 z 1
a 1 = e T s / τ 1 a 2 = R 0 + 1 / C p a 3 = R 0 e T s / τ 1
R 0 = a 3 a 1 C p = 1 a 2 R 0 R p = T S C p l n a 1
Therefore, the model can be represented as follows, where y(k) is the output quantity and h(k) is the observation vector, θ(k) is a parameter vector:
y ( k ) = U ( k ) y ( k ) = h ( k ) T θ ( k ) h ( k ) = [ U ( k 1 ) , I L ( k ) , I L ( k 1 ) ] T θ = [ a 1 , a 2 , a 3 ] T
The VFF-RLS algorithm process is as follows:
(1)
Parameter initialization. θ ^ L S represents the parameters identified by VFF-RLS, I0 is the identity matrix, P is the covariance matrix, δ is a constant:
θ ^ L S ( 0 ) = 1 δ [ 1 , 1 , 1 , 1 , 1 ] T P ( 0 ) = δ I 0
(2)
Calculate estimation error e(k):
e ( k ) = y ( k ) h T ( k ) θ ^ L S ( k 1 )
(3)
Calculate gain matrix K k , among λ It’s a forgetting factor ( 0 < λ 1 ):
K ( k ) = P ( k 1 ) h ( k ) λ + h T ( k ) P ( k 1 ) h ( k )
(4)
Update Covariance matrix P k :
P ( k ) = 1 λ [ I 0 K ( k ) h T ( k ) ] P ( k 1 )
(5)
Parameter estimation:
θ ^ L S ( k ) = θ ^ L S ( k 1 ) + e ( k ) K ( k )
(6)
Update forgetting factor:
λ k = 1 e ( k ) e ( k ) 1 + K ( k ) T P ( k ) K ( k )
In addition, polarization resistance Rp will decrease with the increase of current when the SOC of the battery is constant, and there is a dependence on current. During the online parameter identification process, the battery is in a low current condition, while in power prediction, the current flowing through the battery is relatively large. If the dependence of polarization resistance on the battery current is not considered, it will lead to inaccurate SOP estimation.
The fitting relationship between the polarization resistance of the battery and the current is shown in Equation (20) [27]:
R p = R b + k ln ( | I L | + 1 ) | I L |
In the Formula (20), Rb and k are the fitting coefficients of polarization internal resistance Rp with respect to current. Discharge tests were conducted on the battery under 50% SOC state using pulse currents of different magnification, and Rp of the battery was identified using the least squares method. Table 1 shows the polarization internal resistance of the battery obtained through pulse testing at different current rates, where IR= ln(|IL|+1)/|IL|.
The relationship between the polarization resistance Rp and IR at 50% SOC is shown in Figure 2.
By fitting, it can be obtained that the coefficients Rb =1.79 and k = 0.0139 in Equation (20).

3. Battery State Estimation and Power Prediction

3.1. SOC Estimation Method

In order to predict the power of the battery, the first step is to obtain the SOC of the battery. In this study, the Extended Kalman filter (EKF) algorithm is used to estimate the SOC of the cell. Kalman filter is an algorithm that uses the Equation of state of a linear system to optimally estimate the minimum mean square error of the system state through the system input and output observation data. For nonlinear systems such as batteries, the equation of state and observation equation are usually linearized. At this time KF algorithm is converted into EKF algorithm. The process of EKF algorithm is as follows:
(1)
For state variable x ^ 0 + assign initial value, Assign initial value to error covariance matrix P 0 + , Q 0 and R 0 . Q k 1 is the process excitation noise covariance matrix of the state vector; R k 1 is the observation noise Covariance matrix of the state vector.
Prior estimation of state variables, x ^ k is prior estimation of state variable:
x ^ k = f ( x ^ k 1 + , u k 1 )
Prior estimation of error covariance matrix, P k is prior estimation of error covariance matrix, A k is the system matrix:
P k = A k 1 P k 1 + A k 1 T + Q k 1
(2)
Calculate Kalman gain K k :
K k = P k C k T ( C k P k C k T + R k 1 ) 1
(3)
Posteriori estimation of state variables, x ^ k + is posteriori estimation of state variable:
x ^ k + = x ^ k + K k e k
(4)
Posteriori estimate of the error Covariance matrix, P k + is prior estimation of error covariance matrix:
P k + = P k K k C k P k
Combined with the Equation of state expression of the battery, the coefficient matrices Ak, Bk and Ck in the EKF algorithm are:
A k = 1 0 0 e Δ t τ 1 B k = η Δ t C n R 1 1 e Δ t τ 1 C k = U O C ( S O C ) ( S O C ) 1
Combined with the equation of state expression derived from the battery model in the previous section and the EKF algorithm, the estimated value of battery SOC can be obtained.
In this paper, a joint estimation algorithm of EKF and VFF-RLS is used to estimate the battery state. Firstly, the parameters in the ECM are identified online through the VFF-RLS algorithm using the voltage and current information obtained from real-time measurement and the SOC information obtained from the last estimation, and then the coefficient matrices in the Equation of state are updated using the identified parameters to improve the accuracy of SOC estimation. The structural diagram of the joint estimation algorithm is shown in Figure 3.

3.2. Battery Power Prediction Method

State of Power (SOP) refers to the maximum charging or discharging power of a battery over a period of time in its current state, without violating the preset constraints of battery current, voltage, SOC, or power. Based on the ECM, this paper proposes a battery peak power prediction method based on online parameter identification and state estimation. The power that a battery can continuously provide is related to its terminal voltage, SOC, and its own charging and discharging capacity. Therefore, the power prediction method proposed in this paper mainly considers three constraint conditions: terminal voltage constraint, SOC constraint, and current constraint.

3.2.1. Voltage Constraint

Assuming that the input or output current I of the battery is constant within L sampling periods, the state matrix in the battery equation of state and the parameters in the input matrix are constant, the battery state at the k + L sampling periods can be predicted from the k sampling period, uk is input of the system:
X k + L = A k L X k + ( j = 0 L 1 A L 1 J B k ) u k
Based on this, the voltage Up, k+L on the polarization internal resistance during the k + L sampling period can be calculated:
U p , k + L = U p , k e Δ t τ L I L , k R p 1 e Δ t τ j = 0 L 1 e Δ t τ L j 1
By combining the fitting relationship between Rp and battery current in Formula (20) and removing the exponential term in Formula (28), the terminal voltage Ut, k+L at the k + L sampling cycle can be obtained:
U t , k + L = U oc , k + L U p , k e L Δ t τ I L , k × ( R b + k × l n ( | I L | + 1 ) | I L | ) × 1 e L Δ t τ I L R 0
According to the expression of the battery terminal voltage Ut, k+L obtained from Formula (28) after L cycles, assuming that the voltage is discharged to the lower voltage limit or charged to the upper voltage limit after L cycles, the maximum current that the battery can release within the predicted time can be calculated. In this paper, the Newton iterative method is used to optimize the maximum current under voltage constraints, set the optimization objective function as shown in Formula (29), and the algorithm flow chart is shown in Figure 4.
f ( I L ) = U oc , k + L U p , k e L Δ t τ I L , k × ( R b + k × l n ( | I L | + 1 ) | I L | ) × 1 e L Δ t τ I k R 0 2.5
Among them, Uoc, k+L are the open circuit voltage of the battery at the end of the predicted time, which can be obtained by combining the ampere hour integration method with Uoc’s fitting function on SOC. In order to reduce the computational complexity of the optimization calculation process and ensure the accuracy of the calculation, the calculation of Uoc, k+L is achieved by expanding the Taylor formula on Uoc (SOC).
U oc , k + L = U oc , k I L × η L Δ t Q × U oc S O C S O C S O C = S O C k

3.2.2. SOC Constraint

In practical applications, the SOC of the battery needs to be controlled within a reasonable range according to the situation, in order to ensure the safe and reliable operation of the power lithium-ion battery. During the battery discharge process, it should not be lower than the specified SOCmin, during the charging process, it should not exceed the specified SOCmax, to avoid overcharging and discharging the battery.
The maximum current of the battery during the predicted time can be calculated using the ampere hour integration method, where Q represents the current capacity of the battery:
I L , S O C dis = S O C k S O C min Δ t / Q I L , S O C ch = S O C k S O C max Δ t / Q
In the equation, I L , S O C ch , , I L , S O C dis are the maximum charging and discharging currents obtained under the battery SOC constraint conditions within the duration ∆t.

3.2.3. SOP under Multiple Constraints

The discharging or charging current with the smallest absolute value under various constraints is selected as the maximum continuous current. I min c h and I max dis are maximum battery charging and discharging current given by the battery manufacturer. I L , V ch and I L , V dis is the maximum battery charging and discharging current under voltage constraint.
I L , min ch = min I min ch , I L , S O C ch , I L , V ch I L , max dis = max I max dis , I L , S O C dis , I L , V dis
U t , k + L ch and U t , k + L d i s represent the battery terminal voltage at the end of the prediction window. I L , min c h and I L , max d i s represent the maximum discharge and charging current of the battery within the prediction window. The calculation formula for SOP is shown in Equation (34).
S O P L ch = U t , k + L ch I L , min ch S O P L dis = U t , k + L dis I L , max dis
In summary, this paper proposes a SOP prediction method based on online identification parameters, which can update parameters in real-time to adapt to different working environments and aging levels of batteries. It also considers the dependence of battery polarization internal resistance on current and improves the prediction accuracy of SOP.

4. Experimental Verification

4.1. Experimental Subjects and Platforms

In this paper, the LFP battery with type IFP1780123PA is selected. The lithium-ion battery used in the experiment is shown in Figure 5, and its main parameters are shown in Table 2.
In order to verify the accuracy of the battery peak power estimation method proposed in this paper, a series of battery experiments were designed for experimental verification in this chapter. The experimental platform used for the verification is shown in Figure 6. The high-performance battery testing system Neware CT-4004 5 V 200 A can charge and discharge batteries according to pre-set steps, voltage, and current. The device has a voltage detection range of 0.025–5 V, a sampling accuracy of ±0.05%, a current setting range of 0–200 A, and an accuracy of ±0.05%.

4.2. Battery OCV-SOC Curve

In this paper, the low current charging and discharging method is used to obtain the OCV-SOC curve of the battery. During the charging and discharging process of the battery, a current of 0.05 C is used. Due to the small ohmic potential and polarization potential under low current charging and discharging conditions, they can be ignored. Therefore, it can be considered that the terminal voltage at this point is an open circuit voltage. After data processing, the two curves during charging and discharging are averaged to obtain the OCV-SOC curve of the battery. The experimental results are shown in Figure 7.

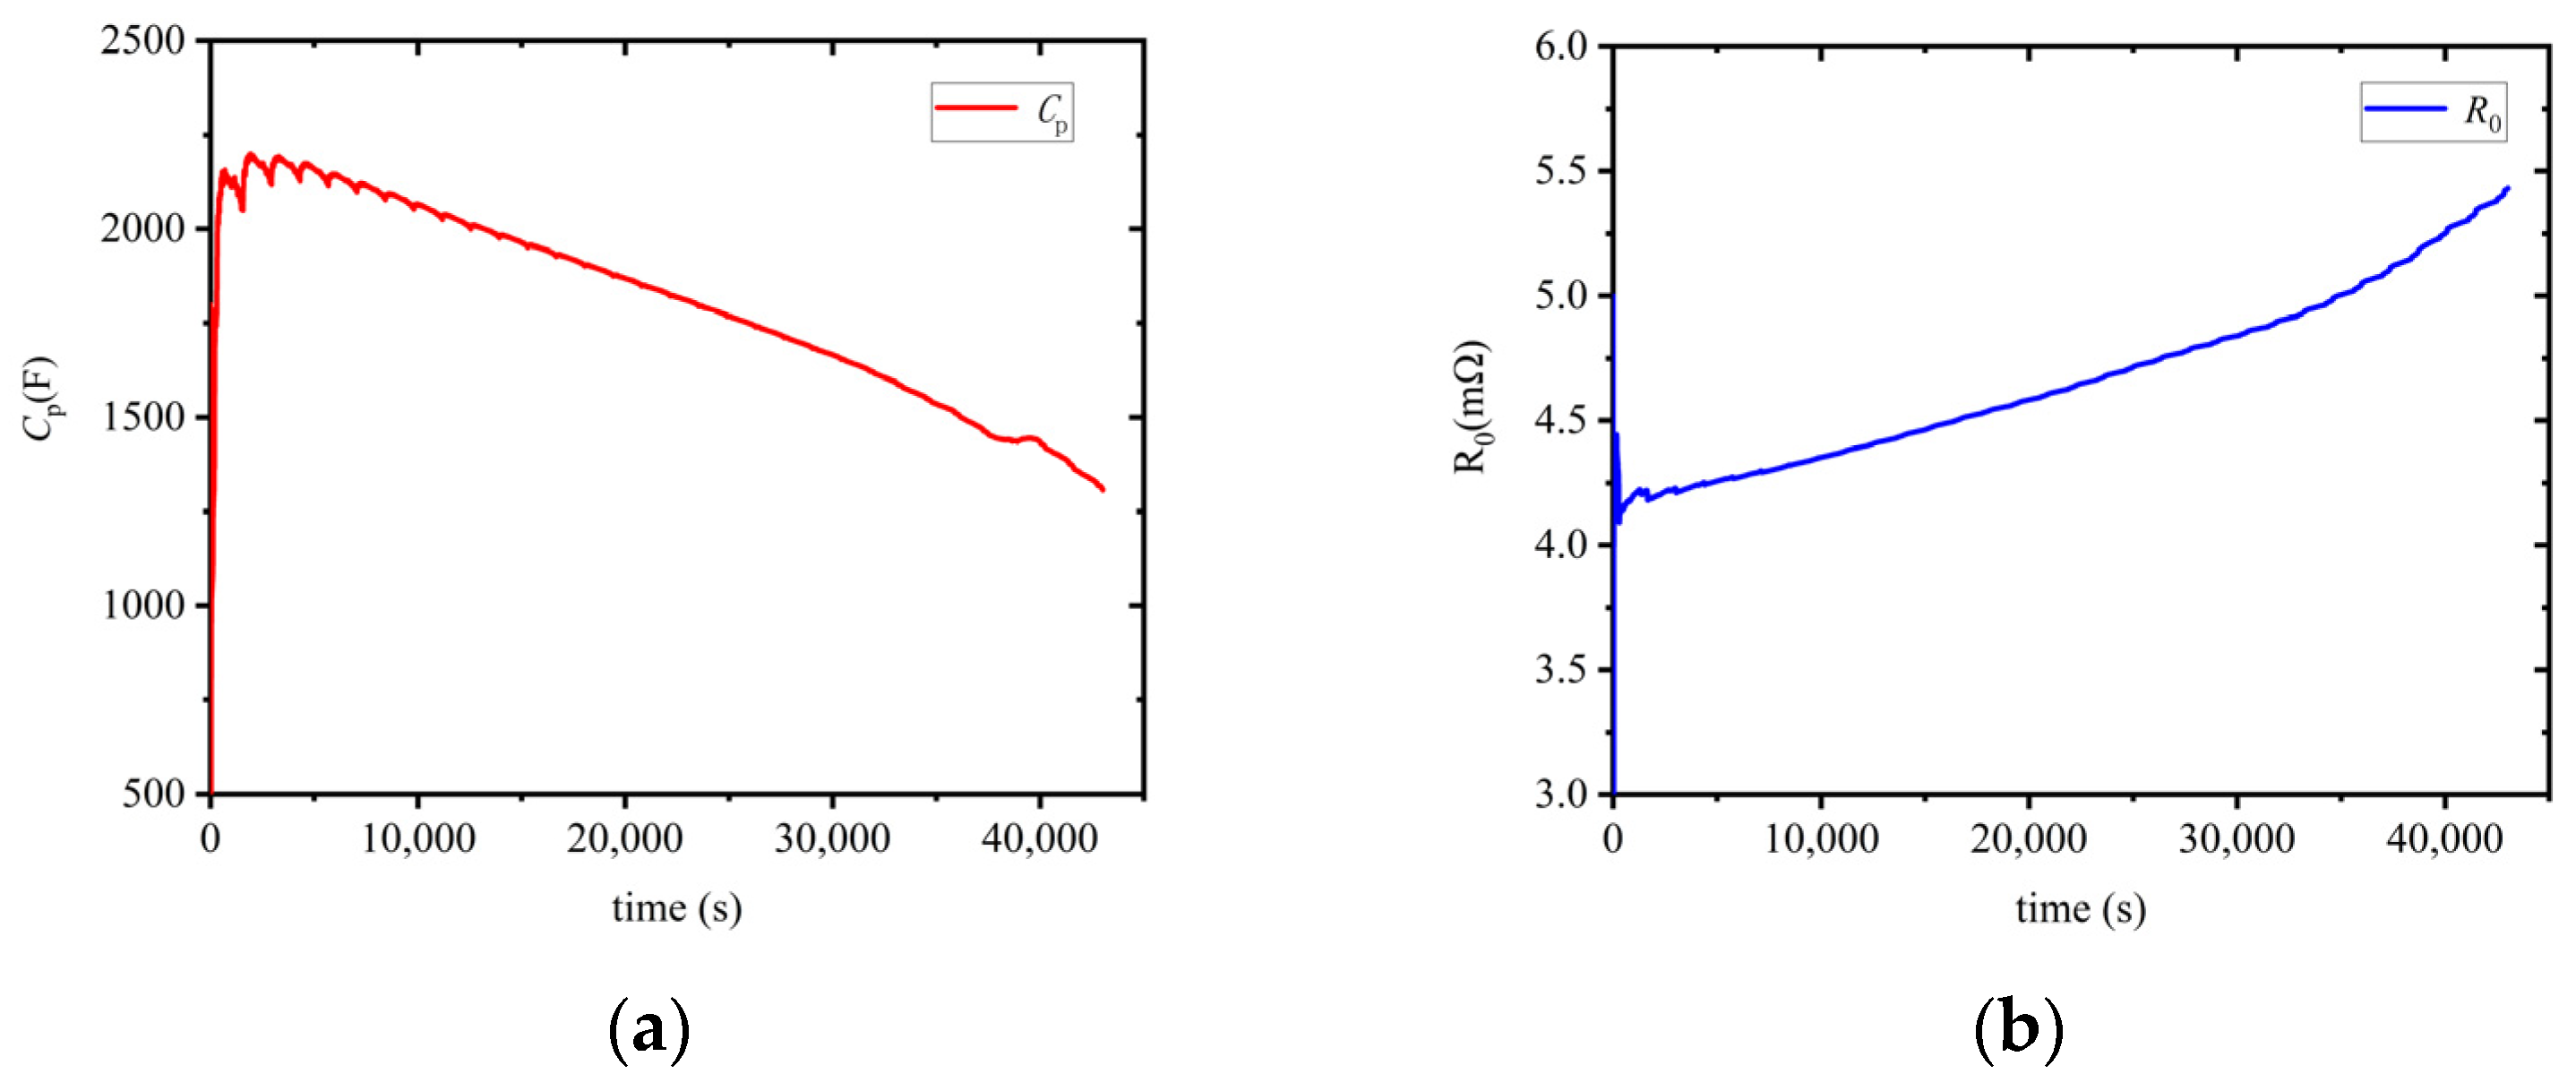
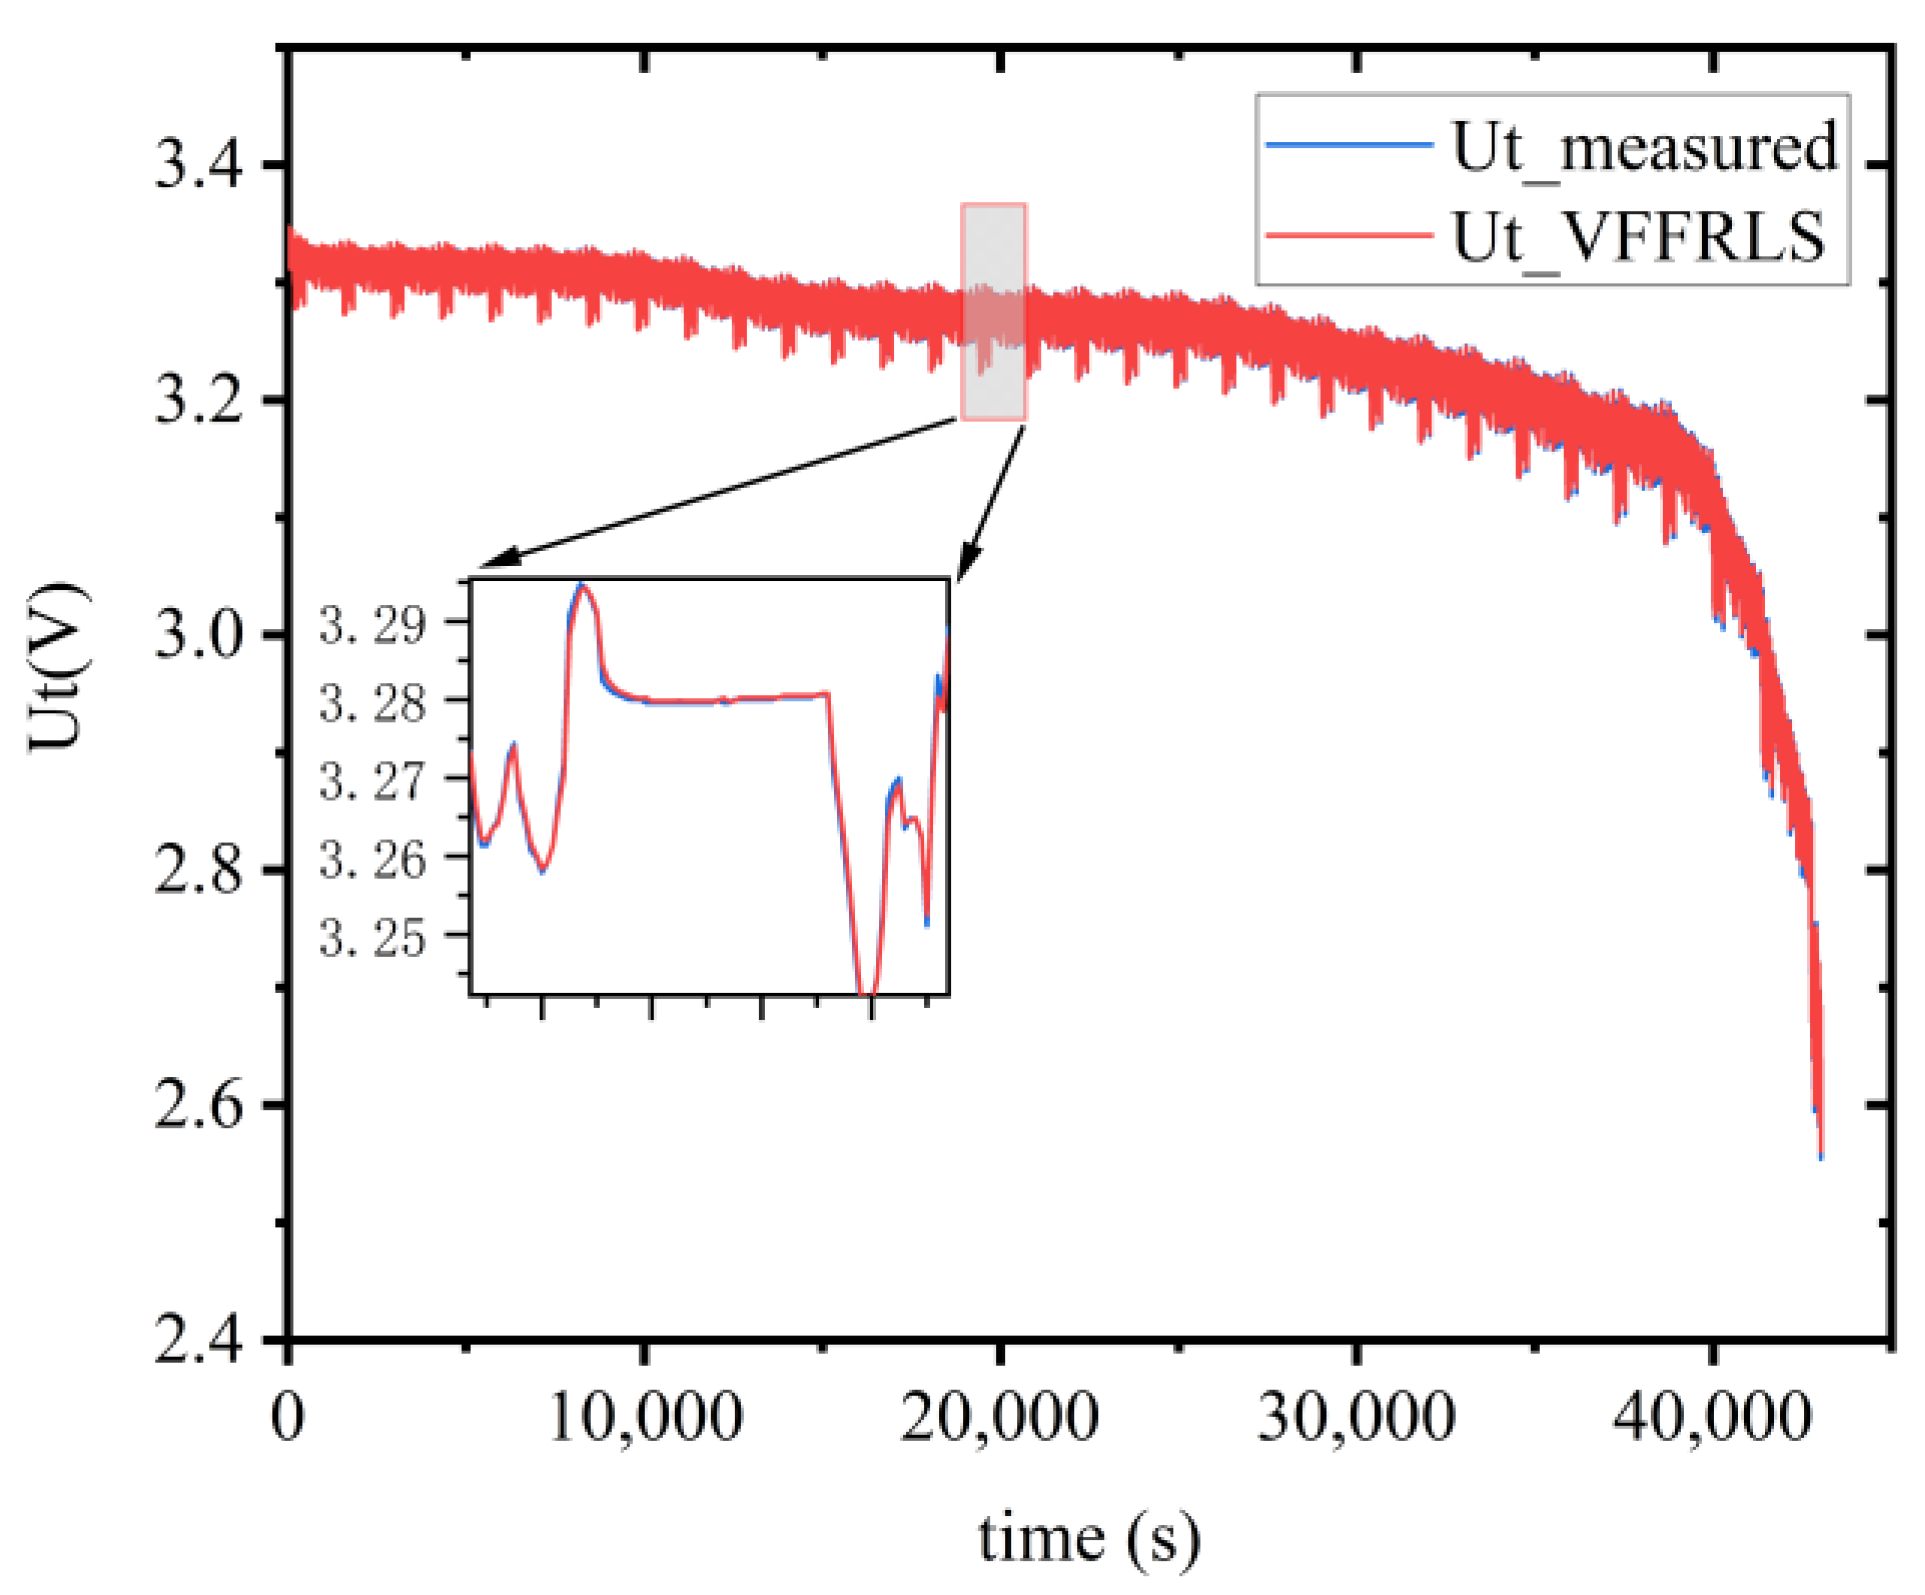
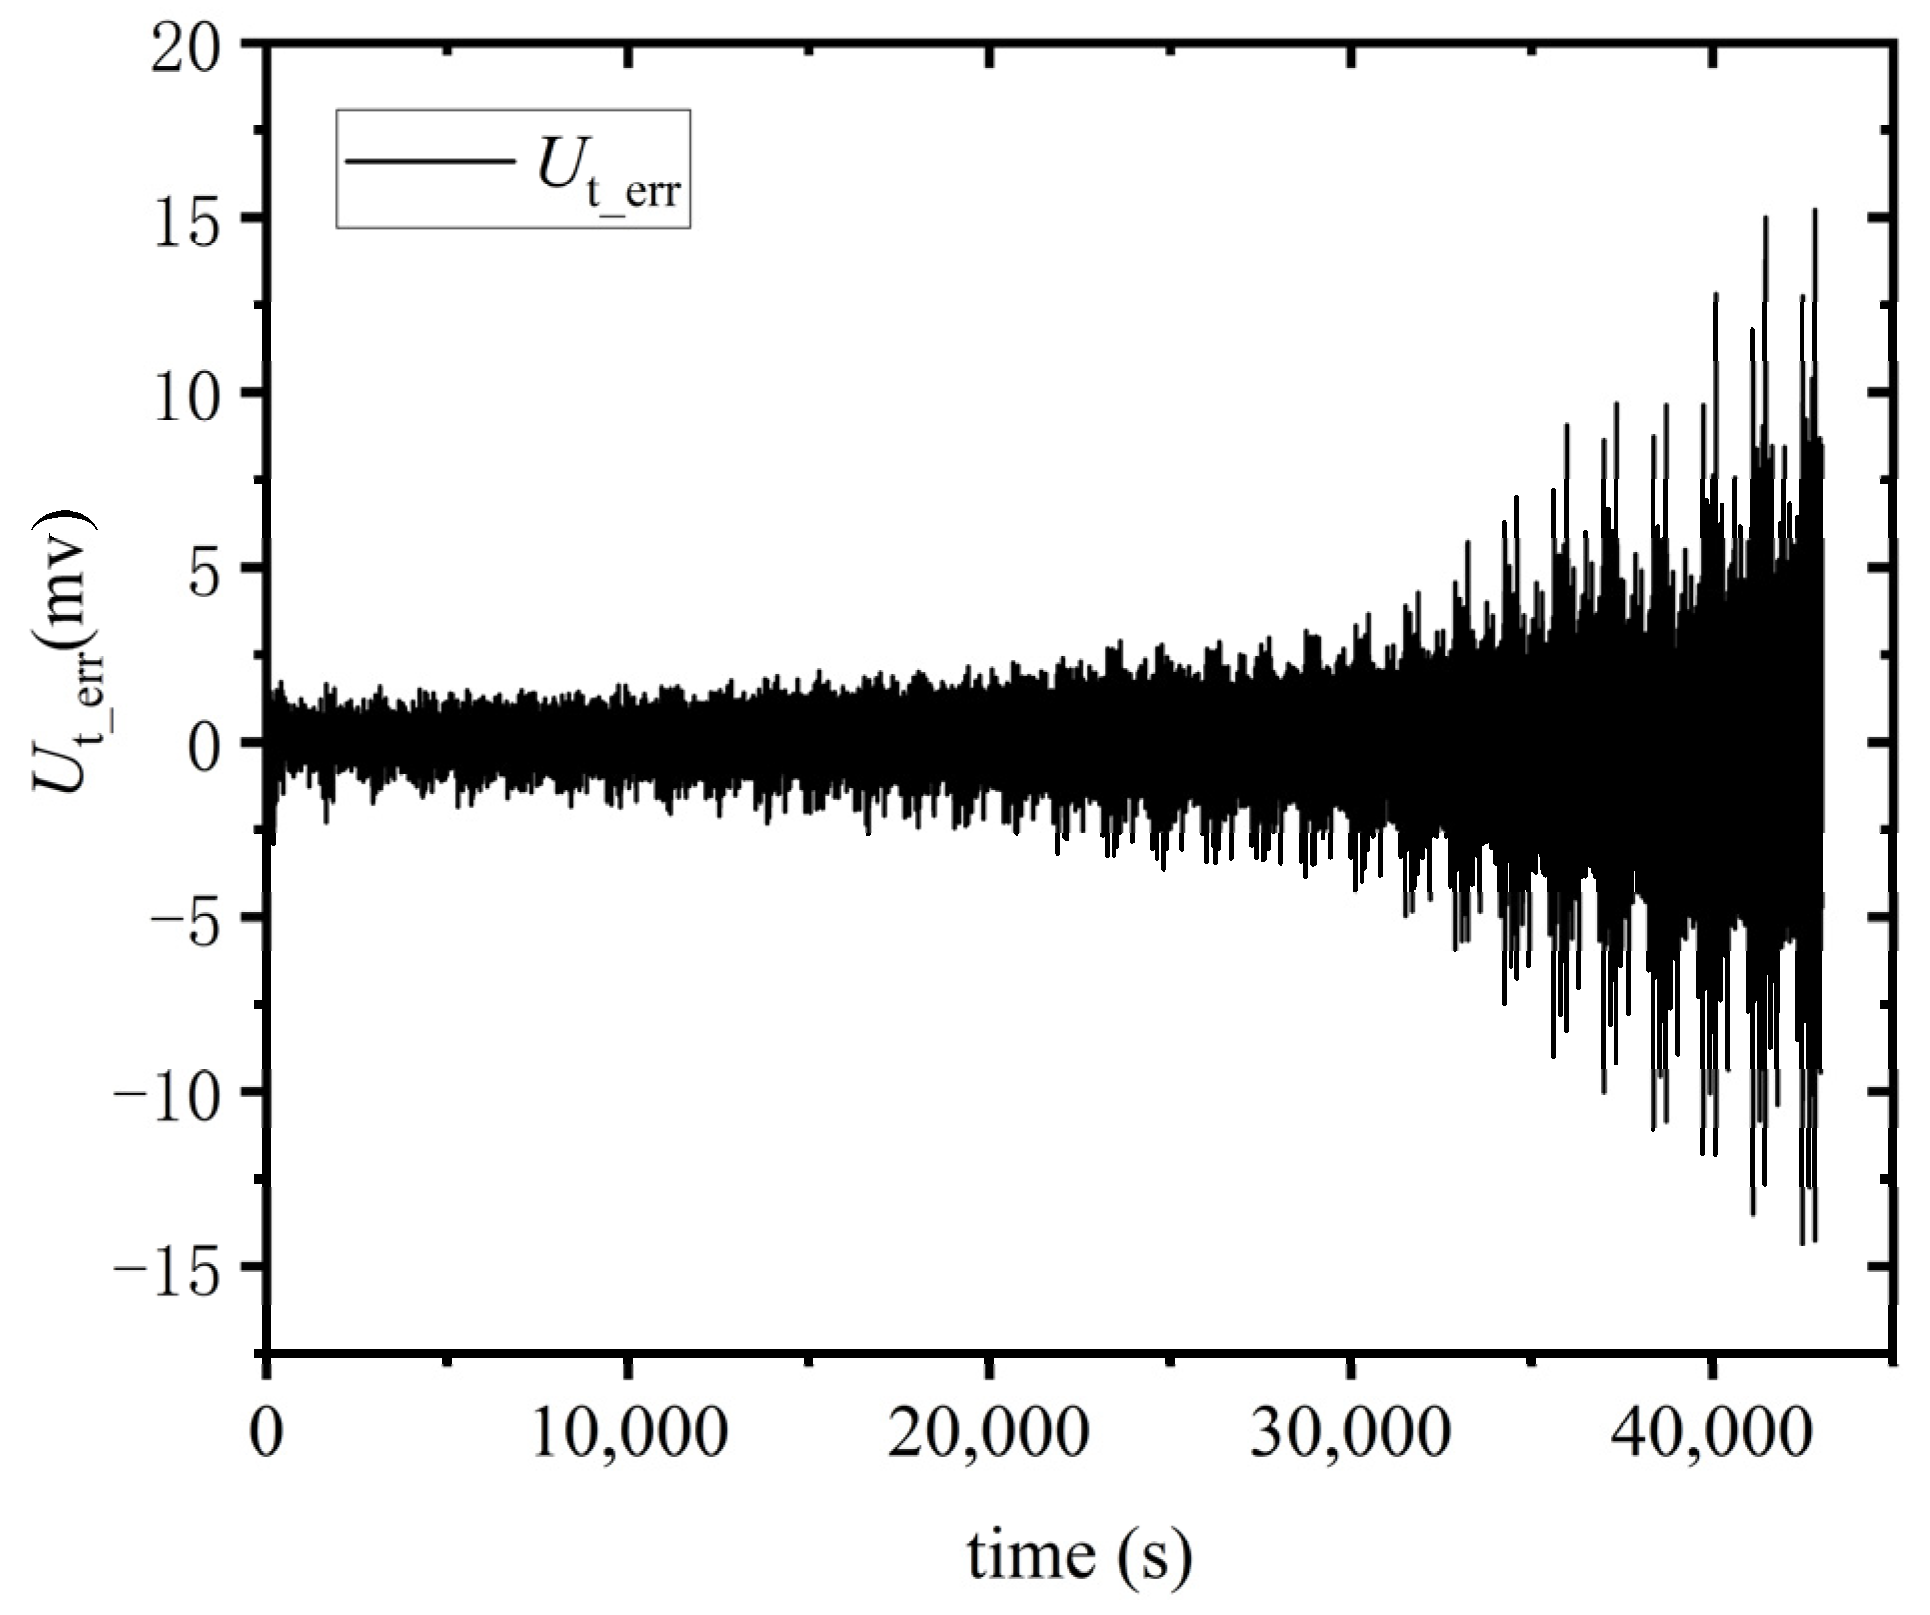
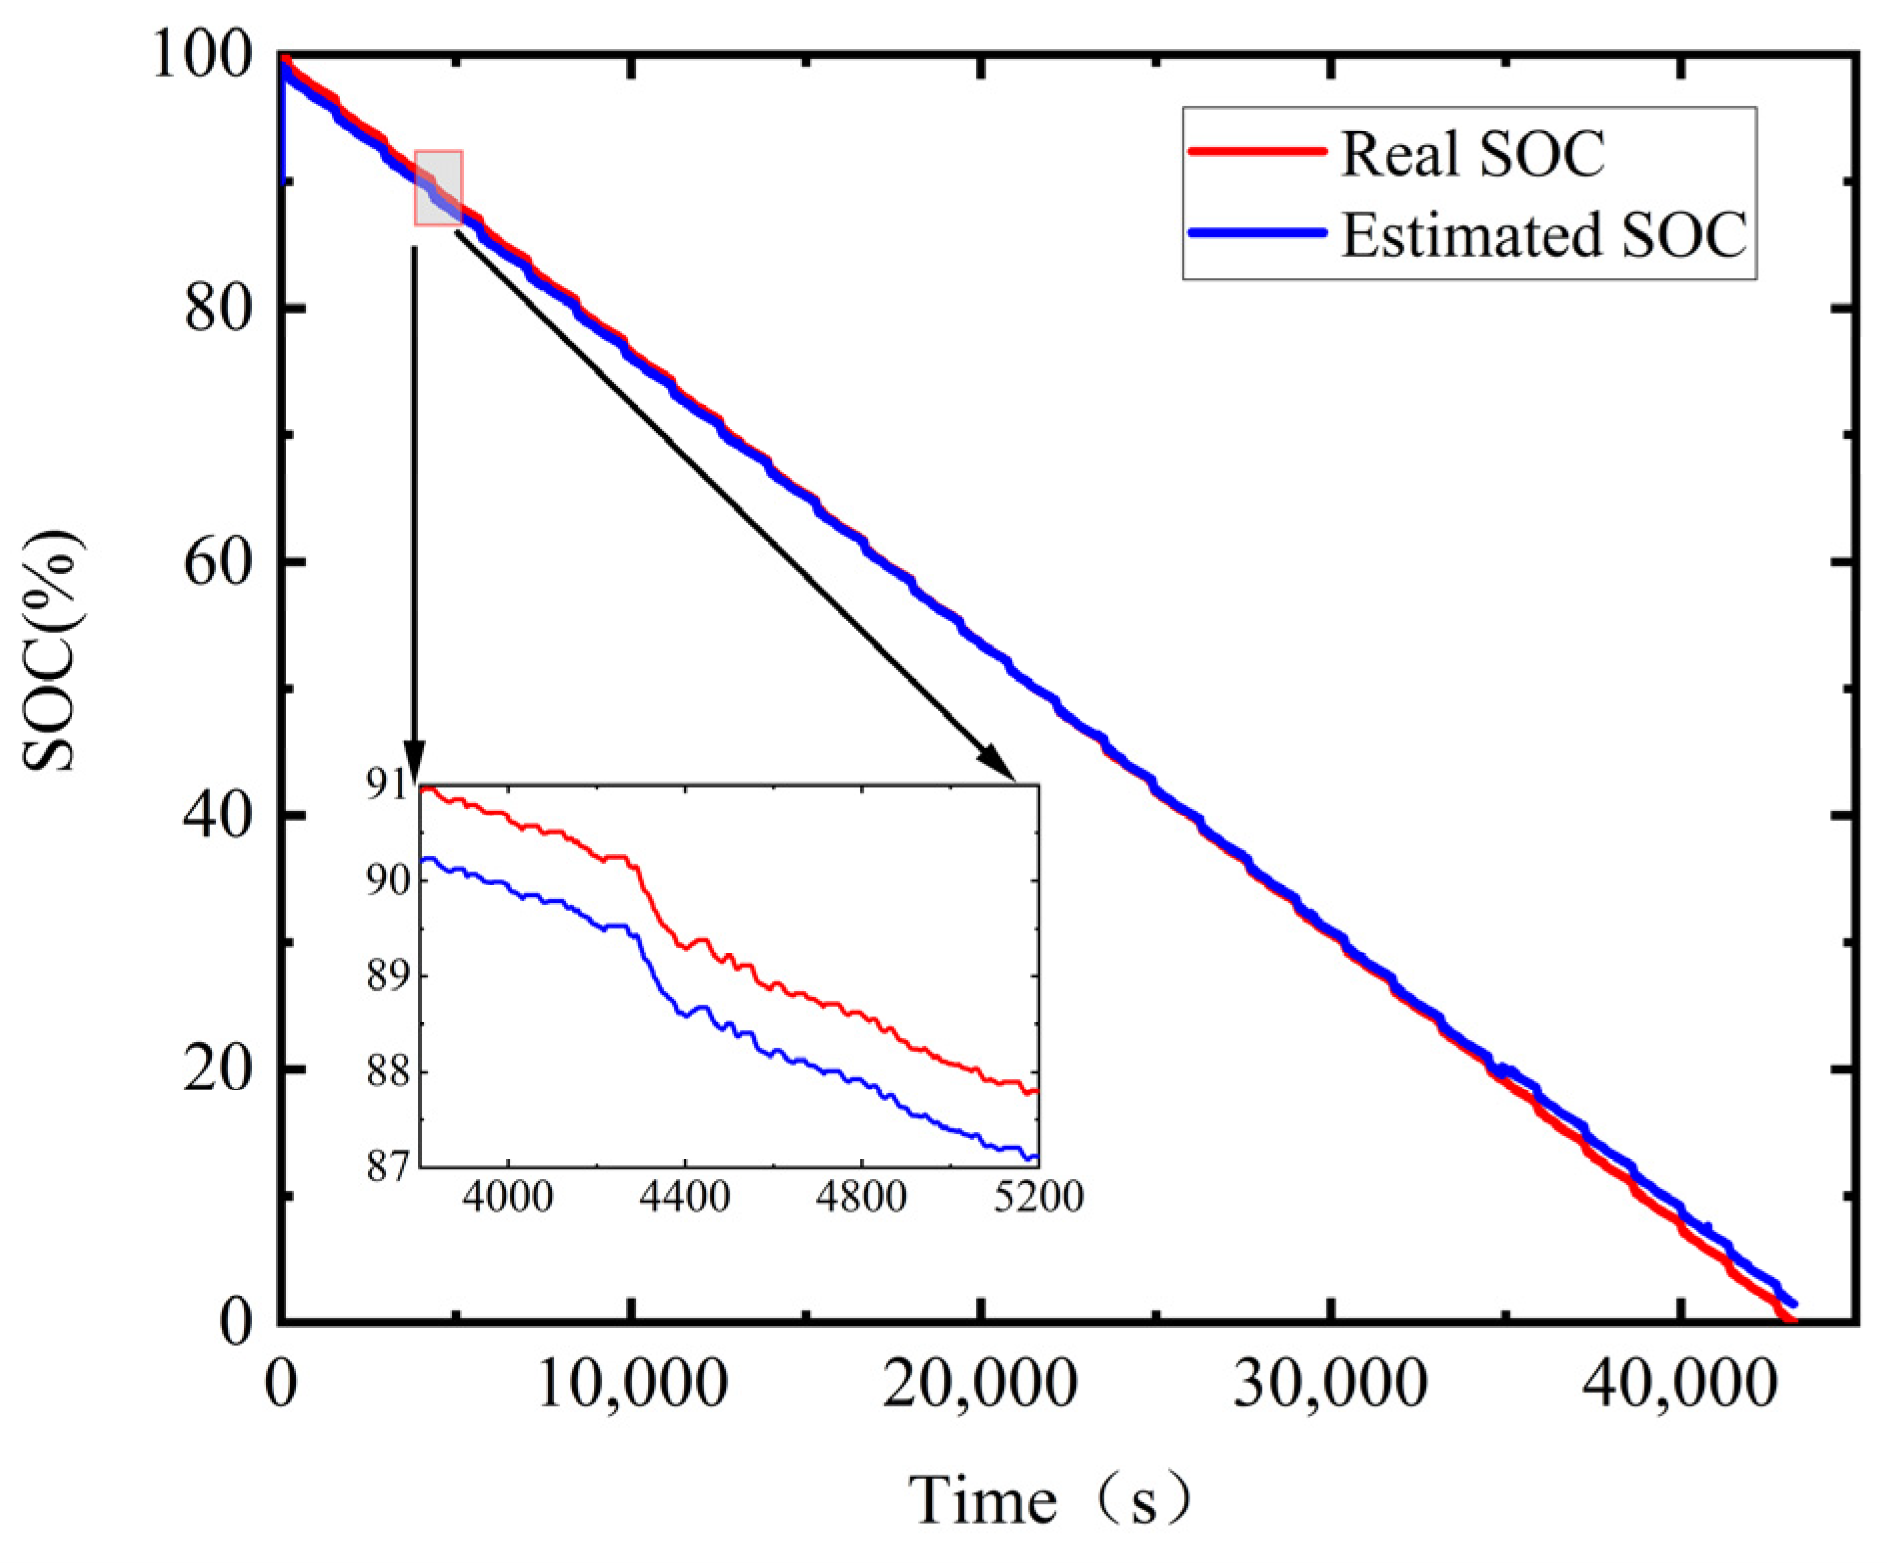
4.3. Online Parameter Identification and SOC Estimation Results

The parameter identification of the equivalent circuit model for lithium-ion batteries is the basis for state estimation. In order to verify the accuracy of the VFF-RLS algorithm in online identification of battery model parameters, this paper conducted FUDS operating conditions testing on the battery at 25 °C room temperature. The ohmic internal resistance R0 and polarization capacitance Cp parameters identified using the VFF-RLS algorithm are shown in Figure 8:
It can be seen that the ohmic internal resistance R0 of the battery increases as the battery discharges, which will lead to a decrease of the battery power release ability. In addition, the polarization capacitance increases with battery discharge.
The model terminal voltage calculated using online identification parameters and the measured battery terminal voltage are shown in Figure 9, and the terminal voltage error is shown in Figure 10.
In Figure 9, it can be concluded that, the terminal voltage output by the model can approach the measured terminal voltage in a very fast time in the FUDS test, and ultimately converge around the measured terminal voltage, indicating that the RLS algorithm has good convergence. In Figure 10, it can be concluded that the absolute error between the terminal voltage output by the model and the actual measured terminal voltage is relatively small, and the absolute error is within 15 mV for most of the entire process.
The SOC estimation results obtained using the joint estimation algorithm and the SOC results and absolute errors obtained from FUDS testing experiments are shown in Figure 11 and Figure 12:
In Figure 11, it can be concluded that the estimated value of battery SOC obtained through the EKF algorithm is very close to the actual value, indicating that the EKF wave algorithm can quickly converge when estimating the state of charge of batteries. In Figure 12, the maximum error after convergence is 1.94%, and the root-mean-square deviation is 0.677, indicating that EKF algorithm has good battery state of charge estimation accuracy.

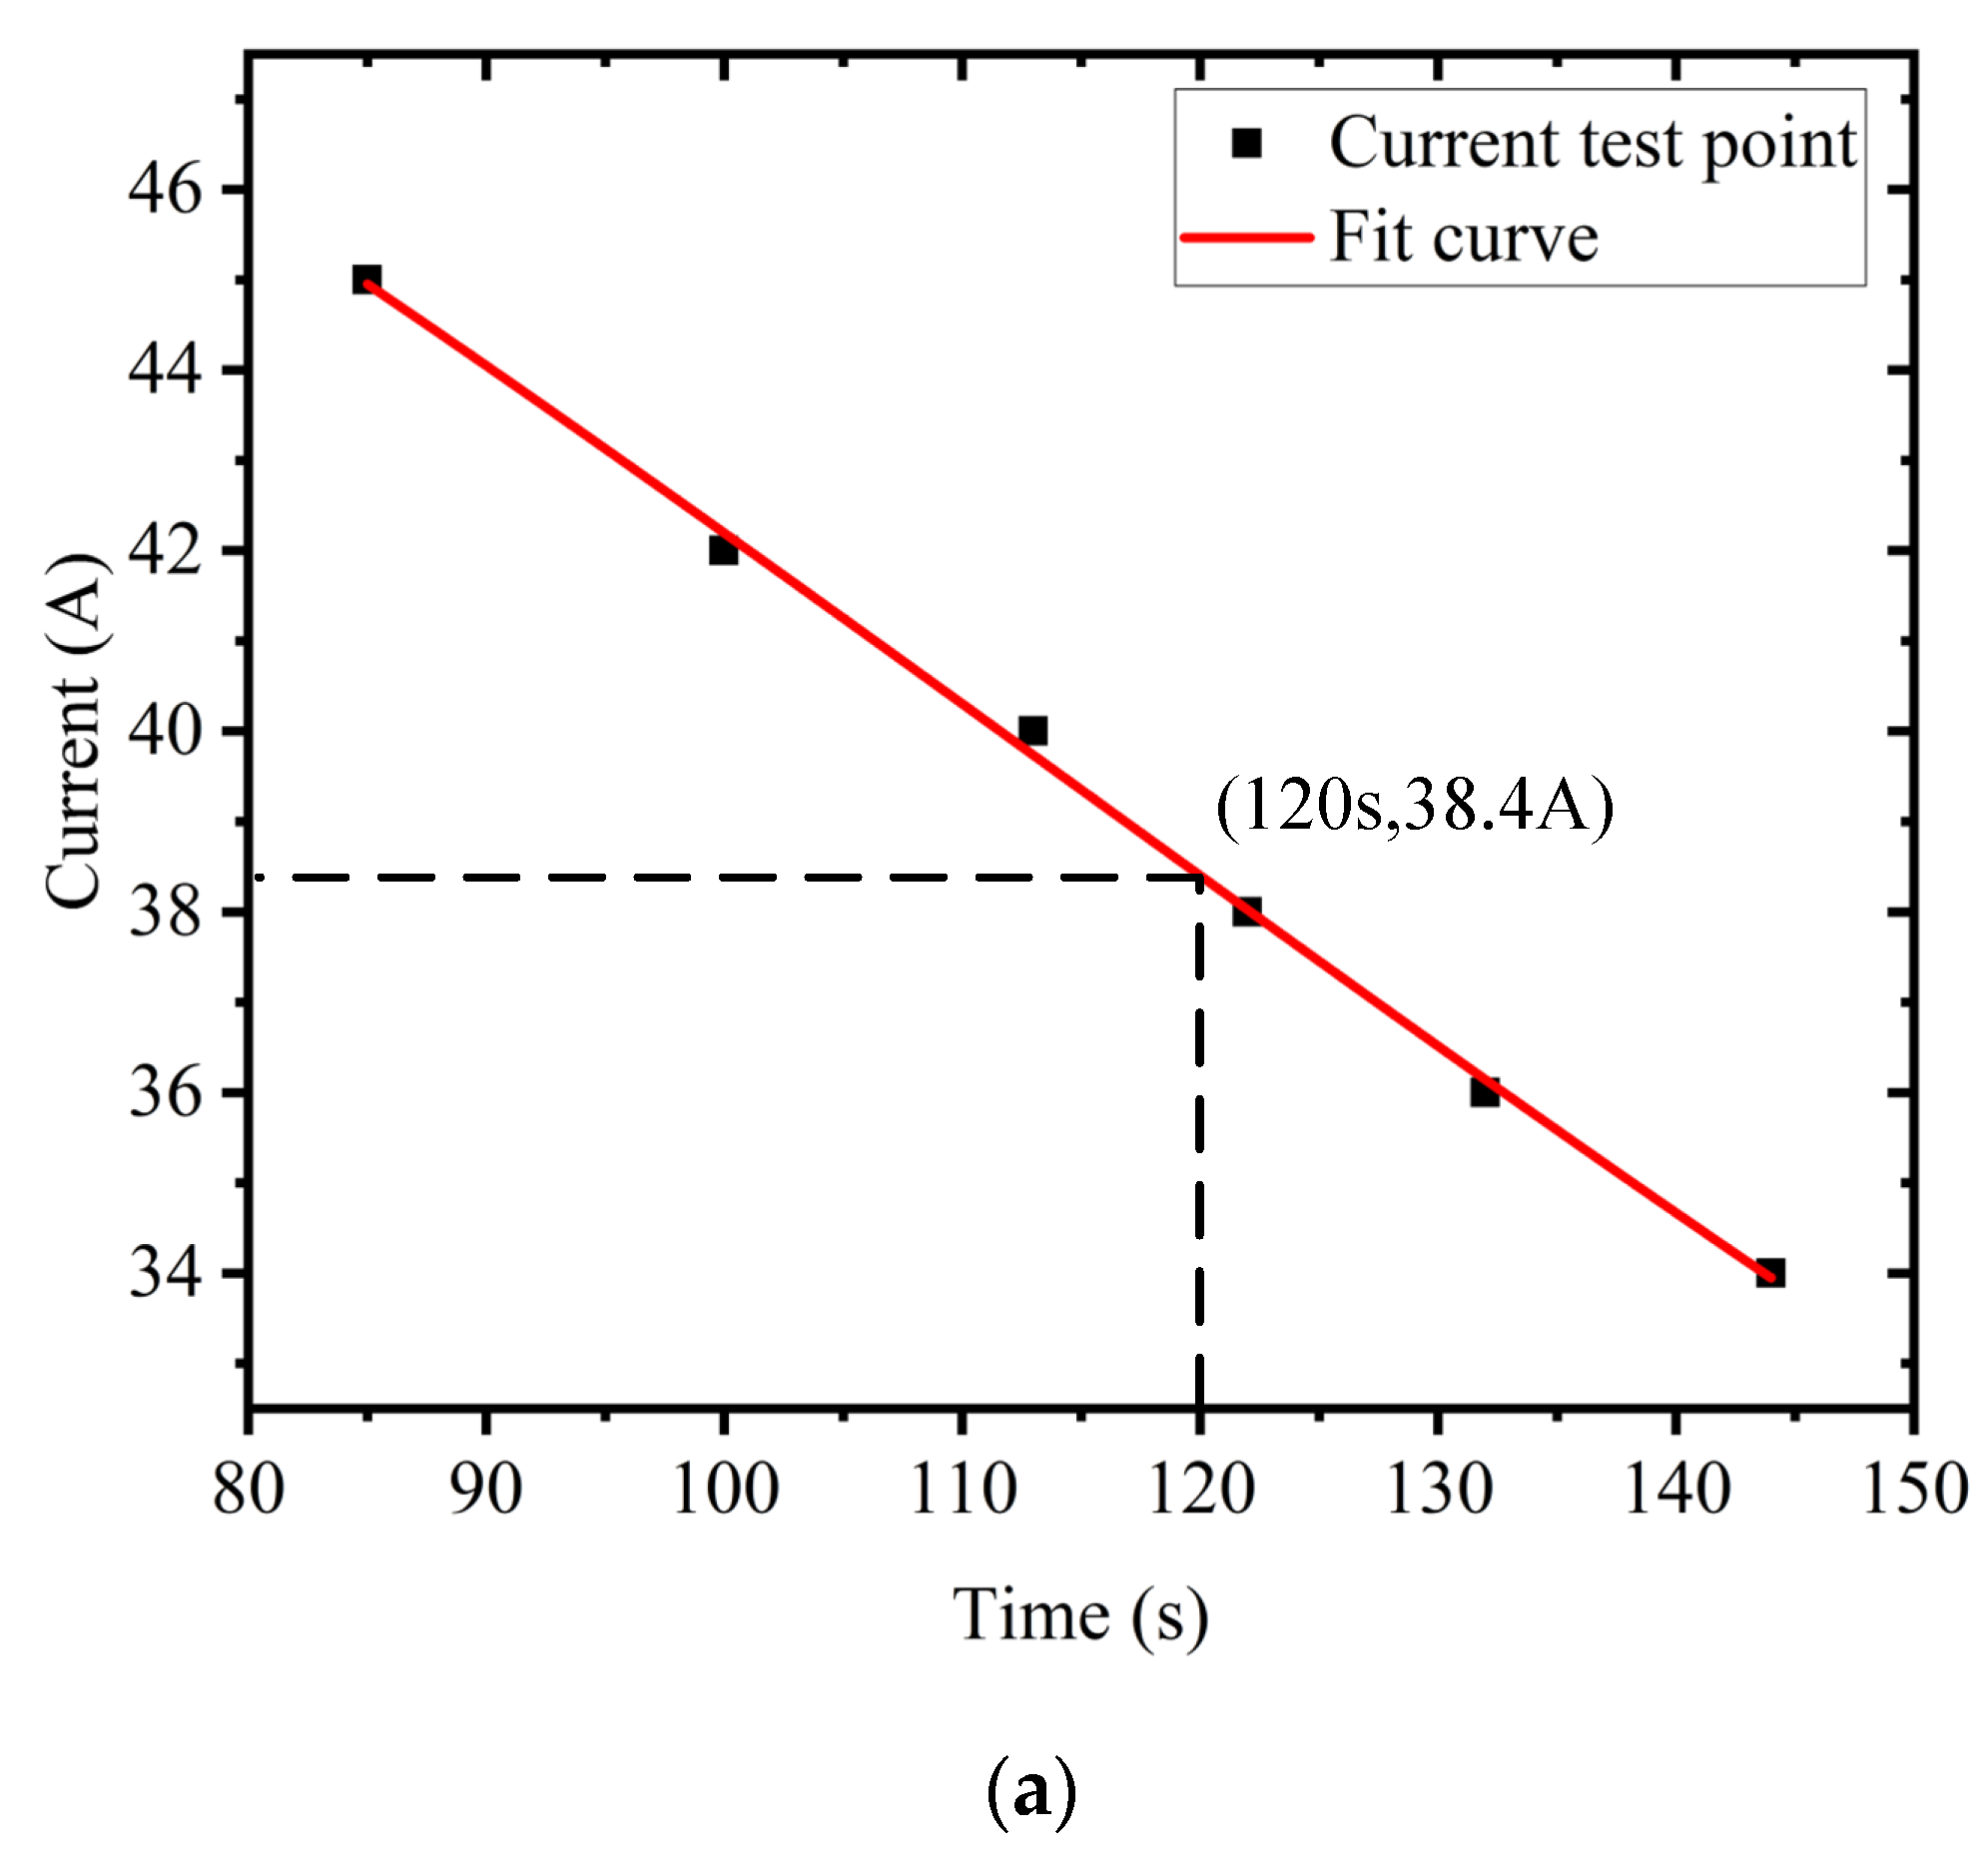
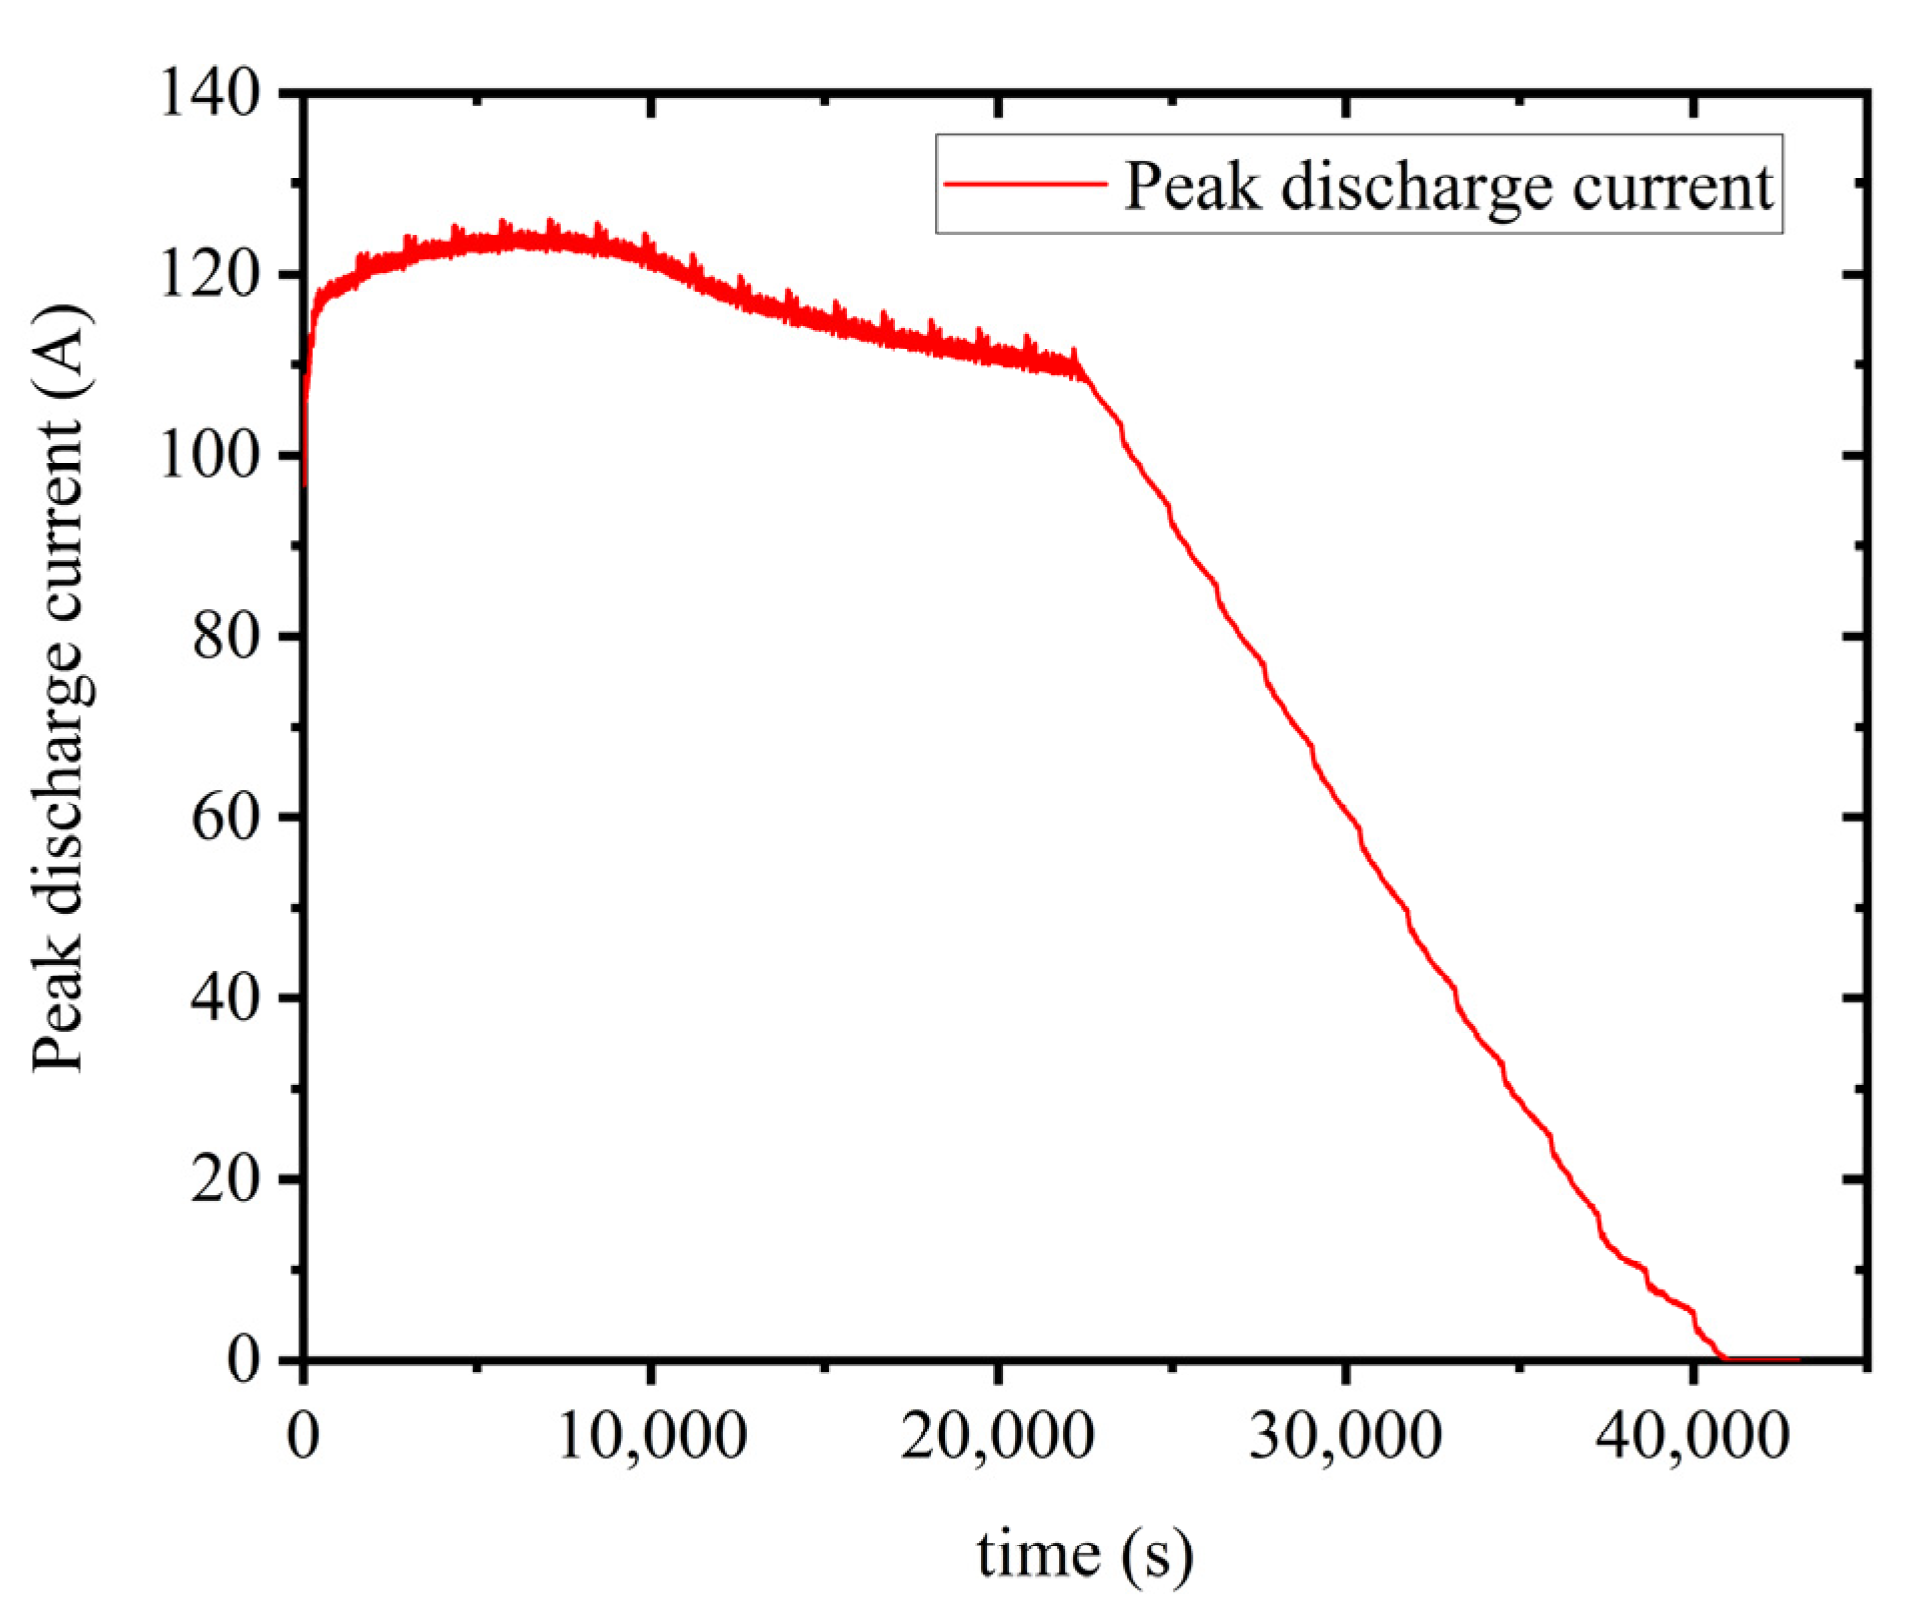
4.4. SOP Prediction Verification

To obtain the reference value of power, an experiment is conducted. The fully charged battery is first discharged to the set SOC point using a constant current of 1/2 C. After standing for 2 h, the battery is discharged using a constant current and the time t taken to discharge to the battery’s cut-off voltage is recorded. Adjust the discharge current according to the magnitude of time t. Repeat the peak current test at least 5 times to ensure that there are two times that are greater than the predicted time and two times that are less than the predicted time. Perform more than 5 discharge tests on the battery at one SOC point, and obtain the fitting curve of the battery discharge current and time through software fitting. By fitting the curve, the peak discharge current reference value of the battery during the predicted time can be obtained. The reference value of the battery peak power is obtained by multiplying the peak discharge current by the battery terminal voltage at the end of discharge. The experimental results of reference values at 70%, 50%, and 20% SOC are shown in Table 3.
By fitting the above data, the maximum discharge current reference values of each SOC point battery can be obtained, as shown in Figure 13. When the battery SOC is 70%, the maximum discharge current reference value corresponding to a discharge time of 120 s is 123 A. When the battery SOC is 50%, the maximum discharge current reference value corresponding to a discharge time of 120 s is 101.6 A. When the SOC of the battery is 20% and the discharge time is 120 s, the corresponding maximum discharge current reference value is 38.4 A.
On the basis of identifying the model parameters using the VFF-RLS algorithm and estimating the SOC using the EKF algorithm, the peak power prediction method based on multi parameter constraints proposed in this paper is validated under FUDS operating conditions. Considering the actual usage of the battery, the lower SOC limit of the battery is set to be 5%. The prediction results of peak current and power based on multi parameter constraints are shown in Figure 14 and Figure 15, with a prediction duration of 120 s and a test temperature of 25 °C.
From the experimental results, it can be seen that for power prediction with a duration of 120 s, voltage constraints play a major role in the first half of the FUDS condition testing, while SOC constraints play a major role in the latter half. Battery discharge is limited by terminal voltage conditions in areas with higher SOC, while battery discharge is limited by SOC in areas with lower SOC. When the SOC of the battery is 70%, the predicted peak current is 117.4 A, with a relative error of 4.5%; When the SOC of the battery is 50%, the predicted peak current is 101.6 A, with a relative error of 8.1%; When the SOC of the battery is 20%, the predicted peak current is 40.34 A, with a relative error of 5.0%. The experimental results demonstrate the effectiveness of the battery peak power estimation method proposed in this paper under multiple constraints.

5. Conclusions

In order to accurately predict the power of lithium-ion batteries online, this study uses the VFF-RLS algorithm and EKF algorithm to jointly estimate the parameters and SOC of the battery. Based on the results of parameter identification and SOC estimation, the battery power prediction under multiple constraint conditions is carried out.
This study avoids extensive preliminary experiments and improves the adaptability of power prediction methods considering battery aging and different temperature conditions, according to the real-time current, voltage and the online identified battery parameters. In addition, the dependence of battery polarization resistance on battery current is considered, which improved the accuracy of power prediction. By using the EKF algorithm for SOC estimation, SOP can be accurately calculated under the constraints of current, voltage, and SOC, with high estimation accuracy and low computational complexity. Finally, the proposed power prediction method is validated under FUDS operating conditions. Results show that the maximum estimation error of SOC is 1.94%, and the power prediction errors at 20%, 50%, and 70% SOC are 5.0%, 8.1%, and 4.5%, respectively.
The experimental results show that the adaptive power prediction method proposed in this paper has good accuracy and can avoid a large amount of preliminary experimental work. Our future work will focus on the effect of SOH on SOP, and study joint estimation of SOH, SOC, and SOP to further improve the accuracy of battery state estimation.

Author Contributions

Conceptualization, J.Y. and J.S.; methodology, C.W.; software, C.M.; validation, C.W., C.M. and Z.Y.; experiments, R.W.; data collection, Y.G.; writing—original draft writing, J.Y.; writing—review and editing, J.S.; supervision, Y.W.; project administration, L.L. All authors have read and agreed to the published version of the manuscript.

Funding

This research was funded by the Special fund for carbon peak and carbon neutralization scientific and technological innovation project of Jiangsu province (No. BE2022031-3).

Institutional Review Board Statement

Not applicable.

Informed Consent Statement

Not applicable.

Data Availability Statement

The data that support the findings of this study are available on request from the corresponding author.

Acknowledgments

This research was funded by the Special fund for carbon peak and carbon neutralization scientific and technological innovation project of Jiangsu province (No. BE2022031-3).

Conflicts of Interest

We declare that we have no financial and personal relationships with other people or organizations that can inappropriately influence our work, there is no professional or other personal interest of any nature or kind in any product, service and/or company that could be construed as influencing the position presented in, or the review of the manuscript entitled.

References

  1. Li, Z.; Khajepour, A.; Song, J. A Comprehensive Review of the Key Technologies for Pure Electric Vehicles. Energy 2019, 182, 824–839. [Google Scholar]
  2. Selvakumar, S.G. Electric and Hybrid Vehicles—A Comprehensive Overview. In Proceedings of the 2021 IEEE 2nd International Conference On Electrical Power and Energy Systems (ICEPES), Bhopal, India, 10–11 December 2021; pp. 1–6. [Google Scholar]
  3. Lu, L.; Han, X.; Li, J.; Hua, J.; Ouyang, M. A Review on the Key Issues for Lithium-Ion Battery Management in Electric Vehicles. J. Power Sources 2013, 226, 272–288. [Google Scholar]
  4. Barelli, L.; Bidini, G.; Cardelli, E.; Ciupageanu, D.-A.; Ottaviano, A.; Pelosi, D.; Castellini, S.; Lazaroiu, G. Adaptive Voltage Control of Islanded RES-Based Residential Microgrid with Integrated Flywheel/Battery Hybrid Energy Storage System. In Proceedings of the 2020 22nd European Conference on Power Electronics and Applications (EPE’20 ECCE Europe), Lyon, France, 7–11 September 2020; pp. 1–10. [Google Scholar]
  5. Barelli, L.; Bidini, G.; Pelosi, D.; Ciupageanu, D.A.; Cardelli, E.; Castellini, S.; Lăzăroiu, G. Comparative Analysis of AC and DC Bus Configurations for Flywheel-Battery HESS Integration in Residential Micro-Grids. Energy 2020, 204, 117939. [Google Scholar]
  6. Ciupageanu, D.-A.; Barelli, L.; Ottaviano, A.; Pelosi, D.; Lazaroiu, G. Innovative Power Management of Hybrid Energy Storage Systems Coupled to RES Plants: The Simultaneous Perturbation Stochastic Approximation Approach. In Proceedings of the 2019 IEEE PES Innovative Smart Grid Technologies Europe (ISGT-Europe), Bucharest, Romania, 29 September–2 October 2019; pp. 1–5. [Google Scholar]
  7. Zhang, T.; Guo, N.; Sun, X.; Fan, J.; Yang, N.; Song, J.; Zou, Y. A Systematic Framework for State of Charge, State of Health and State of Power Co-Estimation of Lithium-Ion Battery in Electric Vehicles. Sustainability 2021, 13, 5166. [Google Scholar] [CrossRef]
  8. Ma, J.; Chen, B.; Wang, L.; Cui, G. Progress and Prospect on Failure Mechanisms of Solid-State Lithium Batteries. J. Power Sources 2018, 392, 94–115. [Google Scholar]
  9. Liu, Y. The Development History of Cathode and Anode Materials of Lithium Ion Battery. In Proceedings of the 7th International Conference on Education, Management, Information and Mechanical Engineering (EMIM 2017), Shenyang, China, 28–30 April 2017; Jing, W., Ning, X., Huiyu, Z., Eds.; Atlantis Press: Paris, France, 2017; Volume 76, pp. 1399–1402. [Google Scholar]
  10. Guo, R.; Shen, W. An Enhanced Multi-Constraint State of Power Estimation Algorithm for Lithium-Ion Batteries in Electric Vehicles. J. Energy Storage 2022, 50, 104628. [Google Scholar] [CrossRef]
  11. Lai, X.; He, L.; Wang, S.; Zhou, L.; Zhang, Y.; Sun, T.; Zheng, Y. Co-Estimation of State of Charge and State of Power for Lithium-Ion Batteries Based on Fractional Variable-Order Model. J. Clean. Prod. 2020, 255, 120203. [Google Scholar] [CrossRef]
  12. Farmann, A.; Sauer, D.U. A Comprehensive Review of On-Board State-of-Available-Power Prediction Techniques for Lithium-Ion Batteries in Electric Vehicles. J. Power Sources 2016, 329, 123–137. [Google Scholar]
  13. Shen, X.; Sun, B.; Qi, H.; Shen, X.; Su, X. Research on Peak Power Test Method for Lithium Ion Battery. Energy Procedia 2018, 152, 550–555. [Google Scholar] [CrossRef]
  14. Jin, C.; Sun, Y.; Zheng, Y.; Yang, X.; Lai, X.; Gu, H.; Feng, X. Experimental Investigation of State-of-Power Measurement for Lithium-Ion Batteries. Int. J. Energy Res. 2021, 45, 7549–7560. [Google Scholar] [CrossRef]
  15. Guo, R.; Shen, W. A Data-Model Fusion Method for Online State of Power Estimation of Lithium-Ion Batteries at High Discharge Rate in Electric Vehicles. Energy 2022, 254, 124270. [Google Scholar] [CrossRef]
  16. Tang, X.; Yao, K.; Liu, B.; Hu, W.; Gao, F. Long-Term Battery Voltage, Power, and Surface Temperature Prediction Using a Model-Based Extreme Learning Machine. Energies 2018, 11, 86. [Google Scholar] [CrossRef] [Green Version]
  17. Plett, G.L. High-Performance Battery-Pack Power Estimation Using a Dynamic Cell Model. IEEE Trans. Veh. Technol. 2004, 53, 1586–1593. [Google Scholar] [CrossRef] [Green Version]
  18. Zhang, W.; Wang, L.; Wang, L.; Liao, C.; Zhang, Y. Joint State-of-Charge and State-of-Available-Power Estimation Based on the Online Parameter Identification of Lithium-Ion Battery Model. IEEE Trans. Ind. Electron. 2022, 69, 3677–3688. [Google Scholar] [CrossRef]
  19. Yang, L.; Cai, Y.; Yang, Y.; Deng, Z. Supervisory Long-Term Prediction of State of Available Power for Lithium-Ion Batteries in Electric Vehicles. Appl. Energy 2020, 257, 114006. [Google Scholar] [CrossRef]
  20. Lin, P.; Jin, P.; Hong, J.; Wang, Z. Battery Voltage and State of Power Prediction Based on an Improved Novel Polarization Voltage Model. Energy Rep. 2020, 6, 2299–2308. [Google Scholar] [CrossRef]
  21. Liu, C.; Hu, M.; Jin, G.; Xu, Y.; Zhai, J. State of Power Estimation of Lithium-Ion Battery Based on Fractional-Order Equivalent Circuit Model. J. Energy Storage 2021, 41, 102954. [Google Scholar] [CrossRef]
  22. Tan, Y. Joint Estimation of Ternary Lithium-Ion Battery State of Charge and State of Power Based on Dual Polarization Model. Int. J. Electrochem. Sci. 2020, 1128–1147. [Google Scholar] [CrossRef]
  23. Pei, L.; Zhu, C.; Wang, T.; Lu, R.; Chan, C.C. Online Peak Power Prediction Based on a Parameter and State Estimator for Lithium-Ion Batteries in Electric Vehicles. Energy 2014, 66, 766–778. [Google Scholar] [CrossRef]
  24. Wei, C.; Benosman, M.; Kim, T. Online Parameter Identification for State of Power Prediction of Lithium-Ion Batteries in Electric Vehicles Using Extremum Seeking. Int. J. Control Autom. Syst. 2019, 17, 2906–2916. [Google Scholar] [CrossRef]
  25. Wang, J.; Wang, S.; Yu, C.; Li, B.; He, M. An Online Method for Power State Estimation of Lithium-Ion Batteries under the Constraints of the Fusion Model Considering Temperature Effect. Int. J. Electrochem. Sci. 2022, 17, 220764. [Google Scholar] [CrossRef]
  26. Zhang, X.; Wang, Y.; Wu, J.; Chen, Z. A Novel Method for Lithium-Ion Battery State of Energy and State of Power Estimation Based on Multi-Time-Scale Filter. Appl. Energy 2018, 216, 442–451. [Google Scholar] [CrossRef]
  27. Waag, W.; Fleischer, C.; Sauer, D.U. Adaptive On-Line Prediction of the Available Power of Lithium-Ion Batteries. J. Power Sources 2013, 242, 548–559. [Google Scholar] [CrossRef]
Figure 1. Thevenin equivalent circuit model.
Processes 11 02449 g001
Figure 2. The relationship between Rp and IR.
Processes 11 02449 g002
Figure 3. Block diagram of joint estimation algorithm structure.
Processes 11 02449 g003
Figure 4. Newton iterative method flow chart.
Processes 11 02449 g004
Figure 5. IFP1780123PA lithium-ion Battery.
Processes 11 02449 g005
Figure 6. Experimental platform.
Processes 11 02449 g006
Figure 7. OCV-SOC curve obtained by low current charging and discharging method.
Processes 11 02449 g007
Figure 8. Parameter identification results. (a) Polarization capacitance Cp. (b) Ohmic internal resistance R0.
Processes 11 02449 g008
Figure 9. Model output terminal voltage and measurement terminal voltage.
Processes 11 02449 g009
Figure 10. Absolute error between model output voltage and measurement voltage.
Processes 11 02449 g010
Figure 11. SOC estimated and real values.
Processes 11 02449 g011
Figure 12. Absolute Error of SOC Estimation.
Processes 11 02449 g012
Figure 13. Maximum Discharge Current Reference Value for 120 s (a) 20% SOC (b) 50% SOC (c) 70% SOC.
Processes 11 02449 g013aProcesses 11 02449 g013b
Figure 14. Maximum discharge current for 120 s under multiple constraint conditions.
Processes 11 02449 g014
Figure 15. Battery peak discharge power for 120 s.
Processes 11 02449 g015
Table 1. Polarization internal resistance Rp under different currents.
Current420406080100120
IR (lnA/A)0.4020.1520.09280.06850.05490.04610.0399
Rp (mΩ)7.164.673.112.582.242.322.35
Table 2. Battery technical parameters table.
ItemsParameter
Working voltage3.2 V
Nominal capacity8 Ah
Charging cutoff voltage3.65 V
Discharge cutoff Voltage2.5 V
Maximum charging current10 C
Maximum discharge current30 C
Operating temperature rangeDischarge: 0~30 °C
Charge: −20~60 °C
Table 3. Pulse current experiment at 70%, 50%, 20% SOC.
SOC (%)Discharge Current (A)Discharge Time (s)
70129115
127117
124119
120124
117126
115129
50120105
110107
105114
103116
100125
95138
204585
42100
40113
38122
36132
34144
Disclaimer/Publisher’s Note: The statements, opinions and data contained in all publications are solely those of the individual author(s) and contributor(s) and not of MDPI and/or the editor(s). MDPI and/or the editor(s) disclaim responsibility for any injury to people or property resulting from any ideas, methods, instructions or products referred to in the content.

