Article

Nondestructive Technique for Identifying Adulteration and Additives in Lemon Juice Based on Analyzing Volatile Organic Compounds (VOCs)

by
Nasim Mohammadian
1,
Aman Mohammad Ziaiifar
1,*,†,
Esmaeil Mirzaee-Ghaleh
2,†,
Mahdi Kashaninejad
1 and
Hamed Karami
3,*,†
1
Department of Food Process Engineering, Faculty of Food Science and Technology, Gorgan University of Agricultural Sciences and Natural Resources, Gorgan 4913815739, Iran
2
Department of Mechanical Engineering of Biosystems, Razi University, Kermanshah 6715685421, Iran
3
Department of Petroleum Engineering, Knowledge University, Erbil 44001, Iraq
*
Authors to whom correspondence should be addressed.
These authors contributed equally to this work.
Processes 2023, 11(5), 1531; https://doi.org/10.3390/pr11051531
Submission received: 16 April 2023 / Revised: 6 May 2023 / Accepted: 15 May 2023 / Published: 17 May 2023
(This article belongs to the Special Issue Food Safety Management and Quality Control Techniques)

Abstract

:
In light of the frequent occurrence of counterfeit food sold in global commercial markets, it is necessary to verify the authenticity of tasty natural-plant-based products by checking their labels, as well as their pricing and quality control. Lemon juice has repeatedly been the victim of fraud attempts by manufacturers to lower the price of products. Electronic noses are used in many fields, including the beverage industry, for classification and quality control. This involves the detection and differentiation of volatile organic compounds (VOCs) released from food. This study evaluated pure lemon juice and 11 counterfeit samples (water, lemon pulp, and wheat straw) using an electronic nose equipped with 8 metal oxide sensors to detect fraud. Chemometric methods such as principal component analysis (PCA), linear and quadratic analysis (LDA), support vector machines (SVMs), and artificial neural networks (ANNs) were used to analyze the response patterns of the sensors. The outputs of eight sensors were considered as the input of the model and the number of lemon juice groups, and its adulterations were also considered as the output of the model. Of the total data, 60% (for training), 20% (for validation), and 20% (for testing) were used. According to the results, all models had an accuracy of more than 95%, and the Nu-SVM linear function method had the highest accuracy among all models. Hence, it can be concluded that the electronic nose based on metal oxide semiconductor sensors combined with chemometric methods can be an effective tool with high efficiency for rapid and nondestructive classification of pure lemon juice and its counterfeits.

1. Introduction

An economic motivation for food fraud occurs when a substance is intentionally substituted for or added to another food to improve it for financial gain [1]. Counterfeit foods can be potentially harmful to consumers if they are allergic to ingredients not listed on the label, if the product is contaminated with harmful microorganisms, or if the added ingredients contain detrimental additives [2].
Economic fraud is a crime under the Code of Federal Regulations (CFR). Even simple economic fraud can inadvertently lead to health problems for consumers of counterfeit goods. Contamination of infant formula with melamine is a common example of economically motivated fraud [3]. In 2012, the National Consumer League (NCL), the oldest consumer protection organization in the United States, called on the U.S. Food and Drug Administration (USFDA) to take action against manufacturers of “100%” lemon juice who dilute lemon juice with more water than is needed to make a concentrated juice. USFDA field investigations of suspect samples of lemon juice have resulted in import warnings and refusal to ship the product [4].
In people’s diets, lemon juice is an important ingredient because it contains many natural compounds, such as vitamin C, antioxidants, and anticancer compounds, with many health benefits. Lemon juice is consumed both in cooking and as a beverage [5]. It is also an excellent source of micronutrients, including phenolic compounds (mainly flavonoids) and other nutrients (vitamins, minerals, fiber, and essential oils) that promote health [6]. Consumption of this juice has been associated with lowering blood pressure and plasma cholesterol levels, as well as a possible treatment of urinary tract and mental disorders [7]. It also contains citrus flavonoids (such as naringin, hesperitin, and erythrosin), which have been related to cancer prevention [8].
Lemon juice is susceptible to fraud due to its increasing demand. There are several types of lemon juice fraud, such as the use of undeclared sugar and water, the addition of peel and/or pulp washing agents, and/or the addition of other undeclared compounds and juices from other citrus fruits, which are not allowed [6].
The titratable acidity content and degrees Brix (°Bx) can be used as indicators to check whether the juice has been diluted too much with water, which is the simplest method of deception. However, since these values are easy to measure, fraudsters often dilute fruit juices with water containing sugar and citric acid. It is therefore necessary to use comprehensive analytical approaches to detect changes in chemical composition due to fruit juice fraud [9]. Fraud in the composition of fruit juice without sugar has a negative impact on the quality of the juice. The impact of food fraud now affects a larger and broader population than ever before as globalization increases. Fraud in lemon juice is a persistent problem, so appropriate analytical methods are needed. The use of methods in conjunction with chemistry to detect fraud is now in high demand, such as liquid chromatography linked to isotope ratio mass spectrometry (LC-IRMS) [10], high-performance liquid chromatography (HPLC) [11], HPLC and isotope ratio mass spectrometry (IRMS) [12], inductively coupled plasma mass spectrometry (ICP-MS) [13], and gas chromatography (GC) coupled with flame ionization detector (FID) [14] methods, but many of these methods, including LC, GC, and IMS, are expensive (solvent consumption) and time-consuming [15,16].
In recent years, research has focused intensively on the development of nondestructive methods for measuring fruit quality. Accordingly, quality is generally associated with the consumer’s perception of food, which is mediated by the senses, so the superior tool to determine food quality is the human senses [17]. Experts in the food industry often evaluate quality based on odors. This method is a costly procedure that is fraught with problems, such as the variability of different people’s responses, the time required, the subjective response of experts to odors, odor matching, and the impossibility of evaluating hazardous odors using this method [18]. The electronic nose is a new technique for controlling food quality [19,20,21]. Using a sensor array, this system simulates the human sense of smell and attempts to determine the effects of odors on the headspace of samples [22,23]. Gas sensors play an important role in many areas of human life, including the monitoring of production processes, occupational safety, food quality assessment, and air pollution monitoring [24]. Essentially, an electronic nose is a device that includes a multisensor array and multidimensional signal processing through pattern recognition algorithms that can detect the presence of volatile compounds associated with food aromas [25]. In this technique, the focus of the analysis process is not on the identification and quantification of volatile compounds, but on the quantitative description of the complete characteristics of the fragrance, including the relationships between its components [26]. Compared to traditional sensory and physicochemical methods, which are both time-consuming and costly, the electronic nose provides an efficient, fast, nondestructive, and real-time experiment [27]. Monitoring the quality of beverages with this technique is widely recommended. For example, E-noses, with monitoring product fragrance, have been successfully used for food quality [28] and to classify and predict products such as apple juice [29], kiwi juice [30], orange juice [31], tangerine juice [32], tomato juice [33], pineapple juice [34], strawberry juice [35], as well for juice spoilage [36], edible essential oil classification [37], and juice fraud [38].
In the food industry, quality assurance is one of the most important objectives; therefore, a variety of methods and techniques are used to confirm and evaluate food quality. Several techniques include chemical analysis and nondestructive testing. Application of the E-nose can be useful in the beverage and food industry. When we plan to assemble an instrument for odor discrimination and recognition, using the approach of the human nose—what we would call an artificial nose—we are confronted with at least three major types of challenges: complexity of the olfactory code, limited knowledge of the biological system, and the high sensitivity of the human nose [39]. Moreover, the main limitation of the E-nose is that it only assigns volatile compounds to certain categories and cannot identify the specific volatile compounds or obtain quantitative data to clarify differences in compounds among samples. Moreover, the electronic senses still possess some limitations regarding sensitivity and specificity as compared to their biological counterparts [20].
Tests to detect cheaper juices, such as apple and grape blended into more expensive juices, are in place to ensure juice products are labeled properly and sold legally. However, an ongoing problem arises when lime juice is blended with lemon juice. Due to their chemical similarities, this requires new in-depth methods. This study aimed to detect common frauds in lemon juice using an electronic nose. It is worth mentioning that there are expensive and complex techniques used to detect fraud in lemon juice, such as LC, GC, and IMS, which are expensive (solvent consumption) and time-consuming. To date, there has not been a comprehensive review of gas-sensor-based electronic nose technologies for lemon juice fraud applications.

2. Materials and Methods

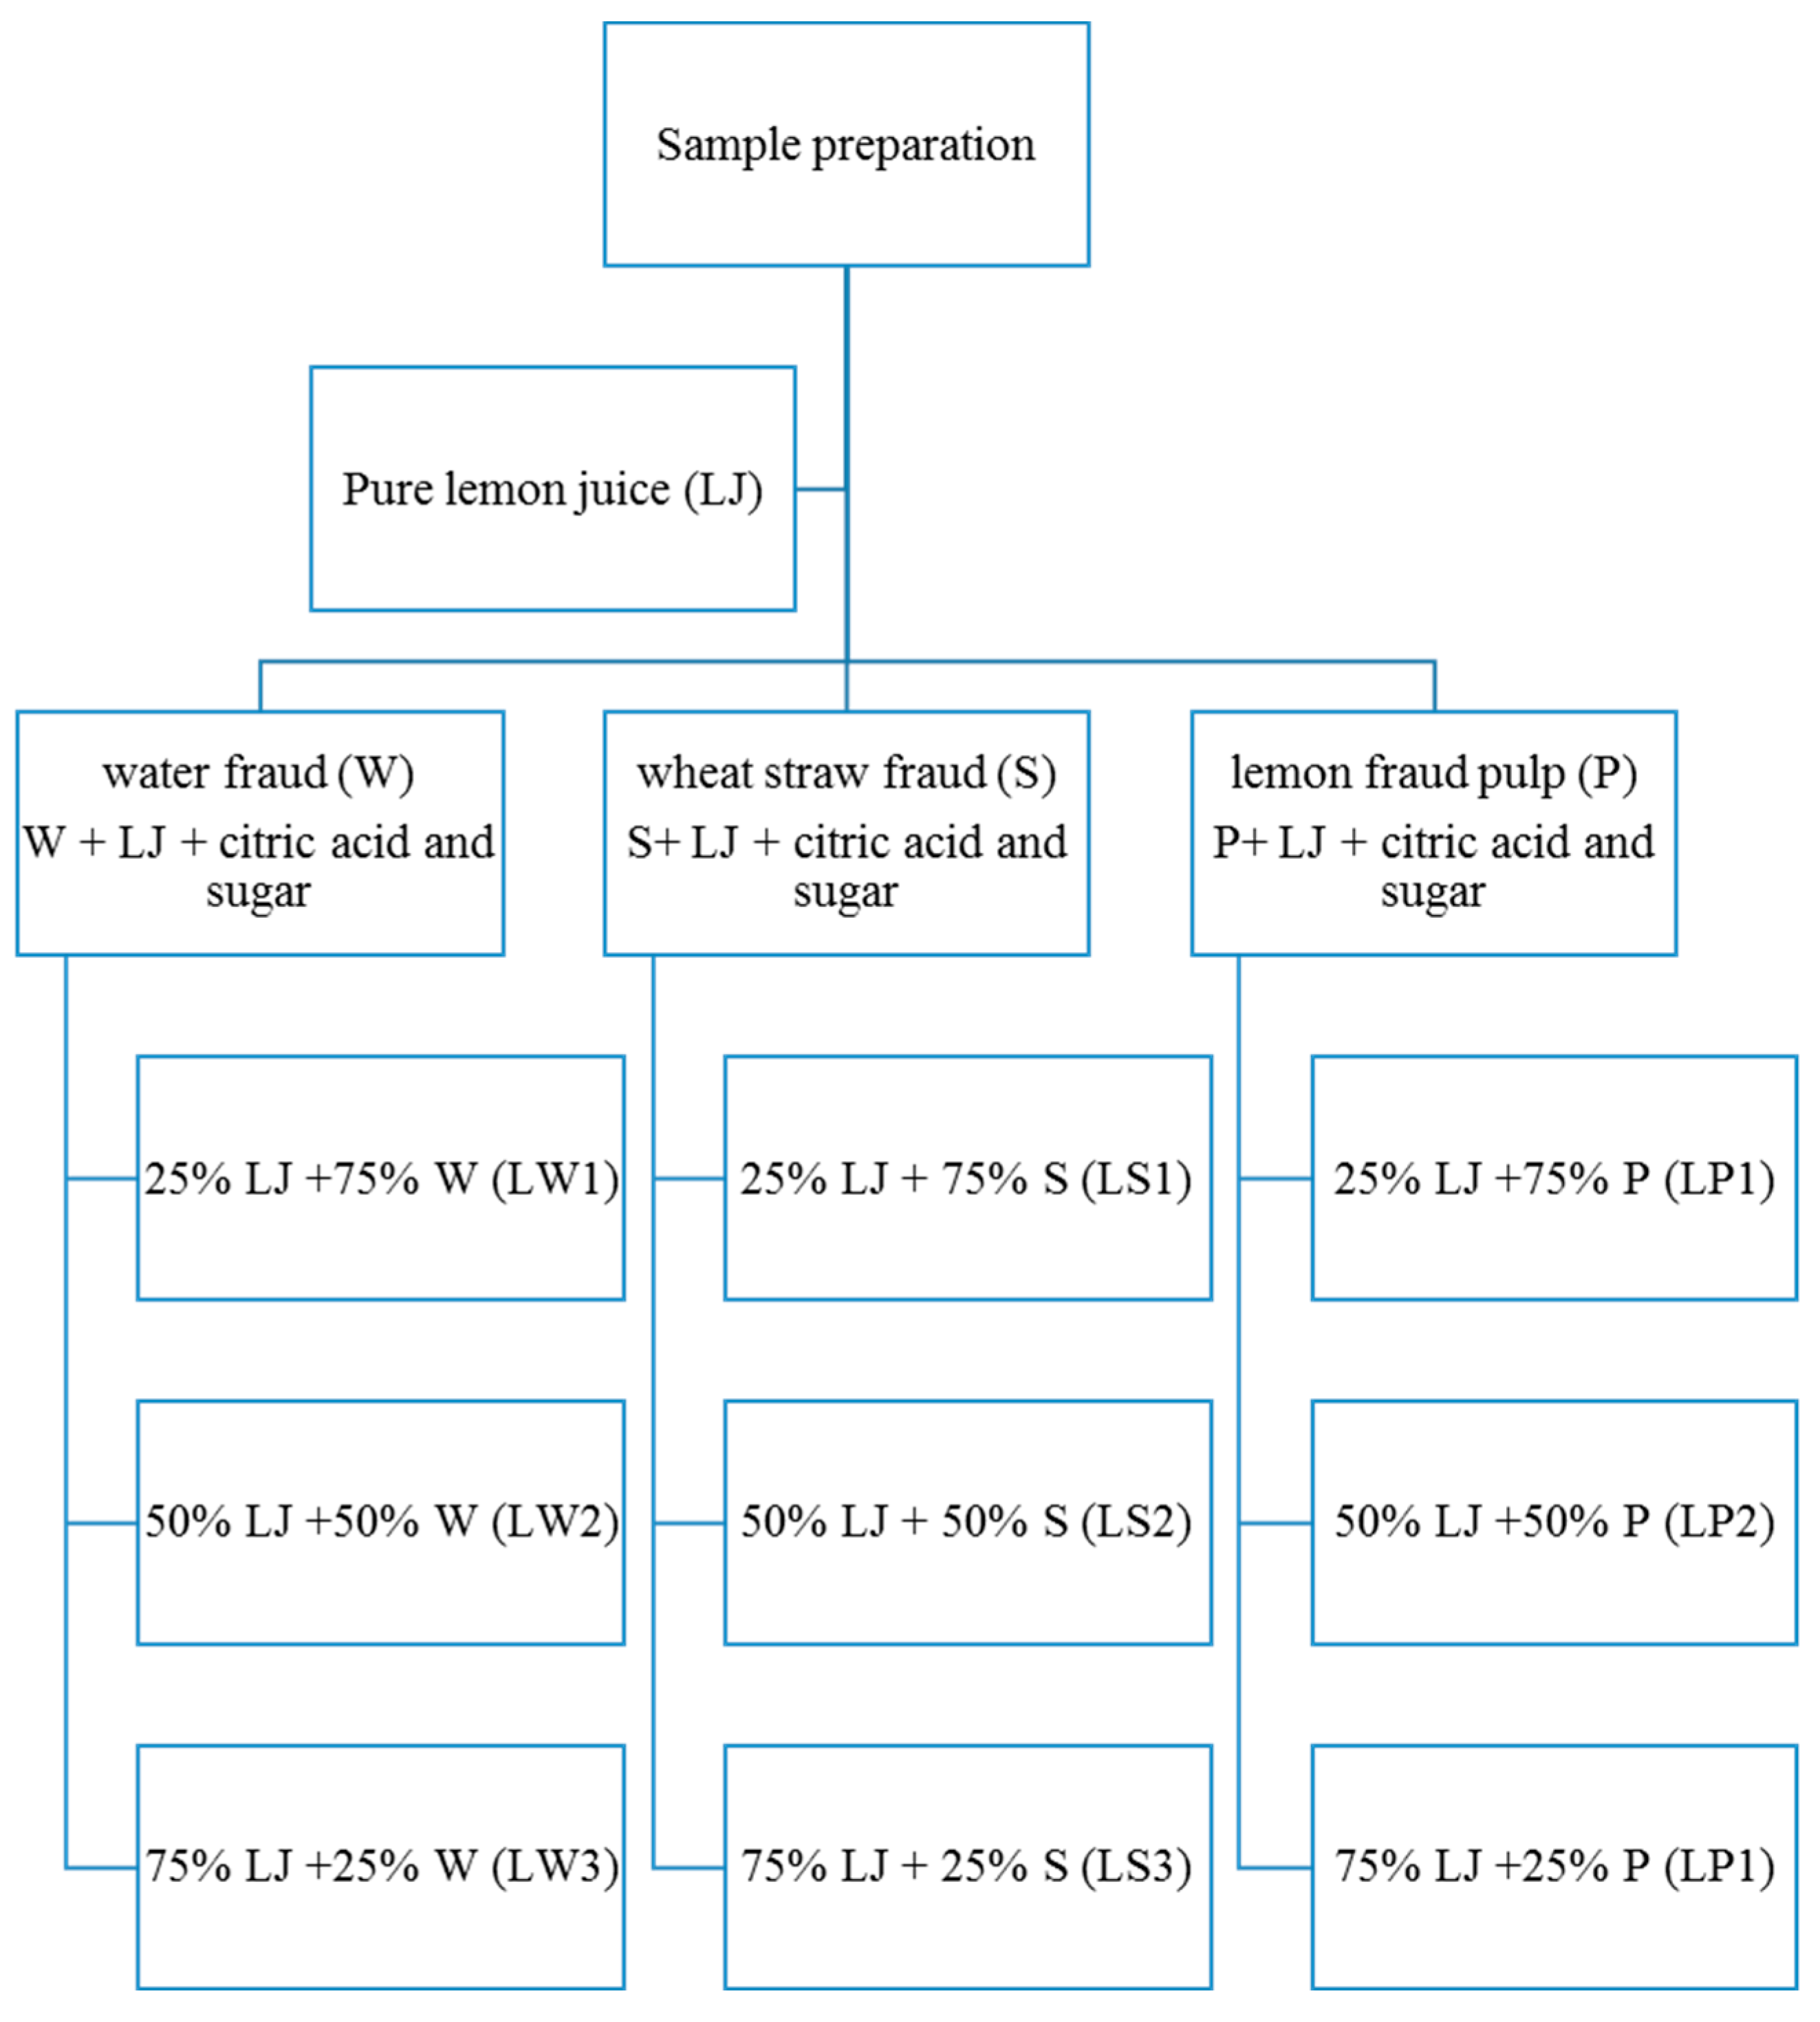
2.1. Sample Preparation

First, fresh lemons were bought in the fruit and vegetable market of Kermanshah, Iran. The fruits were washed; then, their pure lemon juice (LJ) was extracted with a juicer. After passing through the filter, the pulp was separated and the pure lemon juice was transferred to the laboratory for testing. At this stage, 3 conventional levels of lemon juice fraud were considered for the experiments (Figure 1). The first treatment was the water fraud (W), including water + citric acid and sugar to the lemon juice at 25% lemon and 75% water (LW1), 50% lemon and 50% water (LW2), and 75% lemon and 25% water (LW3), respectively. The second treatment was wheat straw fraud (S), in which wheat straw was soaked in lukewarm water for 24 h until the water added to the straw turned yellow. Then, lemon juice, citric acid, and sugar were added in three different amounts of 25% lemon and 75% straw (LS1), 50% lemon and 50% straw (LS2), and 75% lemon and 25% straw (LS3). The last treatment was performed with lemon pulp (P) obtained after the preparation of lemon juice. In this method, different amounts of 25% lemon and 75% pulp (LP1), 50% lemon and 50% pulp (LP2), and 75% lemon and 25% pulp (LP3) were prepared by adding lemon juice, citric acid, and sugar. Notably, the pure sample of lemon juice had a Brix and an acidity of 8 and 2.53, respectively, while other samples’ acidity was prepared between 2.67 and 3.2. In addition, their Brix degree was prepared in the range of 7 ± 1. To minimize any physical or chemical reactions, samples were kept in a dry and dark place at room temperature. Each sample was then placed in a 50 mL glass bottle containing 25 mL of lemon juice. Therefore, a total of 180 lemon juice samples were prepared for fraud testing, where 15 lemon juice samples were prepared in a 25 mL container per each class.

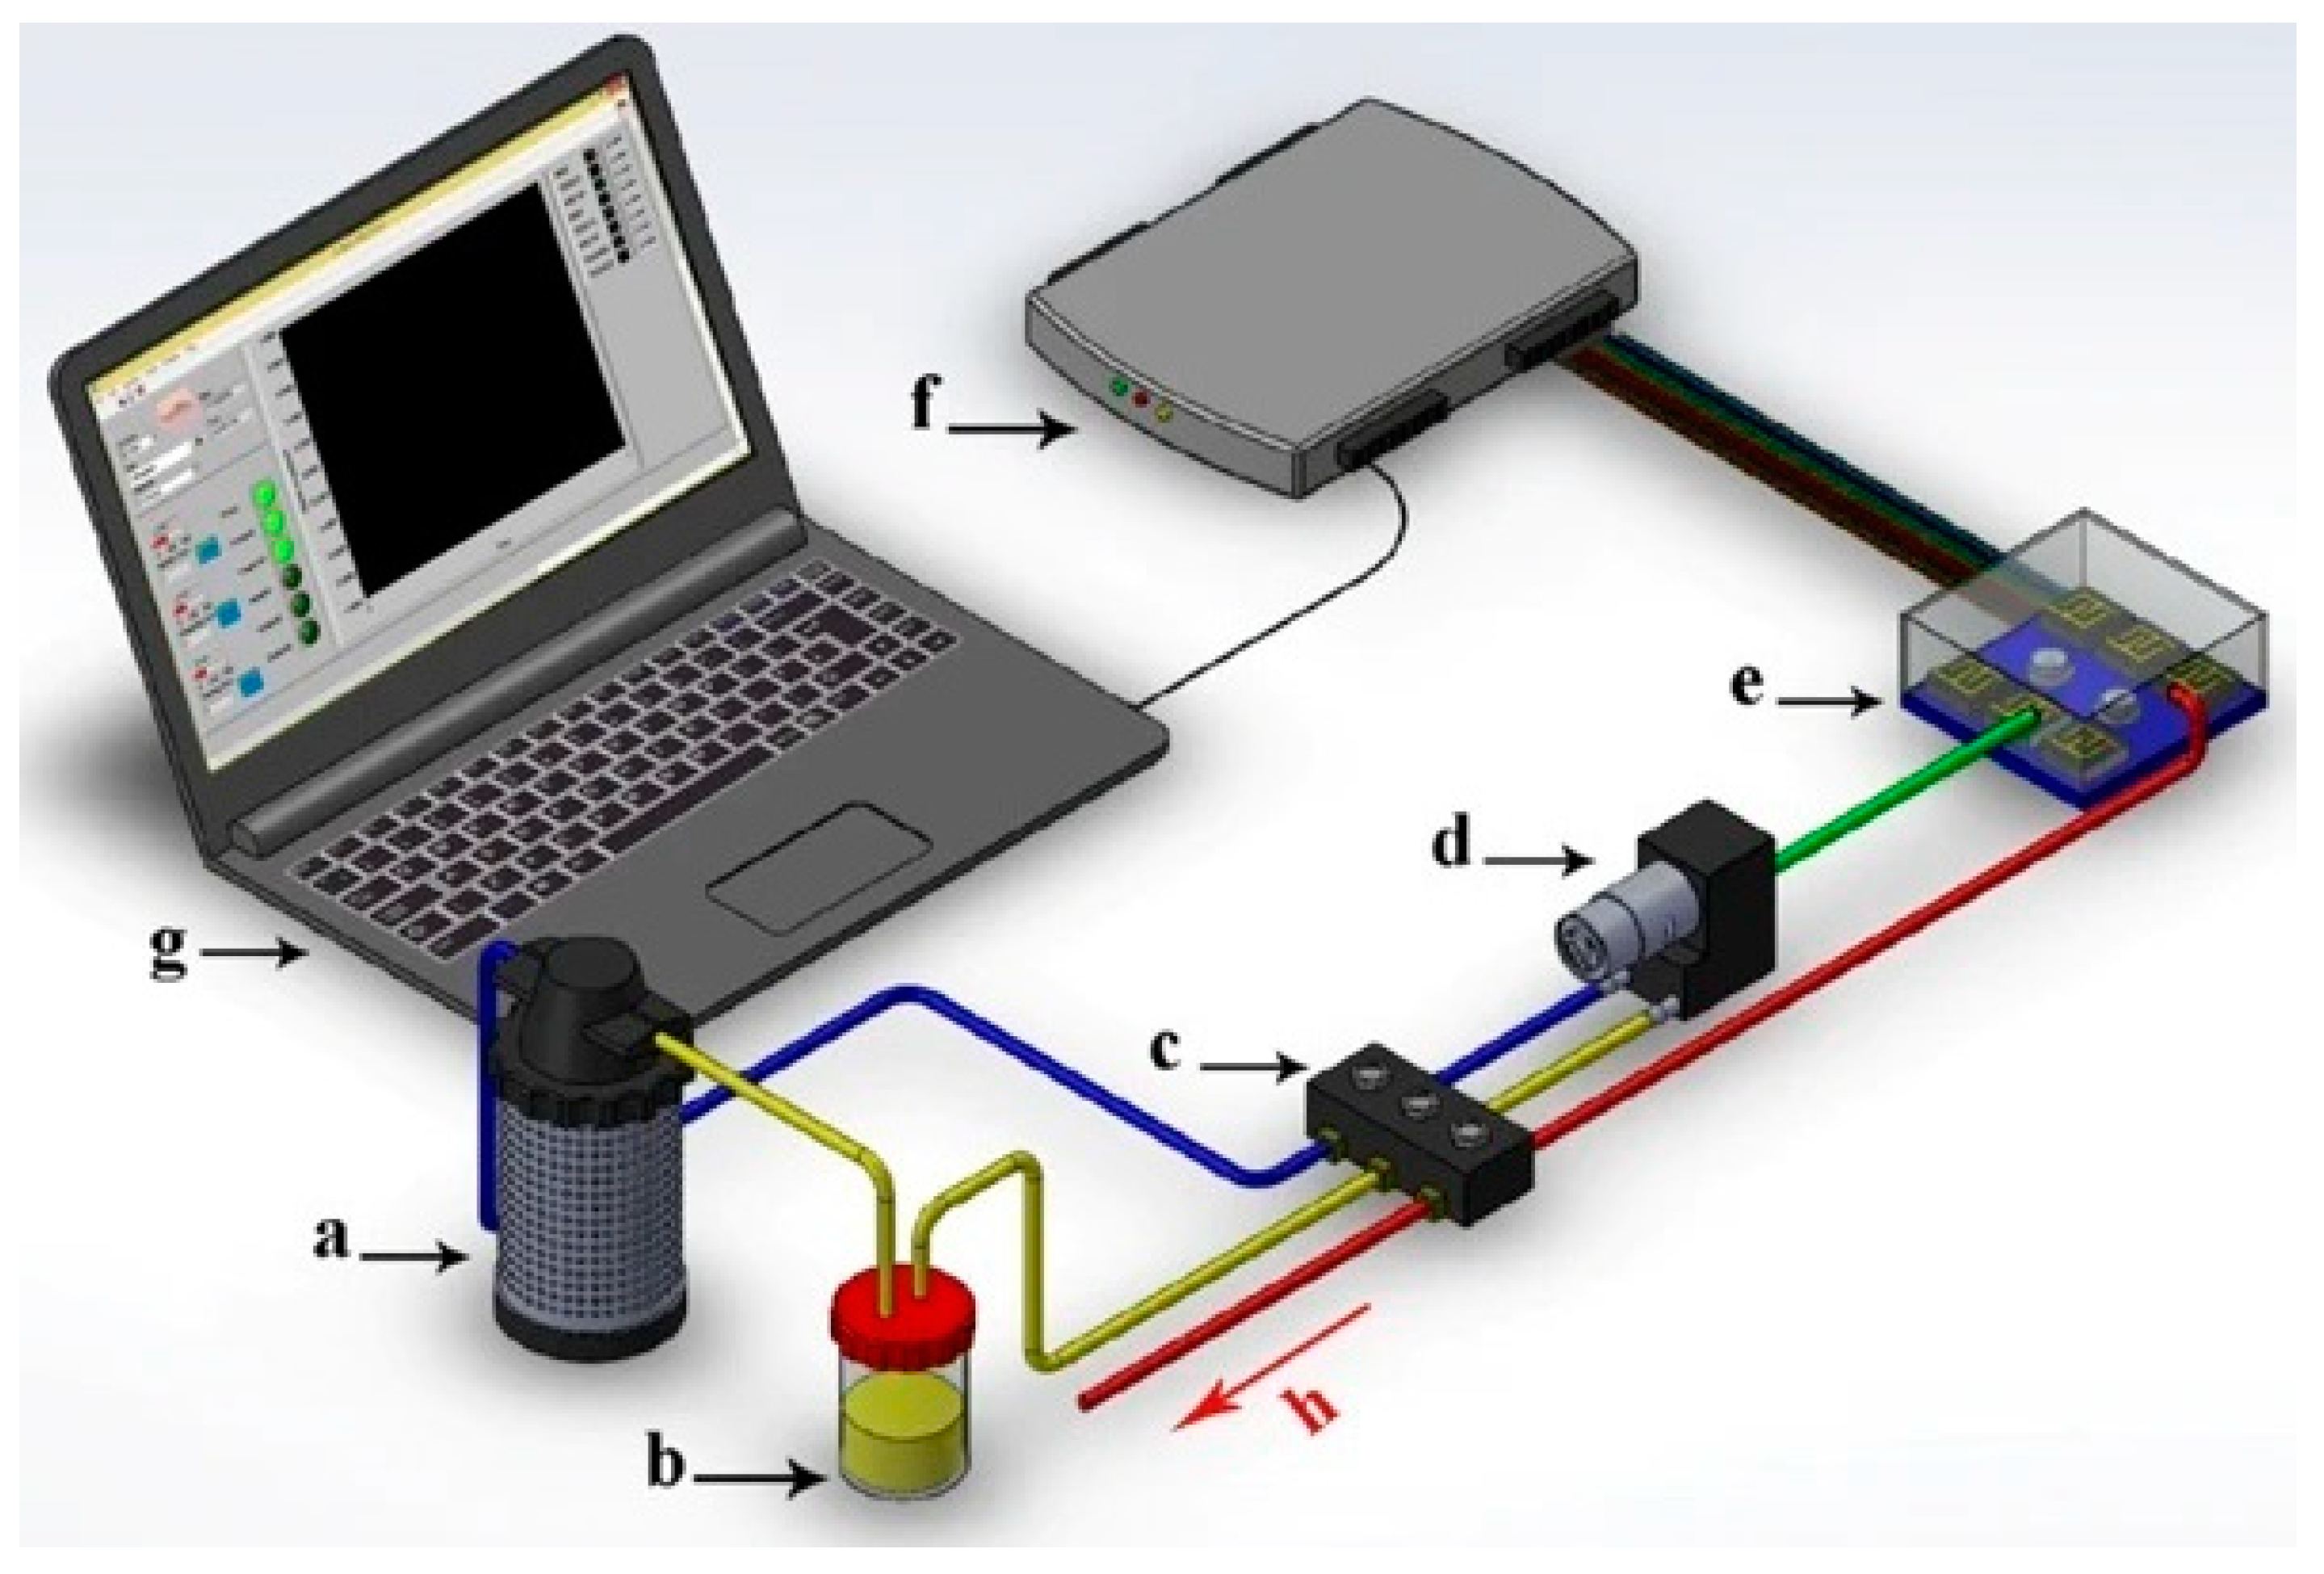
2.2. The Electronic Nose System

The device was fabricated at the Department of Mechanical Engineering of Biosystems, Razi University, Kermanshah, Iran [40]. There are 8 metal oxide sensors (FIGARO, Osaka, Japan) throughout the device, and each sensor has cross-sensitivity to certain volatile chemicals or aromatic compounds (Table 1). The sensors are exposed to the sensor array via a diaphragm pump with a flow rate of 1.5 L/m (Model R385) (Gikfun Inc., Dongguan, China). Therefore, the inlet flow into the sensor chamber was 1.5 L per min. These arrays are exposed to aromatic compounds, where a chemical interaction between the sensor element and the volatiles results in a change in electrical voltage. This voltage change is proportional to the amount of chemical substance absorbed by a conductive polymer on the sensor surface. The signal is caused by a change in the resistance of the sensing element during the period it was exposed to chemical vapors. The voltage changes in each sensing element create a distribution pattern or odor print that can be used to identify VOC mixtures through pattern recognition techniques. The E-nose system was cleaned with fresh air for 100 s before testing to establish a stable baseline. The sample chamber was manually connected to the device and then analyzed for 120 s for the E-nose analysis. Finally, the sensor housing was cleaned with fresh air for 100 s (Figure 2). The output voltage of the sensors was acquired with data acquisition cards (ATmega2560 R3, Italy), and the sensor signals were recorded at 1-s intervals and stored in the computer by connecting the USB port to the computer. The baseline was corrected using a fractional method in which possible noise or deviations were eliminated. Moreover, the sensor responses were normalized and made dimensionless using the following equation [22]:
Y s ( t ) = X s ( t ) X s ( 0 ) X s ( 0 )
where YS(t) is the normalized response, XS(0) is the baseline, and XS(t) is the sensor response.

2.3. Chemometrics Methods

Based on the results of the experiments performed with the electronic nose, principal component analysis (PCA), linear and quadratic analysis (LDA), support vector machine (SVM), and artificial neural network (ANN) methods were used to analyze the initial reaction.
In addition to reducing the size of large datasets by creating uncorrelated variables, PCA can help reduce dimensionality in large datasets. Here, each principal component is a linear combination of all primary variables. This method also helps to understand how a sample differs from other samples (score plot) and which variables contribute most to this distinction [41]. For data analysis, after normalization, it was entered into the Unscrambler software. PCA was used as a method capable of showing the initial relative position of samples in a two-dimensional space to observe the escape changes between different lemon juice samples.
Fisher’s linear discriminant generalization is a method used in statistics, pattern recognition, and machine learning to find a linear combination of features that distinguish or differentiate two or more classes of objects or events. LDA is closely related to PCA in that both look for linear combinations of variables that best describe the data, although LDA usually has a better classification effect than PCA and CA. LDA has been used to detect different levels (12 levels) of lemon juice fraud in practice, whether it can be detected by the electronic nose or not [42]. In this method, normalized data and their labels (targets) were used for analysis.
Vapnik introduced the SVM method, which has been further developed in recent years. Studies have shown that SVMs have a higher classification rate than other classification algorithms. The use of the SVM as a learning technique has become increasingly popular in various fields over the last decade [43]. The support vector machine (SVM) is a classification algorithm described by a separate hyperplane. In SVMs, hyperplanes are found in dimension N that allow the unique classification of data points. Support vectors are data points closer to the hyperplane that affect the orientation and position of the hyperplane and help increase the classifier’s margin. Data points on either side of the hyperplane can be assigned to different classes, where their dimensions depend on the number of attributes. For example, if the number of input properties is two, the hyperplane will be a line, while if there are three input properties, the hyperplane will be a two-dimensional plane [44]. In this research, 4 kernel functions, including linear, polynomial, sigmoid, and radial functions, were used. The data intended for test learning were considered 60% and 40%, respectively. To analyze the dataset, each learning set was repeated ten times and the average value was calculated.
An ANN is also a machine learning algorithm that mimics human neural networks and can be used to predict, cluster, and recognize patterns based on past and present educational data [45]. It is known that the human brain has billions of neurons that send and receive electrical signals for proper function and control [46]. With an ANN, a large number of variables can be included, and each variable can be weighted differently to produce an output that is very similar to the predicted one [47]. In a classification network, there are three layers: an input layer, a hidden layer, and an output layer. Furthermore, the data are usually divided into training, validation, and test sets. Since the lemon juice dataset was processed at 12 different layers, 12 output layers and the input layers based on the signals from 8 sensors were considered as 8 layers in this study. The hidden layer was also determined by trial and error. About 60% of the data were used for learning, 20% for testing, and 20% for validation. The log-sigmoid transfer function and Levenberg–Marquardt learning method were used in network training. The calculations and methods were performed using Unscrambler X 10.4 (for the PCA, SVM, and LDA) and MATLAB R2016a (for the ANN).

2.4. Criteria for Model Evaluation

The confusion matrix is a very popular measure used while solving classification problems. It can be applied to binary classification as well as for multiclass classification problems [48]. This method shows how well a classification model performs on a set of experimental data whose actual values are known. This confusion table or matrix shows the results of classification based on the actual information available. It is a two-dimensional matrix, indexed in one dimension by the true class of an object and in the other by the class that the classifier assigns [49]. Based on these values, various criteria for classification evaluation and accuracy measurement can be defined:
Accuracy is the most important and simplest criterion for evaluating the quality of a category. It is defined as the degree of correct diagnosis of the category in a total of two categories. This parameter indicates the number of correctly identified patterns and is formulated and defined as follows [50]:
A c c u r a c y = T P + T N T P + T N + F N + F P
The accuracy parameter is usually expressed as a percentage. However, in addition to the accuracy criterion, other parameters can be easily extracted from this matrix. One common criterion is the sensitivity criterion, also called “true positive rate” or recall. Sensitivity refers to the proportion of positive cases that the test correctly identified as positive. It can be calculated as follows [51]:
Re   c a l l = T P T P + F N
Alternatively, the accuracy of detecting negative classes may sometimes be more important than this parameter. The specificity parameter, also referred to as the true negative rate, is usually considered along with sensitivity. This factor indicates the ratio of negative samples that the experimenter correctly identified as negative, which is calculated as follows [52]:
S p e c i f i c i t y = T N T N + F P
The criteria of sensitivity and specificity are similar to the criterion of accuracy, which is usually expressed as a percentage. Clearly, an excellent prediction determines the sensitivity and specificity values as a percentage. In reality, however, this is very unlikely, and there is always a small margin of error. By their very nature, the mentioned parameters are always in competition with each other. As one increases, the other decreases, and vice versa. Therefore, another tool was developed to assess the quality of categories.
The area under a receiver operating characteristic (ROC) curve, abbreviated as AUC, is a single scalar value that measures the overall performance of a binary classifier. The AUC value is within the range (0.5–1.0), where the minimum value represents the performance of a random classifier and the maximum value would correspond to a perfect classifier [53]. The Receiver–Operating–Characteristic curve (ROC) expresses the relationship between the two parameters’ sensitivity and characteristics [54].
A U C = S e n s i t i v i t y + Pr e c i s i o n 2
There is another important parameter, the F-measure, which is often used to evaluate the performance of categories, and a combination of the two parameters of sensitivity and positive predictive value. Explaining that the parameter of positive predictive value is called precision and sensitivity is called recall, the “criterion F” is defined as follows [55]:
F = 2 × P R P + R
P r e c i s i o n = T P T P + F P

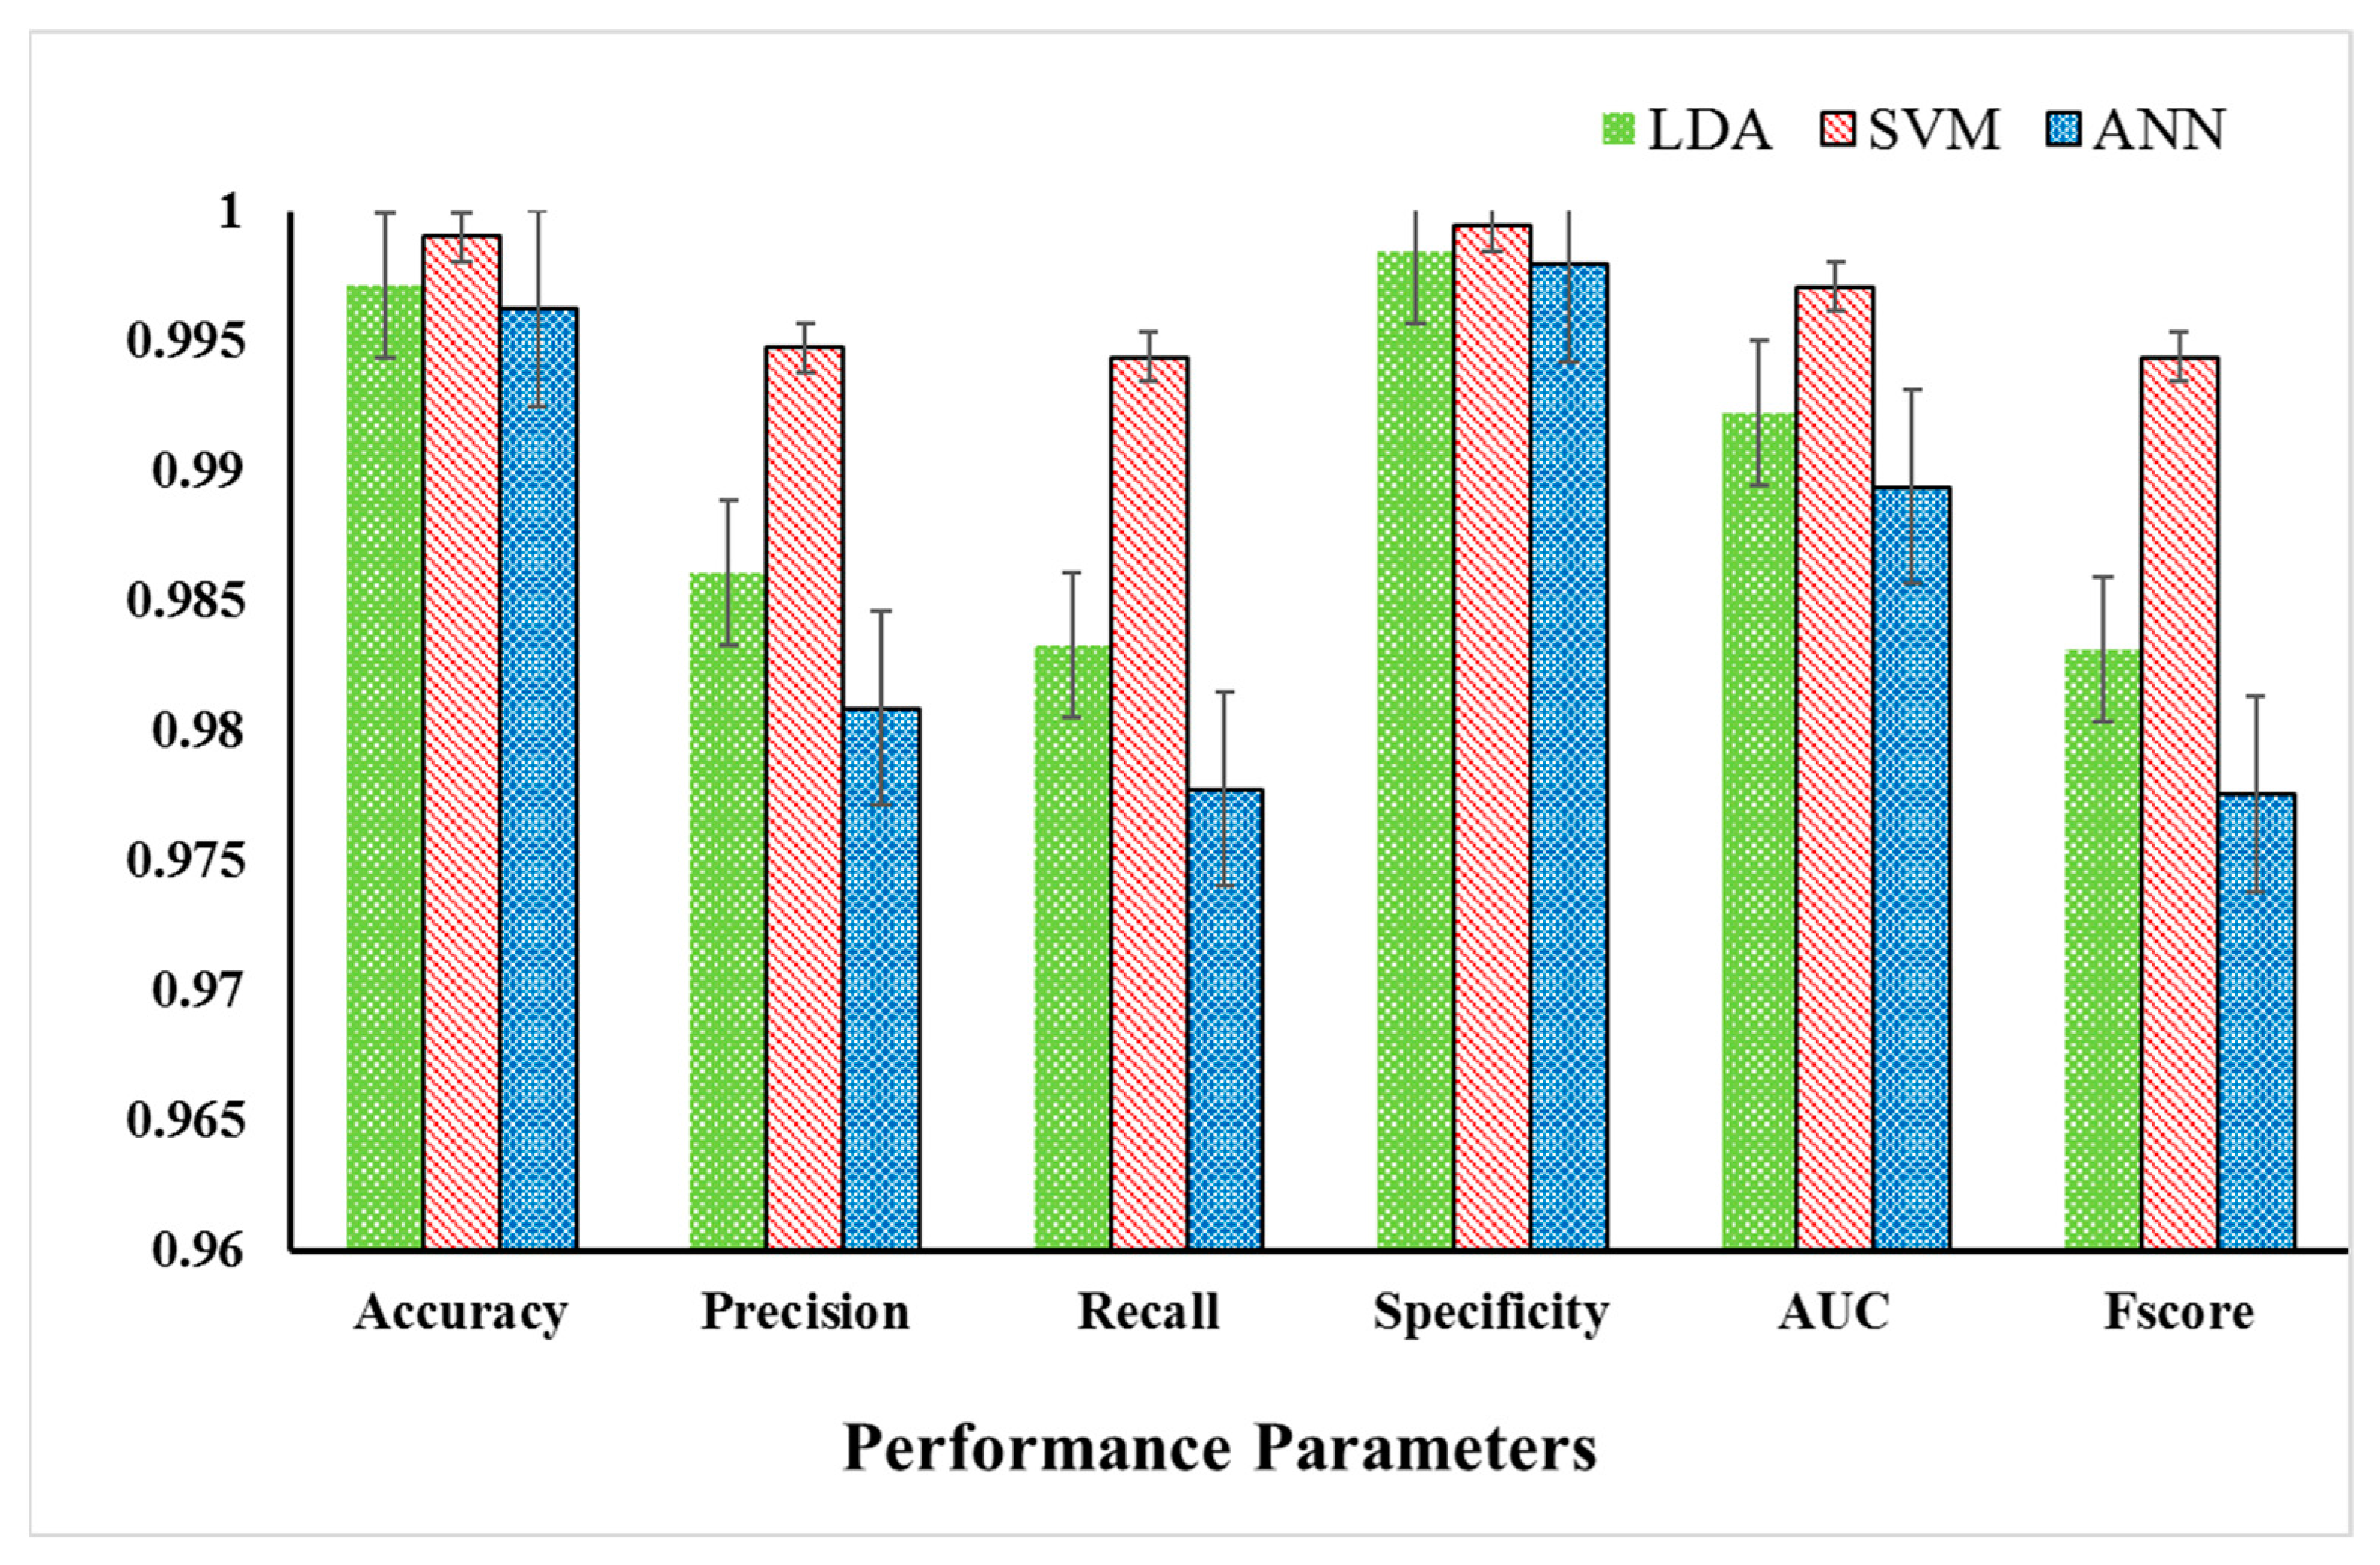
3. Results and Discussion

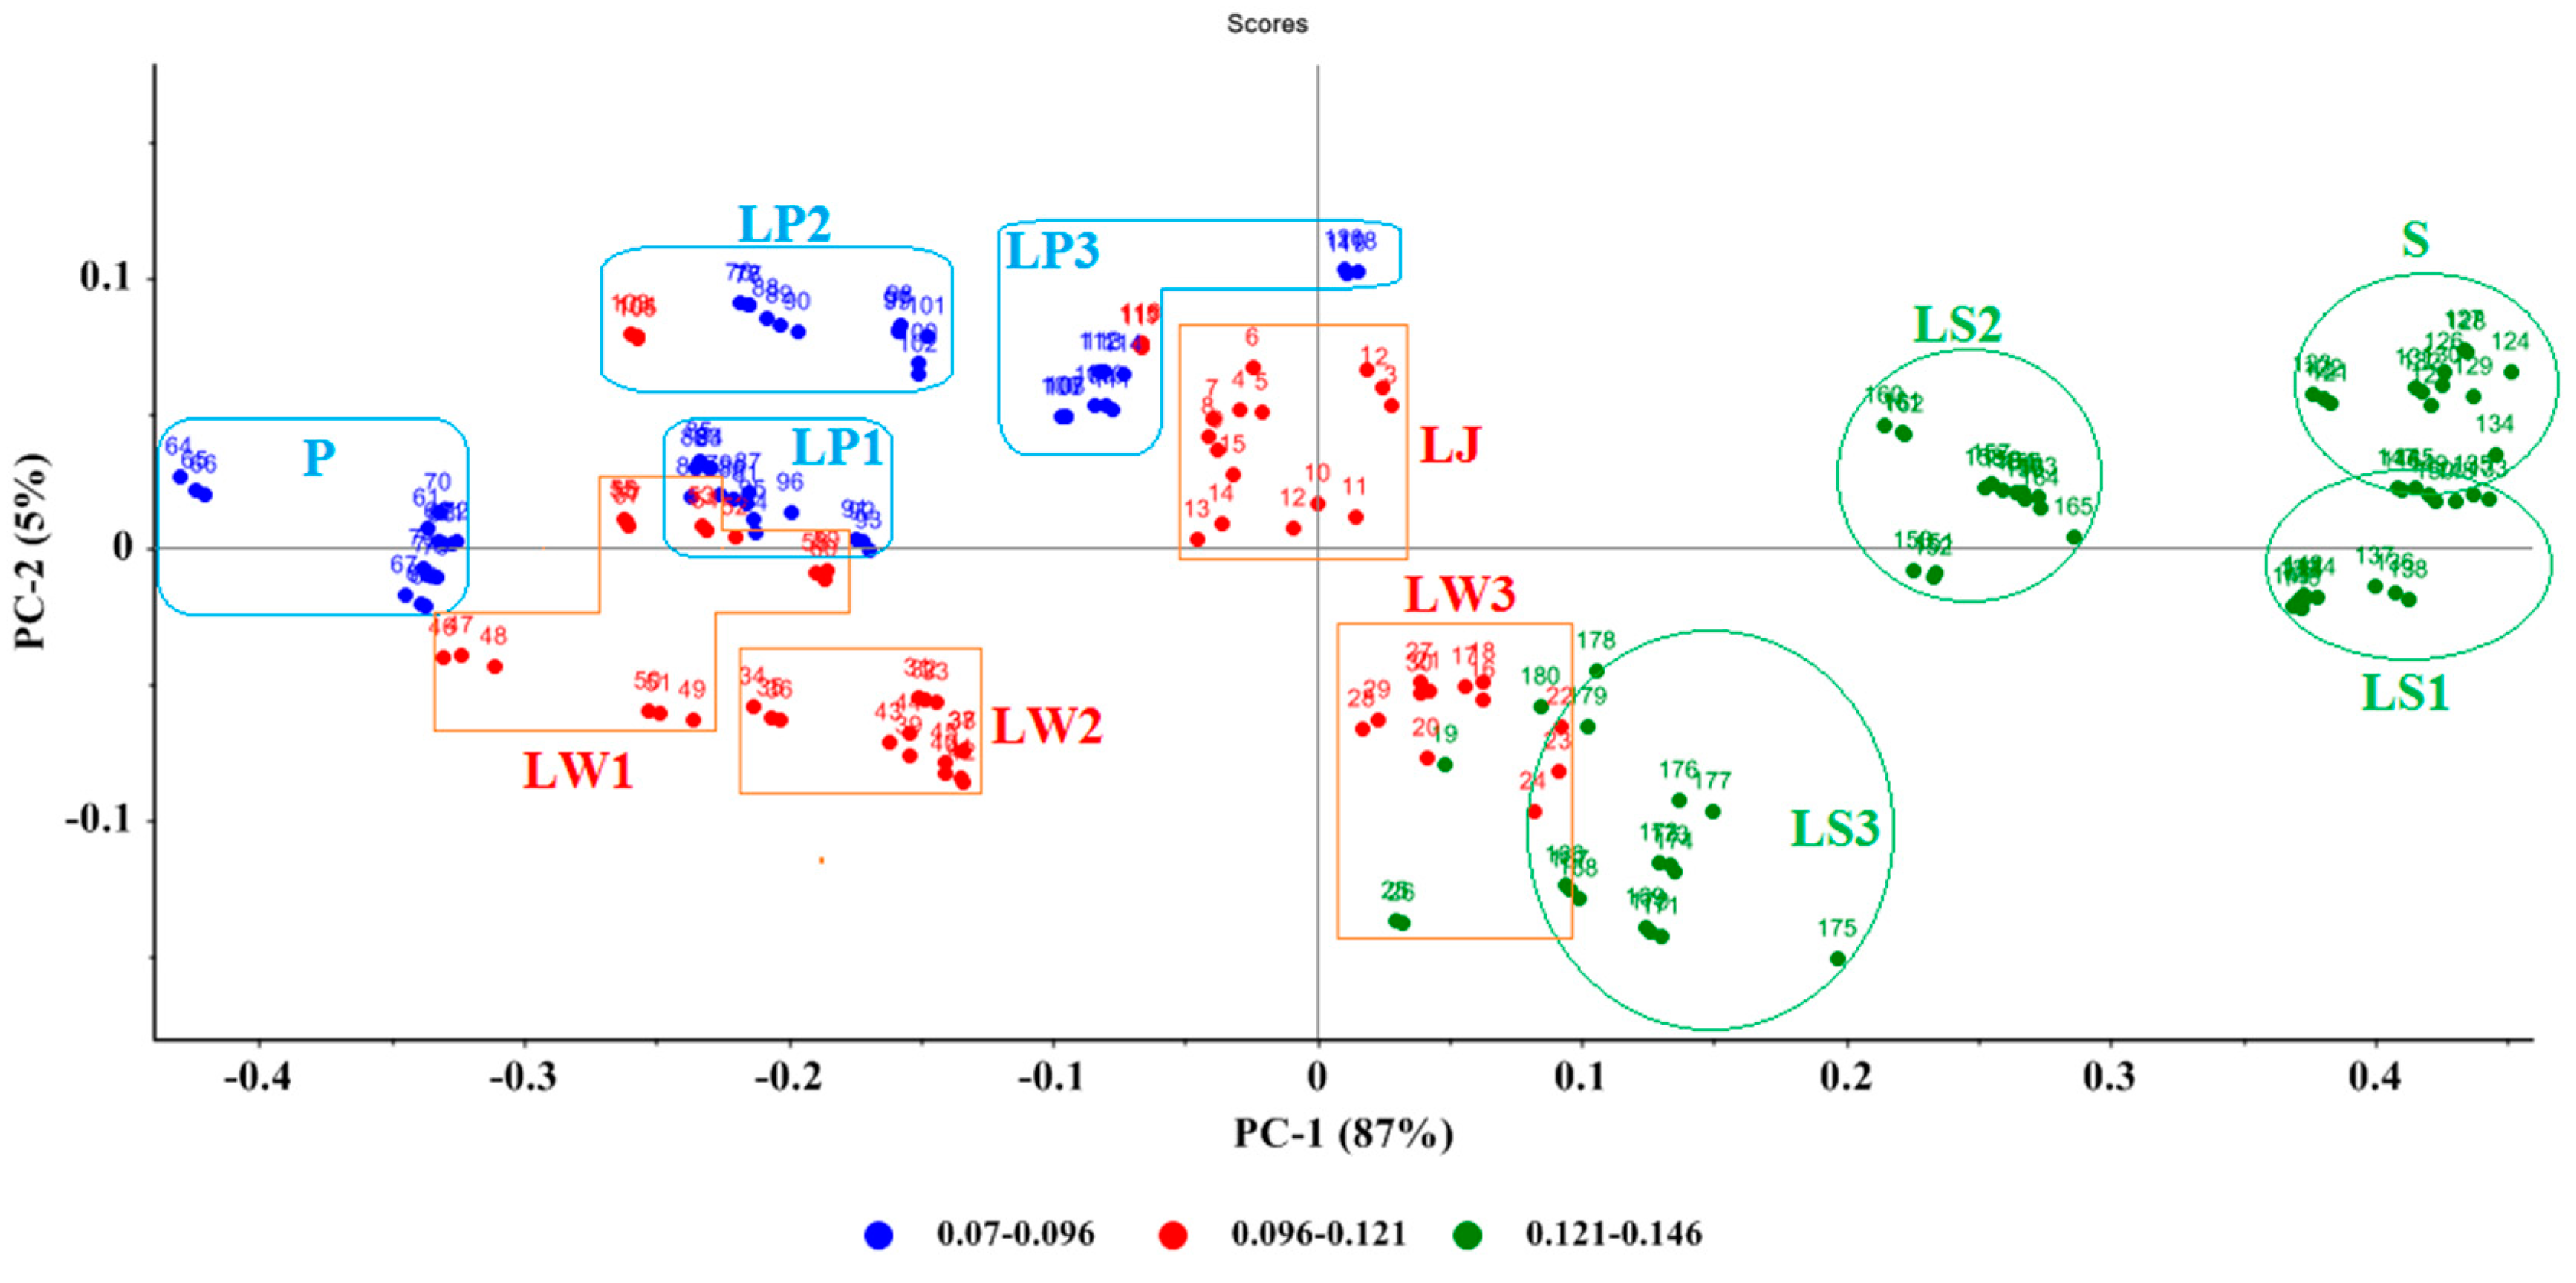
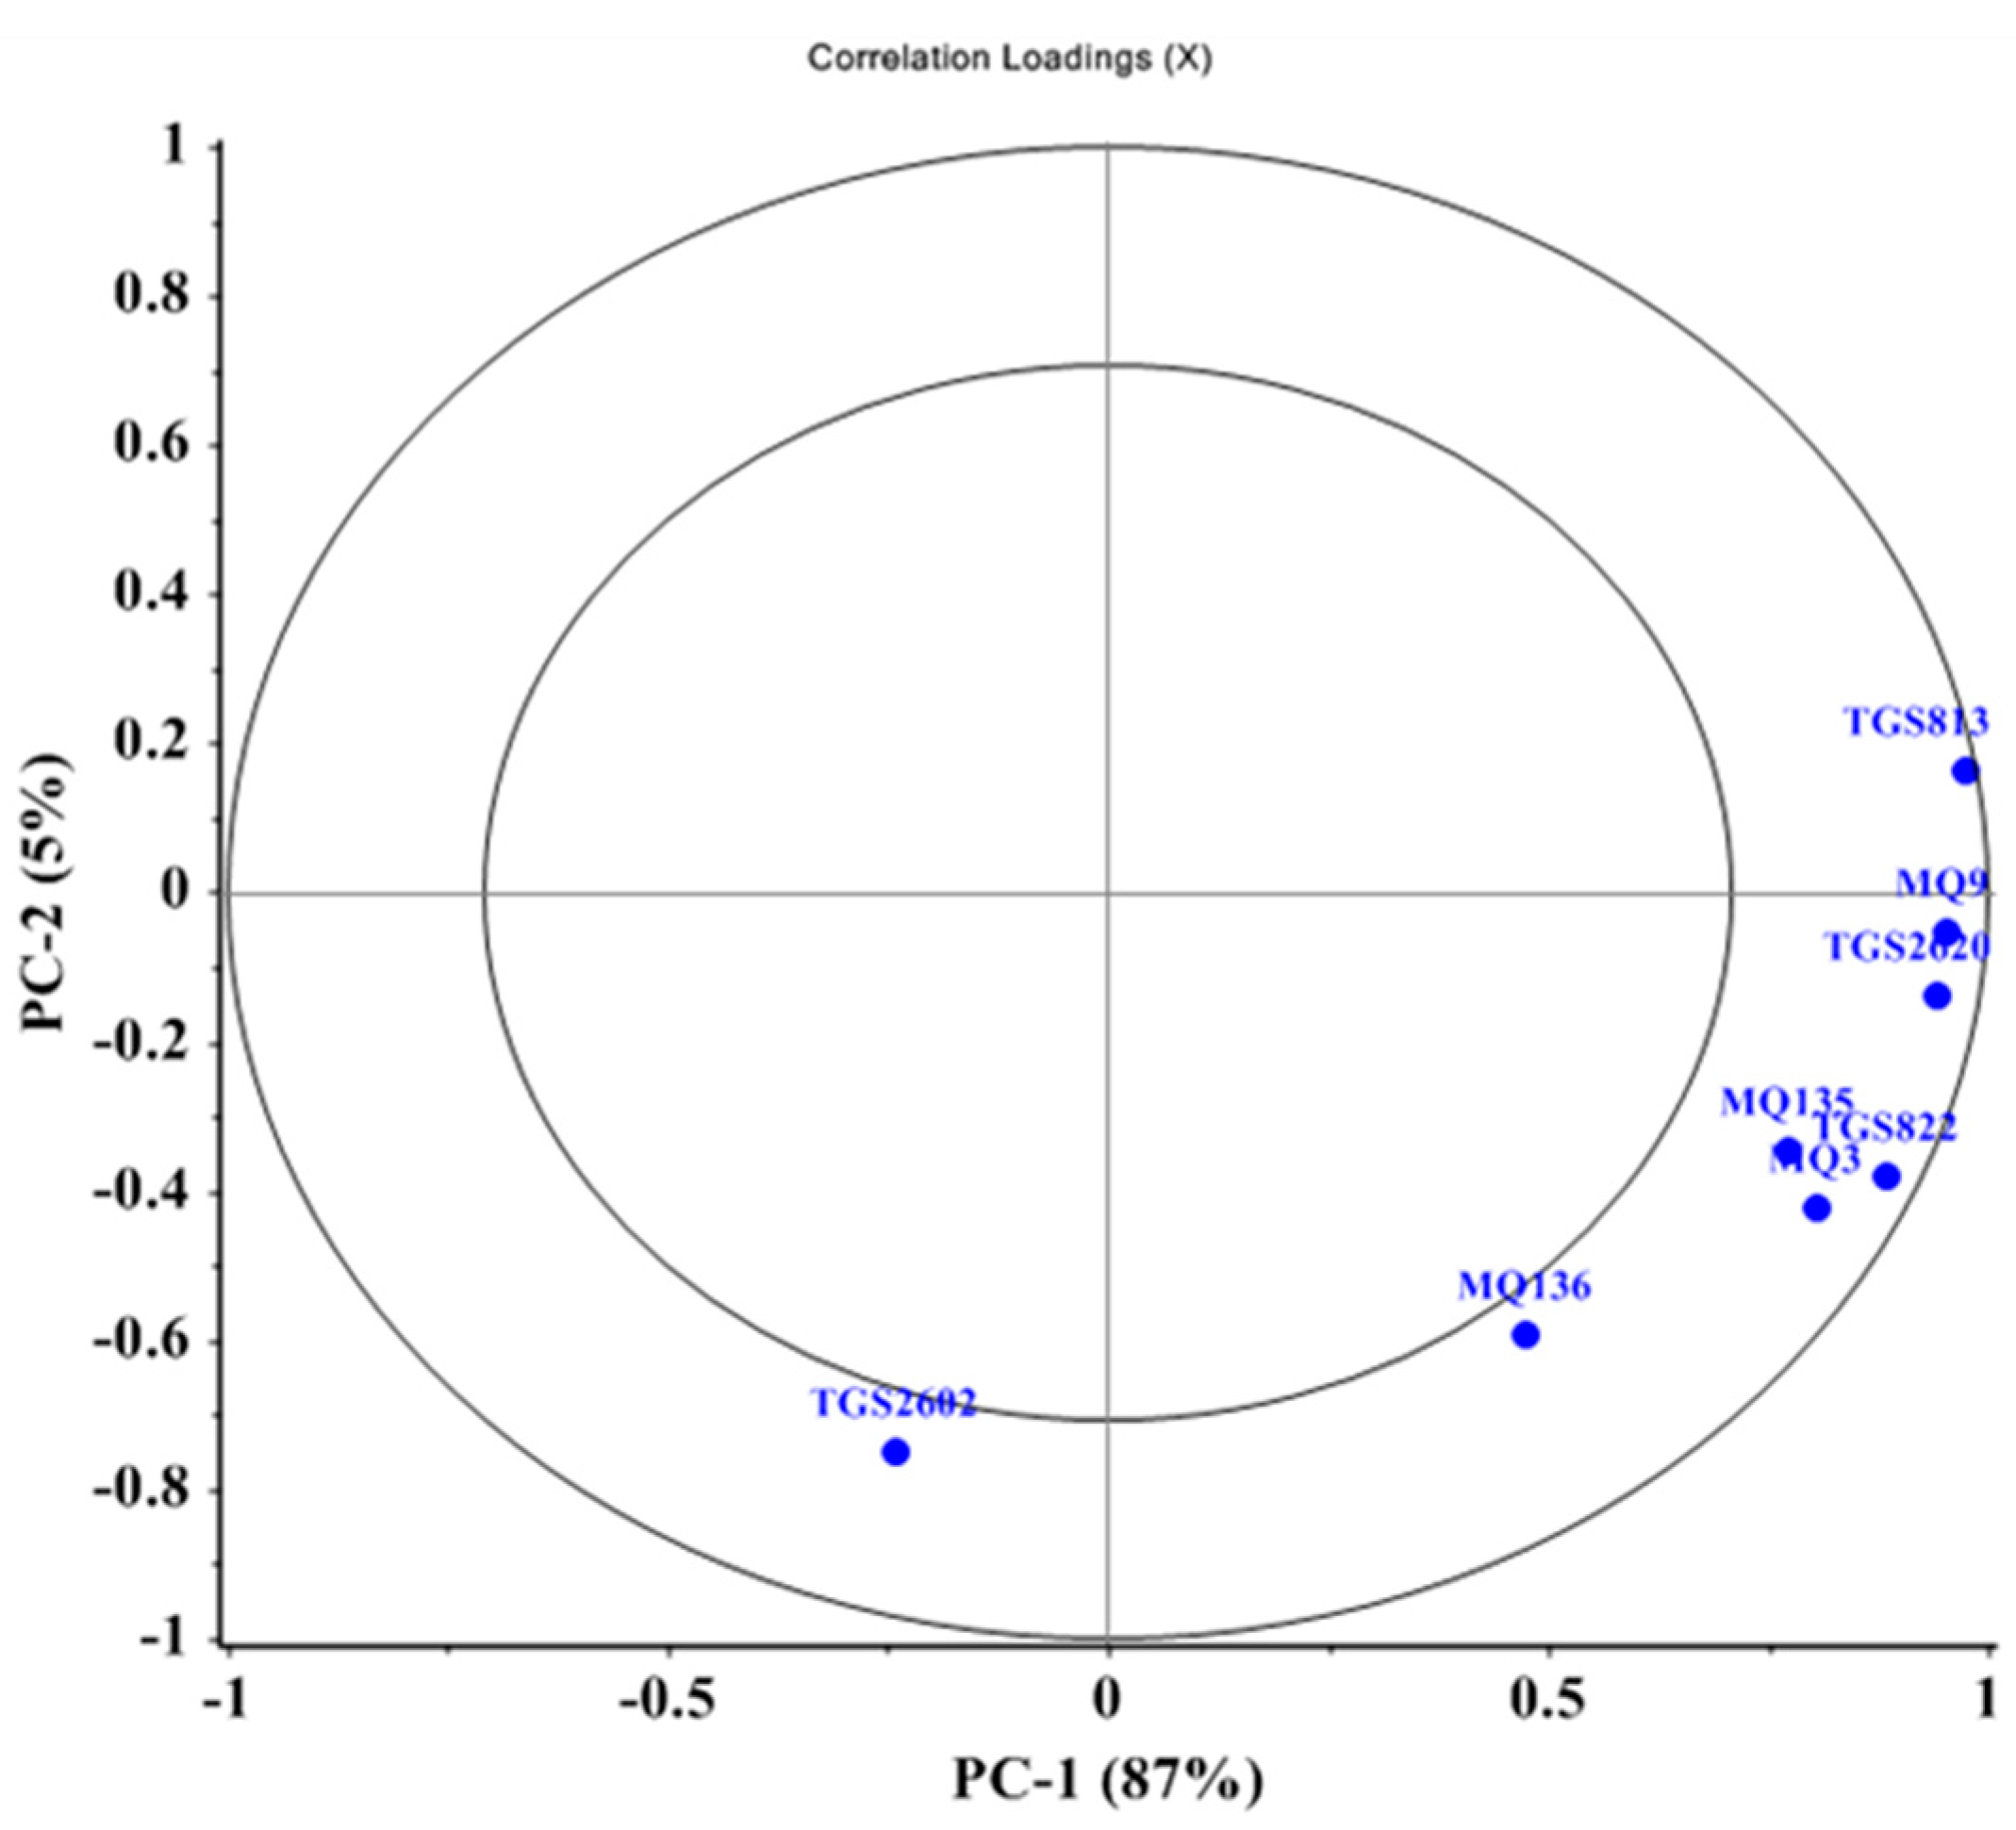
3.1. Principal Component Analysis (PCA)

The maximum value of the response curve of the electronic nose is a stable value throughout the response process, reflecting the stable response of the sensor to the sample gas and the maximum change in the electrical signal. We selected the maximum response values for the PCA analysis of the nasal output data. Figure 3 shows the PCA score chart based on the maximum values of the samples obtained from the electronic nose. In Figure 2, the samples can be generally divided into three groups (lemon juice with water with red, lemon juice pulp with blue, and wheat straw with green). The two principal components explained 87% and 5% of the changes in the dataset, respectively. The cumulative variance contribution for the first two principal components was 92%. On the PCA plot, although the straw fraud samples are more distinguishable from the other treatments, there is some overlap between the lemon juice and water samples and the lemon fruit pulp samples. This is due to the similar odor of lemon juice and lemon pulp, varying only in intensity.
The LS3 sample overlaps with the LW1 sample, making it clear that this level of fraud is very similar to straw and water, allowing profiteers to extract the maximum profit from this level of fraud (Figure 2). It can also be seen, on the left side of the diagram, that the LP3 sample is very similar to the LJ sample, and this level of fraud is also widespread. From the PCA diagram, it can be concluded that the 25% fraud levels (water, lemon pulp, and straw) are very similar to the 75% lemon juice and are difficult to detect.
Celdrán, et al. [56] used an inexpensive electronic nose to identify different types of wine. According to their results, the PCA method had 100% accuracy. They stated that the electronic nose can be used as a reliable tool to detect counterfeit wine labels in the wine industry. Moreover, an electronic nose with 12-MOS-based gas sensors has been used to classify the quality of three Indonesia black teas. The experimental results showed that all three samples almost have the same aroma when observed from the sensor response. The results of the PC-1 and PC-2 components accounted for 80.3% and 15.3% of the variance, respectively [57].
From Figure 4, it can be seen that, except for the sensors TGS2602 and MQ136, which are located near the middle circle, the other sensors are located around the outer circle. This classification describes 100% of the data variance, while the middle circle explains only 50% of the data variance. As is clear from Figure 3, the highest loading coefficient is related to the TGS813 sensor. A positive correlation was found between MQ9 and TGS2620. In turn, MQ3, MQ135, and TGS822 exhibited a strong positive correlation. A correlation with a specific compound may be detected because the E-nose sensors are cross-sensitive to all materials in the headspace gas.

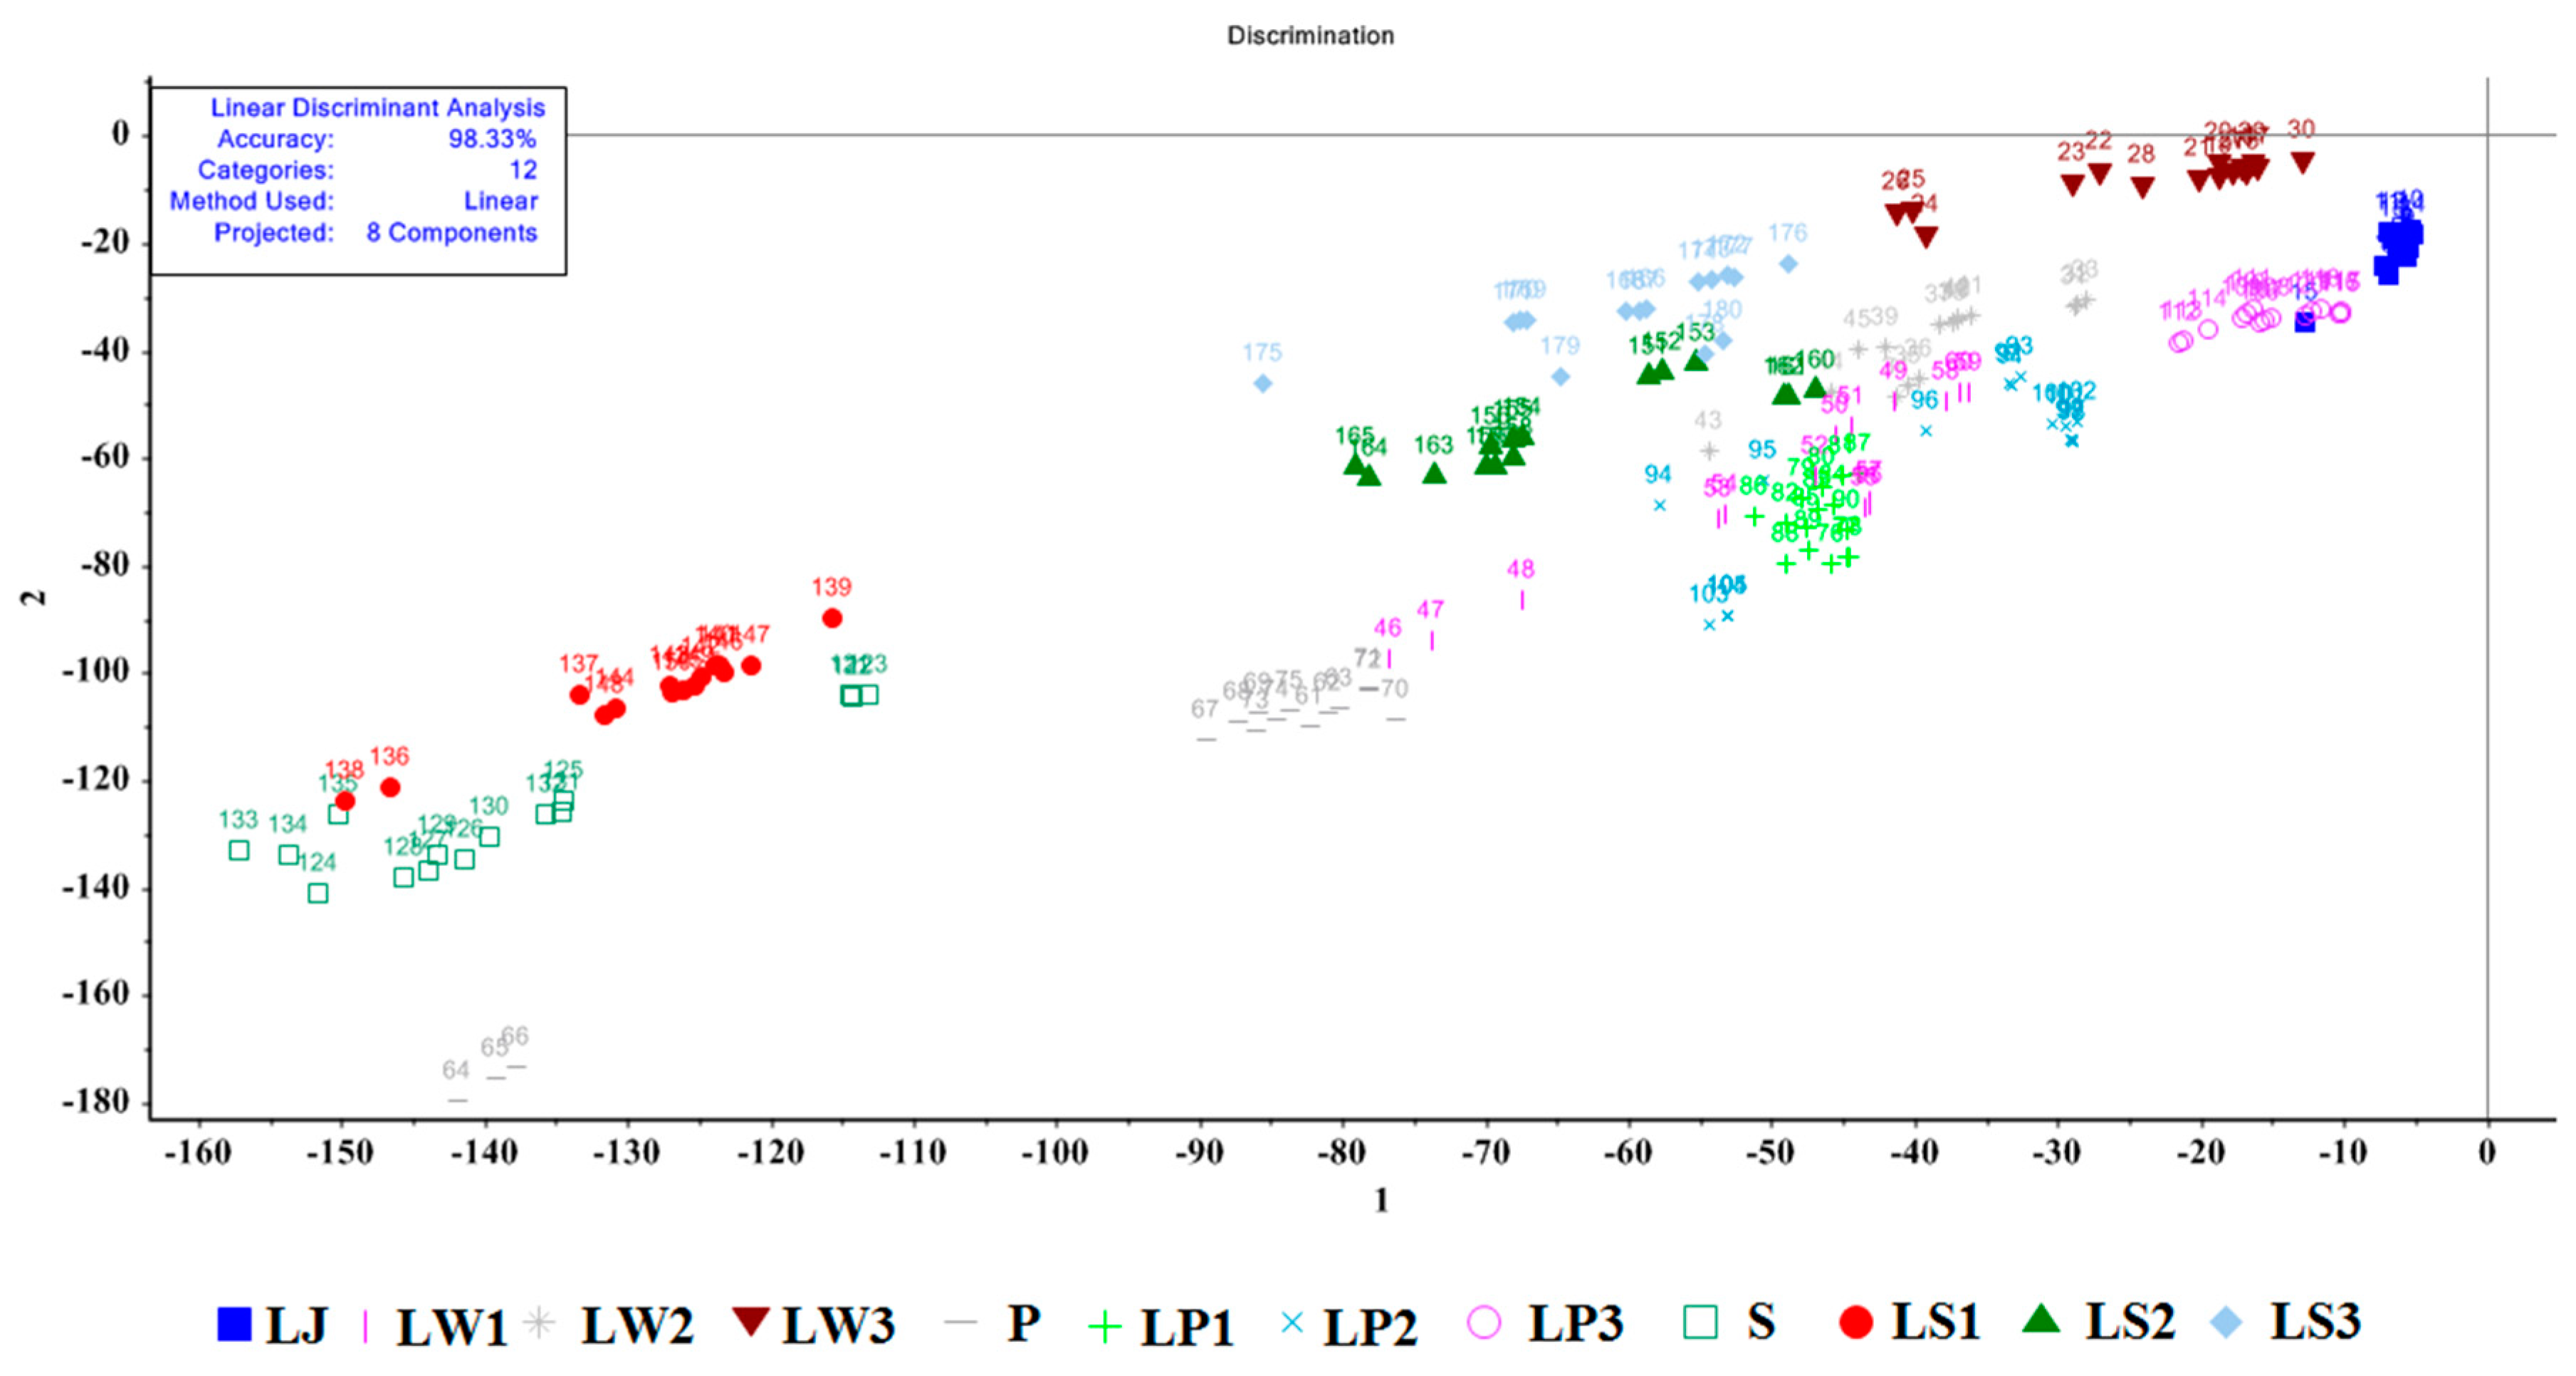
3.2. Linear Discriminant Analysis (LDA)
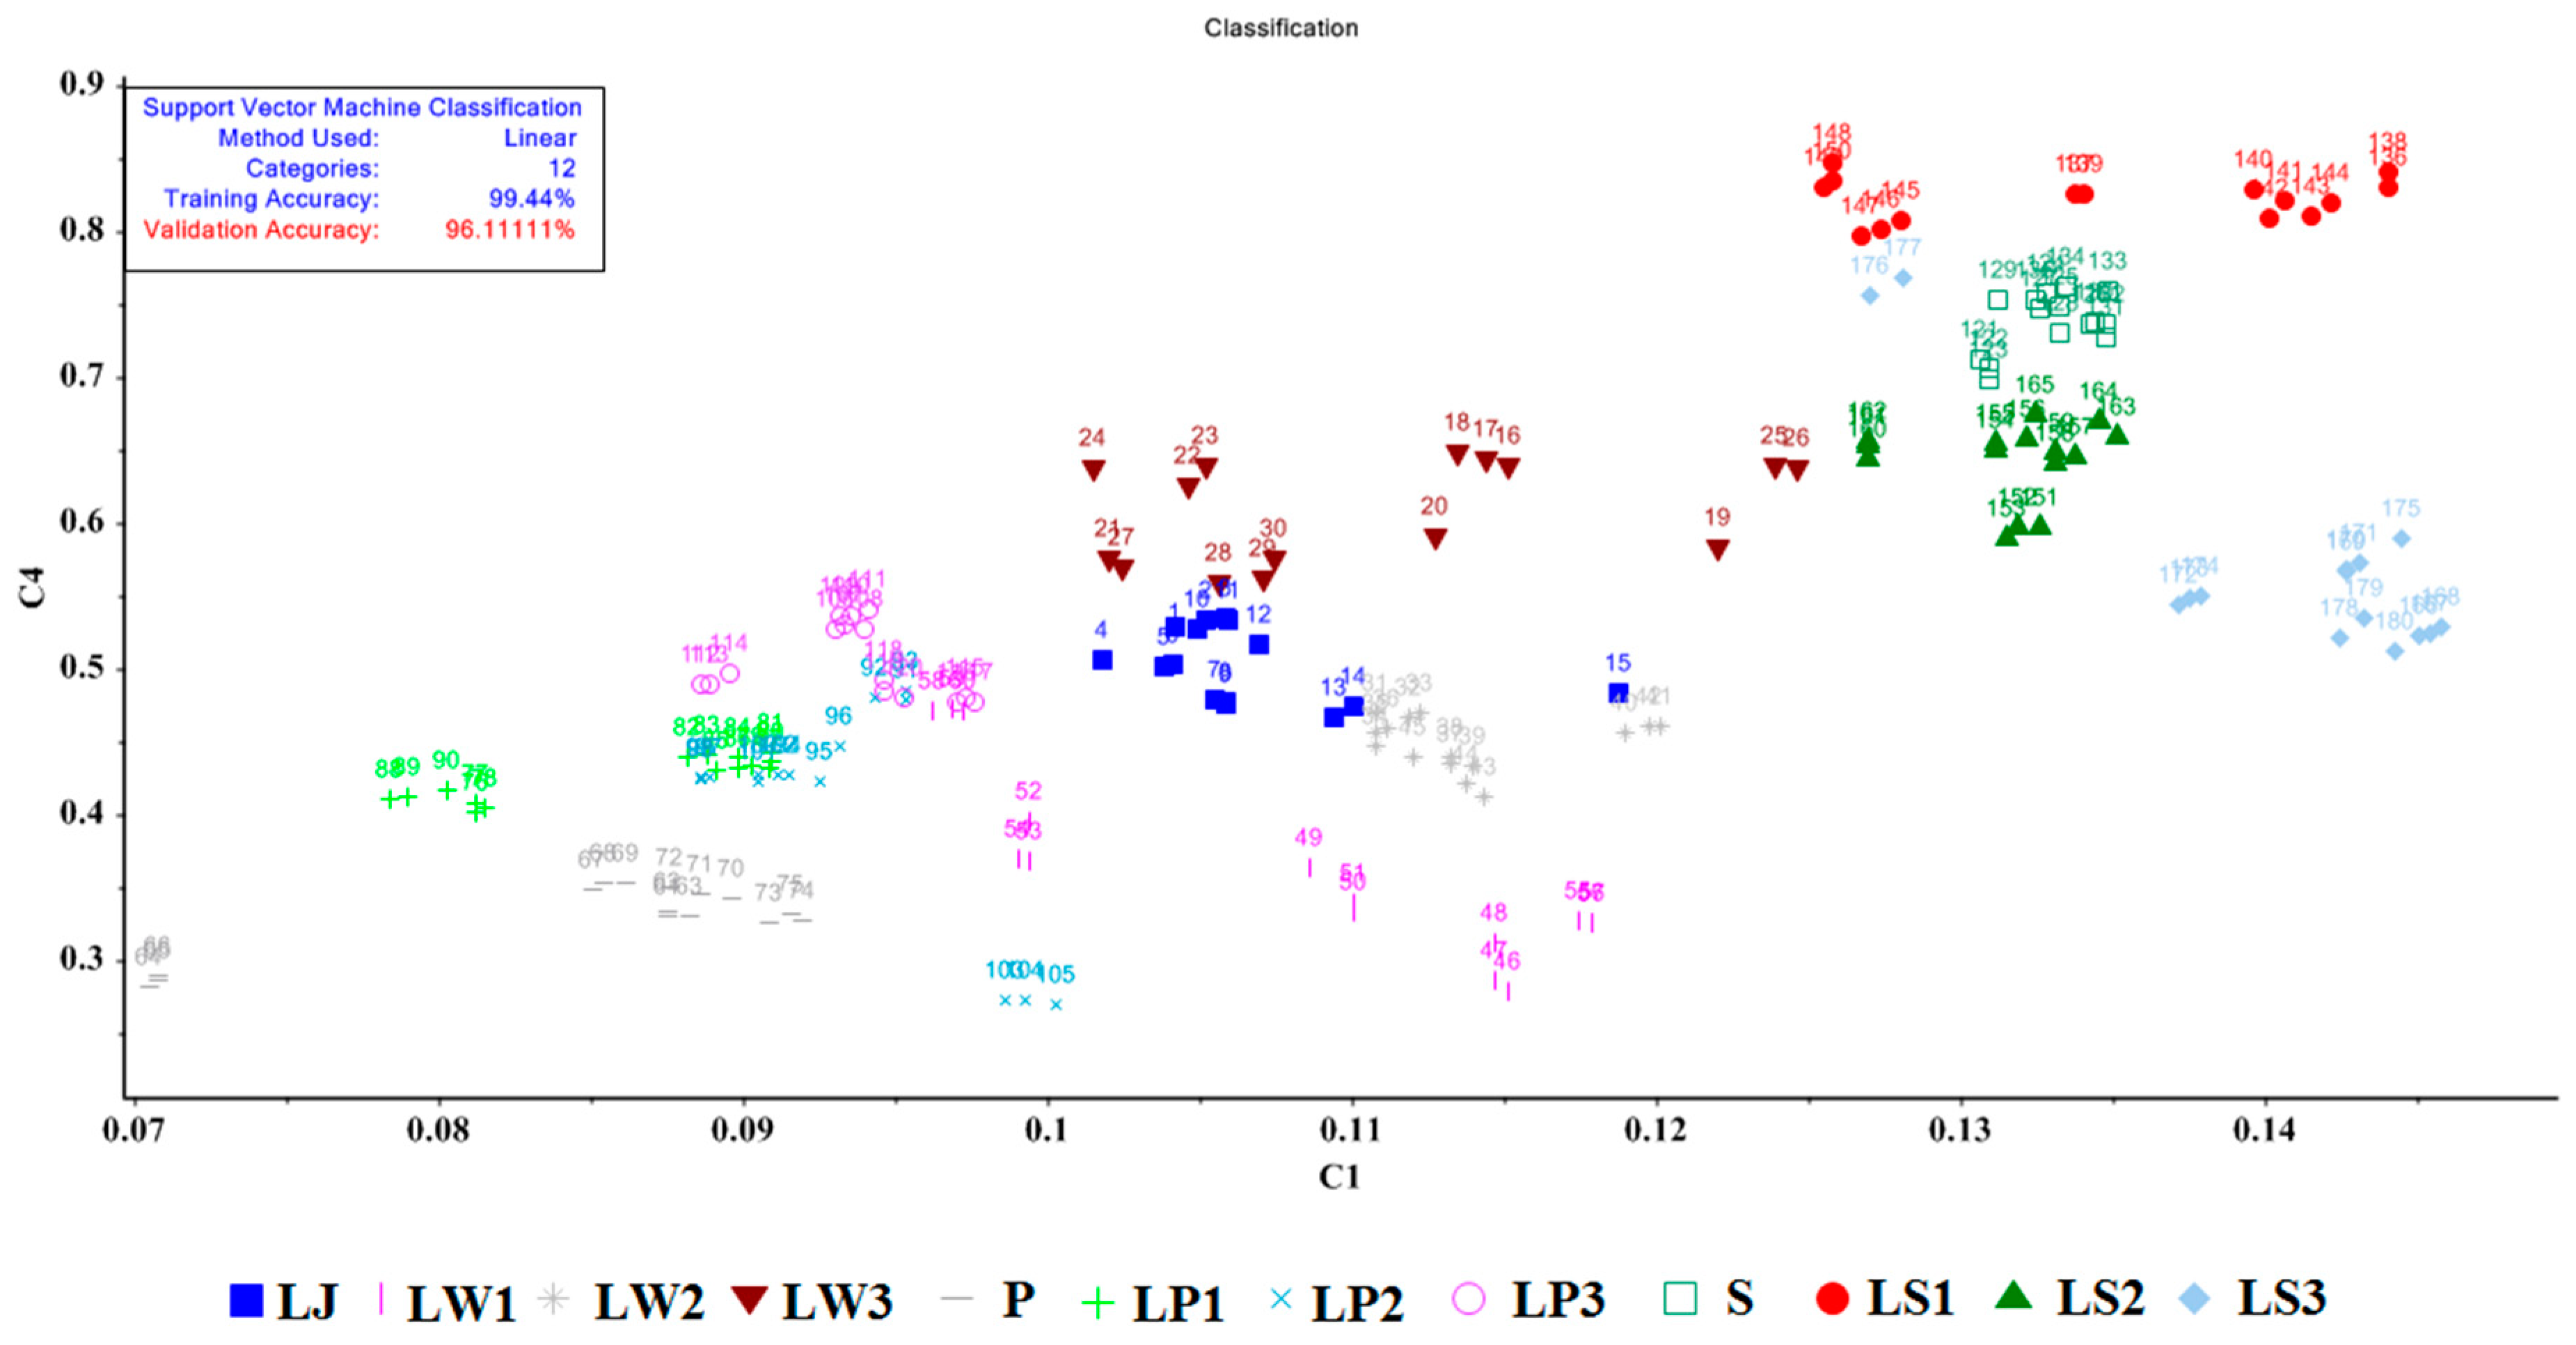
The LDA model was used to detect fraud in lemon juice. In this method, 12 lemon juice groups were classified (Figure 5). Eight metal oxide sensors were used as inputs to the model. The inputs of the model all had the same weight. From Figure 4, it can be seen that the first two unique functions were able to classify the samples into 12 groups with a variance of 98.33%. The larger the variance between the data collection points, the larger the group differentiation. This method correctly and completely separates samples LJ, LP3, and LW1, which are very difficult to detect as fraud.
Table 2 displays the confusion matrix and performance parameters of the performance parameters of the LDA methods. A total of 180 data points were included in the study, and only 3 were misdiagnosed by lemon juice. According to the table, all samples except LW1 were correctly identified, so that three samples have been diagnosed as the LP2 group. The performance parameters of the LDA method for detecting lemon juice fraud can be determined using Equations (2)–(7). Accuracy, precision, recall, and specificity were 0.997, 0.986, 0.983, and 0.998, respectively. Additionally, the AUC and F values were 0.992 and 0.983, respectively. The results obtained in this research were consistent with other products, such as different oil types and adulterated safflower seed oil [58], minced mutton mixed with pork [59], oranges [60], and tomato paste [61]. Moreover, in another study, the electronic nose was used by Gomez, et al. [62] to identify the ripening state of tomatoes, and the results revealed that the electronic nose was able to discriminate the ripening states of tomatoes. The LDA method was used to identify and classify the different ripening stages of tomatoes. This method classified 100% of the total relevant samples for each group.

3.3. SVM Results

Two support vector machine methods, namely C and Nu, were used to classify the lemon juice samples based on the signals obtained from the electronic nose. Nu-SVM basically uses the parameter Nu instead of C (which is used as a hyperparameter in the case of the linear SVM) as a hyperparameter for penalizing incorrect classifications. Range here basically indicates the upper and lower limits between which our hyperparameter can take its value. The range of C is from zero to infinity, but Nu is always between (0,1). The parameters of this method, Nu, C, and γ, were validated by trial and error through minimization. A total of 70% of the data were used for training and the remaining 30% for testing, and the weighting of the input data was the same. Four sigmoid, radial, and linear polynomial functions were also used. Twelve groups of lemon juice samples were analyzed to determine if there were any differences between them, and the results are shown in Table 3.
The results for the classification of lemon juice show that the linear model has a training accuracy of 99.44% and a validation accuracy of 96.11% (Figure 6). As shown in Table 3, the Nu-SVM method provides higher accuracy than the C-SVM method. Table 4 shows the confusion matrix and performance parameters calculated from the linear function of the Nu-SVM method, which provides the highest classification accuracy. Only 1 out of 180 samples of the linear model were misidentified by this matrix, while the other 180 samples were correctly identified. Moreover, the performance parameters of the network, i.e., the values of accuracy, precision, recall, and specificity, were 0.999, 0.994, 0.999, and 0.099, respectively, and the values of AUC and F were also 0.997 and 0.994. These results are consistent with the results obtained by other researchers [63,64,65,66]. Ghasemi-Varnamkhasti, et al. [67] used an electronic nose to determine the freshness of strawberries when they were packaged in different polymers with a high classification accuracy using the SVM method. In a study using an electronic nose, PCA, LDA, and SVM analysis methods were used to detect artificial crab apples. The accuracy of these methods was 85.11, 100, and 98.3%, respectively [68].

3.4. ANN Results

To build the model, eight gas sensors were used as input data and twelve different groups of lemon juice were used as target data. Therefore, the input neurons of the network were set equal to eight, and the output neurons were set equal to twelve. The hidden layer was determined by trial and error. As shown in Table 5, 60% (for training), 20% (for validation), and 20% (for testing) of the total data were used. The developed models were then evaluated by the percentage of correct diagnosis (CCR), R-squared (R2), and root mean square error (RMSE). The optimal topology for the mentioned neural network is the highest value for the coefficient of determination of R2 and the lowest for root mean square error (RMSE). Therefore, the R2 value close to 1 and the RMSE value close to 0 indicate the best model for classification. Based on the results from Table 6, for 12 groups of lemon juice, the topology 8-15-12 was determined to be the best. The R2 values for train and test sets were 0.981 and 0.951, respectively, the RMSE values for train and test sets were 0.027 and 0.061, respectively, and the model had an overall detection accuracy of 97.8%. Table 6 shows the confusion matrix and performance parameters for this network. Accordingly, the performance parameters of the confusion matrix, such as accuracy, precision, recall, and specificity, were 0.996, 0.980, 0.977, and 0.997, respectively, while the AUC and F values were 0.989 and 0.977, respectively. Since the value performance in the training phase is lower than that in the experimental phase, there is no evidence of under- or overfitting. These results are consistent with the studies obtained by other researchers that have been conducted with the help of the E-nose and ANNs [69,70,71,72,73]. Khorramifar, Rasekh, Karami, Malaga-Toboła, and Gancarz [42] used an ANN and an electronic nose to classify potato varieties with a 97.8% accuracy. Similarly, Rasekh, Karami, Wilson, and Gancarz [37] used an olfactory machine and an ANN to classify the essential oils of plants and fruits with a 98.9% accuracy. Accordingly, it can be said that the artificial neural network with the electronic nose is very accurate and efficient in detecting and diagnosing diseases and is also very practical.
According to Figure 7, the 12 lemon juice groups can be accurately classified based on their test results. The statistical results were calculated using Equations (1)–(6) and their average was presented. As can be seen in the figure, all models had an accuracy and specificity greater than 0.995. The SVM method had the highest recall value of 99.4%, while the ANN method had the lowest value of 99.7%. Overall, all models were very accurate, so the electronic nose and chemometrics methods can be used to detect lemon fraud quickly and accurately.
The E-nose and chemometric methods, such as PCA, LDA, QDA and SVM, were used to evaluate the freshness of natural and industrial juices. The accuracy of the aforementioned methods was 93%, 85.83%, 90.83%, and 92.5%, respectively [38]. In a study involving a portable E-nose and the SVM method, the researchers classified poultry meat samples based on their firmness with 100% accuracy. They also used this method for the samples of rapeseed oil and extra virgin olive oil with an overall accuracy of 100% and 82%, respectively [28]. In another study, an artificial neural network was utilized to predict the shelf life of processed cheese; the achieved accuracy was 99.7% [74]. In a study by Khorramifar, Rasekh, Karami, Malaga-Toboła, and Gancarz [42], the use of an ANN and E-nose led to the classification accuracy of 97.8% for potato cultivars. Rasekh, et al. [75] used an olfactory machine and ANN and reported an accuracy of 98.9% in the detection of plant and fruit essential oils. Therefore, it can be said that a combination of a SVM with an E-nose can lead to high accuracy and efficiency in identification and detection.

4. Conclusions

The recent development of electronic sensory methods based on the detection of artificial odors of volatile components using an electronic nose of the type MOS provides a new tool for the detection of genuine and counterfeit foods in commercial markets. These new methods have the potential to facilitate the implementation of regulatory quality assurance and to verify the quality and authenticity of food products through rapid assessment by volatile diffusions (aroma). To determine the relationship between the E-nose signal and the classification of lemon juice, LDA, SVM, and ANN classification algorithms were used and compared. The classification results showed that the accuracy of the Nu-SVM method with a linear kernel function was higher than the others, there was no overlap between the methods, and the methods were able to classify the lemon juice into different categories with high accuracy. Our findings demonstrate that an electronic nose can be used to detect different levels of lemon juice fraud nondestructively. In addition, it is possible to distinguish pure lemon juice from its counterfeit products. Thus, consumers are protected from buying counterfeit products. Moreover, this method is simple and fast and does not require the separation of volatile components.

Author Contributions

Conceptualization, H.K. and E.M.-G.; methodology, A.M.Z. and M.K.; software, H.K.; validation, H.K., A.M.Z. and E.M.-G.; formal analysis, N.M.; investigation, H.K.; resources, E.M.-G. and A.M.Z.; data curation, H.K.; writing—original draft preparation, H.K. and N.M.; writing—review and editing, H.K. and N.M.; visualization, M.K. and H.K.; supervision, M.K. and H.K; project administration, A.M.Z. and E.M.-G.; funding acquisition, H.K. All authors have read and agreed to the published version of the manuscript.

Funding

This research received no external funding.

Institutional Review Board Statement

Not applicable.

Informed Consent Statement

Not applicable.

Data Availability Statement

Not applicable.

Acknowledgments

This research was supported by the Gorgan University of Agricultural Sciences and Natural Resources, Gorgan, Iran, and Razi University, Kermanshah, Iran.

Conflicts of Interest

The authors declare no conflict of interest.

References

  1. Karami, H.; Rasekh, M.; Mirzaee-Ghaleh, E. Application of the E-nose machine system to detect adulterations in mixed edible oils using chemometrics methods. J. Food Process. Preserv. 2020, 44, e14696. [Google Scholar] [CrossRef]
  2. Rasekh, M.; Karami, H. E-nose coupled with an artificial neural network to detection of fraud in pure and industrial fruit juices. Int. J. Food Prop. 2021, 24, 592–602. [Google Scholar] [CrossRef]
  3. Tibola, C.S.; da Silva, S.A.; Dossa, A.A.; Patrício, D.I. Economically Motivated Food Fraud and Adulteration in Brazil: Incidents and Alternatives to Minimize Occurrence. J. Food Sci. 2018, 83, 2028–2038. [Google Scholar] [CrossRef] [PubMed]
  4. Wang, Z.; Jablonski, J.E. Targeted and non-targeted detection of lemon juice adulteration by LC-MS and chemometrics. Food Addit. Contam. Part A 2016, 33, 560–573. [Google Scholar] [CrossRef]
  5. Mohammadian, A.; Barzegar, M.; Mani-Varnosfaderani, A. Detection of fraud in lime juice using pattern recognition techniques and FT-IR spectroscopy. Food Sci. Nutr. 2021, 9, 3026–3038. [Google Scholar] [CrossRef]
  6. Lyu, W.; Yuan, B.; Liu, S.; Simon, J.E.; Wu, Q. Assessment of lemon juice adulteration by targeted screening using LC-UV-MS and untargeted screening using UHPLC-QTOF/MS with machine learning. Food Chem. 2022, 373, 131424. [Google Scholar] [CrossRef]
  7. Gupta, S.; Rahman, M.A.; Sundaram, S. Citrus fruit as A potential source of phytochemical, antioxidant and pharmacological ingredients. J. Sci. Healthc. Explor. 2021, 2581, 8473. [Google Scholar]
  8. Rodríguez-García, C.; Sánchez-Quesada, C.; Gaforio, J.J. Dietary flavonoids as cancer chemopreventive agents: An updated review of human studies. Antioxidants 2019, 8, 137. [Google Scholar] [CrossRef]
  9. Zorpeykar, S.; Mirzaee-Ghaleh, E.; Karami, H.; Ramedani, Z.; Wilson, A.D. Electronic Nose Analysis and Statistical Methods for Investigating Volatile Organic Compounds and Yield of Mint Essential Oils Obtained by Hydrodistillation. Chemosensors 2022, 10, 486. [Google Scholar] [CrossRef]
  10. Bononi, M.; Quaglia, G.; Tateo, F. Preliminary LC-IRMS Characterization of Italian Pure Lemon Juices and Evaluation of Commercial Juices Distributed in the Italian Market. Food Anal. Methods 2016, 9, 2824–2831. [Google Scholar] [CrossRef]
  11. Cautela, D.; Laratta, B.; Santelli, F.; Trifirò, A.; Servillo, L.; Castaldo, D. Estimating Bergamot Juice Adulteration of Lemon Juice by High-Performance Liquid Chromatography (HPLC) Analysis of Flavanone Glycosides. J. Agric. Food Chem. 2008, 56, 5407–5414. [Google Scholar] [CrossRef]
  12. Guyon, F.; Auberger, P.; Gaillard, L.; Loublanches, C.; Viateau, M.; Sabathié, N.; Salagoïty, M.-H.; Médina, B. 13C/12C isotope ratios of organic acids, glucose and fructose determined by HPLC-co-IRMS for lemon juices authenticity. Food Chem. 2014, 146, 36–40. [Google Scholar] [CrossRef]
  13. Gaiad, J.E.; Hidalgo, M.J.; Villafañe, R.N.; Marchevsky, E.J.; Pellerano, R.G. Tracing the geographical origin of Argentinean lemon juices based on trace element profiles using advanced chemometric techniques. Microchem. J. 2016, 129, 243–248. [Google Scholar] [CrossRef]
  14. Alizadeh, M.; Pirsa, S.; Faraji, N. Determination of Lemon Juice Adulteration by Analysis of Gas Chromatography Profile of Volatile Organic Compounds Extracted with Nano-Sized Polyester-Polyaniline Fiber. Food Anal. Methods 2017, 10, 2092–2101. [Google Scholar] [CrossRef]
  15. Brendel, R.; Schwolow, S.; Rohn, S.; Weller, P. Volatilomic Profiling of Citrus Juices by Dual-Detection HS-GC-MS-IMS and Machine Learning-An Alternative Authentication Approach. J. Agric. Food Chem. 2021, 69, 1727–1738. [Google Scholar] [CrossRef]
  16. Khorramifar, A.; Sharabiani, V.R.; Karami, H.; Kisalaei, A.; Lozano, J.; Rusinek, R.; Gancarz, M. Investigating Changes in pH and Soluble Solids Content of Potato during the Storage by Electronic Nose and Vis/NIR Spectroscopy. Foods 2022, 11, 4077. [Google Scholar] [CrossRef]
  17. Gómez, A.H.; Wang, J.; Hu, G.; Pereira, A.G. Electronic nose technique potential monitoring mandarin maturity. Sens. Actuators B Chem. 2006, 113, 347–353. [Google Scholar] [CrossRef]
  18. Rasekh, M.; Karami, H.; Fuentes, S.; Kaveh, M.; Rusinek, R.; Gancarz, M. Preliminary study non-destructive sorting techniques for pepper (Capsicum annuum L.) using odor parameter. LWT 2022, 164, 113667. [Google Scholar] [CrossRef]
  19. Majchrzak, T.; Wojnowski, W.; Dymerski, T.; Gębicki, J.; Namieśnik, J. Electronic noses in classification and quality control of edible oils: A review. Food Chem. 2018, 246, 192–201. [Google Scholar] [CrossRef] [PubMed]
  20. Wasilewski, T.; Migoń, D.; Gębicki, J.; Kamysz, W. Critical review of electronic nose and tongue instruments prospects in pharmaceutical analysis. Anal. Chim. Acta 2019, 1077, 14–29. [Google Scholar] [CrossRef]
  21. Gardner, J.W.; Bartlett, P.N. A brief history of electronic noses. Sens. Actuators B Chem. 1994, 18, 210–211. [Google Scholar] [CrossRef]
  22. Karami, H.; Rasekh, M.; Mirzaee-Ghaleh, E. Comparison of chemometrics and AOCS official methods for predicting the shelf life of edible oil. Chemom. Intell. Lab. Syst. 2020, 206, 104165. [Google Scholar] [CrossRef]
  23. Rüffer, D.; Hoehne, F.; Bühler, J. New Digital Metal-Oxide (MOx) Sensor Platform. Sensors 2018, 18, 1052. [Google Scholar] [CrossRef] [PubMed]
  24. Van Duy, L.; Nguyet, T.T.; Le, D.T.T.; Van Duy, N.; Nguyen, H.; Biasioli, F.; Tonezzer, M.; Di Natale, C.; Hoa, N.D. Room Temperature Ammonia Gas Sensor Based on p-Type-like V2O5 Nanosheets towards Food Spoilage Monitoring. Nanomaterials 2023, 13, 146. [Google Scholar] [CrossRef] [PubMed]
  25. Tatli, S.; Mirzaee-Ghaleh, E.; Rabbani, H.; Karami, H.; Wilson, A.D. Rapid Detection of Urea Fertilizer Effects on VOC Emissions from Cucumber Fruits Using a MOS E-Nose Sensor Array. Agronomy 2022, 12, 35. [Google Scholar] [CrossRef]
  26. Gorsaka-Horczyczak, E.; Guzek, D.; Moleda, Z.; Wojtasik-Kalinowska, I.; Brodowska, M.; Wierzbicka, A. Applications of electronic noses in meat analysis. Food Sci. Technol. 2016, 36, 389–395. [Google Scholar] [CrossRef]
  27. Karami, H.; Rasekh, M.; Mirzaee-Ghaleh, E. Qualitative analysis of edible oil oxidation using an olfactory machine. J. Food Meas. Charact. 2020, 14, 2600–2610. [Google Scholar] [CrossRef]
  28. Wojnowski, W.; Majchrzak, T.; Dymerski, T.; Gebicki, J.; Namieśnik, J. Portable Electronic Nose Based on Electrochemical Sensors for Food Quality Assessment. Sensors 2017, 17, 2715. [Google Scholar] [CrossRef]
  29. Niu, B.; Zhang, H.; Zhou, G.; Zhang, S.; Yang, Y.; Deng, X.; Chen, Q. Safety risk assessment and early warning of chemical contamination in vegetable oil. Food Control 2021, 125, 107970. [Google Scholar] [CrossRef]
  30. Luo, Y.; Li, Z.; Yuan, Y.; Yue, T. Bioadsorption of patulin from kiwi fruit juice onto a superior magnetic chitosan. J. Alloy Compd. 2016, 667, 101–108. [Google Scholar] [CrossRef]
  31. Li, S.; Hu, Y.; Liu, W.; Chen, Y.; Wang, F.; Lu, X.; Zheng, W. Untargeted volatile metabolomics using comprehensive two-dimensional gas chromatography-mass spectrometry—A solution for orange juice authentication. Talanta 2020, 217, 121038. [Google Scholar] [CrossRef] [PubMed]
  32. Qiu, S.; Hou, P.; Huang, J.; Han, W.; Kang, Z. The Monitoring of Black-Odor River by Electronic Nose with Chemometrics for pH, COD, TN, and TP. Chemosensors 2021, 9, 168. [Google Scholar] [CrossRef]
  33. Hong, X.; Wang, J.; Qi, G. E-nose combined with chemometrics to trace tomato-juice quality. J. Food Eng. 2015, 149, 38–43. [Google Scholar] [CrossRef]
  34. Torri, L.; Sinelli, N.; Limbo, S. Shelf life evaluation of fresh-cut pineapple by using an electronic nose. Postharvest Biol. Technol. 2010, 56, 239–245. [Google Scholar] [CrossRef]
  35. Qiu, S.; Wang, J.; Gao, L. Qualification and quantisation of processed strawberry juice based on electronic nose and tongue. LWT-Food Sci. Technol. 2015, 60, 115–123. [Google Scholar] [CrossRef]
  36. Gobbi, E.; Falasconi, M.; Concina, I.; Mantero, G.; Bianchi, F.; Mattarozzi, M.; Musci, M.; Sberveglieri, G. Electronic nose and Alicyclobacillus spp. spoilage of fruit juices: An emerging diagnostic tool. Food Control 2010, 21, 1374–1382. [Google Scholar] [CrossRef]
  37. Rasekh, M.; Karami, H.; Wilson, A.D.; Gancarz, M. Classification and Identification of Essential Oils from Herbs and Fruits Based on a MOS Electronic-Nose Technology. Chemosensors 2021, 9, 142. [Google Scholar] [CrossRef]
  38. Rasekh, M.; Karami, H. Application of electronic nose with chemometrics methods to the detection of juices fraud. J. Food Process. Preserv. 2021, 45, e15432. [Google Scholar] [CrossRef]
  39. Pelosi, P.; Zhu, J.; Knoll, W. From Gas Sensors to Biomimetic Artificial Noses. Chemosensors 2018, 6, 32. [Google Scholar] [CrossRef]
  40. Ayari, F.; Mirzaee- Ghaleh, E.; Rabbani, H.; Heidarbeigi, K. Using an E-nose machine for detection the adulteration of margarine in cow ghee. J. Food Process Eng. 2018, 41, e12806. [Google Scholar] [CrossRef]
  41. Karami, H.; Rasekh, M.; Mirzaee-Ghaleh, E. Identification of olfactory characteristics of edible oil during storage period using metal oxide semiconductor sensor signals and ANN methods. J. Food Process. Preserv. 2021, 45, e15749. [Google Scholar] [CrossRef]
  42. Khorramifar, A.; Rasekh, M.; Karami, H.; Malaga-Toboła, U.; Gancarz, M. A Machine Learning Method for Classification and Identification of Potato Cultivars Based on the Reaction of MOS Type Sensor-Array. Sensors 2021, 21, 5836. [Google Scholar] [CrossRef] [PubMed]
  43. Khorramifar, A.; Karami, H.; Wilson, A.D.; Sayyah, A.H.A.; Shuba, A.; Lozano, J. Grape Cultivar Identification and Classification by Machine Olfaction Analysis of Leaf Volatiles. Chemosensors 2022, 10, 125. [Google Scholar] [CrossRef]
  44. Latif, G.; Ben Brahim, G.; Iskandar, D.N.F.A.; Bashar, A.; Alghazo, J. Glioma Tumors’ Classification Using Deep-Neural-Network-Based Features with SVM Classifier. Diagnostics 2022, 12, 1018. [Google Scholar] [PubMed]
  45. Abiodun, O.I.; Jantan, A.; Omolara, A.E.; Dada, K.V.; Mohamed, N.A.; Arshad, H. State-of-the-art in artificial neural network applications: A survey. Heliyon 2018, 4, e00938. [Google Scholar] [CrossRef] [PubMed]
  46. Jenkins, E.K.; DeChant, M.T.; Perry, E.B. When the Nose Doesn’t Know: Canine Olfactory Function Associated with Health, Management, and Potential Links to Microbiota. Front. Vet. Sci. 2018, 5, 56. [Google Scholar] [CrossRef] [PubMed]
  47. Gonzalez Viejo, C.; Tongson, E.; Fuentes, S. Integrating a Low-Cost Electronic Nose and Machine Learning Modelling to Assess Coffee Aroma Profile and Intensity. Sensors 2021, 21, 2016. [Google Scholar] [CrossRef]
  48. Kulkarni, A.; Chong, D.; Batarseh, F.A. 5-Foundations of data imbalance and solutions for a data democracy. In Data Democracy; Batarseh, F.A., Yang, R., Eds.; Academic Press: Cambridge, MA, USA, 2020; pp. 83–106. [Google Scholar]
  49. Ting, K.M. Confusion Matrix. In Encyclopedia of Machine Learning and Data Mining; Sammut, C., Webb, G.I., Eds.; Springer: Boston, MA, USA, 2017; p. 260. [Google Scholar]
  50. Khairunniza-Bejo, S.; Shahibullah, M.S.; Azmi, A.N.N.; Jahari, M. Non-Destructive Detection of Asymptomatic Ganoderma boninense Infection of Oil Palm Seedlings Using NIR-Hyperspectral Data and Support Vector Machine. Appl. Sci. 2021, 11, 10878. [Google Scholar] [CrossRef]
  51. Bieganowski, A.; Józefaciuk, G.; Bandura, L.; Guz, Ł.; Łagód, G.; Franus, W. Evaluation of Hydrocarbon Soil Pollution Using E-Nose. Sensors 2018, 18, 2463. [Google Scholar] [CrossRef] [PubMed]
  52. Novakovic, J.; Veljovi, A.; Iiic, S.; Papic, Z.; Tomovic, M. Evaluation of classification models in machine learning. Theory Appl. Math. Comput. Sci. 2017, 7, 39–46. [Google Scholar]
  53. Melo, F. Area under the ROC Curve. In Encyclopedia of Systems Biology; Dubitzky, W., Wolkenhauer, O., Cho, K.-H., Yokota, H., Eds.; Springer: New York, NY, USA, 2013; pp. 38–39. [Google Scholar]
  54. Aghili, N.S.; Rasekh, M.; Karami, H.; Azizi, V.; Gancarz, M. Detection of fraud in sesame oil with the help of artificial intelligence combined with chemometrics methods and chemical compounds characterization by gas chromatography—Mass spectrometry. LWT 2022, 167, 113863. [Google Scholar] [CrossRef]
  55. Fuadah, Y.N.; Lim, K.M. Classification of Blood Pressure Levels Based on Photoplethysmogram and Electrocardiogram Signals with a Concatenated Convolutional Neural Network. Diagnostics 2022, 12, 2886. [Google Scholar] [CrossRef]
  56. Celdrán, A.C.; Oates, M.J.; Molina Cabrera, C.; Pangua, C.; Tardaguila, J.; Ruiz-Canales, A. Low-Cost Electronic Nose for Wine Variety Identification through Machine Learning Algorithms. Agronomy 2022, 12, 2627. [Google Scholar] [CrossRef]
  57. Lelono, D.; Triyana, K.; Hartati, S.; Istiyanto, J.E. Classification of Indonesia black teas based on quality by using electronic nose and principal component analysis. AIP Conf. Proc. 2016, 1755, 20003. [Google Scholar] [CrossRef]
  58. Han, L.; Chen, M.; Li, Y.; Wu, S.; Zhang, L.; Tu, K.; Pan, L.; Wu, J.; Song, L. Discrimination of different oil types and adulterated safflower seed oil based on electronic nose combined with gas chromatography-ion mobility spectrometry. J. Food Compos. Anal. 2022, 114, 104804. [Google Scholar] [CrossRef]
  59. Tian, X.; Wang, J.; Ma, Z.; Li, M.; Wei, Z. Combination of an E-Nose and an E-Tongue for Adulteration Detection of Minced Mutton Mixed with Pork. J. Food Qual. 2019, 2019, 4342509. [Google Scholar] [CrossRef]
  60. Centonze, V.; Lippolis, V.; Cervellieri, S.; Damascelli, A.; Casiello, G.; Pascale, M.; Logrieco, A.F.; Longobardi, F. Discrimination of geographical origin of oranges (Citrus sinensis L. Osbeck) by mass spectrometry-based electronic nose and characterization of volatile compounds. Food Chem. 2019, 277, 25–30. [Google Scholar] [CrossRef] [PubMed]
  61. Mohammad-Razdari, A.; Ghasemi-Varnamkhasti, M.; Yoosefian, S.H.; Izadi, Z.; Siadat, M. Potential application of electronic nose coupled with chemometric tools for authentication assessment in tomato paste. J. Food Process Eng. 2019, 42, e13119. [Google Scholar] [CrossRef]
  62. Gomez, A.H.; Wang, J.; Hu, G.; Pereira, A.G. Monitoring storage shelf life of tomato using electronic nose technique. J. Food Eng. 2008, 85, 625–631. [Google Scholar] [CrossRef]
  63. Gu, S.; Wang, Z.; Chen, W.; Wang, J. Early identification of Aspergillus spp. contamination in milled rice by E-nose combined with chemometrics. J. Sci. Food Agric. 2021, 101, 4220–4228. [Google Scholar] [CrossRef]
  64. Wang, Z.; Chen, W.; Gu, S.; Wang, Y.; Wang, J. Evaluation of trunk borer infestation duration using MOS E-nose combined with different feature extraction methods and GS-SVM. Comput. Electron. Agric. 2020, 170, 105293. [Google Scholar] [CrossRef]
  65. Du, D.; Xu, M.; Wang, J.; Gu, S.; Zhu, L.; Hong, X. Tracing internal quality and aroma of a red-fleshed kiwifruit during ripening by means of GC-MS and E-nose. RSC Adv. 2019, 9, 21164–21174. [Google Scholar] [CrossRef] [PubMed]
  66. Payman, S.H.; Bakhshipour Ziaratgahi, A.; Sanaeifar, A. Applying Electronic Nose System for Qualitative Classification of Iranian Black Tea. Innov. Food Technol. 2019, 6, 351–362. [Google Scholar] [CrossRef]
  67. Ghasemi-Varnamkhasti, M.; Mohammad-Razdari, A.; Yoosefian, S.H.; Izadi, Z.; Rabiei, G. Selection of an optimized metal oxide semiconductor sensor (MOS) array for freshness characterization of strawberry in polymer packages using response surface method (RSM). Postharvest Biol. Technol. 2019, 151, 53–60. [Google Scholar] [CrossRef]
  68. Qiao, J.; Su, G.; Liu, C.; Zou, Y.; Chang, Z.; Yu, H.; Wang, L.; Guo, R. Study on the Application of Electronic Nose Technology in the Detection for the Artificial Ripening of Crab Apples. Horticulturae 2022, 8, 386. [Google Scholar] [CrossRef]
  69. Rusinek, R.; Dobrzański, B.; Oniszczuk, A.; Gawrysiak-Witulska, M.; Siger, A.; Karami, H.; Ptaszyńska, A.A.; Żytek, A.; Kapela, K.; Gancarz, M. How to Identify Roast Defects in Coffee Beans Based on the Volatile Compound Profile. Molecules 2022, 27, 8530. [Google Scholar] [CrossRef]
  70. Velička, A.; Tarasevičienė, Ž.; Hallmann, E.; Kieltyka-Dadasiewicz, A. Impact of Foliar Application of Amino Acids on Essential Oil Content, Odor Profile, and Flavonoid Content of Different Mint Varieties in Field Conditions. Plants 2022, 11, 2938. [Google Scholar] [CrossRef]
  71. Srinath, K.; Kiranmayee, A.H.; Bhanot, S.; Panchariya, P.C. Detection of Palm Oil Adulteration in Sunflower Oil Using ATR-MIR Spectroscopy Coupled with Chemometric Algorithms. MAPAN 2022, 37, 483–493. [Google Scholar] [CrossRef]
  72. Teixeira, G.G.; Dias, L.G.; Rodrigues, N.; Marx, Í.M.G.; Veloso, A.C.A.; Pereira, J.A.; Peres, A.M. Application of a lab-made electronic nose for extra virgin olive oils commercial classification according to the perceived fruitiness intensity. Talanta 2021, 226, 122122. [Google Scholar] [CrossRef]
  73. Cruz-Domínguez, O.; Carrera-Escobedo, J.L.; Guzmán-Valdivia, C.H.; Ortiz-Rivera, A.; García-Ruiz, M.; Durán-Muñoz, H.A.; Vidales-Basurto, C.A.; Castaño, V.M. A novel method for dried chili pepper classification using artificial intelligence. J. Agric. Food Res. 2021, 3, 100099. [Google Scholar] [CrossRef]
  74. Goyal, S.; Goyal, G. Heuristic Machine Learning Feedforward Algorithm for Predicting Shelf Life of Processed Cheese. Int. J. Basic Appl. Sci. 2012, 1, 458–467. [Google Scholar] [CrossRef]
  75. Rasekh, M.; Karami, H.; Wilson, A.D.; Gancarz, M. Performance Analysis of MAU-9 Electronic-Nose MOS Sensor Array Components and ANN Classification Methods for Discrimination of Herb and Fruit Essential Oils. Chemosensors 2021, 9, 243. [Google Scholar] [CrossRef]
Figure 1. Schematic of sample preparation steps.
Processes 11 01531 g001
Figure 2. Schematic of E-nose used. The components of this system consist of the following parts: (a) Air filter (activated charcoal to remove ambient-air VOC hydrocarbons); (b) Sample headspace chamber; (c) Solenoid air valves; (d) Diaphragm pump; (e) E-nose sensor array chamber; (f) Data acquisition recorder; (g) Personal computer (PC); (h) Air outlet line from sensor array chamber (for exhaust gases) [37].
Processes 11 01531 g002
Figure 3. Two-dimensional PCA plot to detect lemon juice fraud with data collected using an electronic nose. Abbreviations: Lemon juice (LJ), 25% lemon and 75% water (LW1), 50% lemon and 50% water (LW2), 75% lemon and 25% water (LW3); Lemon Pulp (P), 25% lemon and 75% pulp (LP1), 50% lemon and 50% pulp (LP2), 75% lemon and 25% pulp (LP3); Wheat Straw (S), 25% lemon and 75% straw (LS1), 50% lemon and 50% straw (LS2), 75% lemon and 25% straw (LS3).
Processes 11 01531 g003
Figure 4. Loading diagram showing the effectiveness of individual MOS sensors in contributing to detect lemon juice fraud.
Processes 11 01531 g004
Figure 5. Results of linear analysis to detect lemon juice fraud using LDA. Abbreviations: Lemon juice (LJ), 25% lemon and 75% water (LW1), 50% lemon and 50% water (LW2), 75% lemon and 25% water (LW3); Lemon Pulp (P), 25% lemon and 75% pulp (LP1), 50% lemon and 50% pulp (LP2), 75% lemon and 25% pulp (LP3); Wheat Straw (S), 25% lemon and 75% straw (LS1), 50% lemon and 50% straw (LS2), 75% lemon and 25% straw (LS3).
Processes 11 01531 g005
Figure 6. Results of the Nu-SVM method with liner kernel function to detect lemon juice fraud. Abbreviations: Lemon Juice (LJ), 25% lemon and 75% water (LW1), 50% lemon and 50% water (LW2), 75% lemon and 25% water (LW3); Lemon Pulp (P), 25% lemon and 75% pulp (LP1), 50% lemon and 50% pulp (LP2), 75% lemon and 25% pulp (LP3); Wheat Straw (S), 25% lemon and 75% straw (LS1), 50% lemon and 50% straw (LS2), 75% lemon and 25% straw (LS3).
Processes 11 01531 g006
Figure 7. Average performance parameters of four different models to detect lemon juice fraud.
Processes 11 01531 g007
Table 1. The used sensors in the electronic nose [27], reproduced with permission from author, Journal of Food Measurement and Characterization, published by Springer Nature, 2020.
Sensor TypeMain ApplicationsTypical Detection Ranges (ppm)
MQ3Alcohol10–300
TGS822Steam organic solvents50–5000
MQ-136Sulfur dioxide (SO2)1–200
MQ-9CO and combustible gasCo 10–1000, Cg 100–10,000
TGS813CH4, C3H8, C4H10500–10,000
MQ135Steam ammonia, benzene, sulfide10–10,000
TGS2602Sulfide, hydrogen sulfide, ammonia, toluene1–30
TGS2620Alcohol, steam organic solvents50–5000
Table 2. Confusion matrix and performance parameters obtained from the LDA method to detect lemon juice fraud.
LJLW1LW2LW3PLP1LP2LP3SLS1LS2LS3AccuracyPrecisionRecallSpecificityAUCF
LJ15000000000001.0001.0001.0001.0001.0001.000
LW101200000000000.9831.0000.8001.0001.0000.889
LW200150000000001.0001.0001.0001.0001.0001.000
LW300015000000001.0001.0001.0001.0001.0001.000
P00001500000001.0001.0001.0001.0001.0001.000
LP100000150000001.0001.0001.0001.0001.0001.000
LP203000015000000.9830.8331.0000.9820.9080.909
LP300000001500001.0001.0001.0001.0001.0001.000
S00000000150001.0001.0001.0001.0001.0001.000
LS100000000015001.0001.0001.0001.0001.0001.000
LS200000000001501.0001.0001.0001.0001.0001.000
LS300000000000151.0001.0001.0001.0001.0001.000
Average0.9970.9860.9830.9980.9920.983
Abbreviations: Lemon juice (LJ), 25% lemon and 75% water (LW1), 50% lemon and 50% water (LW2), 75% lemon and 25% water (LW3); Lemon Pulp (P), 25% lemon and 75% pulp (LP1), 50% lemon and 50% pulp (LP2), 75% lemon and 25% pulp (LP3); Wheat Straw (S), 25% lemon and 75% straw (LS1), 50% lemon and 50% straw (LS2), 75% lemon and 25% straw (LS3).
Table 3. Results and comparison of Nu-SVM and C-SVM models subjected to the kernel functions.
Kernel FunctionC-SVMNu-SVM
CγTrainValidationNuγTrainValidation
Linear100197.7794.440.10.25599.4496.11
Polynomial11090.5587.770.5196.1191.66
Radial basis function110093.3385.550.10.597.2295.55
Sigmoid0.110092.2286.110.10.25589.4488.88
The bolded value in the table means the Nu-SVM model with a linear kernel function showed the best performance in detecting lemon fraud.
Table 4. Confusion matrix and performance parameters to detect lemon juice fraud using the Nu-SVM method with liner kernel function.
LJLW1LW2LW3PLP1LP2LP3SLS1LS2LS3AccuracyPrecisionRecallSpecificityAUCF
LJ15000000000001.0001.0001.0001.0001.0001.000
LW101400000000000.9941.0000.9331.0001.0000.966
LW200150000000001.0001.0001.0001.0001.0001.000
LW300015000000001.0001.0001.0001.0001.0001.000
P00001500000001.0001.0001.0001.0001.0001.000
LP100000150000001.0001.0001.0001.0001.0001.000
LP201000015000000.9940.9381.0000.9940.9660.968
LP300000001500001.0001.0001.0001.0001.0001.000
S00000000150001.0001.0001.0001.0001.0001.000
LS100000000015001.0001.0001.0001.0001.0001.000
LS200000000001501.0001.0001.0001.0001.0001.000
LS300000000000151.0001.0001.0001.0001.0001.000
Average0.9990.9950.9940.9990.9970.994
Abbreviations: Lemon Juice (LJ), 25% lemon and 75% water (LW1), 50% lemon and 50% water (LW2), 75% lemon and 25% water (LW1); Lemon Pulp (P), 25% lemon and 75% pulp (LP1), 50% lemon and 50% pulp (LP2), 75% lemon and 25% pulp (LP3); Wheat Straw (S), 25% lemon and 75% straw (LS1), 50% lemon and 50% straw (LS2), 75% lemon and 25% straw (LS3).
Table 5. Artificial neural network results.
TopologyTrainTestCCR (%)
RMSER2RMSER2
8-5-120.4110.6720.4560.63466.4
8-6-120.3460.7310.4600.63270.0
8-7-120.2780.8080.3680.72578.2
8-8-120.2210.8350.3500.73680.3
8-9-120.2030.8640.2450.82485.5
8-10-120.0900.9320.2150.85289.8
8-11-120.1170.9230.1850.87189.1
8-12-120.0800.9450.2270.86190.0
8-13-120.0470.99670.2190.85791.4
8-14-120.0930.9780.2680.90494.2
8-15-120.0270.9810.0610.95997.8
The 8-15-12 topology is the best performance in detecting lemon fraud.
Table 6. Confusion matrix and performance parameters to detect lemon juice fraud using ANN methods.
LJLW1LW2LW3PLP1LP2LP3SLS1LS2LS3AccuracyPrecisionRecallSpecificityAUCF
LJ15000000000001.0001.0001.0001.0001.0001.000
LW101500003000000.9830.8331.0000.9820.9080.909
LW200150000000001.0001.0001.0001.0001.0001.000
LW300015000000001.0001.0001.0001.0001.0001.000
P00001500000001.0001.0001.0001.0001.0001.000
LP100000150000001.0001.0001.0001.0001.0001.000
LP200000012000000.9831.0000.8001.0001.0000.889
LP300000001500001.0001.0001.0001.0001.0001.000
S00000000150001.0001.0001.0001.0001.0001.000
LS100000000015001.0001.0001.0001.0001.0001.000
LS200000000001510.9940.9381.0000.9940.9660.968
LS300000000000140.9941.0000.9331.0001.0000.966
Average0.9960.9810.9780.9980.9890.978
Abbreviations: Lemon Juice (LJ), 25% lemon and 75% water (LW1), 50% lemon and 50% water (LW2), 75% lemon and 25% water (LW1); Lemon Pulp (P), 25% lemon and 75% pulp (LP1), 50% lemon and 50% pulp (LP2), 75% lemon and 25% pulp (LP3); Wheat Straw (S), 25% lemon and 75% straw (LS1), 50% lemon and 50% straw (LS2), 75% lemon and 25% straw (LS3).
Disclaimer/Publisher’s Note: The statements, opinions and data contained in all publications are solely those of the individual author(s) and contributor(s) and not of MDPI and/or the editor(s). MDPI and/or the editor(s) disclaim responsibility for any injury to people or property resulting from any ideas, methods, instructions or products referred to in the content.

