
Research on the Mechanism and Control Strategy of Microbubble Cleaning Sludge

1
College of Mechanical and Electronic Engineering, Shandong University of Science and Technology, Qingdao 266590, China
2
College of Mechanical and Electronic Engineering, China University of Petroleum (East China), Qingdao 266580, China
3
Sinopec Qilu Petrochemical Company, Zibo 255400, China
*
Author to whom correspondence should be addressed.
Processes 2023, 11(10), 2915; https://doi.org/10.3390/pr11102915
Submission received: 27 July 2023
/
Revised: 2 September 2023
/
Accepted: 28 September 2023
/
Published: 5 October 2023
(This article belongs to the Special Issue Risk Assessment and Reliability Engineering of Process Operations)
Abstract
:Microbubble cleaning technology has the characteristics of environmental protection and low energy consumption and has been initially applied in the field of oil sludge cleaning. For the controllability of microbubbles in the cleaning process, this paper adopted the numerical simulation method to quantitatively study the growth and collapse mechanism of bubbles in the cleaning process, the influence law of flow field, and parameter changes on the dynamic behavior of bubbles from the perspective of micro-dynamics. It was found that the dynamic characteristics of the flow field around the bubble in the free field show a symmetrical distribution, while the motion of the fluid near the wall is blocked by the wall, and the flow field between the bubble and the wall becomes irregular. It was also found that the large amplitude pressure changes in microbubbles produced a “plastic hinge” alternating impact on the wall, the bubble collapse, and wall pulsation pressure change are mainly controlled by the driving pressure. The liquid temperature mainly affects the dynamic characteristics of the bubble by causing a change in the viscosity of the medium. Under the condition of Pd = 0.1 MPa and γ = 1.5, when the liquid viscosity decreases from 0.110 to 0.00314 Pa·s, the maximum pressure affected by the first bubble collapse increases from 200.71 to 317.74 Kpa. Compared with the bubble distribution, the impact of increasing the number of bubbles on the wall is more significant. Under the condition of γ = 1 and Pd = 0.1 MPa, compared with the single bubble, the pulse pressure of nine bubbles’ collapse on the wall increases by 100 KPa. The research results can provide technical support for the development of microbubble cleaning technology.
1. Introduction
A large amount of oily sludge will be produced in the production process of oilfields and refineries, storage and transportation, as well as the treatment of oily water. It is an urgent problem for oilfields and environmental protection departments to properly handle and dispose of oily sludge to avoid environmental pollution. Traditional jet cleaning will cause waste of water resources, and chemical cleaning agents may cause secondary pollution, while bubble cleaning has the characteristics of low energy consumption and self-cleaning, which provides a new means for the removal and cleaning of oily sludge [1]. Bubble cleaning is the cavitation of the liquid induced by a cavitation generator and the use of the energy therein to remove surface contaminants [2], cavitation refers to the flow phenomenon of vaporization of the liquid due to a sharp decrease in pressure. The generation, development, and collapse of bubbles in the process of vaporization are often accompanied by dramatic pressure and temperature changes, resulting in significant energy transformations. When the bubble collapses near the rigid boundary, external factors, such as force and pressure gradient, will cause the shape of the bubble to become an asymmetric structure and further form a microjet facing the wall, resulting in a water hammer impact pressure. The local high stress caused by high-speed flow field, large pressure change, and shock wave on the adjacent material surface is sufficient to remove the particles adhered to the wall [3,4,5]. High-speed jet also plays an important role in ultrasonic cavitation, underwater explosion [6,7], and small-scale medical applications [8].
Currently, microbubbles show greater advantages in stain cleaning [9,10], and microbubble with a diameter d < 50 µm has been used as a chemical-free cleaning technique to clean contaminated soil [11], human skin [12], and bio-contaminated membranes [13] and other fields. However, the refinement of bubbles also brings many challenges to the mechanism and theoretical research on bubble cleaning, mainly because the cleaning process involves the activation and dynamics of submicron bubbles. These bubbles grow and collapse on the time scale of microseconds and milliseconds, forming fast microjets and sending out shock waves. It is difficult to quantitatively study the growth and collapse mechanisms of microbubbles in small spatial scales and time scales by experimental means, leading to a lack of further understanding of the complex characteristics of microbubble collapse and rebound, bubble collapse pressure, jet velocity, and impact pressure on solid walls [14]. Therefore, scholars mainly study the control strategy of microbubbles with the help of theoretical research and numerical simulation. As early as 1917, Sir Rayleigh, a famous British scientist, first proposed a Rayleigh bubble dynamics model based on the assumption of inviscid, irrotational, and incompressible fluid and combined with the equation of state of gas [15]. After this model was proposed, Plesset et al. [16] modified and improved the model. Poritsky et al. [17] considered the viscosity and surface tension of the fluid and obtained the classical Rayleigh–Plesset (R–P) equation. Based on the analysis of the mass transfer equation, the multiphase flow is regarded as a homogeneous mixture, which is mainly realized by solving the mass exchange between the gas and liquid phases [18]. Under the condition of mechanical and thermodynamic equilibrium, the mechanism of two-phase cavitation is regarded as a single fluid flow, and the transformation model between gas phase and liquid phase is established based on the equation of state [19]. At present, studies on the regulation and control of bubble mechanisms are mostly based on the indirect regulation of microjets by a single factor [20,21]. Some researchers try to realize the passive regulation of the bubble collapse mechanism by changing the wall structure so as to reduce the erosion of the jet to the wall. Kadivar et al. [22] proposed a passive control method to study the erosion dynamics of a single bubble after collapse by using a “sharkskin” V-shaped structure. The results show that the bubble collapse near the V-shaped structure surface is compared with the single bubble collapse near the smooth surface. The erosion area on the surface of a V-shaped structure decreases significantly. Andrews et al. [23] believe that the complex wall geometry will lead to a change in bubble collapse behavior, especially the jet direction. However, a single control mode makes it difficult to form an effective control strategy, and the complexity of the bubble itself makes it difficult to control in terms of controllability, stability, and collapse intensity. In view of the current research situation, this paper adopts a research method combining numerical simulation and theoretical analysis to study the growth and collapse mechanism of microbubbles from the perspective of microscale dynamics, quantitatively study the main factors affecting the evolution of bubble morphology and propose bubble control strategies. This research is of great significance to promote the wide application of microbubble cleaning technology.
2. Mechanism of Bubble Migration and Evolution in the Cleaning Process
2.1. Numerical Simulation of Bubble Migration and Evolution
2.1.1. Basic Theories
- (a)
- Governing equations
In this paper, the VOF model is used to calculate the bubble collapse process. The model regards the whole flow field as a fluid with variable density, that is, a mixture of gas and water [24]. The mathematical model is as follows:
where, ρ and μ are the density and dynamic viscosity of the fluid, respectively, v is the velocity vector of the flow field, p is the pressure of the flow field, E is the total energy, T is the temperature, k is the heat transfer coefficient, and I is the unit matrix.
The surface tension term Fσ is expressed as:
where σ is the surface tension coefficient, αw is the volume fraction of the liquid phase in the grid cell, and is the curvature of the phase interface.
The VOF model constructs and tracks the interface according to the volume fraction of the fluid composition phase in each grid cell at each moment.
The transport equation for the volume fraction αw of the liquid phase is:
At a certain time, in a grid element, αw = 1 indicates that the unit is pure liquid phase. If αw = 0, then the unit is a pure gas phase; when 0 < αw < 1, then the unit is an interface element containing two-phase materials [25].
The density and dynamic viscosity of the fluid are calculated by the following formula:
where the subscripts w and g represent the liquid and gas phases, respectively, the incompressible liquid density ρw is a constant. Considering the compressibility of the gas, the gas density satisfies the ideal gas state equation, the value of ρg is determined by Equation (7):
In Equation (7), is the universal gas constant and is the molar mass of the gas.
As the bubble collapse process is unsteady, the pressure–velocity coupling solution is obtained by using the pressure implicit operator splitting algorithm (PISO). In the discrete scheme, the gradient term adopts the least square scheme based on the grid element. In order to optimize the calculation time, the variable time step is used, and the time step is set between 10−8 and 10−11 s.
- (b)
- Dynamic model of bubbles near the solid wall
On the basis of the Doinikov’s theoretical model, the dynamic model of double bubbles under ultrasonic conditions is obtained by using the mirror image principle as follows [26]:
In Equation (8), R is the radius of the spherical bubble, with a value of 10 μm. is the velocity at the bubble boundary, is the acceleration at the bubble boundary. l is the distance between the center of the bubble and the solid wall, with a value of 25 μm. ρ is the liquid density, with a value of 1000 kg/m3. is the gas pressure inside the bubble, with a value of 1 MPa. is the saturated vapor pressure inside the bubble, with a value of 2340 Pa. σ is the surface tension coefficient, with a value of 0.076 N/m. η is the liquid viscosity coefficient, with a value of 1000 kg/ms. is the liquid static pressure, with a value of 0.1 MPa and is the external ultrasonic field.
Only under the action of static pressure, considering the influence of gas compressibility and rigid interface on bubble motion, the dynamic model of the bubble is obtained as follows:
2.1.2. Numerical Model
In this paper, the ANSYS-FLUENT software is used to simulate the bubble with the maximum radius of Rmax ≤ 50 μm. The calculation domain and initial conditions are shown in Figure 1. The square fluid domain with a side length of 500 × 500 μm is selected, and the quadrilateral structured grid is used to divide the whole calculation domain. The initial radius of the bubble in the calculation region is R0, the bubble in the free field is located at the center of the computational domain, and all boundaries are set to the pressure outlet. The bubble near the wall is located on the central axis of the calculation domain, and the distance between the center of the bubble and the wall is h. The lower boundary is set as a rigid boundary with no-slip boundary conditions on the wall, and the other boundaries are set as the pressure outlet. In order to capture the evolution of bubbles, transient simulation is enabled in the numerical simulation, and the convergence accuracy is 10−3. In the fluid micromass, the water phase is set as the main phase, and the bubble as the secondary phase, and the bubble particles are placed into the fluid micromass by Patch according to the requirements of subsequent simulation. In order to eliminate the influence of the number of grids on the calculation accuracy, the pulsation processes of bubbles in the free field and near the wall are numerically simulated, respectively. The bubble with an initial radius R0 = 10 μm is selected as the core, and the distance between the center of the bubble and the wall is 25 μm. The bubbles under the two field sources are initially in equilibrium in the liquid of 1 MPa, and then the environmental pressure suddenly drops to 0.1 MPa.
Figure 2a shows the results of the comparative analysis between the numerical solution of the bubble radius variation in the free field and the analytical solution of the classical Rayleigh–Plesset (R–P) equation. When the grid number is at 2.5 × 10⁵ and 1.0 × 10⁶, the bubble radius basically coincides with the calculated results of the R–P equation. In the bubble collapse stage, the maximum difference between the simulated data and the R–P equation is 1.5 μm, and the relative error is 4.6%. The error is mainly due to the fact that the weak compressibility of the fluid is not taken into account in the numerical simulation [27]. Figure 2b shows the central pressure curve of the wall monitored under different grid numbers. Figure 2b shows the variation curves of wall center pressure monitored under different grid numbers, when t = 12.75 μs, the center pressure of the jet impinging on the wall reaches the first peak value. At this time, the difference in pressure produced by the grid number of 2.5 × 10⁵ versus 1.0 × 10⁶ is small, and at the same time, it is the closest to the pressure value of 4.4 MPa measured experimentally by Chahine [6]. Considering the calculation accuracy and calculation time, the number of calculation grids is 2.5 × 10⁵.
Based on the above-selected grid number and numerical simulation conditions, the fourth-order Runge–Kutta algorithm is used to solve Equation (9) by using Matlab software. The comparative analysis of the numerical simulation results of the variation of bubble radius with the analytical solution is shown in Figure 3. The results show that the calculation results of the two methods basically agree with each other, and the maximum relative error is 3%. This proves that the numerical method used in this study is reliable for the simulation of bubble collapse and also verifies the validity of the Doinikov equation.
2.1.3. Morphological Evolution of Bubbles
The shape of the bubble and the evolution of its center-of-mass positions in the free field and near the solid wall are shown in Figure 4a,b. Due to the symmetry of the system, the bubble shape in the free field is always regular spherical, and the center of mass of the bubble is fixed in position during the pulsation, while the bubble shape near the solid wall is non-spherical.
As the bubbles grow, the blocked flow causes the bubble interface near the wall to flatten and a water film to form between the fully grown bubbles and the wall, making the bubble cannot contact the wall directly. The numerical simulation captures the development process of the jet in the later stage of the bubble collapse. The last outline shows the formation of the annular bubble and the rebound of the bubble phenomenon when the jet completely penetrates the bubble. For the bubble in the near-wall laminar flow field, its centroid moves perpendicular to the wall. As the bubble expands, the center of mass of the bubble gradually moves away from the solid wall and moves toward the wall during the collapse. With the flow restriction on the side of the bubble wall, more growth occurs at the distal end, and the unrestricted side of the bubble, and more bubbles grow on the side away from the wall, resulting in the center of mass far away from the wall. When the bubble collapses, the flow on the side of the bubble wall is restricted, thus reducing the collapse rate on this side.
2.2. Dynamic Behavior Analysis of Free Field and Near-Wall Bubbles
The radius variation curves of the bubbles at the free field and near the wall are generated by the Doinikov equation, respectively. The velocity and acceleration of the bubble boundary are obtained by deriving the data. The variation curves of radius, velocity, and acceleration of bubbles during expansion and collapse are shown in Figure 5. The black curve represents the radius changes in the bubble, the red curve denotes the bubble boundary velocity, where the positive value indicates that the velocity direction points to the outside of the bubble, and the blue curve indicates the change in the boundary acceleration during the bubble motion, and the positive and negative relationship refers to the acceleration direction, which means the same as the velocity direction. The simulation process of bubble boundary velocity in the near-wall jet phase is shown in Figure 6.
Combining Figure 5 and Figure 6 to analyze the variation of velocity and acceleration at the bubble boundary under both conditions, the results show that the velocity and acceleration at the bubble boundary reach their maximum near the minimum radius of the bubble in the free field and near the wall, while their values are smaller away from the minimum radius of the bubble. This is mainly because the bubble is affected by the pressure of the external environment in the compression stage, which leads to the decrease in the bubble radius and the increase in the pressure in the bubble, so the velocity and acceleration of the bubble boundary also increase accordingly. When the bubble is compressed to the minimum radius, the pressure inside the bubble reaches the maximum, at which time the bubble violently collapses, and the velocity and acceleration of the bubble boundary also reach the maximum accordingly. As the bubble collapse will release the pressure inside the bubble to the surrounding liquid medium, resulting in a sharp decrease in the pressure inside the collapsed bubble, the velocity and acceleration of the bubble boundary will be rapidly reduced to the minimum. During the initial expansion of the bubble, the motion of the bubble boundary is obviously hindered by the wall, and the peak velocity and acceleration of the bubble boundary near the wall are lower than those in the free field, but when the jet is formed, the peak velocity of the bubble boundary near the wall is much higher than that of the free field, and the maximum velocity of the bubble boundary is 0.35 Ma.
2.3. Characteristics of Flow Field around Bubbles
The pressure variation of the flow field around the bubble in the free field is shown in Figure 7. In the external flow field with Pamb = 0.1 MPa (reference pressure), the pressure inside the bubble releases and promotes the bubble surface to expand rapidly. When the pressure inside the bubble drops rapidly to the reference pressure, the bubble volume continues to increase under the effect of inertia, and the pressure inside the bubble drops to below the surrounding flow field pressure. When t = 5 μs, the bubble expands to its maximum volume, and the internal pressure of the bubble drops to a minimum of about 0.2 times the reference pressure. Then, the bubble begins to collapse, and the pressure inside and outside the bubble is the same again. Inertia causes the bubble to continue to contract to the minimum volume, and the internal pressure of the bubble rises sharply to 5.5 times the reference pressure.
The pressure variation of the flow field around the near-wall bubble is shown in Figure 8. The initial pressure in the center of the bubble is high, pushing the surface of the bubble to expand rapidly outward. When t = 0.5 μs, due to the hindrance of the fluid movement, a high-pressure zone is formed in the flow field at the bottom of the bubble and above the wall, and its peak value is about six times the reference pressure. As the bubble continues to expand, the peak pressure decreases gradually until it disappears. When t = 6 μs, the pressure inside the bubble drops sharply due to the excessive expansion of the bubble, and when the pressure drops to 0.2 times the reference pressure, the bubble collapses and collapses rapidly. At t = 11 μs, a high-pressure zone appears again at the top when the bubble collapses, with a peak of about 1.16 times the reference pressure. This pressure peak rises continuously with bubble collapse and moves downward, promoting the development of the jet. At t = 13.75 μs, when the jet hits the bottom surface of the bubble, the peak pressure at the top of the bubble still exists and rises to five times the reference pressure.
The change in the flow field at the axis in the computational domain can systematically reflect the dynamic characteristics of the flow field. By comparing and analyzing the pressure and velocity changes in the flow field at the axis of the free field and near the wall, this paper studies the influence of bubble collapse on the whole computational domain.
The flow field pressure distribution under different conditions is shown in Figure 9a–d, where Figure 9a,b shows the flow field pressure distribution curves of the bubble expansion and collapse stages in the free field, and the pressure distribution is symmetrically distributed along the central axis, where the horizontal value of the pressure line indicates the internal pressure of the bubble. The pressure inside the bubble is released rapidly during the bubble expansion, and the pressure value of the flow field is greater than or equal to 0.1 MPa in the range of t = 0~1.5 μs. Then, in the range of t = 2.0~8.0 μs, the bubble expands to the maximum volume and then contracts, and the pressure of the flow field around the bubble first decreases and then increases, and the pressure of the flow field is less than or equal to 0.1 MPa. At t = 9 μs, the bubble begins to collapse, resulting in a sharp increase in the pressure of the flow field around the bubble, which makes the pressure of the whole flow field larger than the reference pressure again.
The flow field pressure distribution curves of the bubble expansion and collapse phases near the wall are shown in Figure 9c,d. The pressure inside the bubble is released rapidly during the bubble expansion process, and the pressure value of the flow field is greater than or equal to 0.1 MPa (reference pressure) in the range of t = 0~1.5 μs. Then, the bubble expands to the maximum volume and then contracts, and the pressure of the flow field around the bubble decreases at first and then increases. In the range of t = 2.0~11.0 μs, the overall pressure value of the flow field is less than or equal to 0.1 MPa. During the development phase of the jet (t = 12.25~13.75 s), the pressure of the flow field between the bubble and the wall gradually rises and produces large fluctuations.
By comparing and analyzing the pressure variation law at the central axis flow field of the free field and near the wall, the results show that the pressure variation trend of the flow field under the two conditions is the same, and the pressure value of the flow field at the center of the bubble is always in the extreme position of the flow field pressure. The main differences between the two are as follows: (1) Compared with the flow field pressure under the condition of free field, the pressure near the bubble center is no longer stable at the initial expansion stage and at the end of collapse but will fluctuate greatly. The flow field pressure near the wall is maintained below the reference pressure for a longer time during bubble pulsation; (2) the bubble near the wall is blocked by the wall when expanding, and the maximum pressure in the flow field at t = 0~1.5 μs range of the maximum pressure value in the flow field changes less.
The development of microjet also has a significant effect on the wall pressure. As shown in Figure 10, the wall pressure continues to increase since the formation of the jet at t = 12.25 μs. The pressure change on the wall mainly comes from the pressure wave generated by the collapse of the bubble. When t = 13.75 μs, the jet penetrates the bubble and impacts the solid wall, and the wall pressure rises to 0.5 MPa. After 0.25 μs, the bubbles rebounded and impacted the wall again. It can be seen from the figure that in the development stage of microjet, bubble collapse will continue to act on the wall with different impact forces, and this alternating stress is similar to “plastic hinge”, which may lead to wall fatigue failure and material fracture. In addition, the internal pressure of the bubble is released and condensed in the time scale of micro-nanosecond, which will also produce a great change in pressure on the wall.
The velocity distribution of the flow field under different conditions is shown in Figure 11a–d, where the velocity of the flow field under the free field condition is shown in Figure 11a,b, from which it can be seen that the velocity of the flow field evolves with time in a “saddle-shaped” distribution, and the peak of the curve represents the dimensionless velocity V* at the bubble radius, and the velocity of the flow field decreases with the increase in the bubble distance. The high-pressure release inside the bubble causes the surrounding fluid velocity to rise to 9 m/s at t = 1 μs. After that, due to the decrease in the pressure difference between inside and outside the bubble, the movement of the bubble boundary becomes less intense, so the velocity of the flow field around the bubble decreases gradually. When the bubble enters the compression stage, the motion of the bubble boundary becomes intense again, and the velocity of the peripheral flow field increases gradually. When t = 9 μs, the velocity of the flow field increases to the maximum value of 6.4 m/s.
The velocity distribution of the flow field near the wall is different from the free field. As in Figure 11c,d, during the expansion phase, the flow velocity between the bubble and the wall gradually decreases as the spatial position of the bubble decreases, and the velocity of the flow field near the upper boundary of the bubble is not affected, and the velocity rises to 9 m/s at t = 1.0 μs, which is the same as the maximum flow field velocity of the free field at the time of expansion. During the collapse of the bubble, the velocity of the flow field at the top of the bubble increases significantly, and at t = 12.25 μs, the velocity of the surrounding flow field is 21.5 m/s, which is much larger than the velocity of the free field flow field.
3. Control Strategy of Bubble Cleaning Technology
3.1. Influences of Driving Pressure
Under the conditions of dimensionless distance γ = 1.1 and initial radius Req = 18 μm, the changes in bubble shape, jet velocity, and wall impact load are studied when the driving pressure Pd is between 0.1 to 1 MPa. Figure 12a,b shows the variation of the radius and profile of the bubble when the bubble collapses under different driving pressure Pd, respectively. The results show that the time for the bubble to collapse to the minimum radius is 3.2 μs when Pd = 0.1 MPa, while the bubble collapse time to the minimum radius is 1 μs at Pd = 1 MPa. With the increase in driving pressure, the bubble collapse velocity increases, and the collapse period decreases. Moreover, at γ = 1.1, the bubble profiles are the same for different driving pressures Pd acting on the bubble collapse, and the equivalent radius Req is 13.4 μm, which is consistent with the phenomenon observed by Hasio [28]. This shows that changing the initial driving pressure does not affect the shape of the end of the bubble collapse under the same γ condition.
Figure 13a shows the influence of the change in driving pressure on the jet velocity. The red point is the jet velocity when the bubble collapses. When Pd = 0.1 MPa, the maximum jet velocity is 5 m/s, while when Pd = 1 MPa, the maximum jet velocity is 75 m/s. With the increase in driving pressure, the jet velocity increases gradually. The maximum jet velocity at this scale is in the same order of magnitude as the experimental measurements of Brujan [29]. The correlation between different driving pressure values in the range of 0.1 to 1 MPa and the maximum jet velocity is studied. The results show that the jet velocity increases with the increase in the square root of the driving pressure Pd. In this case, the jet velocity can be approximately as follows:
Under the action of driving pressure, the strong jet continues to develop and push forward and finally hits the solid wall at a relatively high impact velocity. Figure 13b shows the pressure change in the center of the solid wall when the bubble collapses under different driving pressures. At Pd = 0.1 MPa, the pulsating pressure value at the center of the solid wall is 0.15 MPa, while at Pd = 1 MPa, the pulsating pressure value at the center of the solid wall is 43.62 MPa. As the driving pressure increases, the value of the pulsating pressure at the center of the solid wall increases, and the period of the peak pressure decreases.
There is a correlation between the driving pressure and the wall impact load during bubble collapse. Chahine studied the relationship between driving pressure and wall impact load during the collapse of millimeter-sized bubbles (Req = 2 mm). The correlation is of great significance for predicting the impact pressure caused by bubble collapse on the wall. In order to predict the relationship between driving pressure and wall impact load during bubble collapse in smaller scale, this paper further studies the relationship between driving pressure and wall impact load during bubble collapse on a micron scale (Req = 18 μm) based on the Chahine derivation method.
Figure 14 shows the relationship between the jet velocity and the peak pressure on the wall, in which the blue curve is the maximum peak impact pressure obtained by calculating the bubble with a radius of 2 mm by the mixing method, and the red curve is the fitting curve of the jet velocity and the corresponding wall pressure in Table 1. The figure confirms the traditional view that the pressure caused by bubble collapse is proportional to the impact pressure of the water hammer, and the following formula can be used to estimate the impact pressure caused by bubble jet impact with a radius of 18 μm.
For higher collapse driving pressure, the impact efficiency will be greater than 0.25. Based on the relationship between the collapse driving pressure, the wall impact pressure, and the maximum jet velocity, the correlation between the driving pressure Pd and the wall impact load Pwh for bubble collapse with a radius of 18 μm is obtained by combining Formulas (10) and (11).
3.2. Influences of Liquid Temperature
The shrinkage characteristics and the impact characteristics of bubbles on the wall after the collapse of bubbles in aqueous solution from 0 °C to 60 °C are studied under the driving pressure Pd = 0.1 MPa and γ = 1.5. The change in temperature leads to a change in liquid viscosity and surface tension, which, in turn, affects the bubble behavior [30]. Table 2 shows the values of viscosity coefficient and surface tension coefficients of water from 0 °C to 60 °C. The viscosity is very sensitive to temperature. When the temperature is near the freezing point, the viscosity coefficient is as high as 1.8 mPa·s. When the temperature increases to 60 °C, the viscosity coefficient decreases to 0.474 mPa·s.
Figure 15 shows the bubble radius and bubble wall velocity at different temperatures. The influence of different temperatures on the bubble radius is shown in Figure 15a. With the increase in temperature, the radius of the bubble decreases when it collapses and increases when it rebounds. When the liquid temperature is 0, 10, 20, 30, 40, 50, and 60 °C, the maximum radius of bubble rebound is 17.48, 17.65, 17.67, 17.68, 17.84, and 17.85 μm, respectively. Figure 15b shows the bubble wall velocity at different temperatures. With the increase in liquid temperature, the bubble wall velocity increases slightly, mainly because the increase in liquid temperature increases the motion of gas molecules, which in turn aggravates the collapse velocity of the bubble wall.
The pressures at the center of the bubble action wall at different temperatures are shown in Figure 16. It can be seen from the figure that the increase in temperature does not have a significant effect on the first pulsating pressure amplitude generated at the wall of bubble collapse action. When the bubble passes through several pulsating cycles, the change in liquid surface tension and viscosity caused by the change in liquid temperature has a significant effect on the bubble. When the liquid temperature is 0 °C (t = 30.6 μs), the bubble collapse impact pressure on the wall is 178 KPa, while when the liquid temperature is 60 °C (t = 31 μs), the pulse pressure on the wall is 213 KPa. With the increase in the liquid temperature, the pulse pressure on the wall increases, which is mainly due to the decrease in the liquid viscosity and the increase in the phase transition rate on the bubble surface and the bubble shrinks sharply and produces a high-speed jet, which forms a higher impact pressure on the wall.
Changing the liquid temperature in the same medium will have an effect on the liquid surface tension and liquid viscosity, in which the great change in the surface tension has little effect on the first bubble collapse [31]. Therefore, the effect of temperature change on the bubble dynamics is mainly achieved by changing the viscosity of the liquid. In order to explain the effect of viscosity on bubble dynamics and wall impact load, the collapse of cavitation bubble with initial radius R0 = 18 μm under liquid viscosity μ (0.00314, 0.00595, 0.02052, 0.067, and 0.110 Pa·s) is studied under the driving pressure of Pd = 0.1 MPa. The viscous liquid parameters used in the simulation are shown in Table 3. All viscous values are made of colorless and transparent distilled water and glycerol (DG) in different proportions.
Figure 17 shows the bubble radius and bubble wall velocity under different liquid viscosity. The change in bubble radius under different liquid viscosity conditions is shown in Figure 17a. It can be seen from the figure that liquid viscosity has a significant effect on the minimum shrinkage radius of bubbles. In 20%, 40%, 60%, 80%, and 100% DG solutions, its radius is 8.91, 10.11, 10.44, 12.59, and 13.19 μm, respectively. With the increase in liquid viscosity, the minimum radius of bubble contraction increases. Figure 17b shows the bubble wall velocity at different liquid viscosities. In a 20% DG solution, the bubble wall velocity is 7 m/s, while in a 100% DG solution, the bubble wall velocity is 2 m/s. With the increase in liquid viscosity, the collapse rate of the bubble wall decreases, and the time required for the bubble to contract to the minimum volume is prolonged. Overall, a more viscous liquid decreases the collapse rate of the bubble walls and increases the minimum shrinkage volume of the bubbles.
The pressure variation at the center of the solid wall during the collapse of bubbles in different viscous solutions at γ = 1.5 and the driving pressure Pd = 0.1 MPa is shown in Figure 18. As the γ is small, the first collapse of the bubble has the greatest impact on the wall. Therefore, this paper will only discuss the effect of the first bubble collapse. In 20%, 40%, 60%, 80%, and 100% DG solutions, the maximum pressure values of the first bubble collapse wall Pmax are 317.74, 312.08, 288.31, 233.87, and 200.71 KPa, respectively. With the increase in liquid viscosity, the pressure of bubble collapse impact wall decreases in varying degrees. In addition, the time t for bubble collapse to impact the wall is 4.45, 4.48, 4.51, 4.64, and 4.72 μs in 20%, 40%, 60%, 80%, and 100% DG solutions, respectively, indicating that the greater the viscosity of the liquid, the longer the period for bubble collapse to impact the wall.
Overall, the change in liquid temperature affects the bubble behavior by changing the viscosity and surface tension of the liquid, in which the change in viscosity has a more significant effect on the wall load. At a collapse driving pressure of Pd = 0.1 MPa and a wall dimensionless distance γ = 1.5, the maximum pressure value of the first collapse of the bubble affecting the wall increases from 200.71 to 317.74 KPa when the liquid viscosity decreases from 0.110 to 0.00314 Pa·s. The viscosity of the liquid has an important effect on the impact strength of the bubble on the wall after collapse. Under the condition of the same dimensionless distance of the wall, with the increase in liquid viscosity, the impact duration of bubble collapse on the wall increases obviously, while the impact strength decreases significantly.
3.3. Influences of the Number of Bubbles
The dynamic behavior of bubbles around the solid boundary is strongly affected by the initial radius and interval distance of each bubble. Because the size of the bubble is different, the distance between the bubble and the bubble cannot be given accurately. Therefore, the potential physical mechanism of bubble collapse is still little known [32,33], which is worthy of further study. In this paper, the collapse process of different numbers of bubbles is studied, the influence of the number of bubbles on the bubble collapse process and the central pressure of the solid wall is analyzed, and then the bubble–bubble coupling effect in the multi-bubble collapse system is studied.
In order to explore the effect of the change in bubble number on bubble collapse behavior, this section places different numbers of equal diameter (Rmax = 18 μm) bubbles equidistant (S = 2 Rma) around the bubbles near the center of the wall. The arrangement of bubbles is shown in Figure 19. The number of bubbles around the central bubble near the wall varies from N = 2 to 8. At the initial time, the distance between the bubble of the wall near the center and the wall h is 36 μm, the internal pressure of all bubbles is 2345 Pa, and the pressure at the boundary of the calculated region is 100,000 Pa.
- (a)
- Analysis of the collapse process of different numbers of bubbles
Figure 20 shows the shape of bubbles in all working conditions when the first pressure pulse is produced on the wall of the bubble collapse under different bubble numbers.
It can be seen from the figure that the bubble collapse undergoes the stratification phenomenon, collapsing from top to bottom step by step, and the volume of the bubble collapsing decreases step by step, with the bubble near the center of the wall having the smallest volume. When N = 2, 3, 4, and 8 bubbles are placed near the center of the wall, the time t for the bubble collapse to form a pressure pulse on the wall for the first time is 5.6, 5.9, 6.3, and 7.5 μs, respectively. With the increase in the number of surrounding bubbles, the bubble collapse period near the center of the wall is prolonged.
The influence of the change in the number of surrounding bubbles on the pressure of the bubble in the center of the near wall is shown in Figure 21. With the increase in the number of bubbles, the pressure of the central bubble increases gradually, and the pressure at the central bubble mainly depends on the number of bubbles arranged vertically around it (such as Ⅴ-2, Ⅴ-3). The more the number of bubbles arranged vertically, the greater the internal pressure of the central bubble, while the number of bubbles arranged horizontally has little effect on the pressure of the central bubble, which mainly affects the pressure distribution of bubble collapse on the wall. For example, the pressure of the central bubble near the wall is 320 KPa under V-1 and V-2 conditions. In addition, when different numbers of bubbles are symmetrically distributed along the central axis (Ⅴ-2, Ⅴ-3, Ⅴ-4), the velocity streamline in the flow field has the same trend. Taking the surrounding bubble N = 8 (Ⅴ-4) as an example, the peripheral bubbles first collapse to form a jet, the direction of the bubble jet at the central axis is perpendicular to the wall, and the jet direction of the bubbles on both sides of the axis hits the wall at a certain angle, and the bubbles are closer to the wall. The smaller the inclination between the jet and the wall. For the multi-bubbles (Ⅴ-1) asymmetrically distributed in the flow field, the direction of the bubble jet on the central axis is no longer vertically pointing toward the wall.
Figure 22 shows the change in pressure in the center of the wall when the surrounding bubbles are different (N = 2, N = 3, N = 4, N = 8). When the number of bubbles around the central bubble N = 2, 4, 8, the peak pressure at the center of the wall increases with the increase in the number of surrounding bubbles, while at N = 3, the wall pressure decreases significantly, which indicates that with the increase in the number of bubbles, the wall pressure does not simply increase proportionally, but may also be affected by the bubble distribution to show the effect of mutual inhibition. In addition, the response time of the peak wall pressure is prolonged as the number of bubbles increases.
- (b)
- Analysis of the collapse process of the bubble group
The study uses a rectangular bubble cluster of nine bubbles as the original model of the bubble cloud and analyzes the collapse process of the bubble cluster. The working condition parameters of the cluster are set as shown in Table 4, and the study is divided into two parts: Under condition VI, when γ = 2, the collapse process of the bubble cluster under different bubble spacing is studied. Under condition Ⅶ, when S = 0.5 Rmax, the collapse process of bubble cluster under different wall dimensionless distance γ is studied.
The interaction between bubbles at different working conditions when the bubble cluster collapse action produces the first pressure pulse on the wall is shown in Figure 23. Under the working condition VI, as the bubble spacing decreases, the stronger the restriction between bubbles, the more significant the bubble shape change. When S = 0.5 Rmax, the bubbles at the central axis are strongly affected by the surrounding bubbles, and most of the bubbles are “ellipsoidal”. Under condition Ⅶ, for the rectangular bubble cluster with regular distribution, the shape change in bubble collapse follows the following law: When γ is the same, the collapse shape of the bubbles on both sides of the axis is similar to that of the two bubbles distributed horizontally, while the collapse of the bubbles on the central axis is the same as the shape evolution of the two bubbles distributed vertically, indicating that the interaction mechanism between the bubbles follows the collapse mechanism of the two bubbles.
The pulse pressure applied on the wall in the bubble cluster is analyzed. As shown in Figure 24, the wall impact pressure is affected by bubble-wall distance and bubble-bubble distance. Under condition VI, the pulse pressure of the bubble cluster collapse on the wall increases with the increase in bubble spacing. When S = 2 Rmax, the maximum pressure acting on the wall is 400 KPa. In working condition Ⅶ, the pressure acting on the wall increases as γ decreases, and the maximum pulse pressure formed is 450 KPa when the bubble cluster is very close to the solid wall. By comparing working condition VI and working condition VII, it is found that reducing the bubble-wall distance and increasing the bubble-bubble spacing can enhance the pulse pressure on the wall by bubble cluster collapse, and the bubble-wall distance plays a more important role in forming a larger surface pulse pressure. In addition, the change in bubble spacing also has a significant effect on the energy release of bubble cluster. In engineering, changing the distance between bubbles (for example, reasonably adjusting the distance between bubbles through external acoustic interference or increasing the bubble spacing by reducing the bubble size) can also effectively control the pulse pressure of the bubble to the wall.
3.4. Influences of Bubble Distribution
In Section 3.4, it is found that the asymmetry of bubble distribution has a significant influence on the flow field and bubble dynamics. In order to clarify the influence of multi-bubble arrangement on bubble collapse, four different bubble distribution conditions are set under the same number of bubbles. As shown in Figure 25, the adjacent bubbles are arranged on a horizontal or vertical wall. The distance between bubbles S and the distance between bubble center and wall h are set to 2 Rmax (Rmax = 18 μm).
The flow field pressure and velocity streamline under different bubble distributions are shown in Figure 26. The more surrounding bubbles are concentrated near the solid wall (such as Ⅷ-1), the more significant the inhibitory effect on the central bubble is, and the smaller the wall pressure caused by bubble collapse is. When the surrounding bubbles are concentrated in the upper part of the central bubble (such as Ⅷ-4), the upper bubble collapses first, and the resulting pressure will increase the collapse pressure of the central bubble and accelerate the collapse process of the bubble, thus causing greater pulse pressure on the wall. In addition, when the number of bubbles concentrated in the upper part of the central bubble is the same (such as Ⅷ-2, Ⅷ-3), the distribution of the upper bubble will also have an effect on the central bubble. In the vertical distribution of bubbles in VIII-3, the pressure inside the central bubble increased by 40 KPa compared with the horizontal distribution of bubbles in VIII-2. On the whole, the action mechanism of multi-bubble distribution still follows the law of two bubbles, and its distribution has a significant impact on the pressure of the flow field and the direction of the velocity streamline.
The pulse pressure of the bubble collapse on the center of the wall under different bubble distributions is shown in Figure 27. The more bubbles concentrated in the upper part of the central bubble (such as Ⅷ-4), the greater the pressure on the bubble collapse wall, and the value of the pressure depends on the upper bubble arrangement, such as Ⅷ-2 and Ⅷ-3. When the number of bubbles in the upper part of the central bubble is the same, the pressure values of horizontal arrangement and vertical arrangement are 360 and 400 KPa, respectively. The principle of action follows the double bubble criterion, i.e., vertical arrangement of bubbles can enhance the pressure acting on the wall and the collapse of surrounding bubbles.
4. Conclusions
In this paper, the dynamic characteristics of bubbles and their flow field during cleaning are studied quantitatively by numerical simulation method, and the effects of driving pressure, temperature, bubble number, and bubble distribution on bubble collapse and cleaning pressure are further studied. From the point of view of micro-dynamics, the mechanism of bubble collapse is explored, the main factors regulating bubble collapse behavior are determined, and a stable and efficient bubble regulation strategy is proposed. It was found that the collapse time of the bubble near the wall is longer than that in the free field, the dynamic characteristics of the flow field around the bubble in the free field show a symmetrical distribution, and the fluid motion near the wall is blocked by the wall. The characteristics of the flow field between the bubble and the wall become irregular. The change in pressure leads to the alternating impact of “plastic hinge” on the wall, which is beneficial for the removal of pollutants. Driving pressure is the main factor affecting bubble collapse and wall pulsating pressure change, larger wall pressure can better achieve bubble regulation to meet the actual engineering needs. The temperature has a significant effect on the wall load, and the increase in temperature will lead to a decrease in liquid viscosity and an increase in the peak pressure between the bubble and the wall. Compared with the bubble size and bubble distribution, the impact of increasing the number of bubbles on the wall is more significant. In practical engineering applications, the air intake and pressure of the bubble generator can usually be enhanced to increase the number of microbubbles and collapse impact force and then improve the cleaning efficiency.
Author Contributions
Conceptualization, C.L. and F.W.; Methodology, B.L. and H.G.; Software, H.Z.; Formal analysis, H.Z.; Resources, C.L. and H.G.; Data curation, C.L.; Writing—original draft, B.L. and H.Z.; Writing—review & editing, H.G. and F.W.; Project administration, F.W.; Funding acquisition, B.L. All authors have read and agreed to the published version of the manuscript.
Funding
This work was financially supported by Shandong province government (Grant No. 01010410118) through the project “Higher educational young innovative talent introduction and cultivation team—Intelligent transportation team of offshore products”.
Conflicts of Interest
The authors declare no conflict of interest.
References
- Bo-han, Z.; Xiao, X.; Qiang, Y. Effect of bubble size on cleaning of oil and particles on solid surface. Chin. J. Environ. Eng. 2021, 15, 375–382. [Google Scholar]
- Sarasua Miranda, J.A.; Ruiz-Rubio, L.; Aranzabe Basterrechea, E.; Vilas-Vilela, J.L. Non-Immersion Ultrasonic Cleaning: An Efficient Green Process for Large Surfaces with Low Water Consumption. Processes 2021, 9, 585. [Google Scholar] [CrossRef]
- Ohl, C.-D.; Arora, M.; Dijkink, R.; Janve, V.; Lohse, D. Surface cleaning from laser-induced cavitation bubbles. Appl. Phys. Lett. 2006, 89, 074102. [Google Scholar] [CrossRef]
- Zevnik, J.; Dular, M. Liposome destruction by a collapsing cavitation microbubble: A numerical study. Ultrason. Sonochem. 2021, 78, 105706. [Google Scholar] [CrossRef] [PubMed]
- Kim, H.; Sun, X.; Koo, B.; Yoon, J.Y. Experimental Investigation of Sludge Treatment Using a Rotor-Stator Type Hydrodynamic Cavitation Reactor and an Ultrasonic Bath. Processes 2019, 7, 790. [Google Scholar] [CrossRef]
- Chahine, G.L.; Kapahi, A.; Choi, J.K.; Hsiao, C.T. Modeling of surface cleaning by cavitation bubble dynamics and collapse. Ultrason. Sonochem. 2016, 29, 528–549. [Google Scholar] [CrossRef] [PubMed]
- Tian, Z.L.; Liu, Y.L.; Zhang, A.M.; Tao, L.; Chen, L. Jet development and impact load of underwater explosion bubble on solid wall. Appl. Ocean Res. 2020, 95, 102013. [Google Scholar] [CrossRef]
- Hsiao, C.T.; Choi, J.K.; Singh, S.; Chahine, G.L.; Hay, T.A.; Ilinskii, Y.A. Modelling single- and tandem-bubble dynamics between two parallel plates for biomedical applications. J. Fluid Mech. 2013, 716, 137–170. [Google Scholar] [CrossRef]
- Miyamoto, M.; Ueyama, S.; Hinomoto, N.; Saitoh, T.; Maekawa, S.; Hirotsuji, J. Degreasing of Solid Surfaces by Microbubble Cleaning. Jpn. J. Appl. Phys. 2014, 46, 1236–1243. [Google Scholar] [CrossRef]
- Agarwal, A.; Liu, Y. Enhanced microbubbles assisted cleaning of diesel contaminated sand. Mar. Pollut. Bull. 2017, 124, 331–335. [Google Scholar] [CrossRef]
- Huang, Z.; Chen, Q.; Yao, Y.; Chen, Z.; Zhou, J. Micro-bubbles enhanced removal of diesel oil from the contaminated soil in washing/flushing with surfactant and additives. J. Environ. Manag. 2021, 290, 112570. [Google Scholar] [CrossRef]
- Lee, J.W.; Kim, H.W.; Sohn, J.I.; Yoon, G.S. A study on microbubbles influence on human skin cleaning. Adv. Sci. Lett. 2013, 19, 2558–2562. [Google Scholar] [CrossRef]
- Agarwal, A.; Ng, W.J.; Liu, Y. Cleaning of biologically fouled membranes with self-collapsing microbubbles. Biofouling 2013, 29, 69–76. [Google Scholar] [CrossRef] [PubMed]
- Han, S.; Li, Y.; Zhu, H. The similarities and differences between the bubble collapse near a solid wall and in free water. Eur. J. Mech. B-Fluids 2020, 84, 553–561. [Google Scholar] [CrossRef]
- Rayleigh, L. On the pressure developed in a liquid during the collapse of a spherical cavity. Phil. Mag. 1917, 34, 94–98. [Google Scholar] [CrossRef]
- Plesset, M.S.; Prosperetti, A. Bubble dynamics and cavitation. Annu. Rev. Fluid. Mech. 1977, 9, 145–185. [Google Scholar] [CrossRef]
- Poritsky, H. The collapse or growth of a spherical bubble or cavity in a viscous fluid. J. Appl. Mech.-T Asme. 1951, 18, 332–333. [Google Scholar]
- Yakubov, S.; Maquil, T.; Rung, T. Experience using pressure-based CFD methods for Euler–Euler simulations of cavitating flows. Comput. Fluids. 2015, 111, 91–104. [Google Scholar] [CrossRef]
- Saurel, R.; Lemetayer, O. A multiphase model for compressible flows with interfaces, shocks, detonation waves and cavitation. J. Fluid. Mech. 2001, 431, 239–271. [Google Scholar] [CrossRef]
- Ce, G.; Xi-Jing, Z.; Jian-Qing, W.; Lin-Zheng, Y. Velocity analysis for collapsing cavitation bubble near a rigid wall under an ultrasound field. Acta Phys. Sin.-Chin. Ed. 2016, 65, 184–191. [Google Scholar]
- Dular, M.; Požar, T.; Zevnik, J. High speed observation of damage created by a collapse of a single cavitation bubble. Wear 2018, 418, 418–419. [Google Scholar] [CrossRef]
- Kadivar, E.; el Moctar, O.; Skoda, R.; Löschner, U. Experimental study of the control of cavitation-induced erosion created by collapse of single bubbles using a micro structured riblet. Wear 2021, 486, 204087. [Google Scholar] [CrossRef]
- Andrews, E.D.; Rivas, D.F.; Peters, I.R. Cavity collapse near slot geometries. J. Fluid. Mech. 2020, 901, A29. [Google Scholar] [CrossRef]
- Xia, D.; Sun, C.; Liu, Y.; Zhang, H. Numerical simulation of micrometer-sized bubble collapse near a rigid boundary. Tribology 2018, 38, 711–720. (In Chinese) [Google Scholar]
- Zevnik, J.; Dular, M. Cavitation bubble interaction with a rigid spherical particle on a microscale. Ultrason. Sonochem. 2020, 69, 105252. [Google Scholar] [CrossRef] [PubMed]
- Doinikov, A.A.; Zhao, S.; Dayton, P.A. Modeling of the acoustic response from contrast agent microbubbles near a rigid wall. Ultrasonics 2009, 49, 195–201. [Google Scholar] [CrossRef] [PubMed]
- Han, L.; Zhang, M.; Huang, G.; Huang, B. Energy transformation mechanism of a gas bubble collapse in the free-field. Chin. J. Theor. Appl. Mech. 2021, 53, 1288–1301. [Google Scholar]
- Hsiao, C.-T.; Jayaprakash, A.; Kapahi, A.; Choi, J.-K.; Chahine, G.L. Modelling of material pitting from cavitation bubble collapse. J. Fluid. Mech. 2014, 755, 142–175. [Google Scholar] [CrossRef]
- Brujan, E.-A.; Noda, T.; Ishigami, A.; Ogasawara, T.; Takahira, H. Dynamics of laser-induced cavitation bubbles near two perpendicular rigid walls. J. Fluid. Mech. 2018, 841, 28–49. [Google Scholar] [CrossRef]
- Zhang, H.; Ren, X.; Luo, C.; Tong, Y.; Larson, E.A.; Lu, Z.; Gu, J. Study on transient characteristics and influencing of temperature on cavitation bubbles in various environments. Optik 2019, 187, 25–33. [Google Scholar] [CrossRef]
- Luo, J.; Xu, W.; Zhai, Y.; Zhang, Q. Experimental study on the mesoscale causes of the influence of viscosity on material erosion in a cavitation field. Ultrason. Sonochem. 2019, 59, 104699. [Google Scholar] [CrossRef] [PubMed]
- Zhang, L.; Zhang, J.; Deng, J. Numerical investigation on the collapse of a bubble cluster near a solid wall. Phys. Rev. E 2019, 99, 043108. [Google Scholar] [CrossRef] [PubMed]
- Lu, J.; Wang, T.; Li, L.; Yin, Z.; Wang, R.; Fan, X.; Tan, D. Dynamic Characteristics and Wall Effects of Bubble Bursting in Gas-Liquid-Solid Three-Phase Particle Flow. Processes 2020, 8, 760. [Google Scholar] [CrossRef]
Figure 1.
Calculation model and initial conditions.
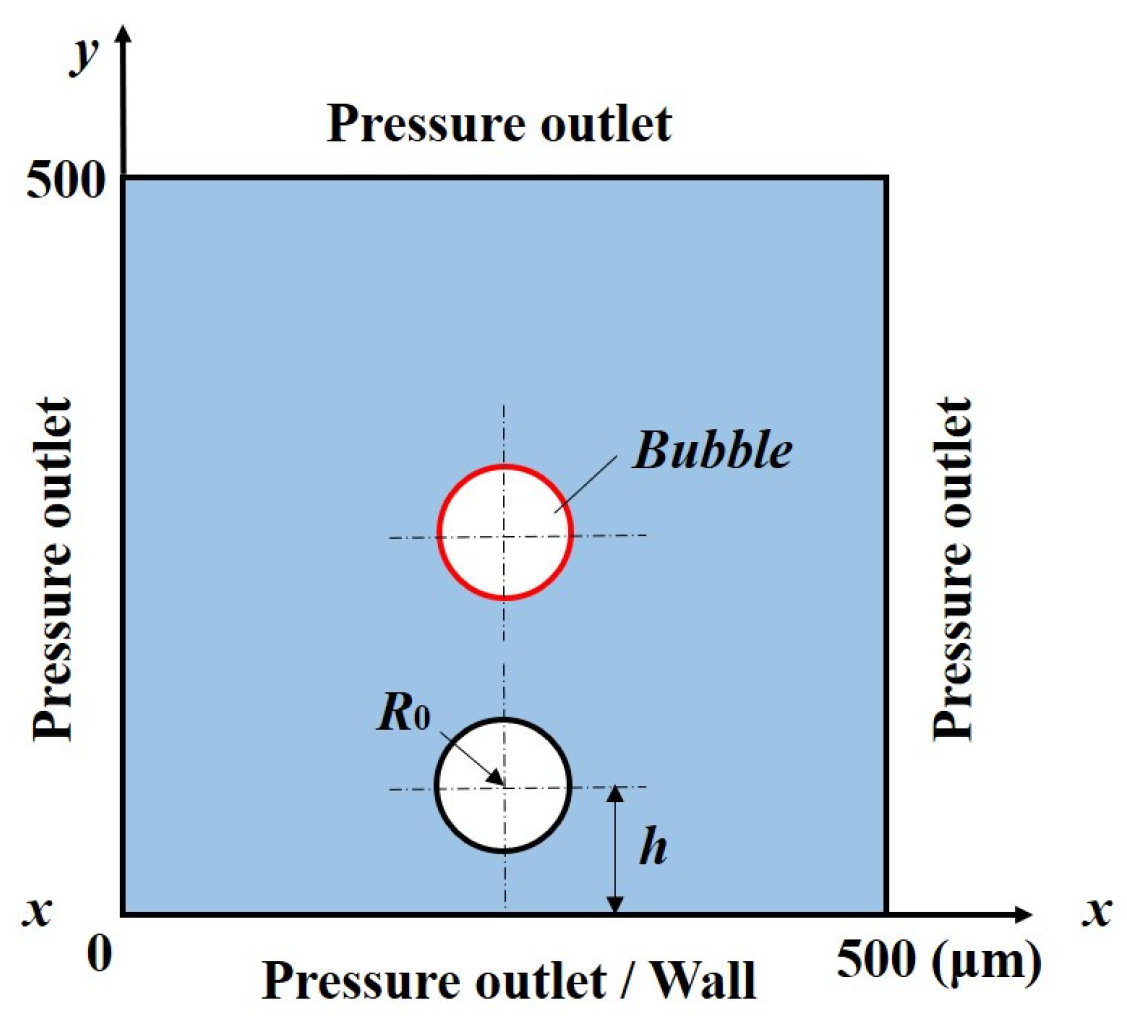
Figure 2.
Grid-independent verification.

Figure 3.
Numerical simulation of bubble radius variation compared with the solution of the Doinikov equation.
Figure 3.
Numerical simulation of bubble radius variation compared with the solution of the Doinikov equation.
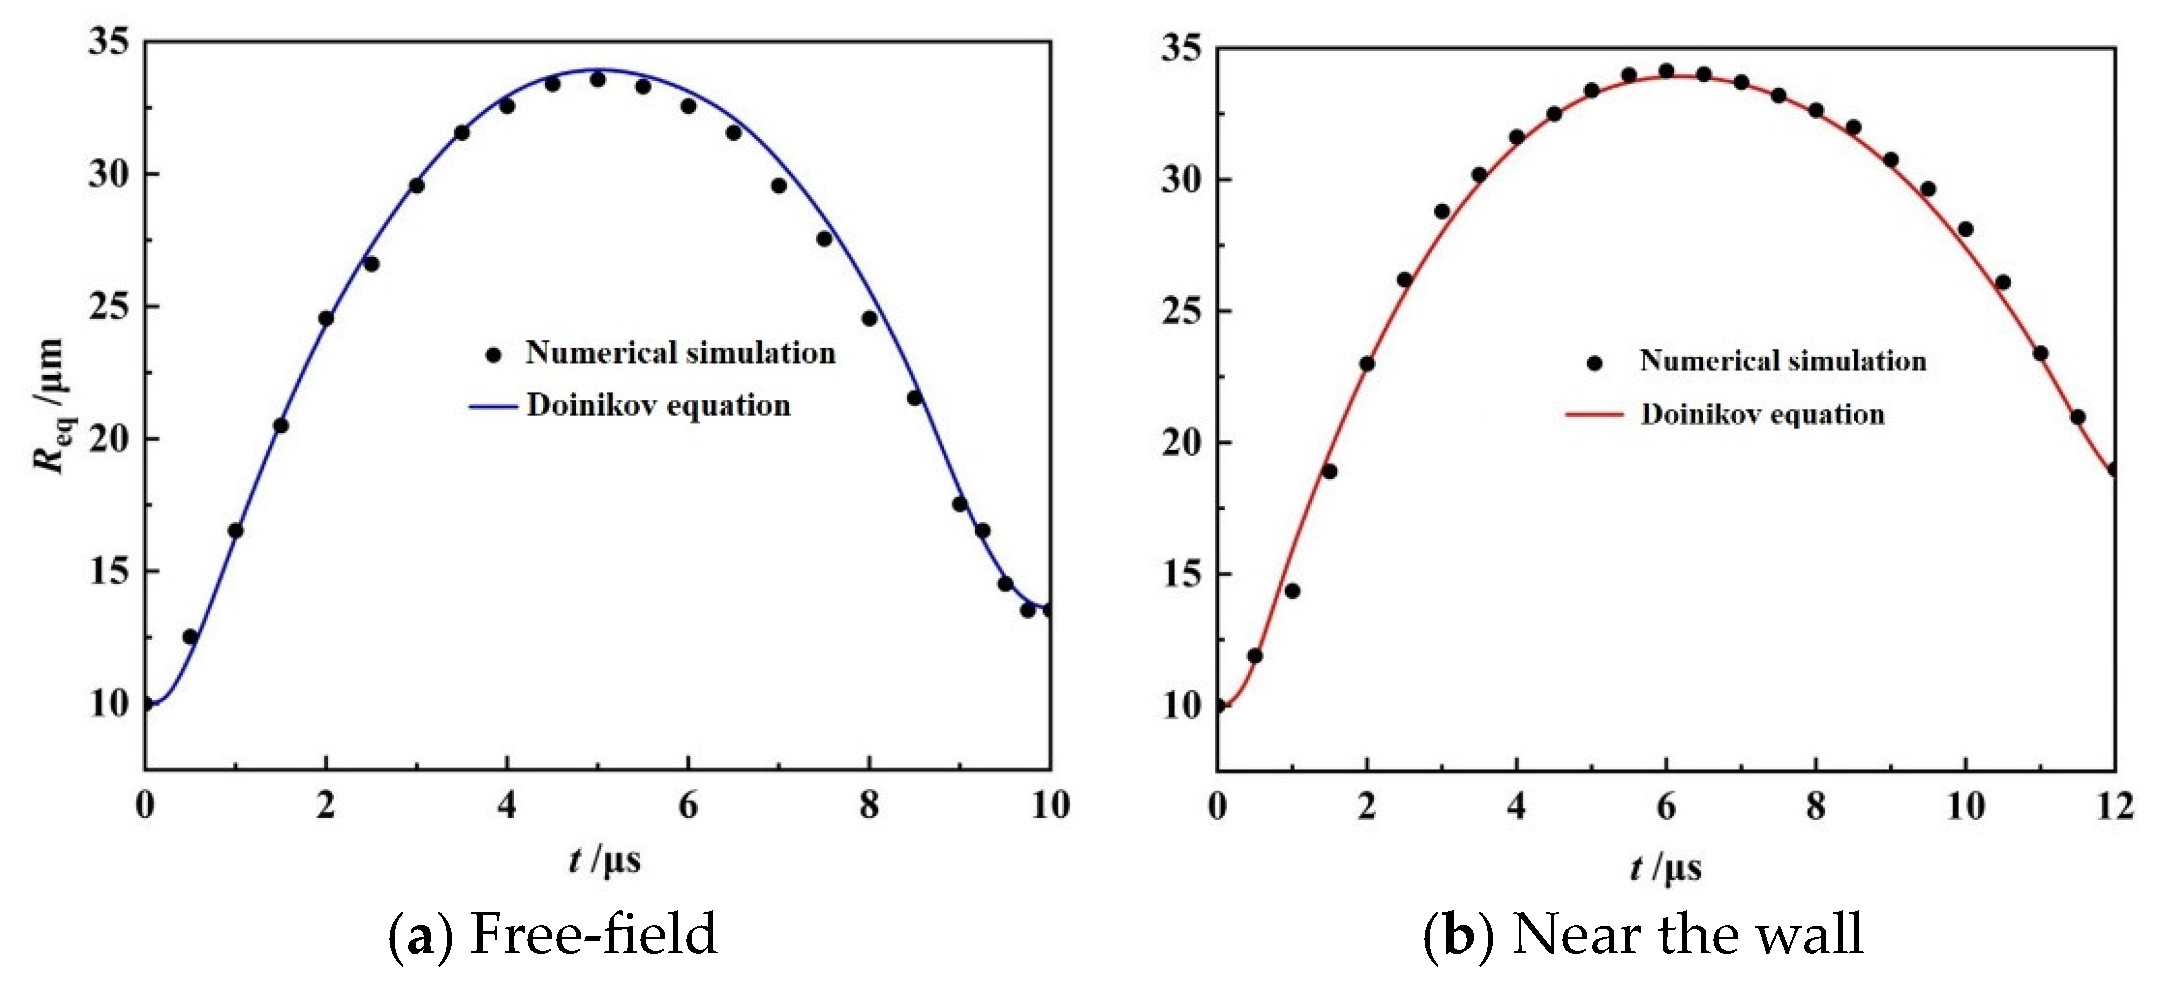
Figure 4.
Evolution of bubble shape (a,b) and its center-of-mass position (c,d).
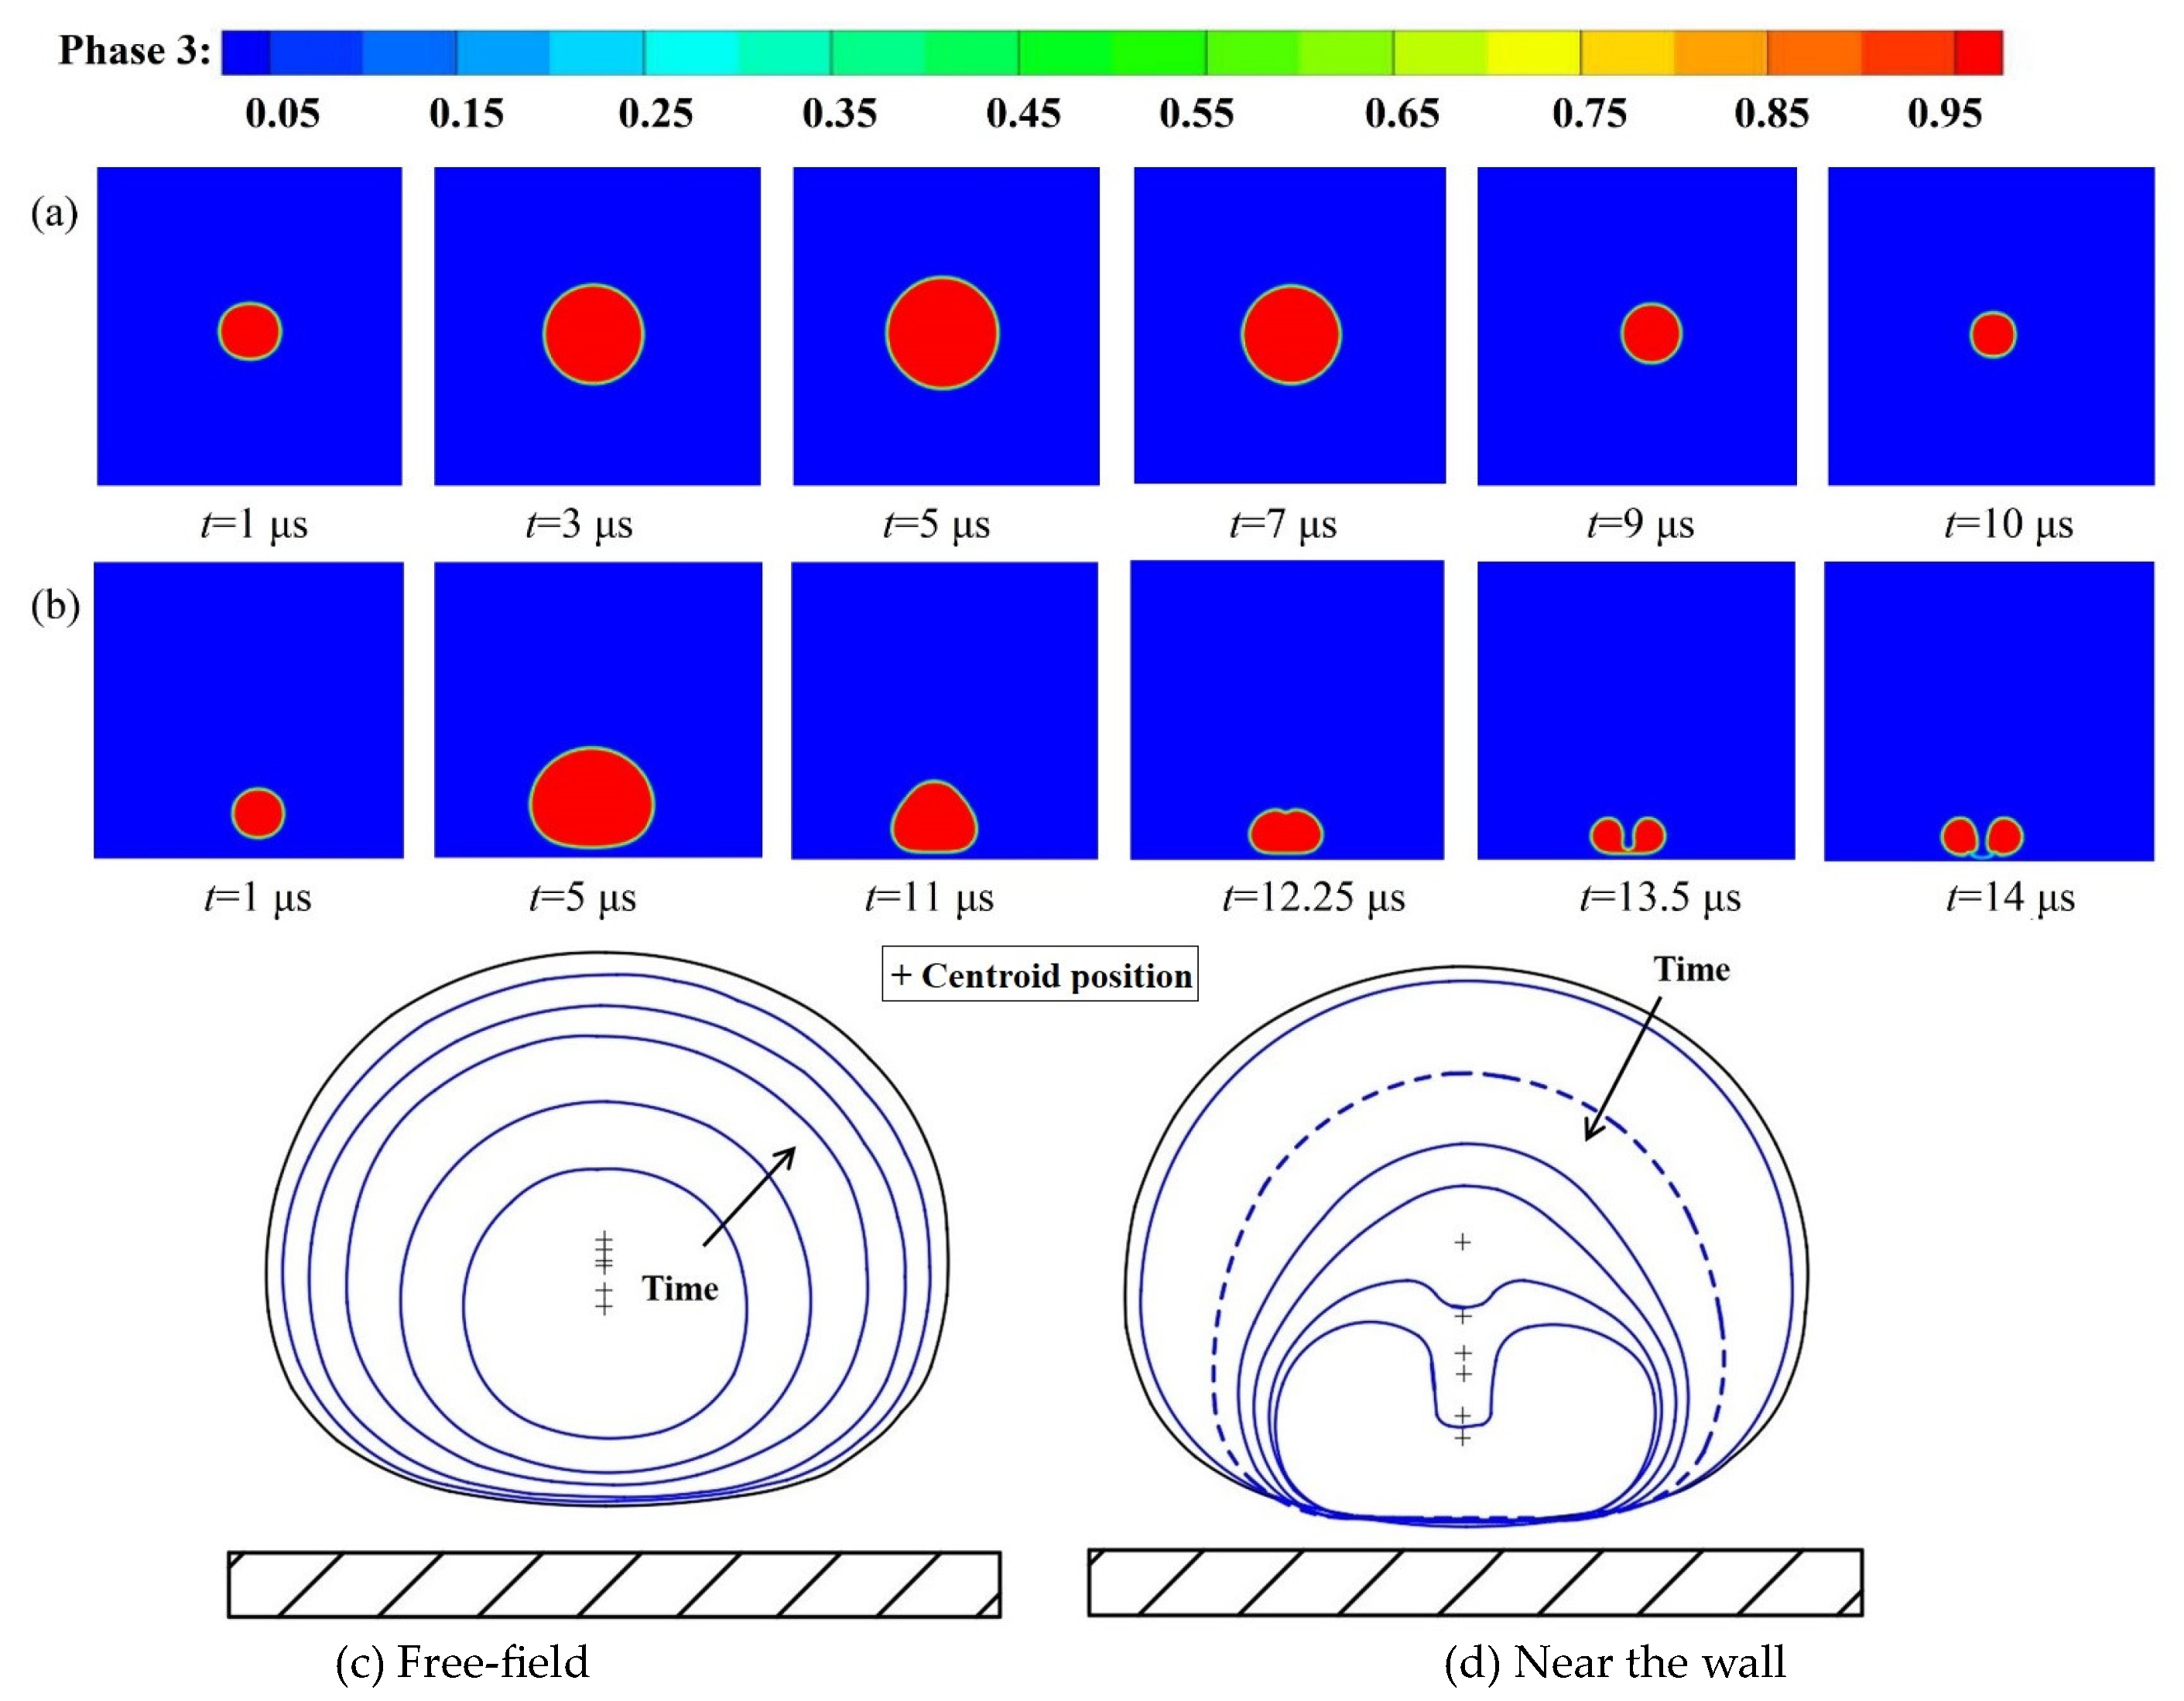
Figure 5.
Variation curves of radius, velocity, and acceleration of bubble expansion and collapse.
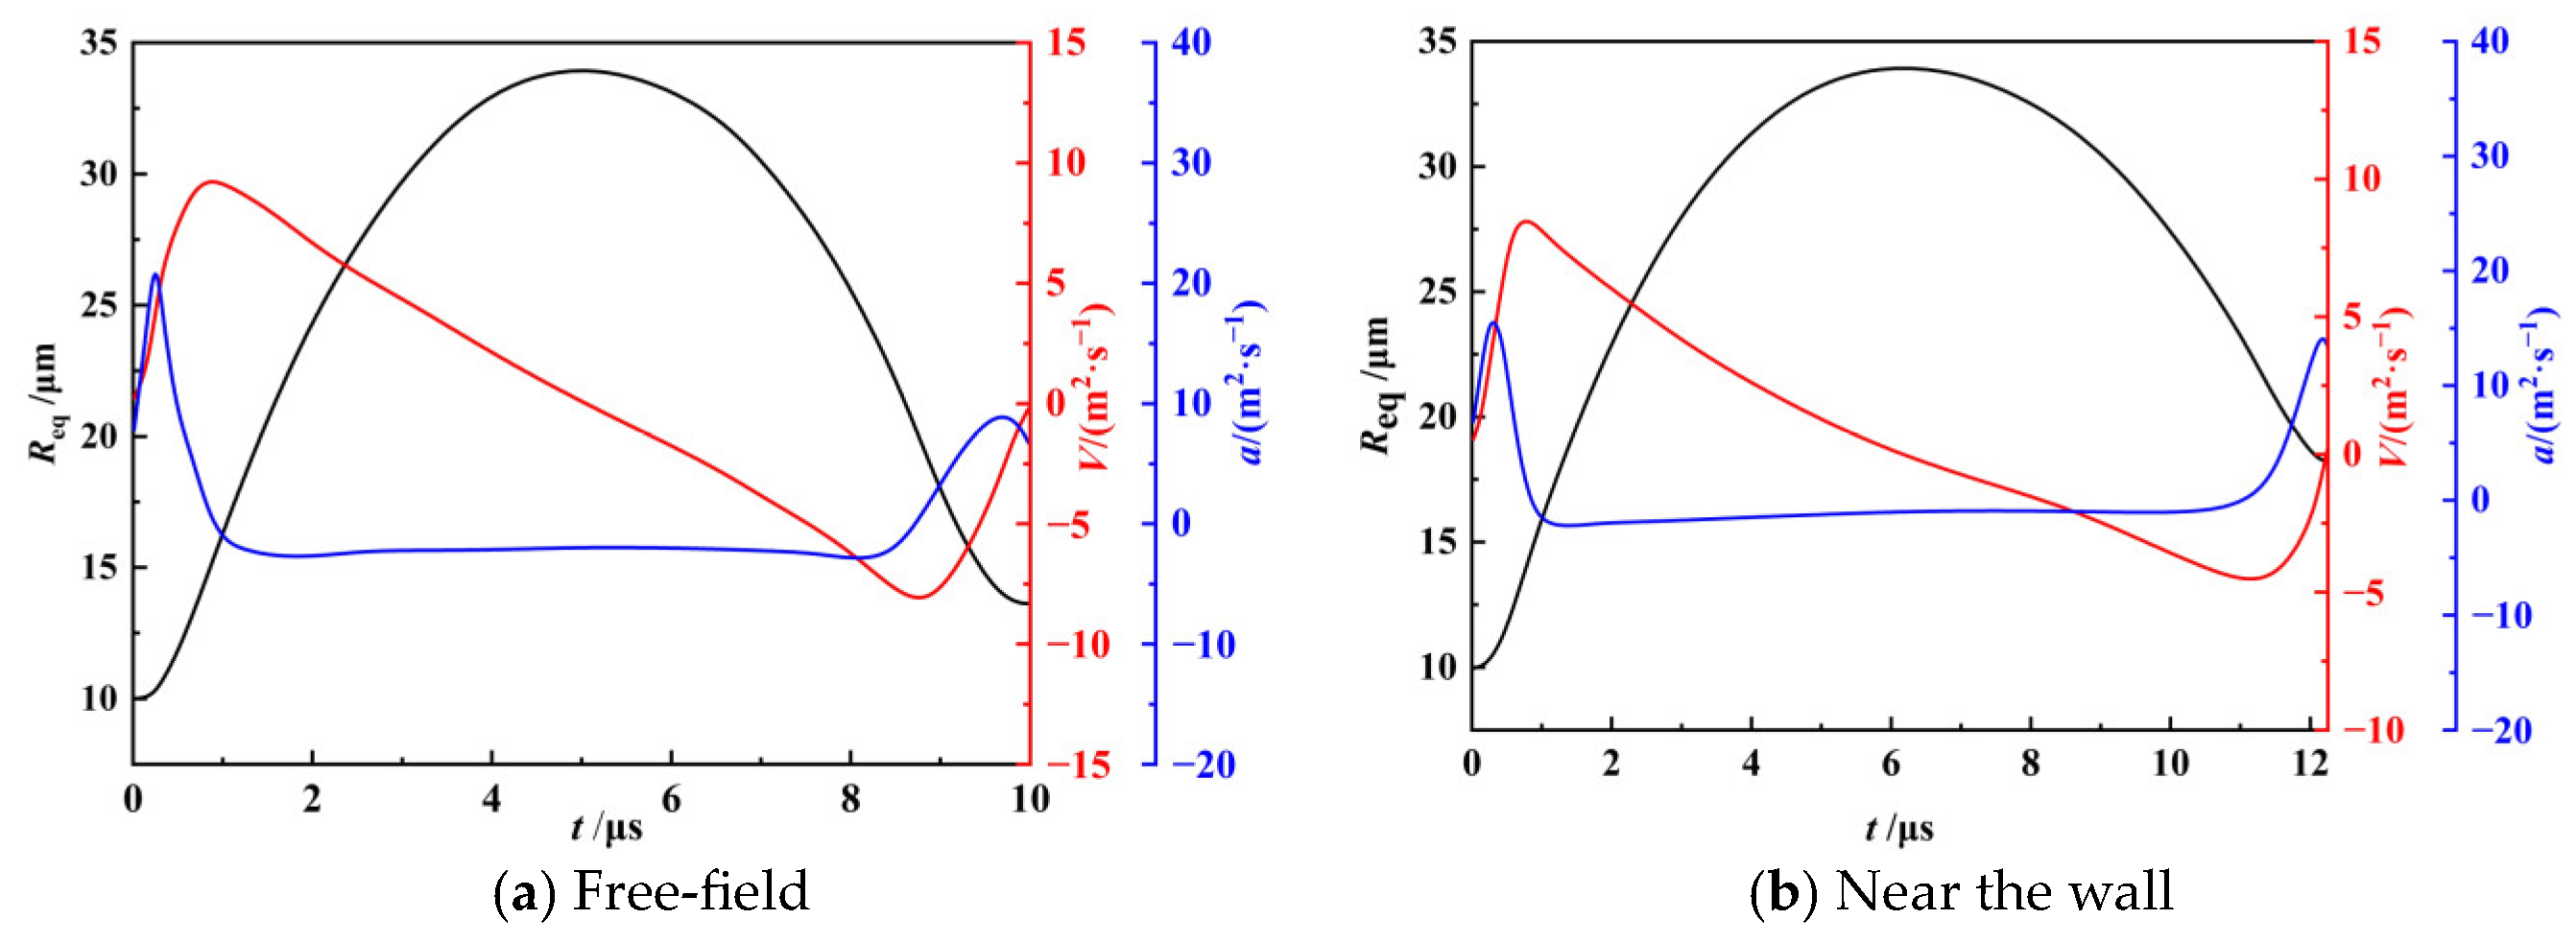
Figure 6.
Boundary velocity variation during bubble collapse at the near wall.

Figure 7.
Pressure variation clouds of the bubble and surrounding flow field: free field.
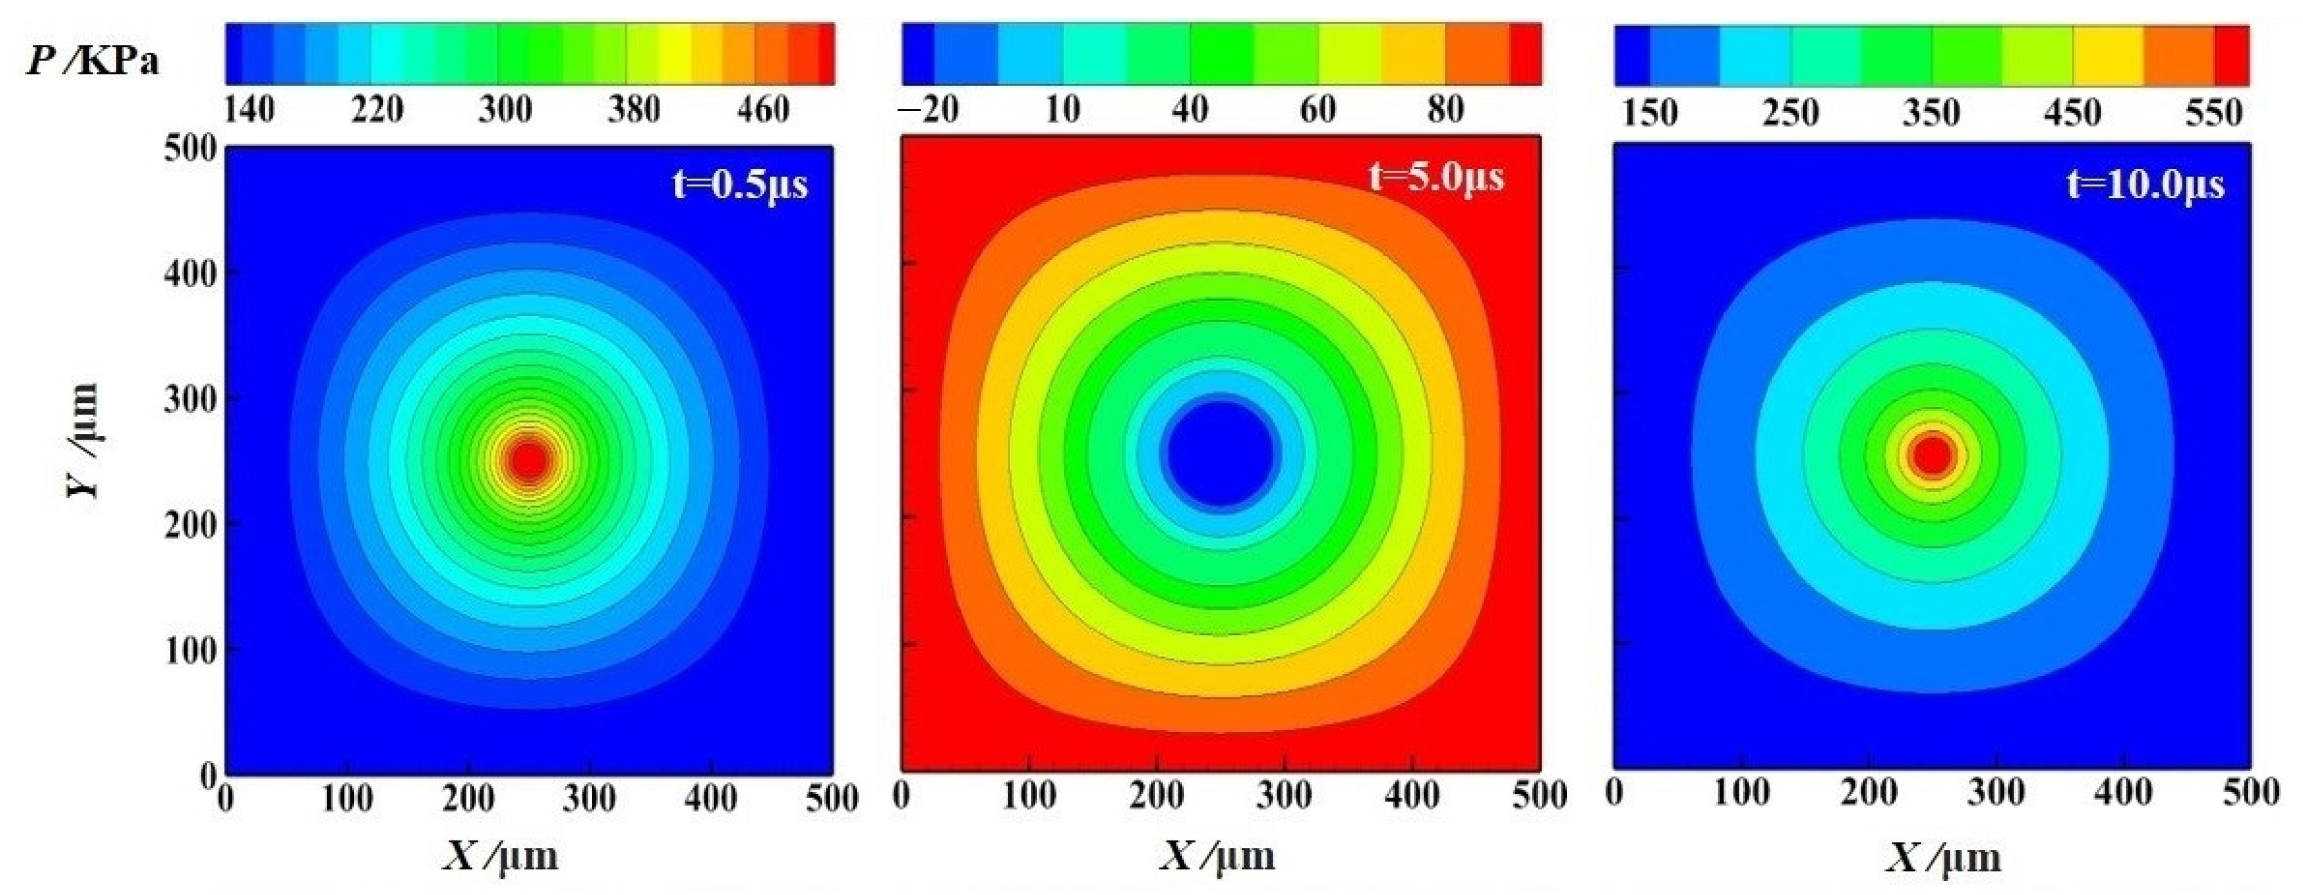
Figure 8.
Pressure variation clouds of the bubble and surrounding flow field: near wall.
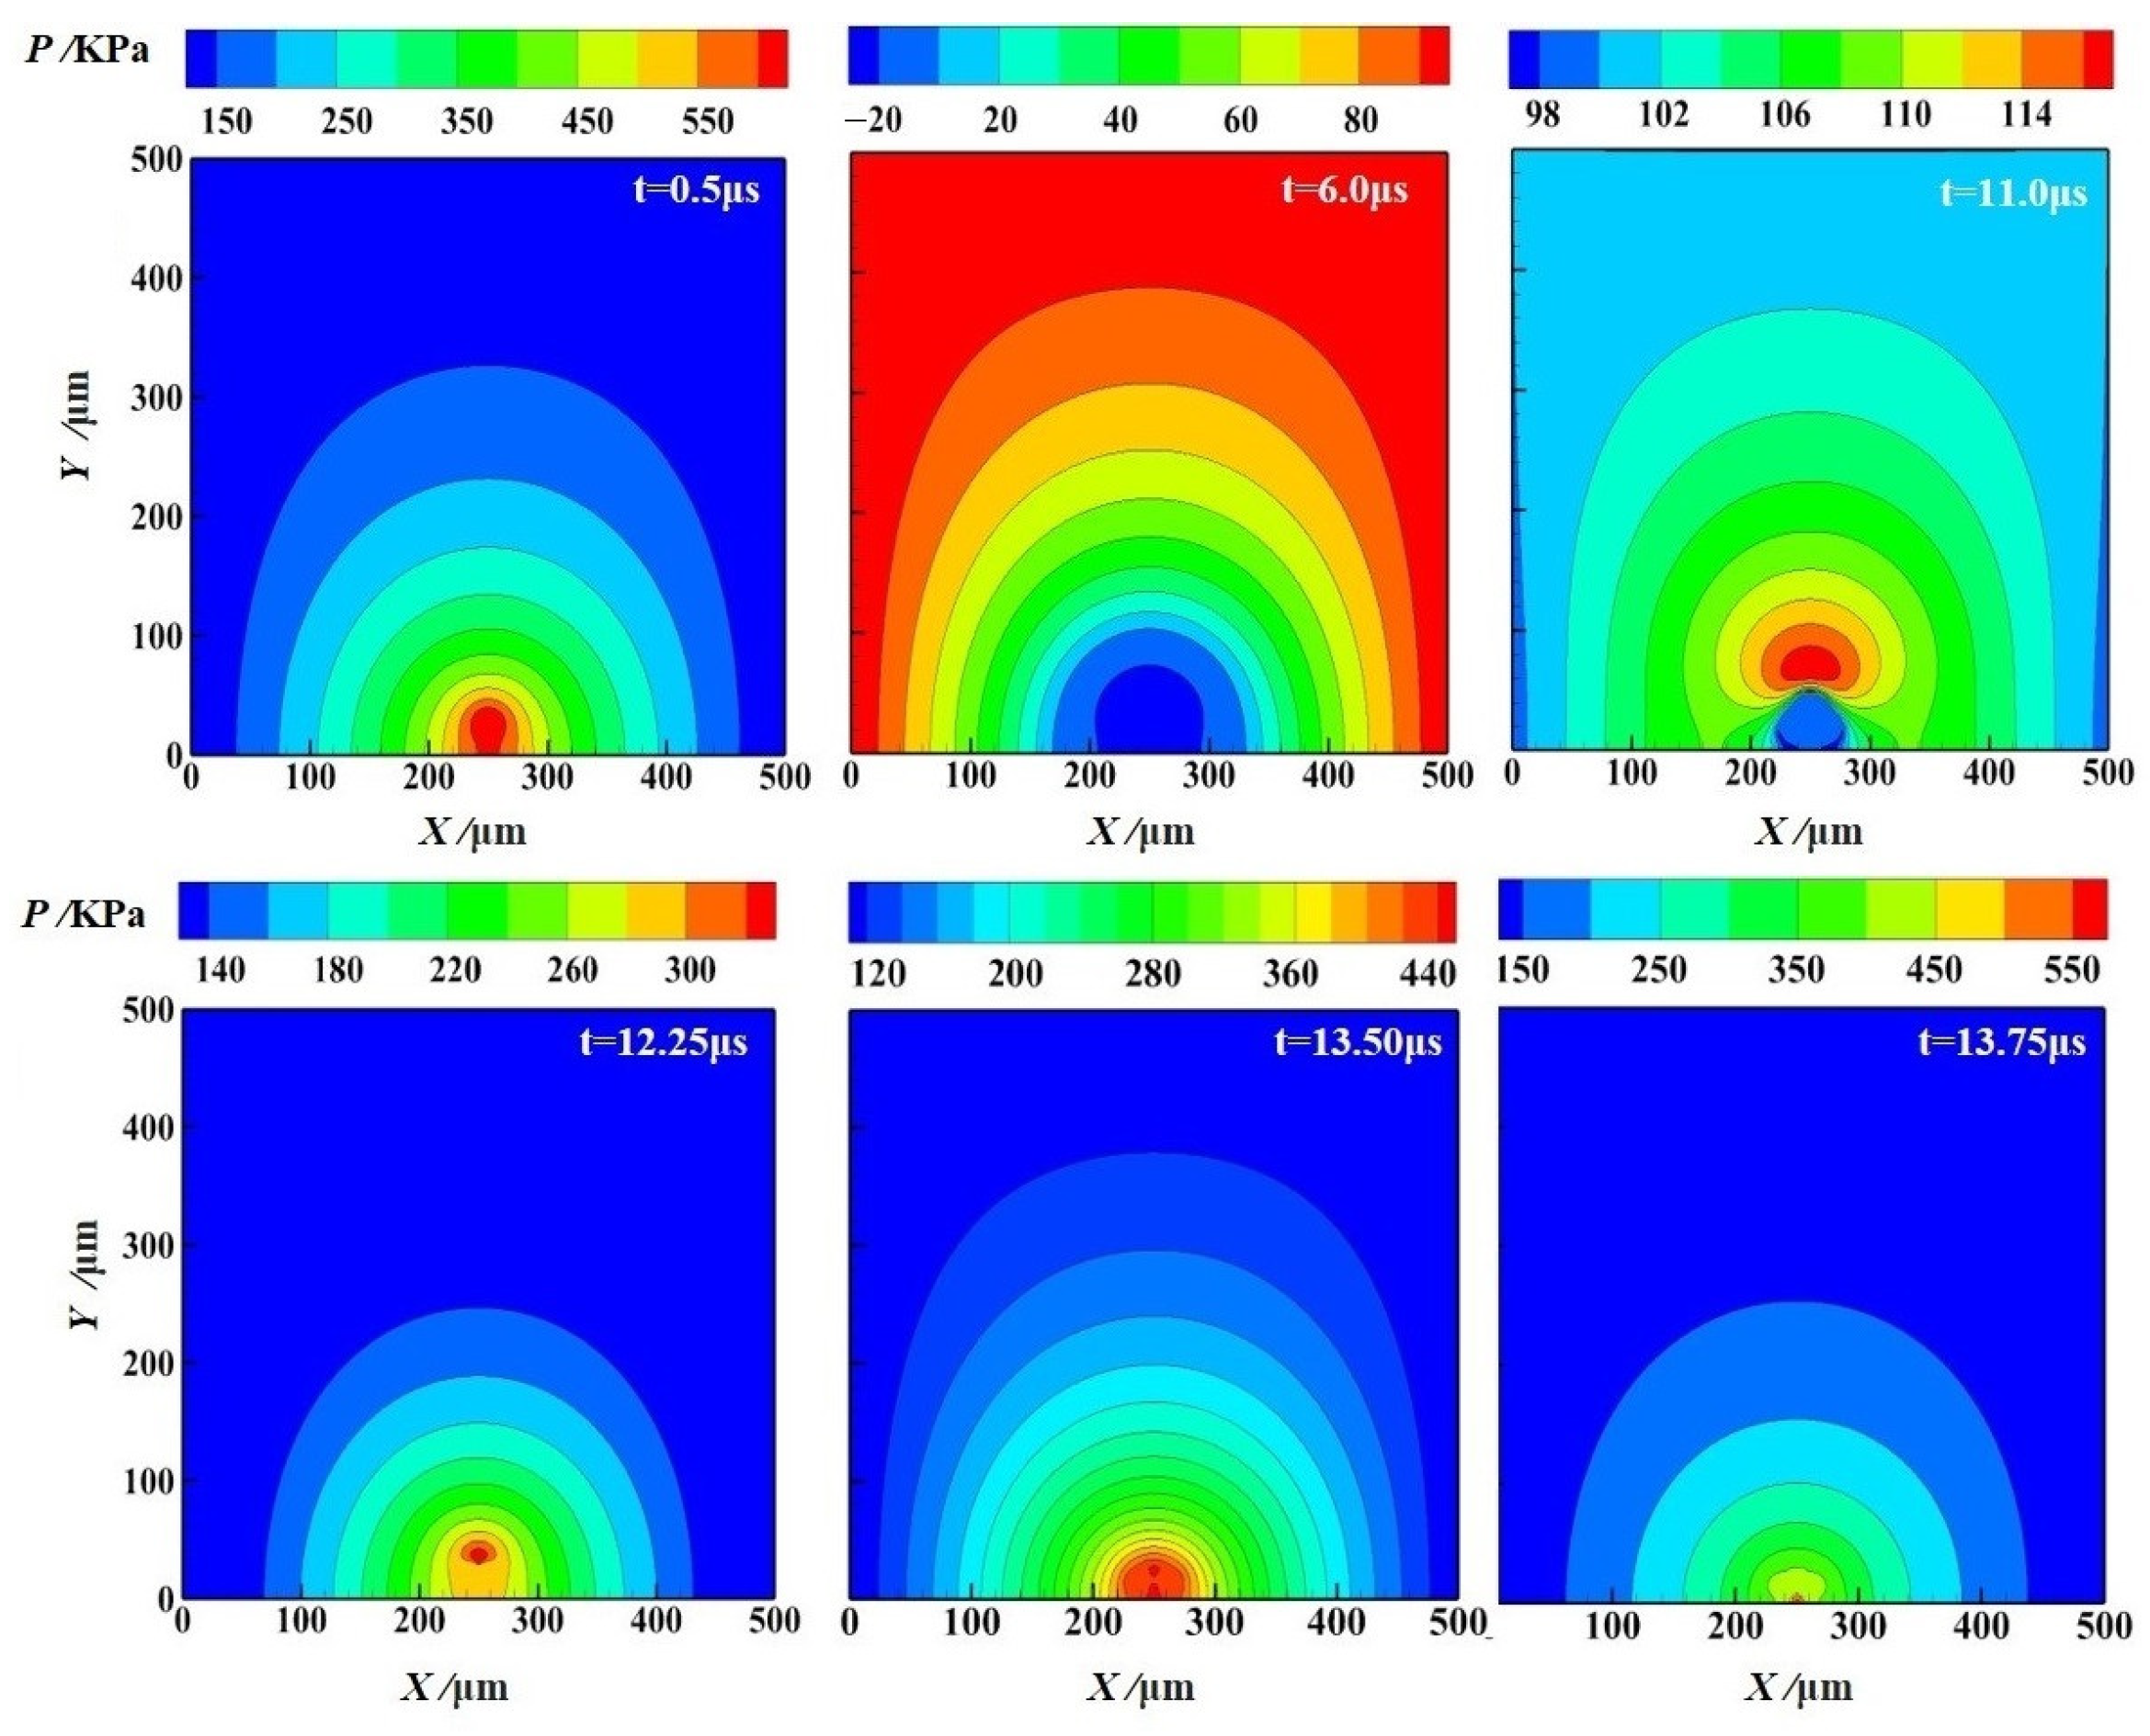
Figure 9.
Pressure distribution of flow field at different stages.
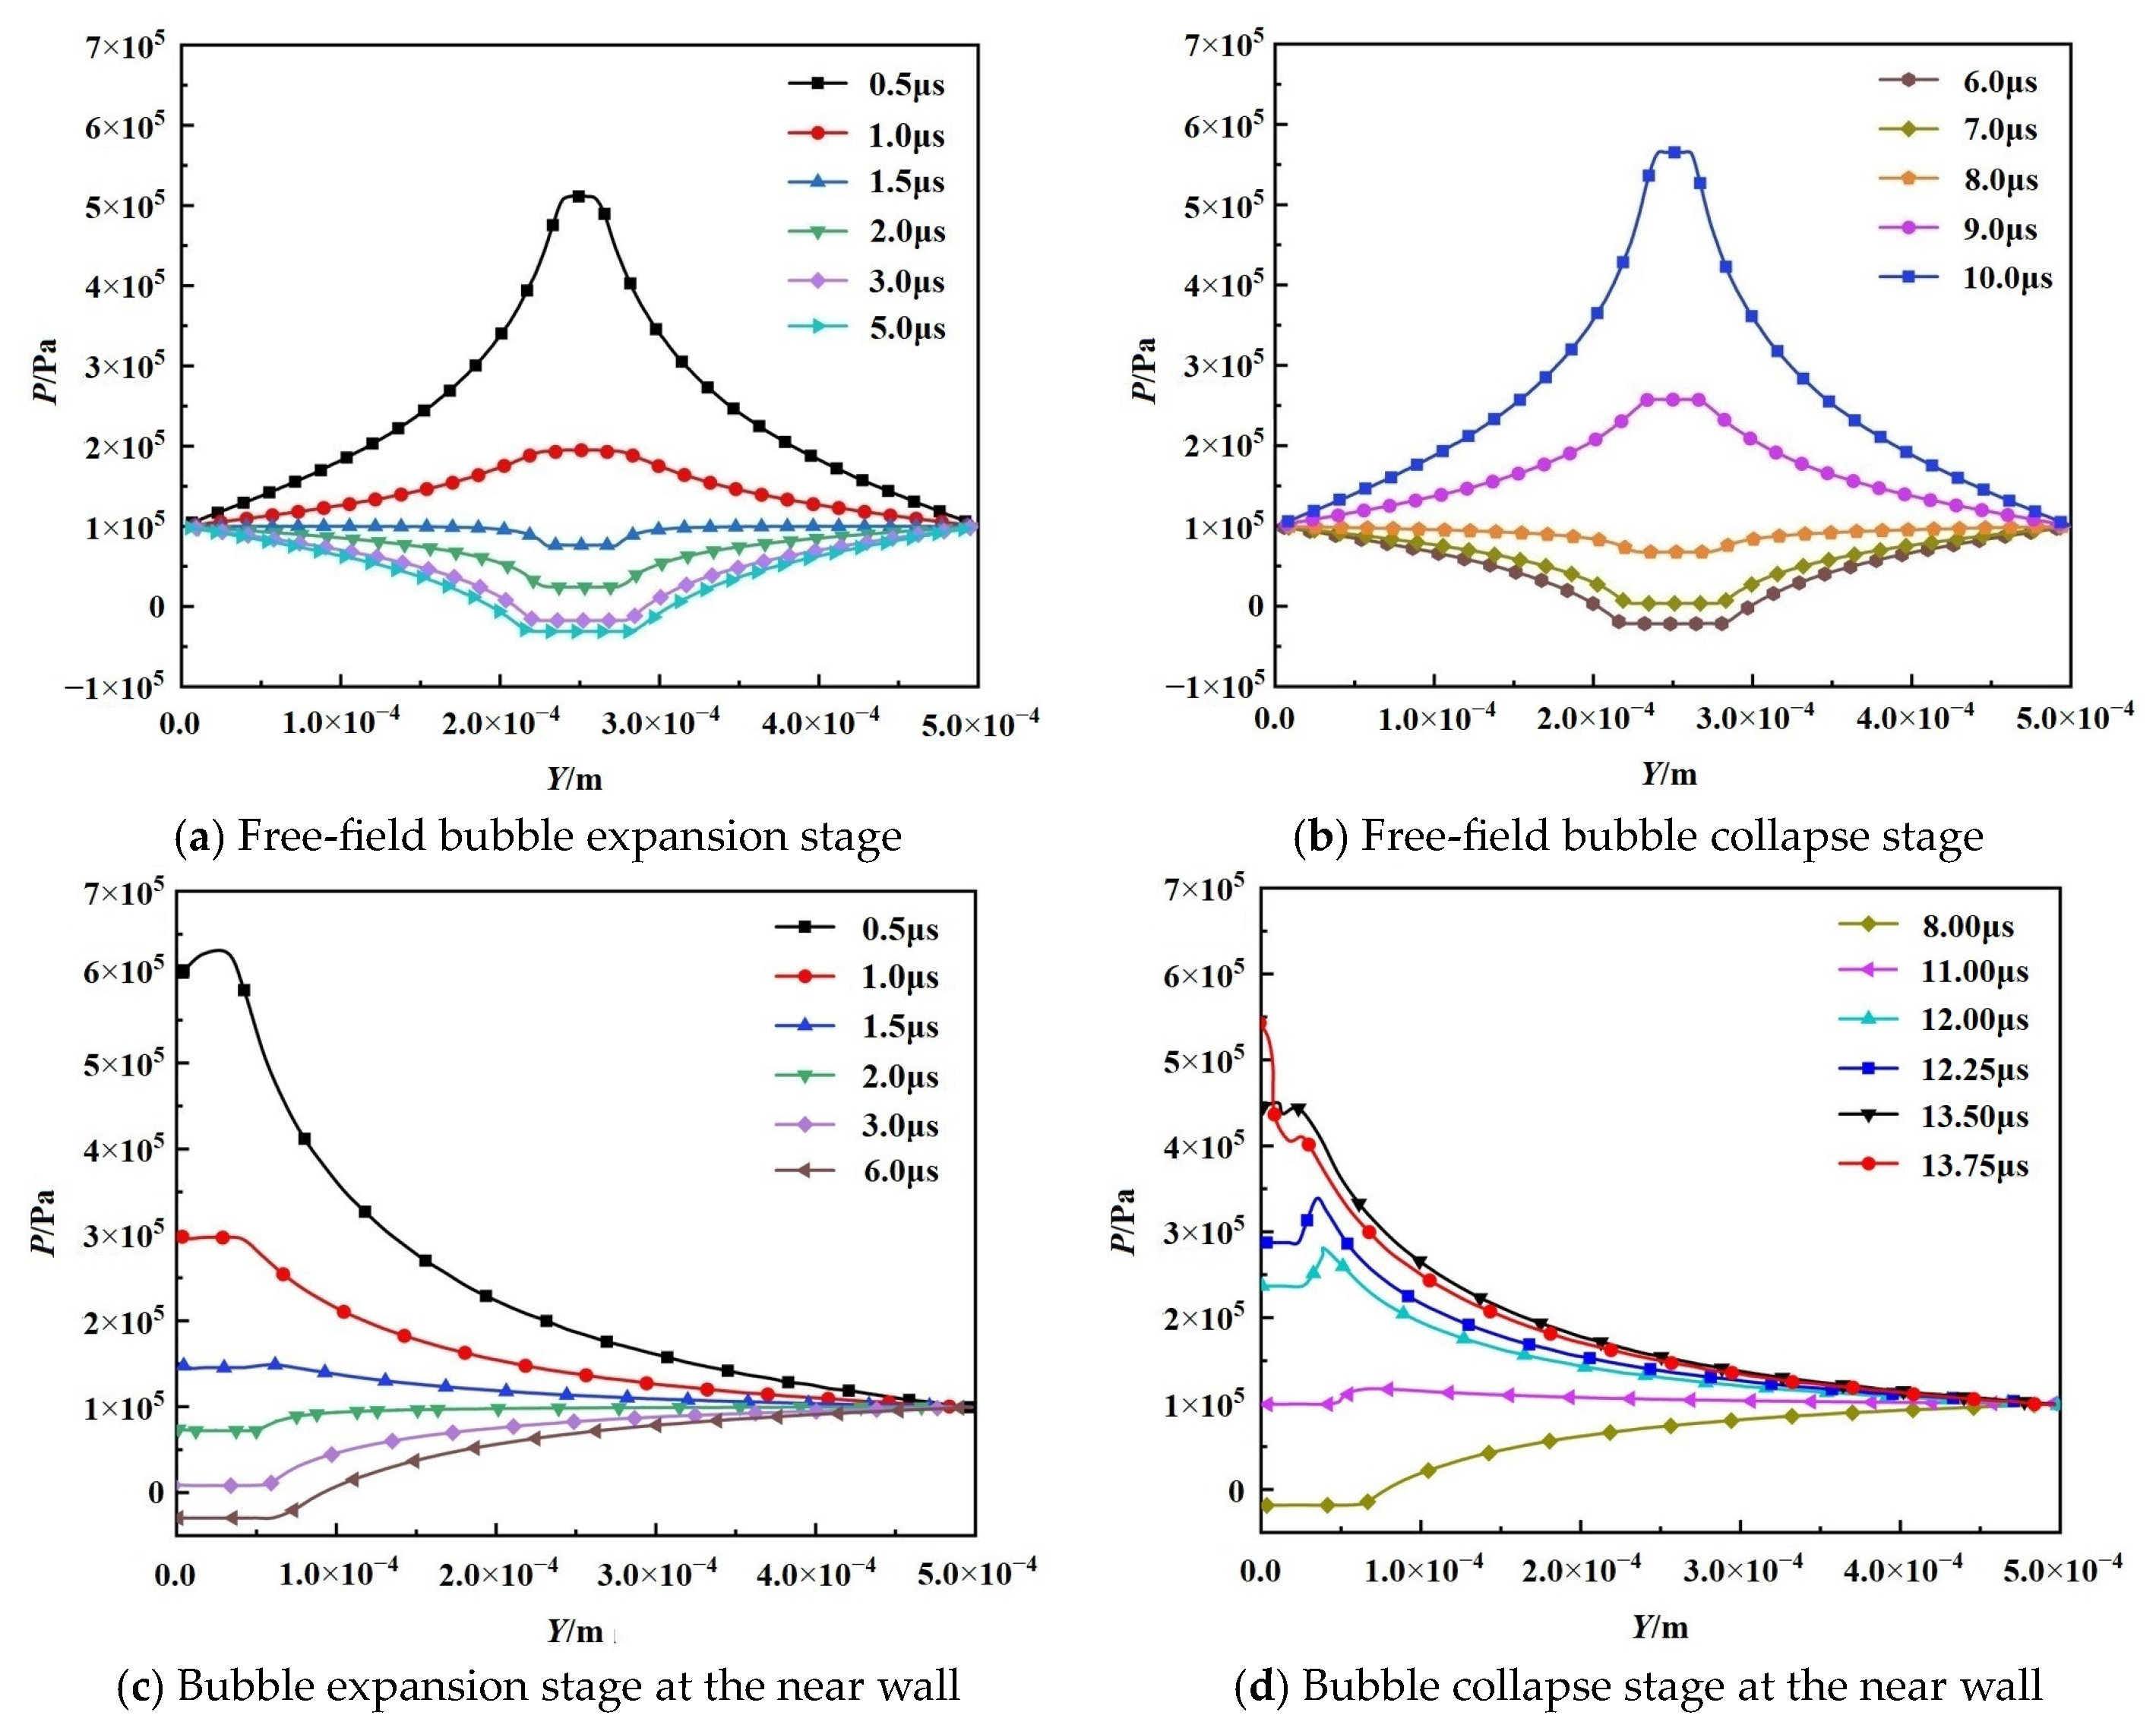
Figure 10.
Distribution of wall pressure along the X-axis.
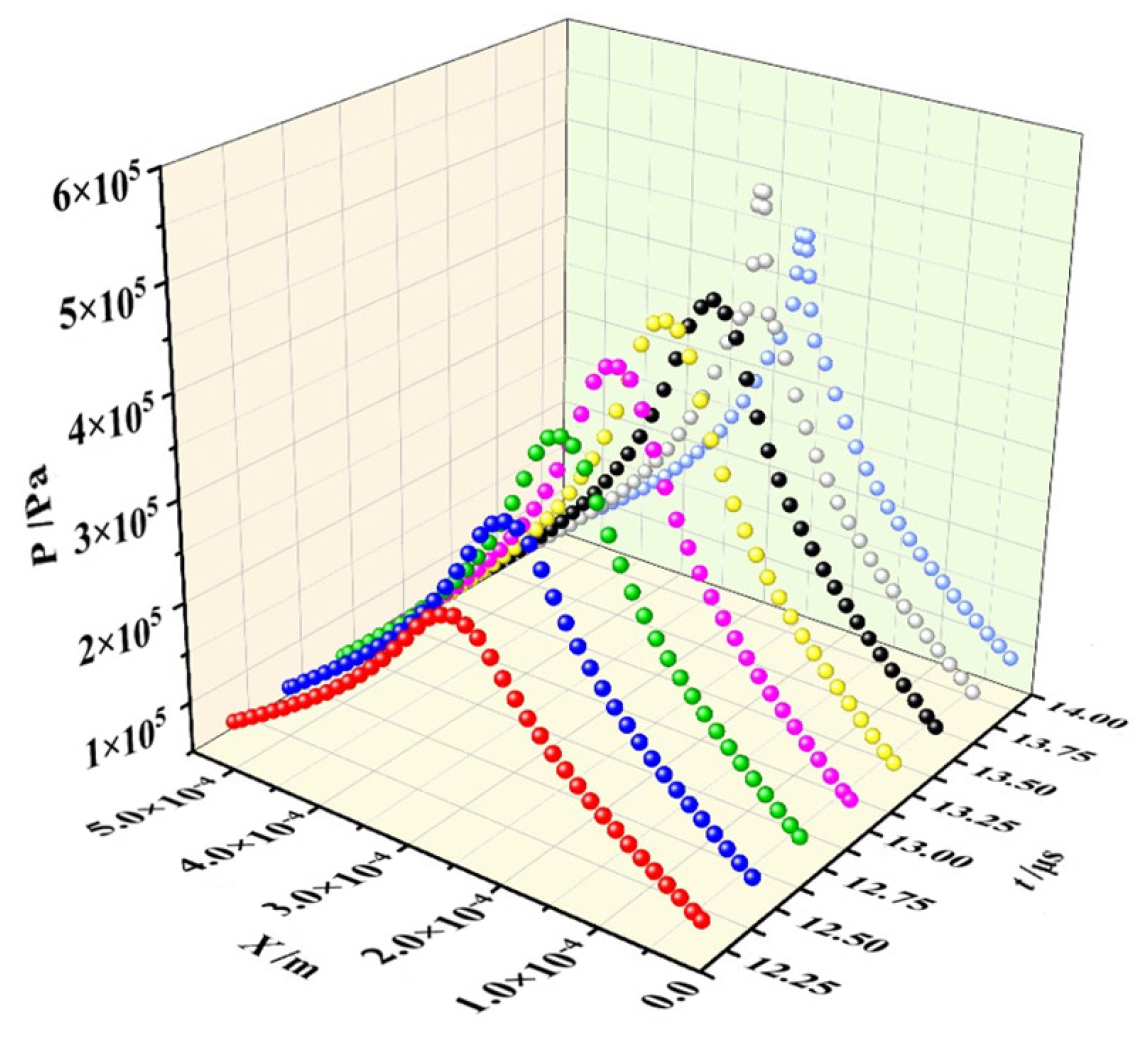
Figure 11.
Velocity distribution of flow field at different stages.
Figure 12.
Shape evolution of bubble collapse for different driving pressures Pd.

Figure 13.
Vjet at different Pd and the pressure variation at the center of the solid wall.

Figure 14.
Relationship curve between peak impact pressure and jet velocity.
Figure 15.
Bubble radius and bubble wall velocity at different temperatures.
Figure 16.
Action of bubbles on the wall at different temperatures.

Figure 17.
Bubble radius and its bubble wall velocity at different viscosities.
Figure 18.
Pressure variation at the center of the solid wall in different viscous solutions.
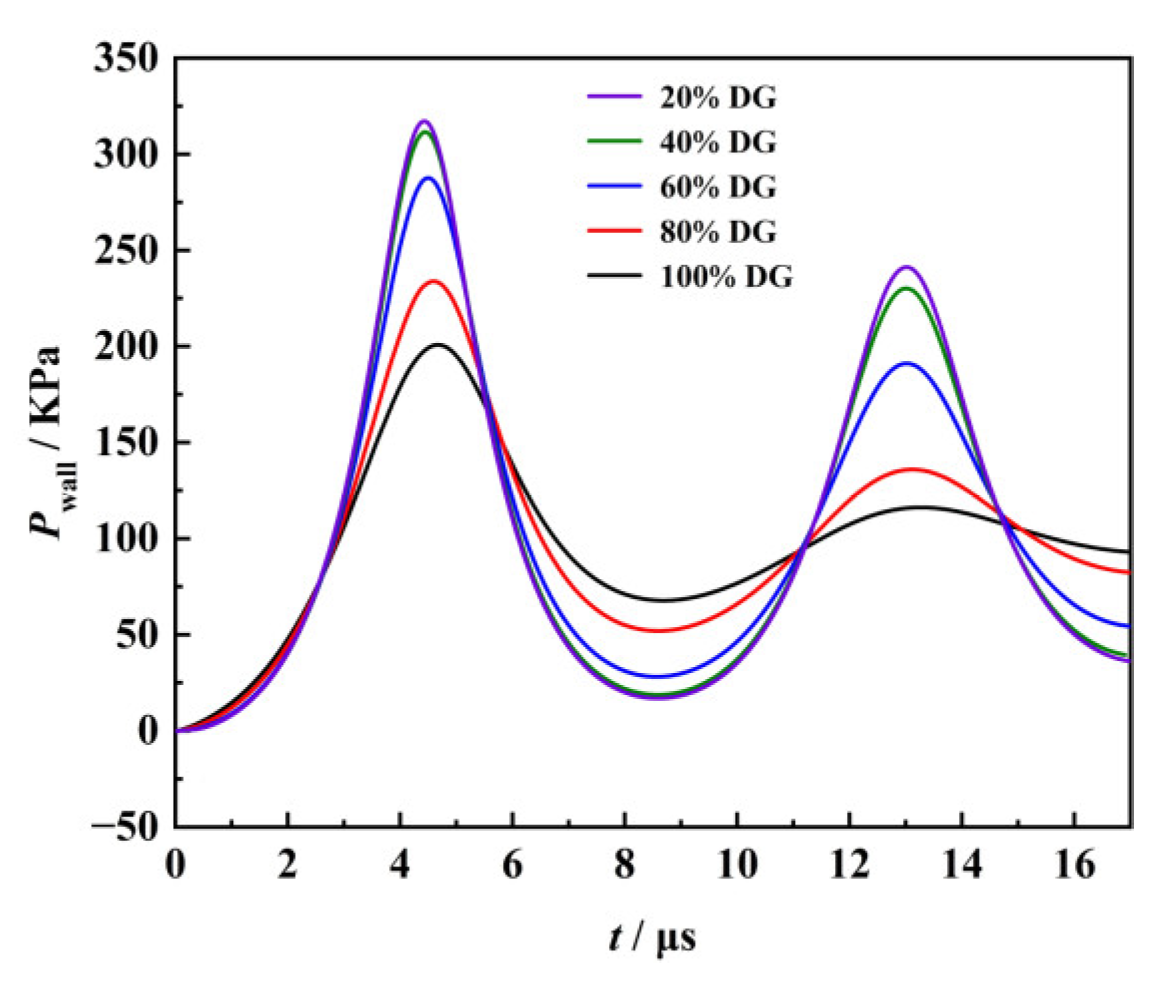
Figure 19.
Arrangement of different numbers of bubbles in condition V.

Figure 20.
Interaction between bubbles with different numbers of bubbles.
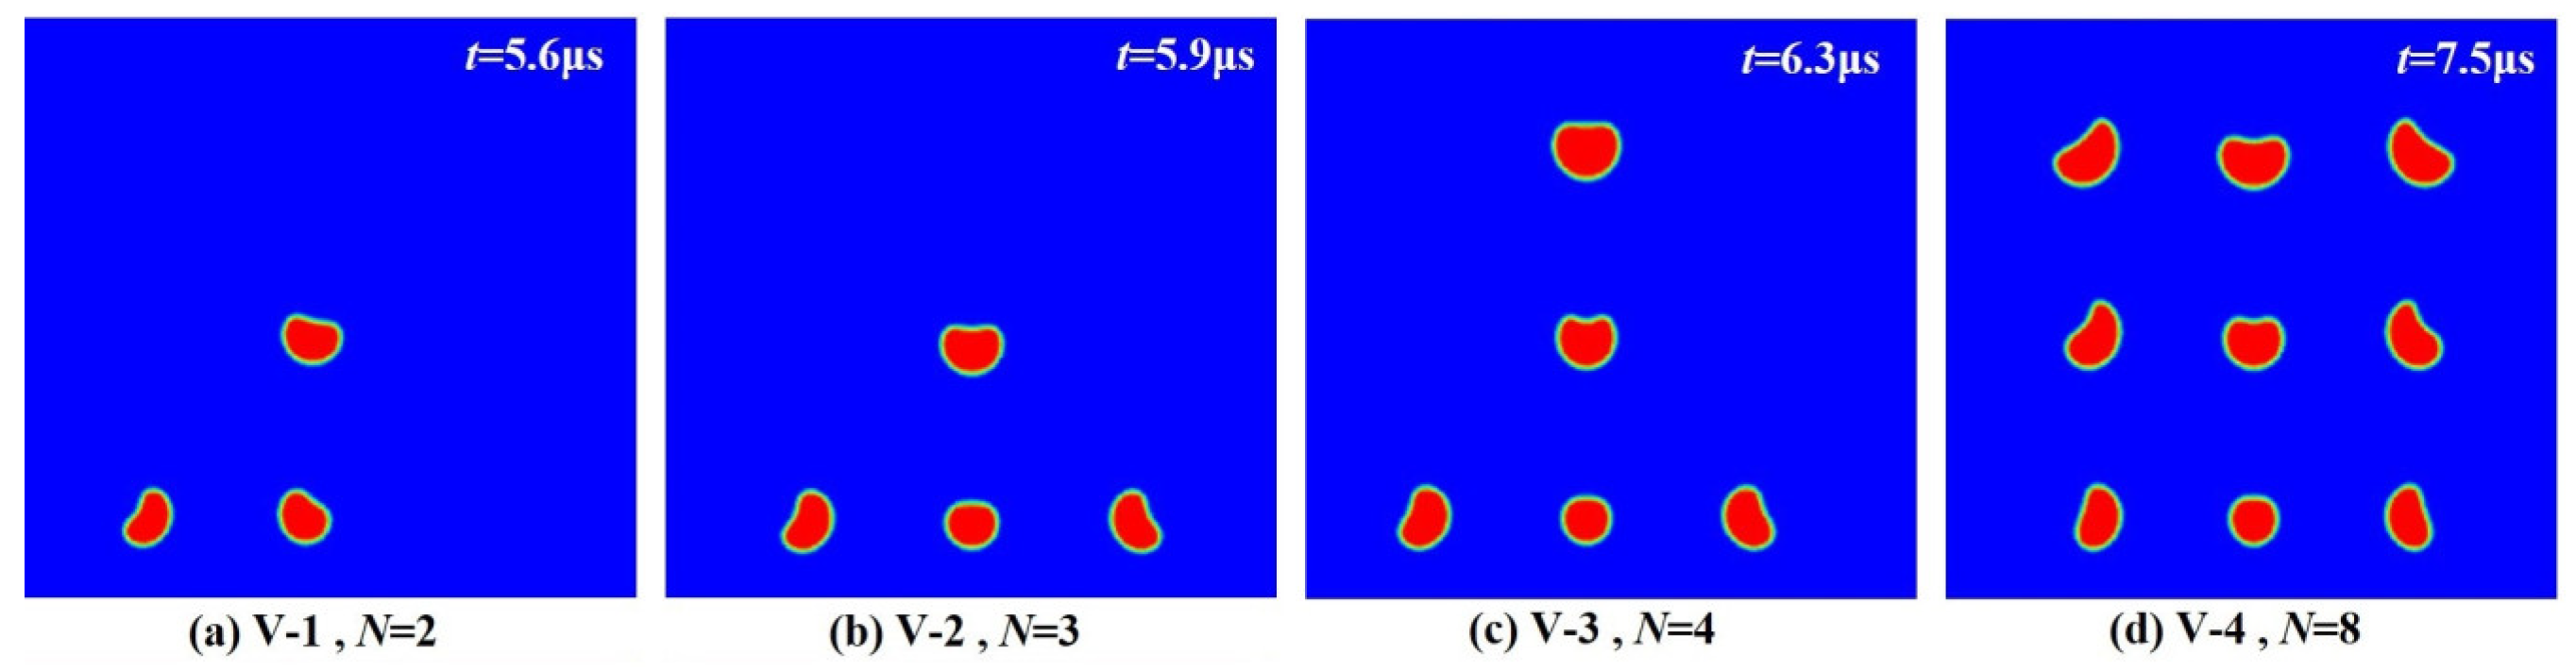
Figure 21.
Flow field pressure and velocity streamlines in the presence of an unequal number of surrounding bubbles (N = 2, N = 3, N = 4, N = 8).
Figure 21.
Flow field pressure and velocity streamlines in the presence of an unequal number of surrounding bubbles (N = 2, N = 3, N = 4, N = 8).
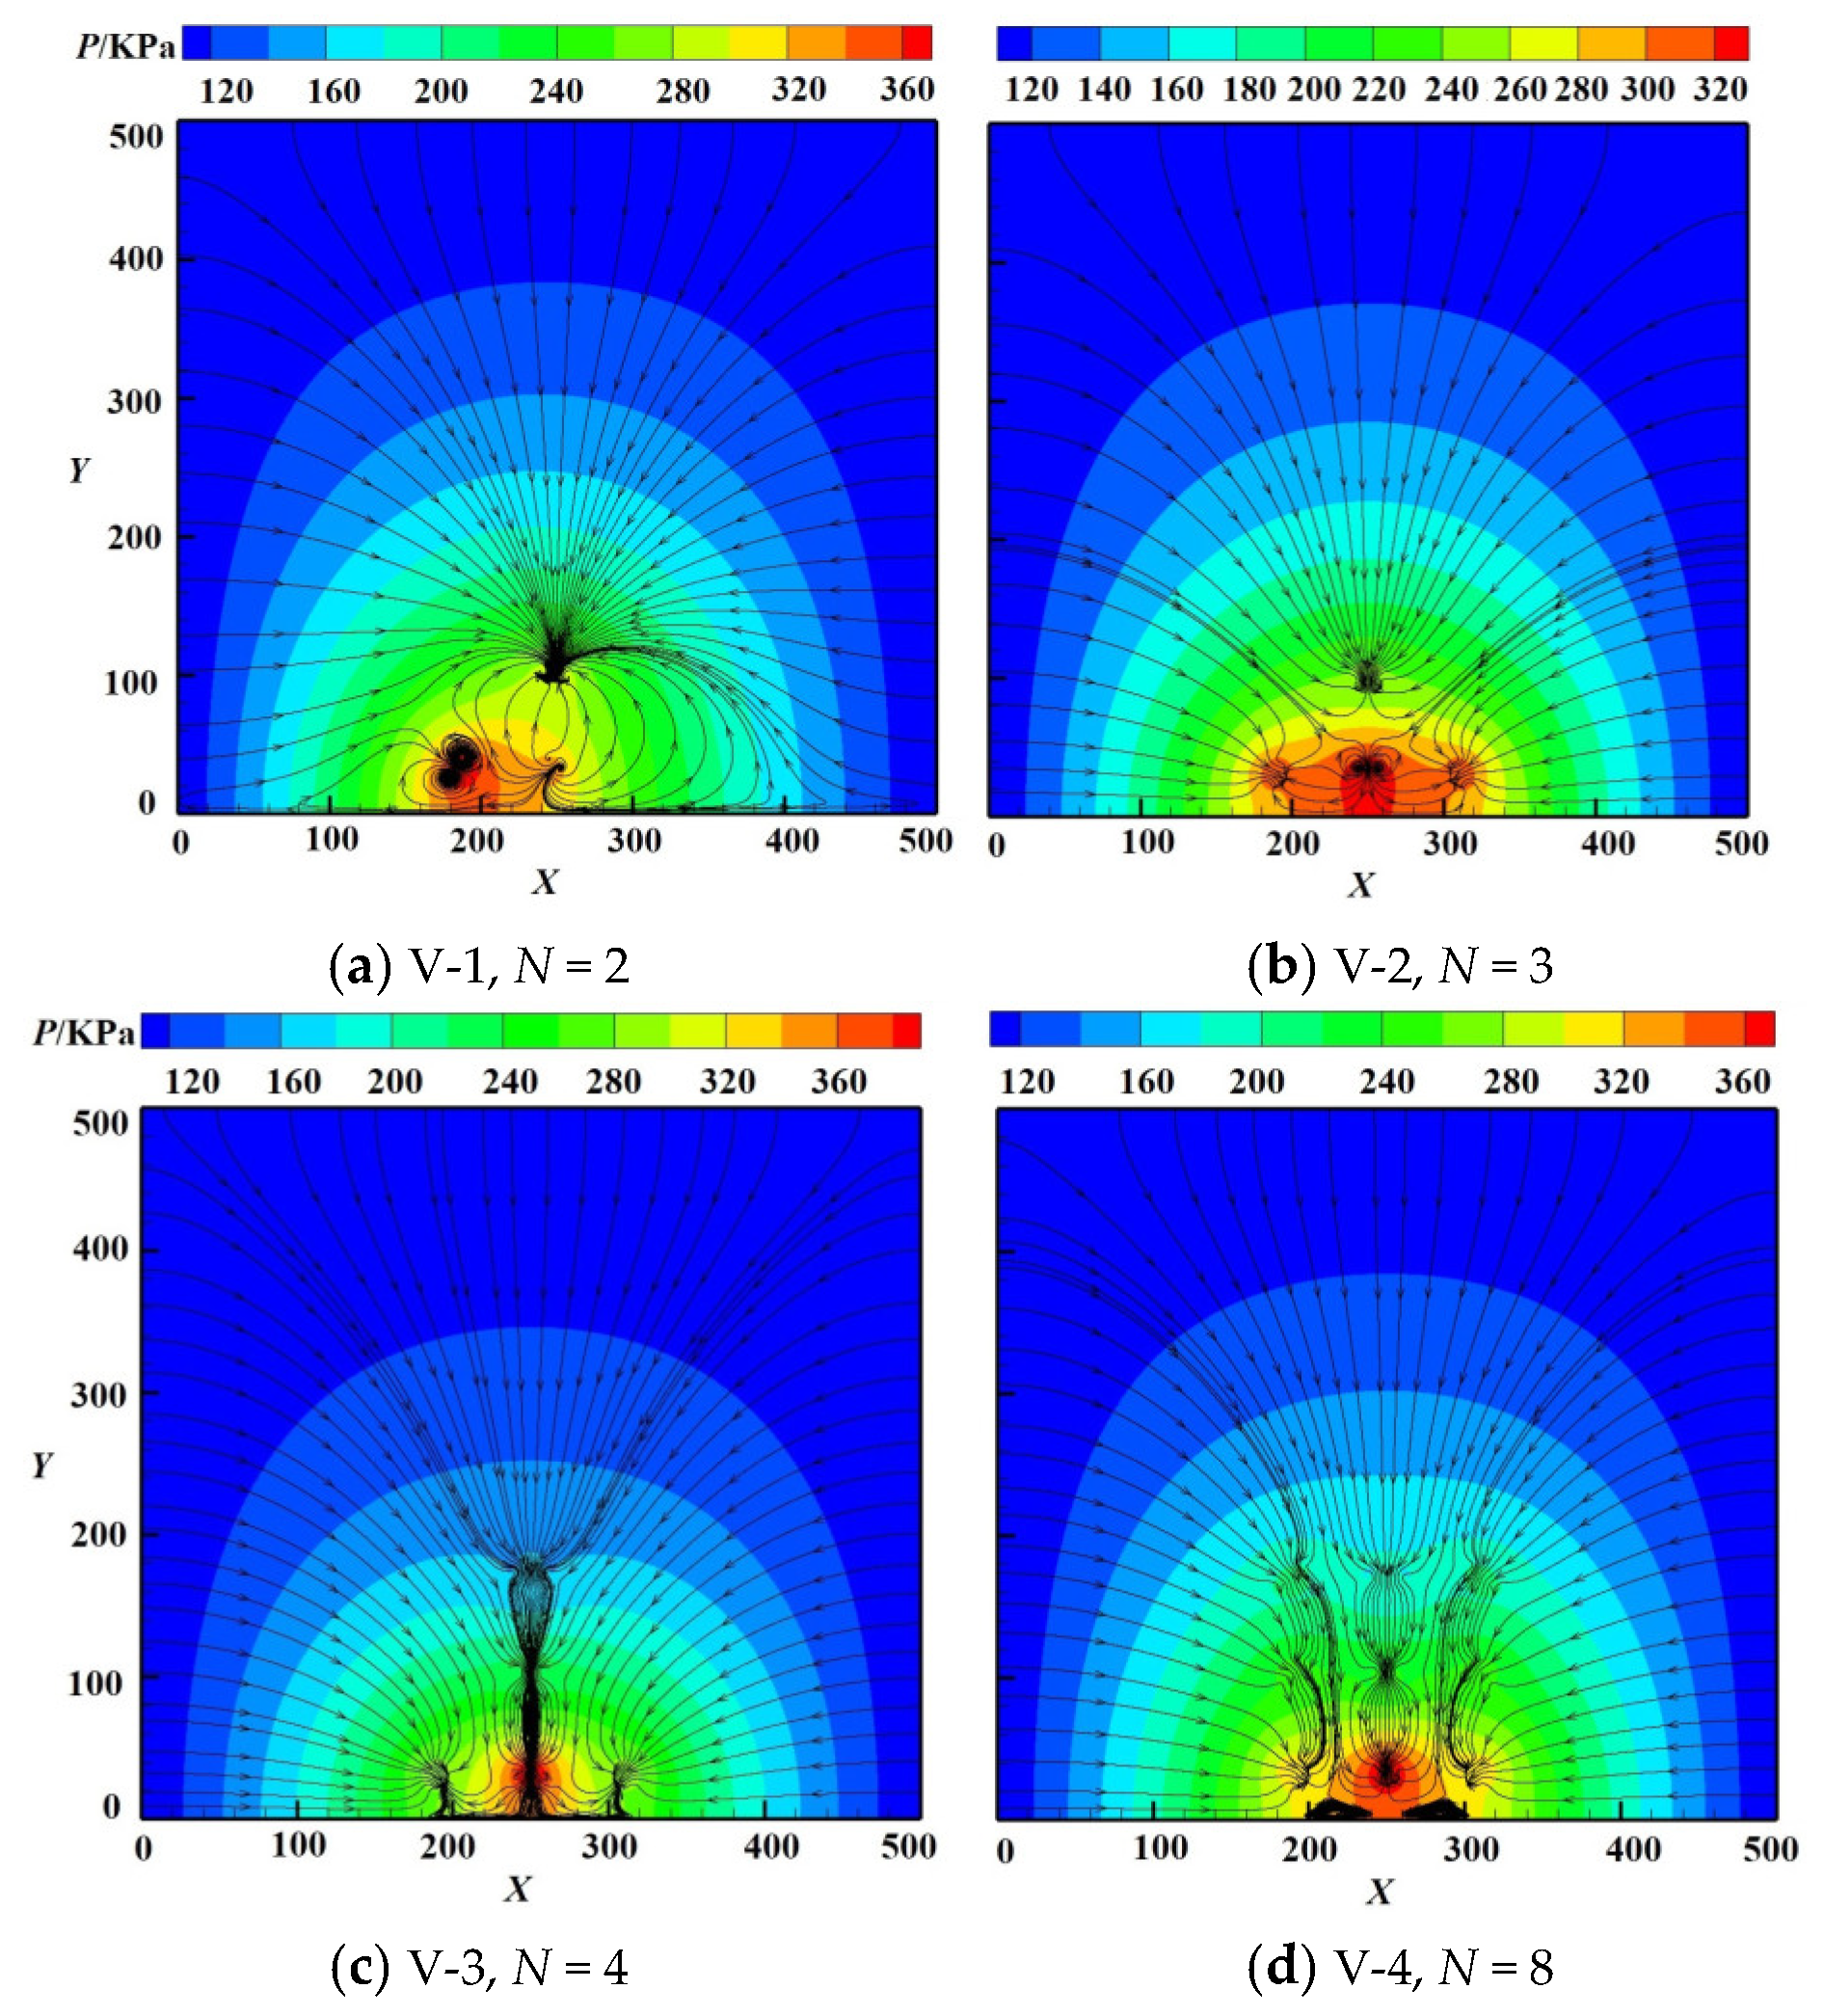
Figure 22.
Variation of pressure at the center of the wall in the presence of an unequal number of surrounding bubbles (N = 2, N = 3, N = 4, N = 8).
Figure 22.
Variation of pressure at the center of the wall in the presence of an unequal number of surrounding bubbles (N = 2, N = 3, N = 4, N = 8).

Figure 23.
Interaction between bubbles under different working conditions: (a) working condition VI; (b) working VII.
Figure 23.
Interaction between bubbles under different working conditions: (a) working condition VI; (b) working VII.
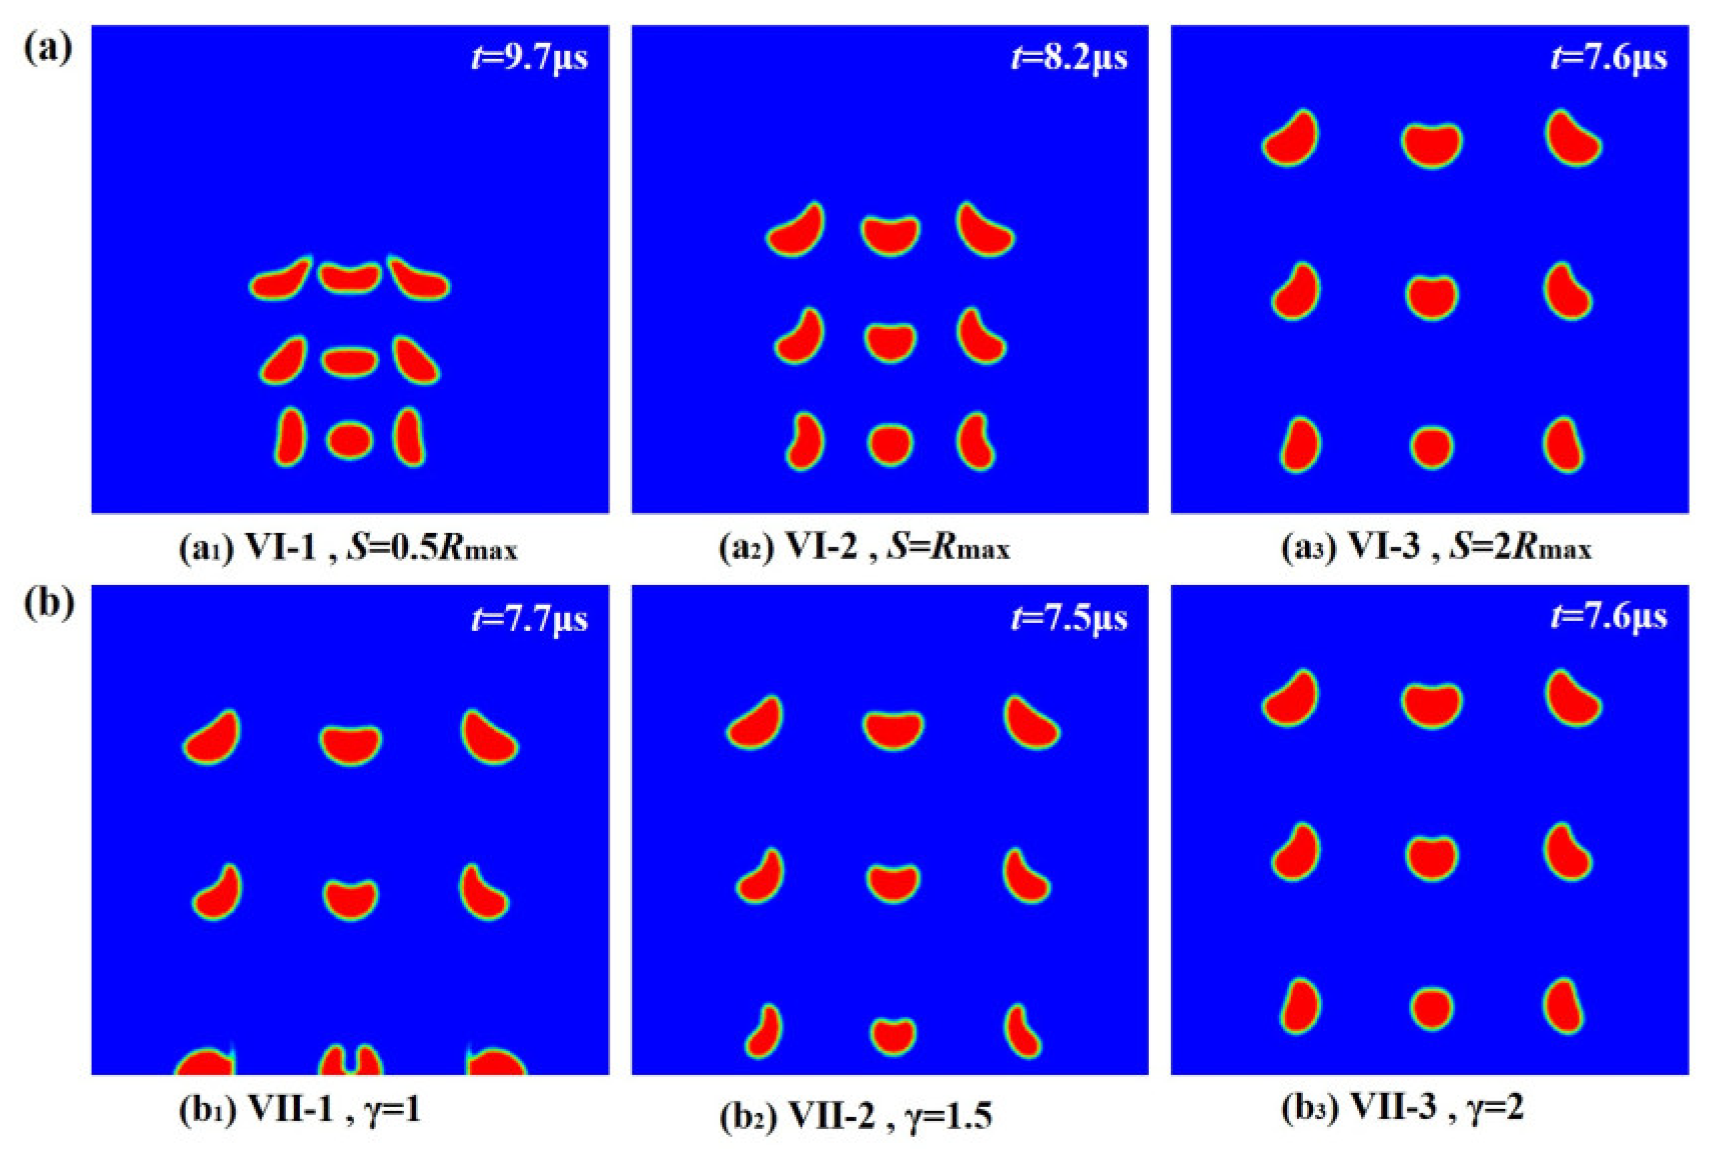
Figure 24.
Wall center pressure under different working conditions.
Figure 25.
Effect of bubble distribution on bubble collapse.
Figure 26.
Flow field pressure and velocity streamlines with different bubble distributions.

Figure 27.
Curves of the central pressure at the wall for different bubble distributions.

Table 1.
Pressure values at the center of the wall for different driving pressures.
| Pd (MPa) | 0.1 | 0.25 | 0.5 | 0.75 | 1 |
|---|---|---|---|---|---|
| t (μs) | 3.17 | 2.84 | 1.96 | 1.55 | 1.33 |
| Vjet (m/s) | 4.75 | 21.13 | 45.52 | 67.43 | 74.90 |
| Pwall (MPa) | 0.15 | 1.44 | 7.10 | 22.26 | 43.62 |
Table 2.
Viscosity coefficient and surface tension coefficient of water at different temperatures.
| Temperature T (°C) | 0 | 10 | 20 | 30 | 40 | 50 | 60 |
|---|---|---|---|---|---|---|---|
| Surface tension coefficient σ (N/m) | 0.0756 | 0.0742 | 0.0728 | 0.0712 | 0.0696 | 0.0679 | 0.0662 |
| Viscosity coefficient μ × 10−3 (Pa·s) | 1.785 | 1.306 | 1.003 | 0.8 | 0.658 | 0.553 | 0.474 |
Table 3.
Viscosity of liquids with different glycerol ratios.
| Distilled Water/Glycerol (%DG) | 20% | 40% | 60% | 80% | 100% |
|---|---|---|---|---|---|
| Viscosity coefficient μ(Pa·s) | 0.00314 | 0.00595 | 0.02052 | 0.067 | 0.110 |
Table 4.
Calculation cases of bubble cluster.
| Condition | Number | S | h | γ | Schematic Diagram |
|---|---|---|---|---|---|
| Working condition VI | Ⅵ-1 | 0.5 Rmax | 2 Rmax | 2 |  |
| Ⅵ-2 | Rmax | 2 Rmax | 2 | ||
| Ⅵ-3 | 2 Rmax | 2 Rmax | 2 | ||
| Working condition Ⅶ | Ⅶ-1 | 0.5 Rmax | 2 Rmax | 2 |  |
| Ⅶ-2 | 0.5 Rmax | 1.5 Rmax | 1.5 | ||
| Ⅶ-3 | 0.5 Rmax | Rmax | 1 |
Disclaimer/Publisher’s Note: The statements, opinions and data contained in all publications are solely those of the individual author(s) and contributor(s) and not of MDPI and/or the editor(s). MDPI and/or the editor(s) disclaim responsibility for any injury to people or property resulting from any ideas, methods, instructions or products referred to in the content. |
© 2023 by the authors. Licensee MDPI, Basel, Switzerland. This article is an open access article distributed under the terms and conditions of the Creative Commons Attribution (CC BY) license (https://creativecommons.org/licenses/by/4.0/).
Share and Cite
MDPI and ACS Style
Liu, B.; Zhao, H.; Li, C.; Guan, H.; Wang, F. Research on the Mechanism and Control Strategy of Microbubble Cleaning Sludge. Processes 2023, 11, 2915. https://doi.org/10.3390/pr11102915
AMA Style
Liu B, Zhao H, Li C, Guan H, Wang F. Research on the Mechanism and Control Strategy of Microbubble Cleaning Sludge. Processes. 2023; 11(10):2915. https://doi.org/10.3390/pr11102915
Chicago/Turabian StyleLiu, Bing, Haitao Zhao, Changjiang Li, Heng Guan, and Fengde Wang. 2023. "Research on the Mechanism and Control Strategy of Microbubble Cleaning Sludge" Processes 11, no. 10: 2915. https://doi.org/10.3390/pr11102915
Note that from the first issue of 2016, this journal uses article numbers instead of page numbers. See further details here.