
Investigating Erosion of String in Underground Hydrogen Storage under High Flow Velocity

1
Tubular Goods Research Institute of China National Petroleum Corporation, Xi’an 710055, China
2
School of Mechanical and Electrical Engineering, Xi’an University of Architecture and Technology, No. 13 Yanta Road, Xi’an 710055, China
3
Wuhan Second Ship Design and Research Institute, Wuhan 430205, China
*
Authors to whom correspondence should be addressed.
Processes 2023, 11(10), 2894; https://doi.org/10.3390/pr11102894
Submission received: 10 September 2023
/
Revised: 24 September 2023
/
Accepted: 26 September 2023
/
Published: 30 September 2023
(This article belongs to the Special Issue Risk Assessment and Reliability Engineering of Process Operations)
Abstract
:Underground hydrogen storage represents an innovative approach to energy storage. To ensure the secure operation of subterranean hydrogen storage strings, a computational fluid dynamics (CFD) methodology was employed to devise an erosion assessment model tailored for high-velocity conditions. The research delved into the erosion and abrasion dynamics of these storage strings when subjected to high-speed gas flows. This study further examined the impacts of gas velocity, particle size, pipe material, and pipe wall corrosion imperfections on flow patterns and erosion wear rates across the column. The outcomes revealed several noteworthy trends. As fluid velocity increased, the flow field’s maximum pressure augmented, while it decreased alongside enlarging pipe diameter and particle size. P110 pipe material exhibited higher maximum pressure in comparison to N80. The effect of centrifugal force induced pressure to surge from the inner to the outer portion of the column. In the curved pipe section’s outer wall, the frequent occurrence of high-angle collisions engendered elevated rates of erosion wear over time. Particularly noteworthy was the observation of the highest erosion rate in curved pipes showcasing three corrosion defects, attributed to the backflow effects of erosion pits.
1. Introduction
Currently, the contradiction between energy supply and demand and environmental pollution has become a global problem, ensuring energy supply security and clean green development has become an important part of many countries’ energy strategies. Against this backdrop, renewable energy has developed rapidly. For a long time, domestic and foreign industry have continuously explored the large-scale storage of hydrogen as a secondary energy system [1,2,3]. The use of underground gas storage for compressed hydrogen storage is one of the development directions with great potential for large-scale energy storage. Developed countries such as Germany, France, and the United Kingdom have built underground hydrogen storage facilities to meet the needs of the chemical industry and petrochemical industry [4]. China is also actively exploring the storage of hydrogen energy using underground salt caverns.
The injection and extraction pipe string of the underground hydrogen storage reservoir undertakes the important task of injection and extraction production. Considering the protection of the storage layer and ensuring energy supply, it is required to extend the service life of the injection and extraction pipe string as much as possible and reduce the number of well repairs [5]. Compared with ground hydrogen storage, underground salt caverns have the advantages of large storage capacity, low gas storage cost, and high sealing performance, such as Jintan gas storage and Jianghan gas storage, which are the main types of underground energy storage in China [6]. During the injection and extraction process of the hydrogen storage reservoir, a certain amount of sand grains are often carried along. During saturated operation or peak shaving, with the continuous changes in the flow velocity of the inclined section of the string, downhole pressure, and temperature, the high-speed gas flow carrying sand grains will cause erosion and wear on the string [7,8,9]. The operation period of the salt cavern energy storage reservoir is usually 30 years. Some early hydrogen storage reservoirs, such as the British salt cavern hydrogen storage group, have been in operation for more than 25 years. When the erosion and wear exceed the load limit of the string, it not only reduces the service life of the energy storage string, but even causes malignant accidents such as deformation, crushing, rupture, and even scrapping of the whole well [10]. Therefore, it is of great significance to construct a numerical model of the erosion of the inclined section of the hydrogen storage reservoir string, analyze the flow state and erosion and wear rules of the string along the way, to ensure the safe and smooth operation of the high-speed hydrogen storage reservoir string.
The erosion and wear rate of the underground hydrogen storage string is the key factor limiting the injection and extraction capacity. High-speed airflow scouring causes a certain amount of erosion damage to the string. Existing research mainly uses numerical methods to study the erosion behavior of high-speed airflow on the string structure and the analysis of the flow state along the way. Liu et al. [11] analyzed the feasibility and erosion behavior evaluation of the Jiangsu hydrogen storage salt cavern from the aspects of stability and applicability. Wu et al. [12] constructed a string erosion and wear prediction model and optimized the anti-erosion structure design through experimental comparison. Meng et al. [13] built a high-temperature and high-pressure erosion–corrosion coupling device to analyze the erosion–corrosion coupling rate and the interaction relationship of the multi-functional salt cavern hydrogen storage string. Sletfjerding et al. [14] designed a gas flow state comparative experiment to analyze the basic law of near-wall pressure distribution along the pipeline; Liu et al. [15] evaluated the effects of injection and extraction pressure difference, well inclination angle, and tubing inner diameter on the near-wall pressure of the string by numerical experiments. Zeng et al. [16] proposed the commonly used calculation model and parameter range of high-speed pipe flow via construction of a fluid erosion model of the curved pipeline. Mazumder et al. [17] utilized a discrete phase model (DPM) based on CFD to simulate particle motion, investigating the influence of gas and liquid velocities on the maximum erosion location within a U-shaped pipe. Tabakoff et al. [18] conducted simulation-based research to investigate the effects of fluid properties and flow conditions on erosion. Suzuki et al. [19] carried out a progressive series of studies using CFD simulations to address the issue of fluid erosion in curved pipelines. They proposed common computational models and parameter selection criteria for high-velocity pipe flows. Assessing the utmost erosion and wear velocity in the pipeline section, as well as comprehending the flow dynamics, constitutes a fundamental requirement for ensuring the secure operation of hydrogen storage reservoirs during both saturated operation and peak shaving [20]. Zhang et al. [21] introduced a digitized semi-empirical model for time series degradation analysis, exemplified through an underground gas storage case, effectively quantifying RUL and providing a robust tool for assessing degradation risk. The erosive phenomenon could potentially hasten the loss rate of column wall thickness, weaken internal pressure resistance, decrease production rates, and even result in leakage, leading to secondary disasters and serious safety accidents [22]. Zhang et al. [23] used uncertainty quantification to assess fault and cementation plane stability in UGS injection and withdrawal wells under alternating cycles, employing multidimensional models, geological data, and inversion techniques. Bai et al. [24] examined UGS as a means of balancing energy supply and demand, focusing on international UGS distribution, ongoing facilities in China, integrity issues, and advanced well completion technologies. However, scant literature is presently available concerning the erosion characteristics of injection and extraction pipeline sections within hydrogen storage reservoirs on an international scale [25,26]. The existing research predominantly concentrates on the ramifications of shifting erosion conditions on the erosion progression, often overlooking the erosive and abrasive effects induced by high-velocity gaseous flows on pipeline sections with inherent corrosion anomalies [27]; gas well string erosion and wear research is mainly for high-pressure gas extraction conditions of natural gas energy storage string erosion, and there are no reports on the characteristics of underground hydrogen storage string erosion and wear [28,29,30]. Furthermore, small-scale experiments play a crucial role in investigating the erosion and wear characteristics of strings [31]. Given the intricate environment of hydrogen storage strings, a multitude of experimental variables such as gas flow conditions and physical properties of sand and gravel can significantly impact the precision of erosion tests, presenting challenges for real-world control [32,33,34].
Based on the above analysis, this article fully considers the erosion characteristics and research status of the underground hydrogen storage string, constructs a calculation model of the erosion of the underground hydrogen storage string under high flow speed, studies the near-wall pressure distribution inside the inclined section of the string under the scouring action of high-speed airflow, analyzes the effects of gas flow speed, particle diameter, pipe material, and pipe wall corrosion defects on the flow state and erosion and wear rate of the string along the way, provides a theoretical basis and methodological support for the study of the erosion and wear of the hydrogen storage string under high-speed airflow, and further improves and enriches the risk assessment method system for the erosion of the hydrogen storage string in China.
2. Establishment of Numerical Model
2.1. Control Equations
Underground hydrogen storage technology employs subterranean salt caverns for extensive hydrogen storage. During peak demand reduction periods, hydrogen gas is generated in an electrolysis facility and subsequently introduced into the storage cavern through a compressor. During periods of low demand, or valley periods, the hydrogen gas from the storage cavern is expanded, then passed through a turbine to drive a generator to produce electricity. Because the pipeline column in the hydrogen storage cavern undergoes unidirectional fluid impact during the injection and extraction process, it is assumed that the fluid moving within the column is a single-phase compressible fluid. The renormalization-group (RNG) κ-ε turbulent viscosity model is chosen for numerical calculation. It follows the mass, energy, and momentum conservations, shown as follows:
where ρ is the density; ui is a velocity component; t is the time; p is the pressure; μ is the molecular viscosity; μt is the turbulence viscosity; g is gravity; h is the average enthalpy of density; λ is the laminar thermal conductivity; T is temperature; Prt is the turbulence Prandtl number; Di is the dispersion coefficient of component i; hi is the enthalpy of component i; SE is the energy source. Corrections for actual compressible fluids are as follows:
In the equations, p0 is the static pressure when the fluid is incompressible, corresponding in this article to the inlet pressure in the computational conditions, measured in mega pascals (MPa).
According to the gradient diffusion hypothesis, the Reynolds stress in the above viscous eddy model can be expressed by the fluid velocity gradient and the turbulent viscosity:
In the equations, the Kronecker integral term is a normal stress when i = j, and a shear stress when i ≠ j, measured in mega pascals (MPa).
The turbulent energy k and the turbulent energy dissipation rate ε are obtained from the transport equations described by Equations (6) and (7), respectively. With this, Equations (1)–(3) are closed.
In the equations, i and j represent coordinate directions; k represents turbulent energy per unit mass of gas; ε represents the relative turbulent energy dissipation rate; is a constant in the k equation for the turbulence model, and is set to 0.7179; is a constant in the ε equation for the turbulence model.
The discrete phase model (DPM) is used to track the particles in pipeline. The trajectory of particles is solved by the differential equation of particle force in the integral Lagrangian coordinate system. The force balance equation of particles in Cartesian coordinates is shown in Equation (8), i.e., the inertia of particles is equal to various forces acting on particles, including buoyancy, drag force, and additional mass force.
where ub is the velocity of particles, m/s; g is gravity acceleration, m/s2; ρ is the density of continuous phases, kg/m3; ρb is the density of particles, kg/m3; FD is drag force, N; FVM is virtual mass force, N; the drag force FD of particles is defined as follows:
where db is the diameter of bubble particles, m; Re is relative Reynolds number; CD is coefficient of drag force; ub is the velocity of particles, m/s; u is transient velocity of continuous phase fluid, m/s, and the transient velocity includes average velocity U and turbulence fluctuation u’. The turbulent velocity fluctuation in the drag force produces turbulent dispersion, which results in an additional drag force that does not include the additional drag force caused by the turbulent velocity fluctuation.
2.2. Physical Model
As shown in Figure 1, the hydrogen storage column model consists of three sections: the inlet section, the outlet section, and the bend pipe section. A three-dimensional modeling software, Design Modeler, is used to build a three-dimensional physical model of the inclined string. The model uses a 60° bend pipe with an internal diameter D. To ensure sufficient development of the fluid before entering the bend pipe section, the inlet and outlet sections are both taken as 10 D, with an initial bend ratio of R/D = 2.
The three-dimensional physical model of the hydrogen storage column is imported into the pre-processing software Gambit, where it is divided into tetrahedral meshes. Considering that the bend pipe section is the main object of study, it is locally densified. The simulations are conducted using a set of grids with different numbers (2.6 × 10⁵, 3.7 × 10⁵ and 4.8 × 10⁵). The simulations are performed initially using the grid with the smaller number, then reducing the grid size and increase their number. The difference in results between the mesh models with a grid number of 2.6 × 10⁵ and 3.7 × 10⁵ is about 4.8%, whereas the difference in results between the mesh models with a grid number of 3.7 × 10⁵ and 4.8 × 10⁵ is about 1.8%. Overall, the results from three grids are consistent, but the difference between them is a grid number of 3.7 × 10⁵ and 4.8 × 10⁵, which is smaller. Eventually, the grid number in the model is 481,771.
The pressure–velocity steady-state solver is chosen to solve the boundary conditions, using the SIMPLE algorithm. In order to achieve better convergence, second-order upwind algorithms are used for pressure, momentum, and turbulent energy. The range of residuals in the monitor is set to 10−4. The model boundaries and conditions are set as shown in Table 1. Gas movement is directed top-down. The material is considered by the coefficient of elasticity in no-slip boundaries.
2.3. Computational Parameters and Working Conditions Setting
Taking an underground gas storage salt cavern in China as an example, the design pressure for injection and production of the casing is 13.77–12.5 MPa, the diameter is divided into two types: 0.27 m and 0.34 m, the maximum storage gas pressure is 17 MPa, the hydrogen flow rate at the wellhead is 276.3 T/h, the diameter of the sand particles is 50–200 μm, and it has characteristics such as high sand content ratio and long usage period. Therefore, factors such as gas flow speed, particle diameter, pipe material, and corrosion defects are considered to analyze their impact on the flow state along the casing and the erosion wear rate. The specific simulation conditions are shown in Table 2. It presents the cases for simulation that can implement the factorial analysis of the impact of different factors on the erosion rate of the tube.
2.4. Model Validation
An experiment reported in Chen et al. (2015) [35] is used to validate the numerical model. In order to compare the consistency between experimental results and erosion simulation results, it is necessary to establish a simulation model with the same parameters as the physical experimental system. The inner diameter of the experimental column is 0.32 m, and the total length and height of the experimental system are 2 m and 0.8 m, respectively. A three-dimensional model with the same dimensions as the experimental system was created using Design Modeler software, and then imported into Gambit for mesh generation of the geometric physical model.
The experimental operating temperature is 20 °C, and the medium inside the pipe is air with a flow rate of 53 m3/h and a pressure of 0.8 MPa. The sand particle size is 250 μm, and the sand production rate in the experimental system is 1 g/s. The experiment uses Q235 steel samples. The calculated erosion weight loss is compared with the measured weight loss from the experiment as shown in Table 3, and the maximum numerical error between the two does not exceed 5%. Therefore, it fully demonstrates the reliability and accuracy of using numerical models for erosion simulation.
3. Results and Discussion
A bend pipe with Φ0.27 × 0.02 is selected, the volume fraction of solid particles is chosen as 1%, and the particle diameter is 2 × 10⁻⁴ m. Figure 2 shows the pressure distribution in the 60° bend pipe under flow rates of 24 m/s. The pressure in the vertical pipe section is basically stable, because when the fluid passes through the bend, the solid particles collide and rebound, and the fluid generates centrifugal force at the bend, the traction on the inner side of the bend changes the flow direction, causing negative pressure on the inner side. From the inner side to the outer side, the pressure value increases progressively, and the maximum value of the flow field pressure increases with the increase in the fluid velocity.
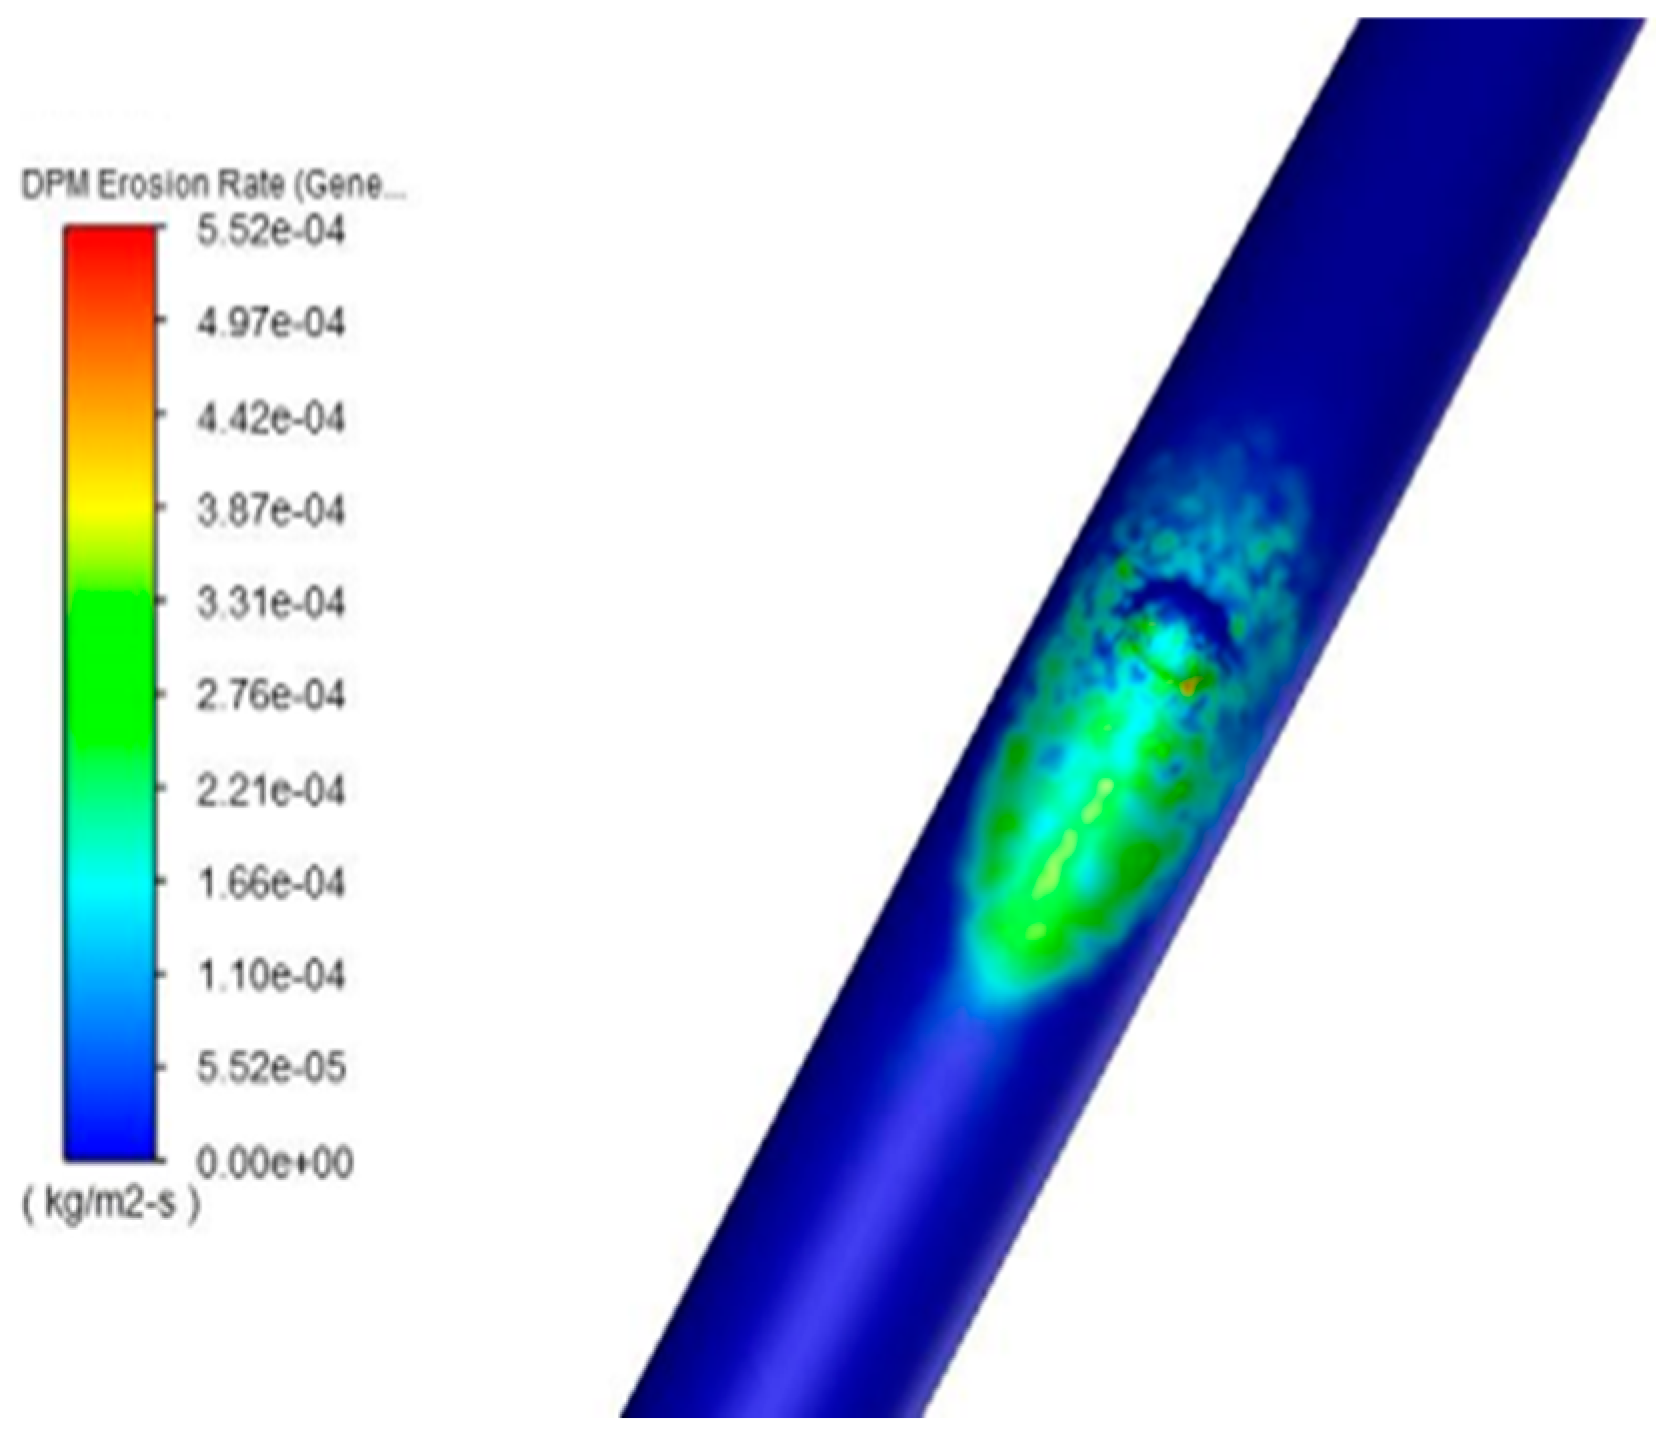
Figure 3 shows the particle’s track in the bend pipe. The figure shows that the particle moves along the pipe bend path and is subject to a certain centrifugal force. It can be analyzed that more collision and friction will occur at the bend, and the particle’s residence time gradually increases from the pipe bend to the pipe exit. Figure 4 shows the erosion degree and erosion distribution on the bent pipe surface. This shows the erosion degree in different colors, with the most severe erosion at the pipe’s red dots.
- (1)
- Flow Rate: A bend pipe with a diameter of Φ0.27 × 0.02 is selected, the volume fraction of discrete phase particles is 1%, and the particle diameter is 2 × 10⁻⁴ m. The maximum erosion wear rate curves are obtained at six flow rates of 24 m/s, 36 m/s, 48 m/s, 60 m/s, 72 m/s, and 84 m/s. The maximum erosion rates are 1.12 × 10⁻⁴ kg/m2·s, 3.06 × 10⁻⁴ kg/m2·s, 5.67 × 10⁻⁴ kg/m2·s, 1.10 × 10⁻³ kg/m2·s, 1.71 × 10⁻³ kg/m2·s, and 2.42 × 10⁻³ kg/m2·s, respectively. As shown in Figure 5, the maximum erosion rate increases with the increase in flow rate. As the particle speed increases, the degree of erosion also increases, the erosion rate gradually increases, and the erosion rate increases significantly at high flow rates.
- (2)
- Particle Diameter: A bend pipe with a diameter of Φ0.27 × 0.02 is selected, and the volume fraction of discrete phase particles is 1%. At a speed of 48 m/s, four different particle diameters of 5 × 10⁻⁵ m, 1 × 10⁻⁴ m, 2 × 10⁻⁴ m, and 5 × 10⁻⁴ m are added to perform numerical simulations, and the maximum erosion wear rate curve is obtained. As shown in Figure 6, when the speed and other external conditions are fixed, the maximum erosion wear rate of the string is the smallest at 4.63 × 10⁻⁴ kg/m2·s when the particle size is 50 μm; when the particle size is 500 μm, the maximum erosion wear rate of the string is the largest at 1.10 × 10⁻³ kg/m2·s. Under the particle size of 100–200 μm, the maximum erosion rate has a small increase, and it can be seen that the maximum erosion rate increases with the increase in particle size.
- (3)
- Pipe Material: A bend pipe with a diameter of Φ0.27 × 0.02 is selected, and the volume fraction of discrete phase particles is 1%. At a flow rate of 48 m/s, N80 and P110, two different materials are added, respectively, for numerical simulation, and the maximum erosion wear rate histogram is obtained. The maximum erosion rate of the P110 material is 5.67 × 10⁻⁴ kg/m2·s, and the maximum erosion rate of the N80 material is 1.03 × 10⁻³ kg/m2·s. As can be seen from Figure 7, under the hydrogen medium, the N80 pipe material is more prone to corrosion than the P110 pipe material.
- (4)
- Corrosion Defect Factors: A bend pipe with a diameter of Φ0.27 × 0.02 is selected, the volume fraction of solid particles is 1%, the flow rate is 48 m/s, and the particle diameter is 2 × 10⁻⁴ m. Different corrosion defects such as double corrosion defects in the bend pipe section, three corrosion defects in the bend pipe section, and large-area corrosion defects in the bend pipe section are added to the bend pipe model for numerical simulation. The maximum erosion wear rates under different corrosion defects are 7.39 × 10⁻⁴ kg/m2·s, 1.02 × 10⁻³ kg/m2·s, and 5.06 × 10⁻³ kg/m2·s, respectively. As can be seen from Figure 8, the maximum erosion rate caused to the pipeline varies under the influence of different numbers of corrosion defects. Among them, the bend pipe with three corrosion defects has the highest maximum erosion rate, and the risk of failure is relatively high at this time. Therefore, regular inspections should be carried out to see whether there are multiple corrosion defects inside the pipeline and timely protection measures should be taken to avoid leakage accidents.
4. Conclusions
- (1)
- Drawing from an analysis of injection and extraction methods for underground energy storage pipelines and factors influencing erosion, a high-velocity gas flow model and an erosion-wear model were developed for strings. This paper examines the influence of variables like internal flow velocity, particle size, pipeline material, and wall corrosion defects on the pressure distribution near the inclined pipeline section wall, as well as the maximum erosion wear rate caused by high-speed airflow scouring.
- (2)
- The maximum erosion rate increases with the increase in particle speed, and the degree of erosion becomes larger and larger, and the erosion rate gradually increases. The maximum erosion rate of the P110 pipe material is 5.67 × 10⁻⁴ kg/m2·s, and that of the N80 pipe material is 1.03 × 10⁻³ kg/m2·s. The N80 pipe material is more susceptible to erosion than the P110 pipe material.
- (3)
- Under the influence of corrosion defect factors, the maximum erosion wear rates of the double corrosion defects in the bend pipe section, the three corrosion defects in the bend pipe section, and the large-area corrosion defects in the bend pipe section are 7.39 × 10⁻⁴ kg/m2·s, 1.02 × 10⁻³ kg/m2·s, and 8.57 × 10⁻⁴ kg/m2·s, respectively. Among them, the bend pipe with three corrosion defects has the highest maximum erosion rate, and the risk of failure is relatively high at this time. Therefore, regular inspections should be carried out to see whether there are multiple corrosion defects inside the pipeline and timely protection measures should be taken to avoid leakage accidents.
Author Contributions
Methodology, L.Z.; Software, L.L.; Validation, L.Z. and T.Y.; Investigation, J.L.; Resources, S.X.; Writing—original draft, Z.H.; Writing—review & editing, Q.L. All authors have read and agreed to the published version of the manuscript.
Funding
The authors gratefully acknowledge the financial support provided by the Science and Technology Project of China National Petroleum Corporation (2021DJ5402).
Data Availability Statement
Data sharing is not applicable.
Conflicts of Interest
The authors declare no conflict of interest.
Abbreviations
| CFD | Computational fluid dynamics |
| DPM | Discrete phase model |
| RNG | Renormalization-group |
| SM | Body force |
| ρ | Relative density |
| μeff | Effective dynamic viscosity |
| μt | Turbulent viscosity |
| p | Static pressure |
| p0 | Static pressure fluid incompressible |
| Reynolds stress | |
| Kronecker integral term | |
| k | Turbulent energy |
| ε | Turbulent energy dissipation rate |
| D | Internal diameter |
References
- Juez-Larré, J.; Machado, C.G.; Groenenberg, R.M.; Belfroid, S.S.; Yousefi, S.H. A detailed comparative performance study of underground storage of natural gas and hydrogen in the Netherlands. Int. J. Hydrogen Energy 2023, 48, 28843–28868. [Google Scholar] [CrossRef]
- Yousefi, H. Design Considerations for Developing an Underground Hydrogen Storage Facility in Porous Reservoirs. Ph.D. Thesis, University of Twente, Enschede, The Netherlands, 2021. [Google Scholar]
- Prinzhofer, A.; Moretti, I.; Françolin, J.; Pacheco, C.; d’Agostino, A.; Werly, J.; Rupin, F. Natural hydrogen continuous emission from sedimentary basins: The example of a Brazilian H2-emitting structure. Int. J. Hydrogen Energy 2019, 44, 5676–5685. [Google Scholar] [CrossRef]
- Bai, M.; Song, K.; Xu, B.; Sun, J.; Feng, F.; Chen, Z. Feasibility, limitation and prospect of H2 underground storage. Geol. Rev. 2014, 60, 748–754. [Google Scholar]
- Li, J. Development status and prospect of underground gas storage in China. Oil Gas Storage Transp. 2022, 41, 780–786. [Google Scholar]
- Fang, D.; Hou, Z.; Yue, Y.; Ren, L.; Chen, Q. A New Concept of Multifunctional Salt Cavern Hydrogen Storage Applied to the Integration of Hydrogen Energy Industry. Adv. Eng. Sci. 2022, 54, 128–135. [Google Scholar]
- Fu, P.; Luo, M.; Xia, Y.; Li, G.; Ban, F. Research On the Status Quo and Difficulties of Hydrogen Underground Storage Technology. China Well Miner. Salt 2020, 51, 19–23. [Google Scholar]
- Wang, Z.; Yang, H.; Zhang, Y. Research Progress on Erosion Theory and Prediction of Gas Storage String. Surf. Technol. 2023, 52, 91–110. [Google Scholar]
- Xu, R. Simulation analysis of vertical gas well production string erosion model. Compr. Corros. Control 2020, 34, 58–66. [Google Scholar]
- He, Z.; Yi, W.; Li, J.; Sun, P.; Liu, P.; Jiang, J. Analysis of Erosion Law and Ultimate Gas Injection and Production Capacity of Injection and Production Pipe String in Wen 23 Gas Storage. Pet. Pipes Instrum. 2020, 6, 46–49. [Google Scholar]
- Liu, W.; Zhang, Z.; Chen, J.; Jiang, D.; Wu, F.; Fan, J.; Li, Y. Feasibility evaluation of large-scale underground hydrogen storage in bedded salt rocks of China: A case study in Jiangsu province. Energy 2020, 198, 117348. [Google Scholar] [CrossRef]
- Wu, L.; Xiang, F.; Shi, B.; Zhang, Y.; Zhang, X.; Zhai, X.; Lou, Y. Optimization of erosion resistant structure of gas pipeline bends based on numerical simulation. Mater. Prot. 2021, 54, 50–57. [Google Scholar]
- Meng, W.; Zhang, J.; Zhang, C.; Huang, L.; Zhang, R.; Zhang, L.; Ren, S. Coupling test of steel erosion and CO2 corrosion for underground pipe columns. J. China Univ. Pet. 2021, 5, 104–110. [Google Scholar]
- Sletfjerding, E.; Gudmundsson, J.S. Friction factor directly from roughness measurements. J. Energy Resour. Technol. 2003, 125, 126–130. [Google Scholar] [CrossRef]
- Liu, M.; Wang, J.; Yan, Y.; Xie, W.; Yang, X.; Yan, X.; Zhang, Y. Numerical simulation of fluid state along the well string of underground gas storage. Pet. Drill. Prod. Technol. 2017, 39, 449–454. [Google Scholar]
- Zeng, L.; Zhang, G.A.; Guo, X.P. Erosion–corrosion at different locations of X65 carbon steel elbow. Corros. Sci. 2014, 85, 318–330. [Google Scholar] [CrossRef]
- Mazumder, Q.H.; Shirazi, S.A.; McLaury, B.S.; Shadley, J.R.; Rybicki, E.F. Development and validation of a mechanistic model to predict solid particle erosion in multiphase flow. Wear 2005, 259, 203–207. [Google Scholar] [CrossRef]
- Tabakoff, W.; Kotwal, R.; Hamed, A. Erosion study of different materials affected by coal ash particles. Wear 1979, 52, 161–173. [Google Scholar] [CrossRef]
- Suzki, M.; Inaba, K.; Yammoto, M. Numerical simulation of sand erosion in a square-section 90-degree bend. J. Fluid Sci. Technol. 2008, 3, 868–880. [Google Scholar] [CrossRef]
- Tijsseling, A.S. Fluid-structure interaction in liquid-filled pipe systems: A review. J. Fluids Struct. 1996, 10, 109–146. [Google Scholar] [CrossRef]
- Zhang, S.; Yan, Y.; Shi, L.; Li, L.; Zhao, L.; Wang, R.; Yan, X. A semi-empirical model for underground gas storage injection-production string time series remaining useful life analysis in process safety operation. Process Saf. Environ. Prot. 2021, 154, 1–17. [Google Scholar] [CrossRef]
- Pan, L.; Oldenburg, C.M.; Freifeld, B.M.; Jordan, P.D. Modeling the Aliso Canyon underground gas storage well blowout and kill operations using the coupled well-reservoir simulator T2 Well. J. Pet. Sci. Eng. 2018, 161, 158–174. [Google Scholar] [CrossRef]
- Zhang, S.; Yan, Y.; Sheng, Z.; Yan, X. Uncertainty failure risk quantitative assessments for underground gas storage near-wellbore area. J. Energy Storage 2021, 36, 102393. [Google Scholar] [CrossRef]
- Bai, M.; Shen, A.; Meng, L.; Zhu, J.; Song, K. Well completion issues for underground gas storage in oil and gas reservoirs in China. J. Pet. Sci. Eng. 2018, 171, 584–591. [Google Scholar] [CrossRef]
- Dharmananda, K.; Kingsbury, N.; Singh, H. Underground gas storage: Issues beneath the surface. In Proceedings of the SPE Asia Pacific Oil and Gas Conference and Exhibition, Perth, Australia, 18–20 October 2004; SPE: Richardson, TX, USA, 2004; p. SPE-88491. [Google Scholar]
- Stack, M.M.; Abdelrahman, S.M. A CFD model of particle concentration effects on erosion–corrosion of Fe in aqueous conditions. Wear 2011, 273, 38–42. [Google Scholar] [CrossRef]
- Michalski, J.; Bünger, U.; Crotogino, F.; Donadei, S.; Schneider, G.S.; Pregger, T.; Heide, D. Hydrogen generation by electrolysis and storage in salt caverns: Potentials, economics and systems aspects with regard to the German energy transition. Int. J. Hydrogen Energy 2017, 42, 13427–13443. [Google Scholar] [CrossRef]
- Zhou, Q.; Zhang, J. Overview of underground hydrogen storage technology research. Oil Gas New Energy 2022, 34, 1–6. [Google Scholar]
- Zhang, H.; Tan, Y.; Yang, D.; Trias, F.X.; Jiang, S.; Sheng, Y.; Oliva, A. Numerical investigation of the location of maximum erosive wear damage in elbow: Effect of slurry velocity, bend orientation and angle of elbow. Powder Technol. 2012, 217, 467–476. [Google Scholar] [CrossRef]
- Tan, Y.; Zhang, H.; Yang, D.; Jiang, S.; Song, J.; Sheng, Y. Numerical simulation of concrete pumping process and investigation of wear mechanism of the piping wall. Tribol. Int. 2012, 46, 137–144. [Google Scholar] [CrossRef]
- Amid, A.; Mignard, D.; Wilkinson, M. Seasonal storage of hydrogen in a depleted natural gas reservoir. Int. J. Hydrogen Energy 2016, 41, 5549–5558. [Google Scholar] [CrossRef]
- Ugarte, E.R.; Salehi, S. A review on well integrity issues for underground hydrogen storage. J. Energy Resour. Technol. 2022, 144, 042001. [Google Scholar] [CrossRef]
- Xue, W.; Wang, Y.; Chen, Z.; Liu, H. An integrated model with stable numerical methods for fractured underground gas storage. J. Clean. Prod. 2023, 393, 136268. [Google Scholar] [CrossRef]
- Li, J.; Li, J.; Wang, Y.; Zhao, J.; Li, H.; Yu, B. Research progress and development trend exploration of key technologies for hydrogen energy storage and transportation. Oil Gas Storage Transp. 2023, 42, 856–871. [Google Scholar]
- Cheng, C. Numerical Simulation Study on Erosion Law of Test String in Offshore Gas Well. Master’s Thesis, Southwest Petroleum University, Chengdu, China, 2015. [Google Scholar]
Figure 1.
Model of string for underground hydrogen storage.

Figure 2.
Pressure distribution inside string.

Figure 3.
Particle trajectories in tube.

Figure 4.
Erosion distribution.

Figure 5.
Maximum erosion rate of string under different flow rates.

Figure 6.
Maximum erosion rate of string under different particle size.

Figure 7.
Maximum erosion rate of string under different pipe materials.

Figure 8.
Maximum erosion rate of string under different corrosion defects.


Table 1.
Setting of model and boundary conditions.
| Boundary | Continuous Phase | Discrete Phase |
|---|---|---|
| Model | κ-ε Model | DPM Model |
| Inlet | Velocity Inlet | Escape |
| Outlet | Free Outflow | Escape |
| Wall | No-slip Boundary | Reflection |
Table 2.
Parameters of string erosion simulation condition.
| Number | Pipe Diameter (m) | Pipe Material | Particle Diameter (μm) | Flow Speed (m/s) | Corrosion Defect Factors |
|---|---|---|---|---|---|
| 1 | 0.27 | N80 | 200 | 48 | No corrosion defects |
| 2 | 0.34 | N80 | 200 | 48 | No corrosion defects |
| 3 | 0.27 | P110 | 200 | 48 | No corrosion defects |
| 4 | 0.27 | N80 | 50 | 48 | No corrosion defects |
| 5 | 0.27 | N80 | 100 | 48 | No corrosion defects |
| 6 | 0.27 | N80 | 500 | 48 | No corrosion defects |
| 7 | 0.27 | N80 | 200 | 24 | No corrosion defects |
| 8 | 0.27 | N80 | 200 | 36 | No corrosion defects |
| 9 | 0.27 | N80 | 200 | 60 | No corrosion defects |
| 10 | 0.27 | N80 | 200 | 72 | No corrosion defects |
| 11 | 0.27 | N80 | 200 | 84 | No corrosion defects |
| 12 | 0.27 | N80 | 200 | 48 | Double corrosion defects in the bent pipe section |
| 13 | 0.27 | N80 | 200 | 48 | Triple corrosion defects in the bent pipe section |
| 14 | 0.27 | N80 | 200 | 48 | Large area corrosion defects in the bent pipe section |
Table 3.
Experimental and numerical simulation results of string erosion.
| Cumulative Duration (h) | Experimental Erosion Weight Loss (mg) | Simulated Erosion Weight Loss (mg) | Error (%) |
|---|---|---|---|
| 1 | 1.56 | 1.65 | 4.2 |
| 2 | 3.16 | 3.29 | 4.3 |
| 3 | 5.45 | 4.94 | 1.7 |
| 4 | 6.66 | 6.58 | 1.2 |
Disclaimer/Publisher’s Note: The statements, opinions and data contained in all publications are solely those of the individual author(s) and contributor(s) and not of MDPI and/or the editor(s). MDPI and/or the editor(s) disclaim responsibility for any injury to people or property resulting from any ideas, methods, instructions or products referred to in the content. |
© 2023 by the authors. Licensee MDPI, Basel, Switzerland. This article is an open access article distributed under the terms and conditions of the Creative Commons Attribution (CC BY) license (https://creativecommons.org/licenses/by/4.0/).
Share and Cite
MDPI and ACS Style
Zhu, L.; Li, L.; Luo, J.; Han, Z.; Xie, S.; Yu, T.; Liu, Q. Investigating Erosion of String in Underground Hydrogen Storage under High Flow Velocity. Processes 2023, 11, 2894. https://doi.org/10.3390/pr11102894
AMA Style
Zhu L, Li L, Luo J, Han Z, Xie S, Yu T, Liu Q. Investigating Erosion of String in Underground Hydrogen Storage under High Flow Velocity. Processes. 2023; 11(10):2894. https://doi.org/10.3390/pr11102894
Chicago/Turabian StyleZhu, Lixia, Lifeng Li, Jinheng Luo, Ziyue Han, Shuyi Xie, Tao Yu, and Qing Liu. 2023. "Investigating Erosion of String in Underground Hydrogen Storage under High Flow Velocity" Processes 11, no. 10: 2894. https://doi.org/10.3390/pr11102894
Note that from the first issue of 2016, this journal uses article numbers instead of page numbers. See further details here.