


Optimization of the Effect of Laser Power Bed Fusion 3D Printing during the Milling Process Using Hybrid Artificial Neural Networks with Particle Swarm Optimization and Genetic Algorithms
 , , , , ,
Abstract
:1. Introduction
2. Methodology
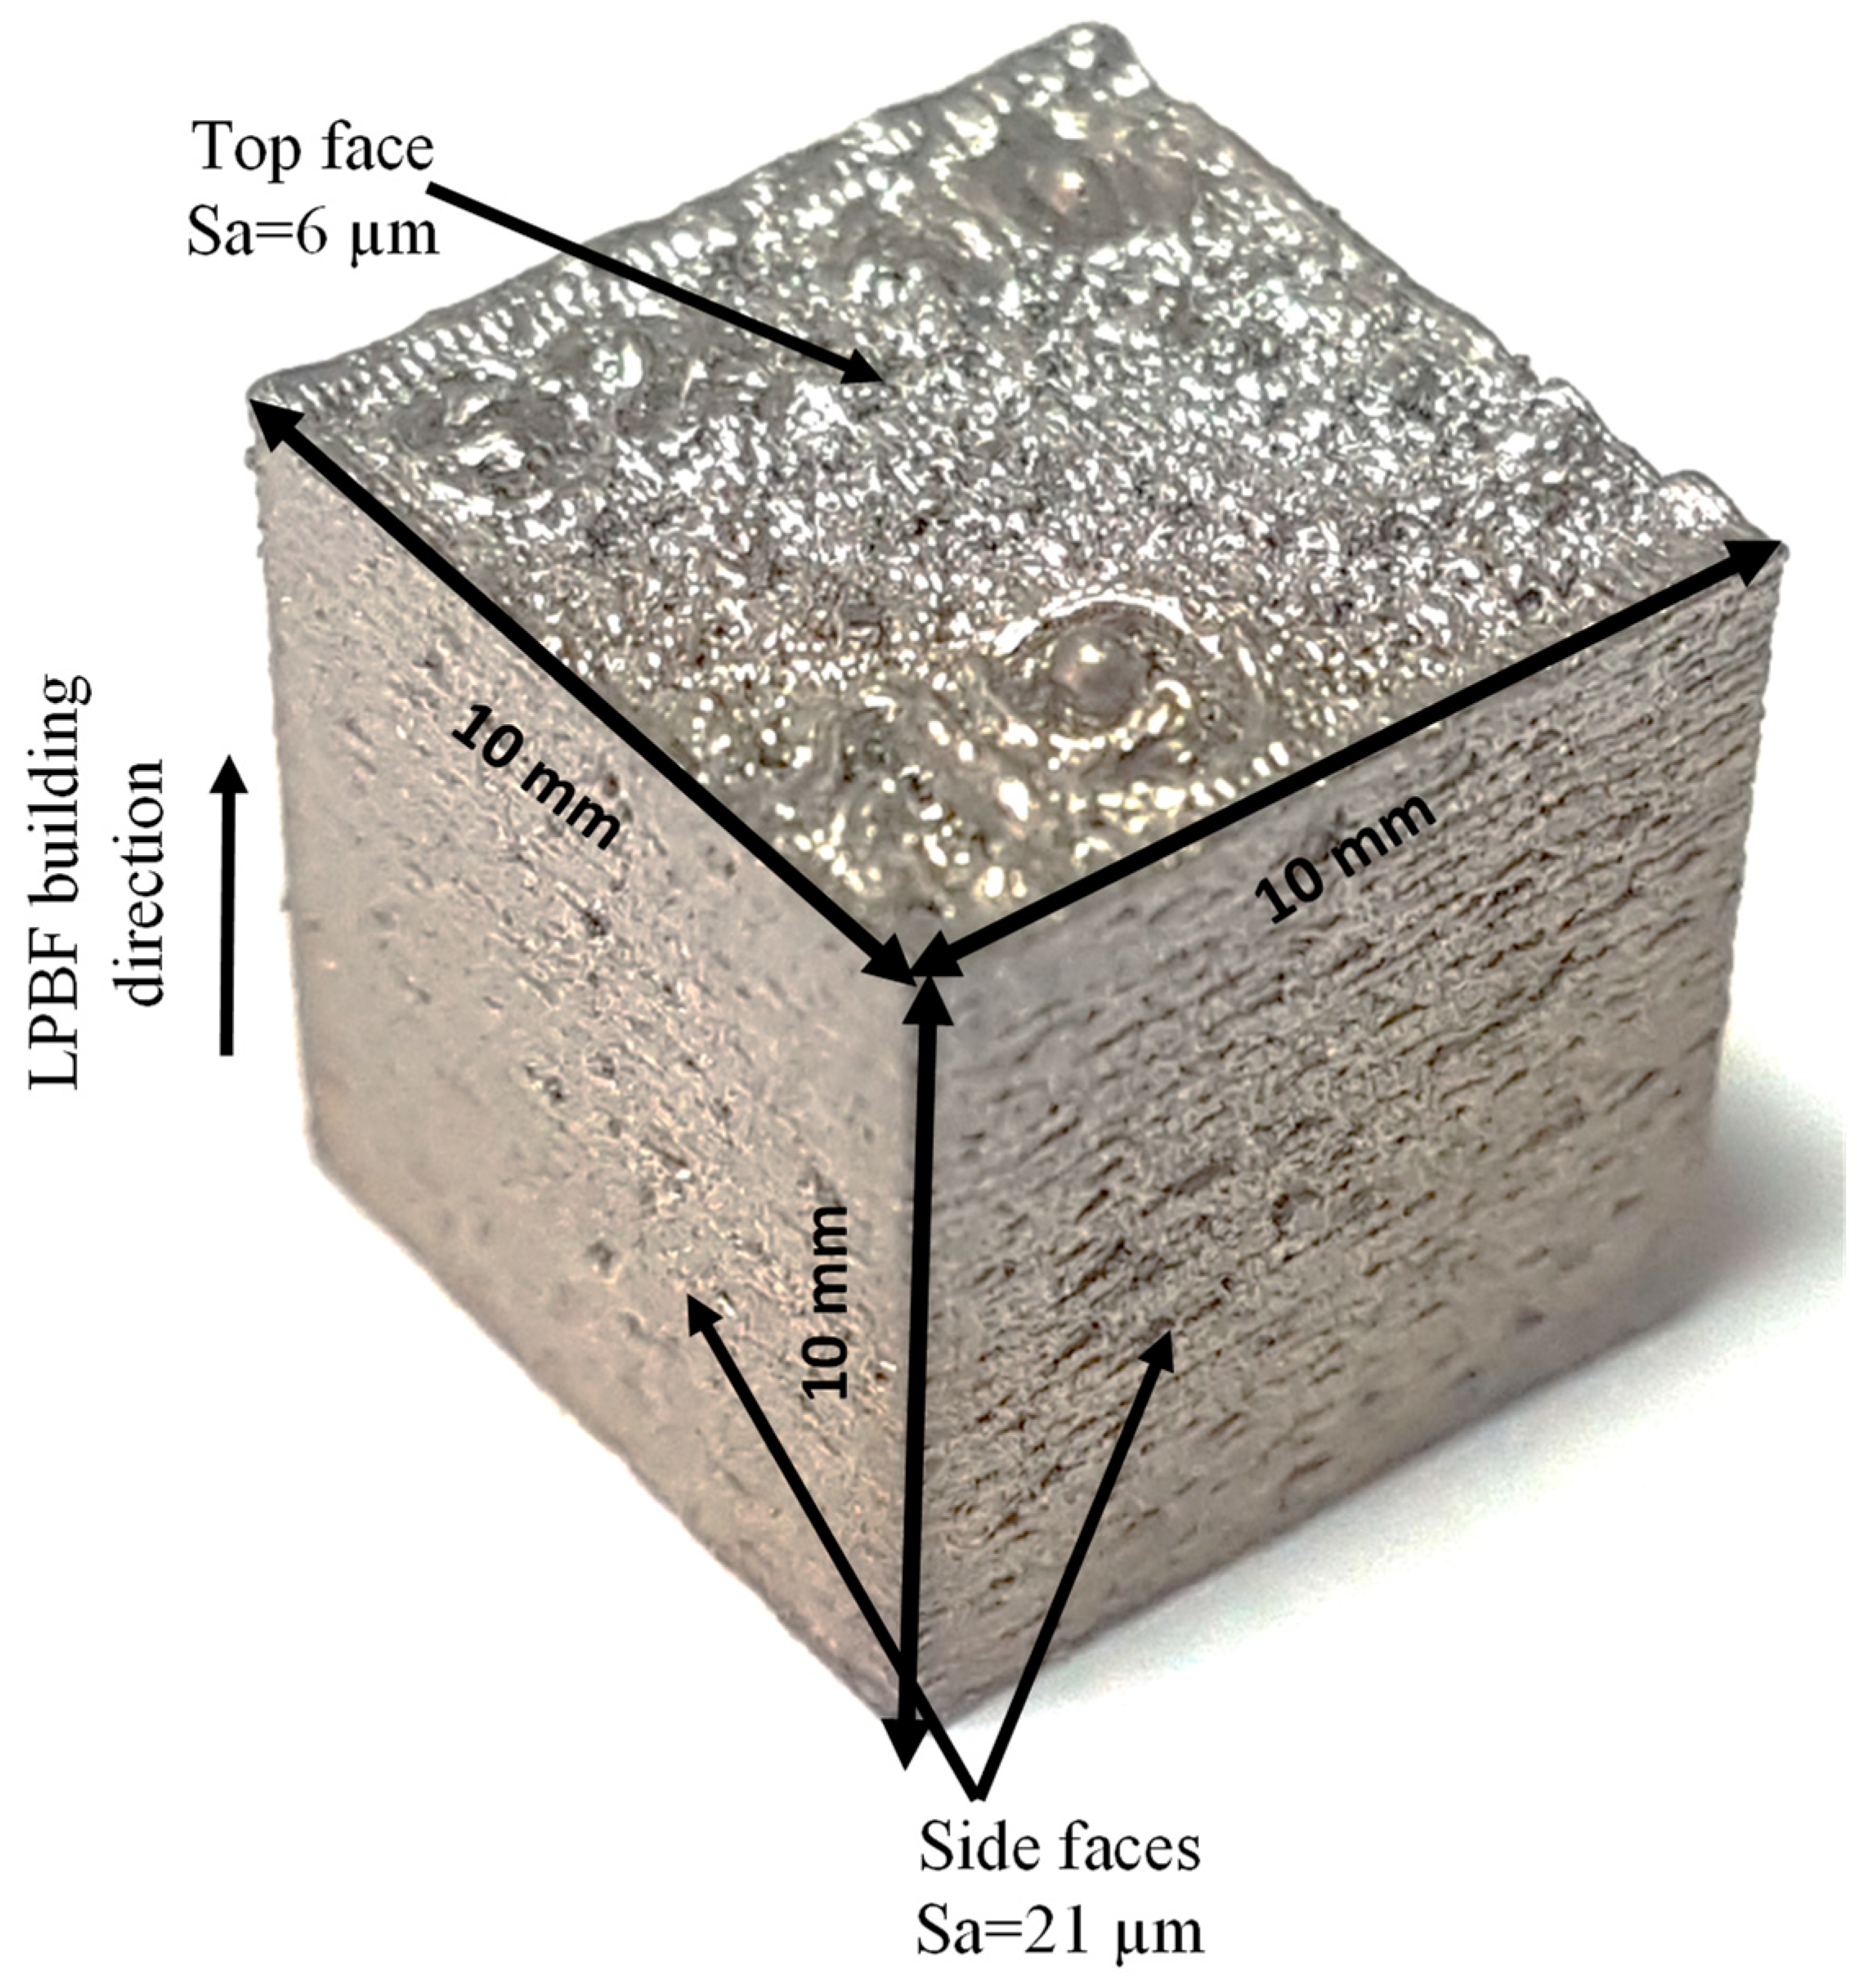
2.1. Material Details
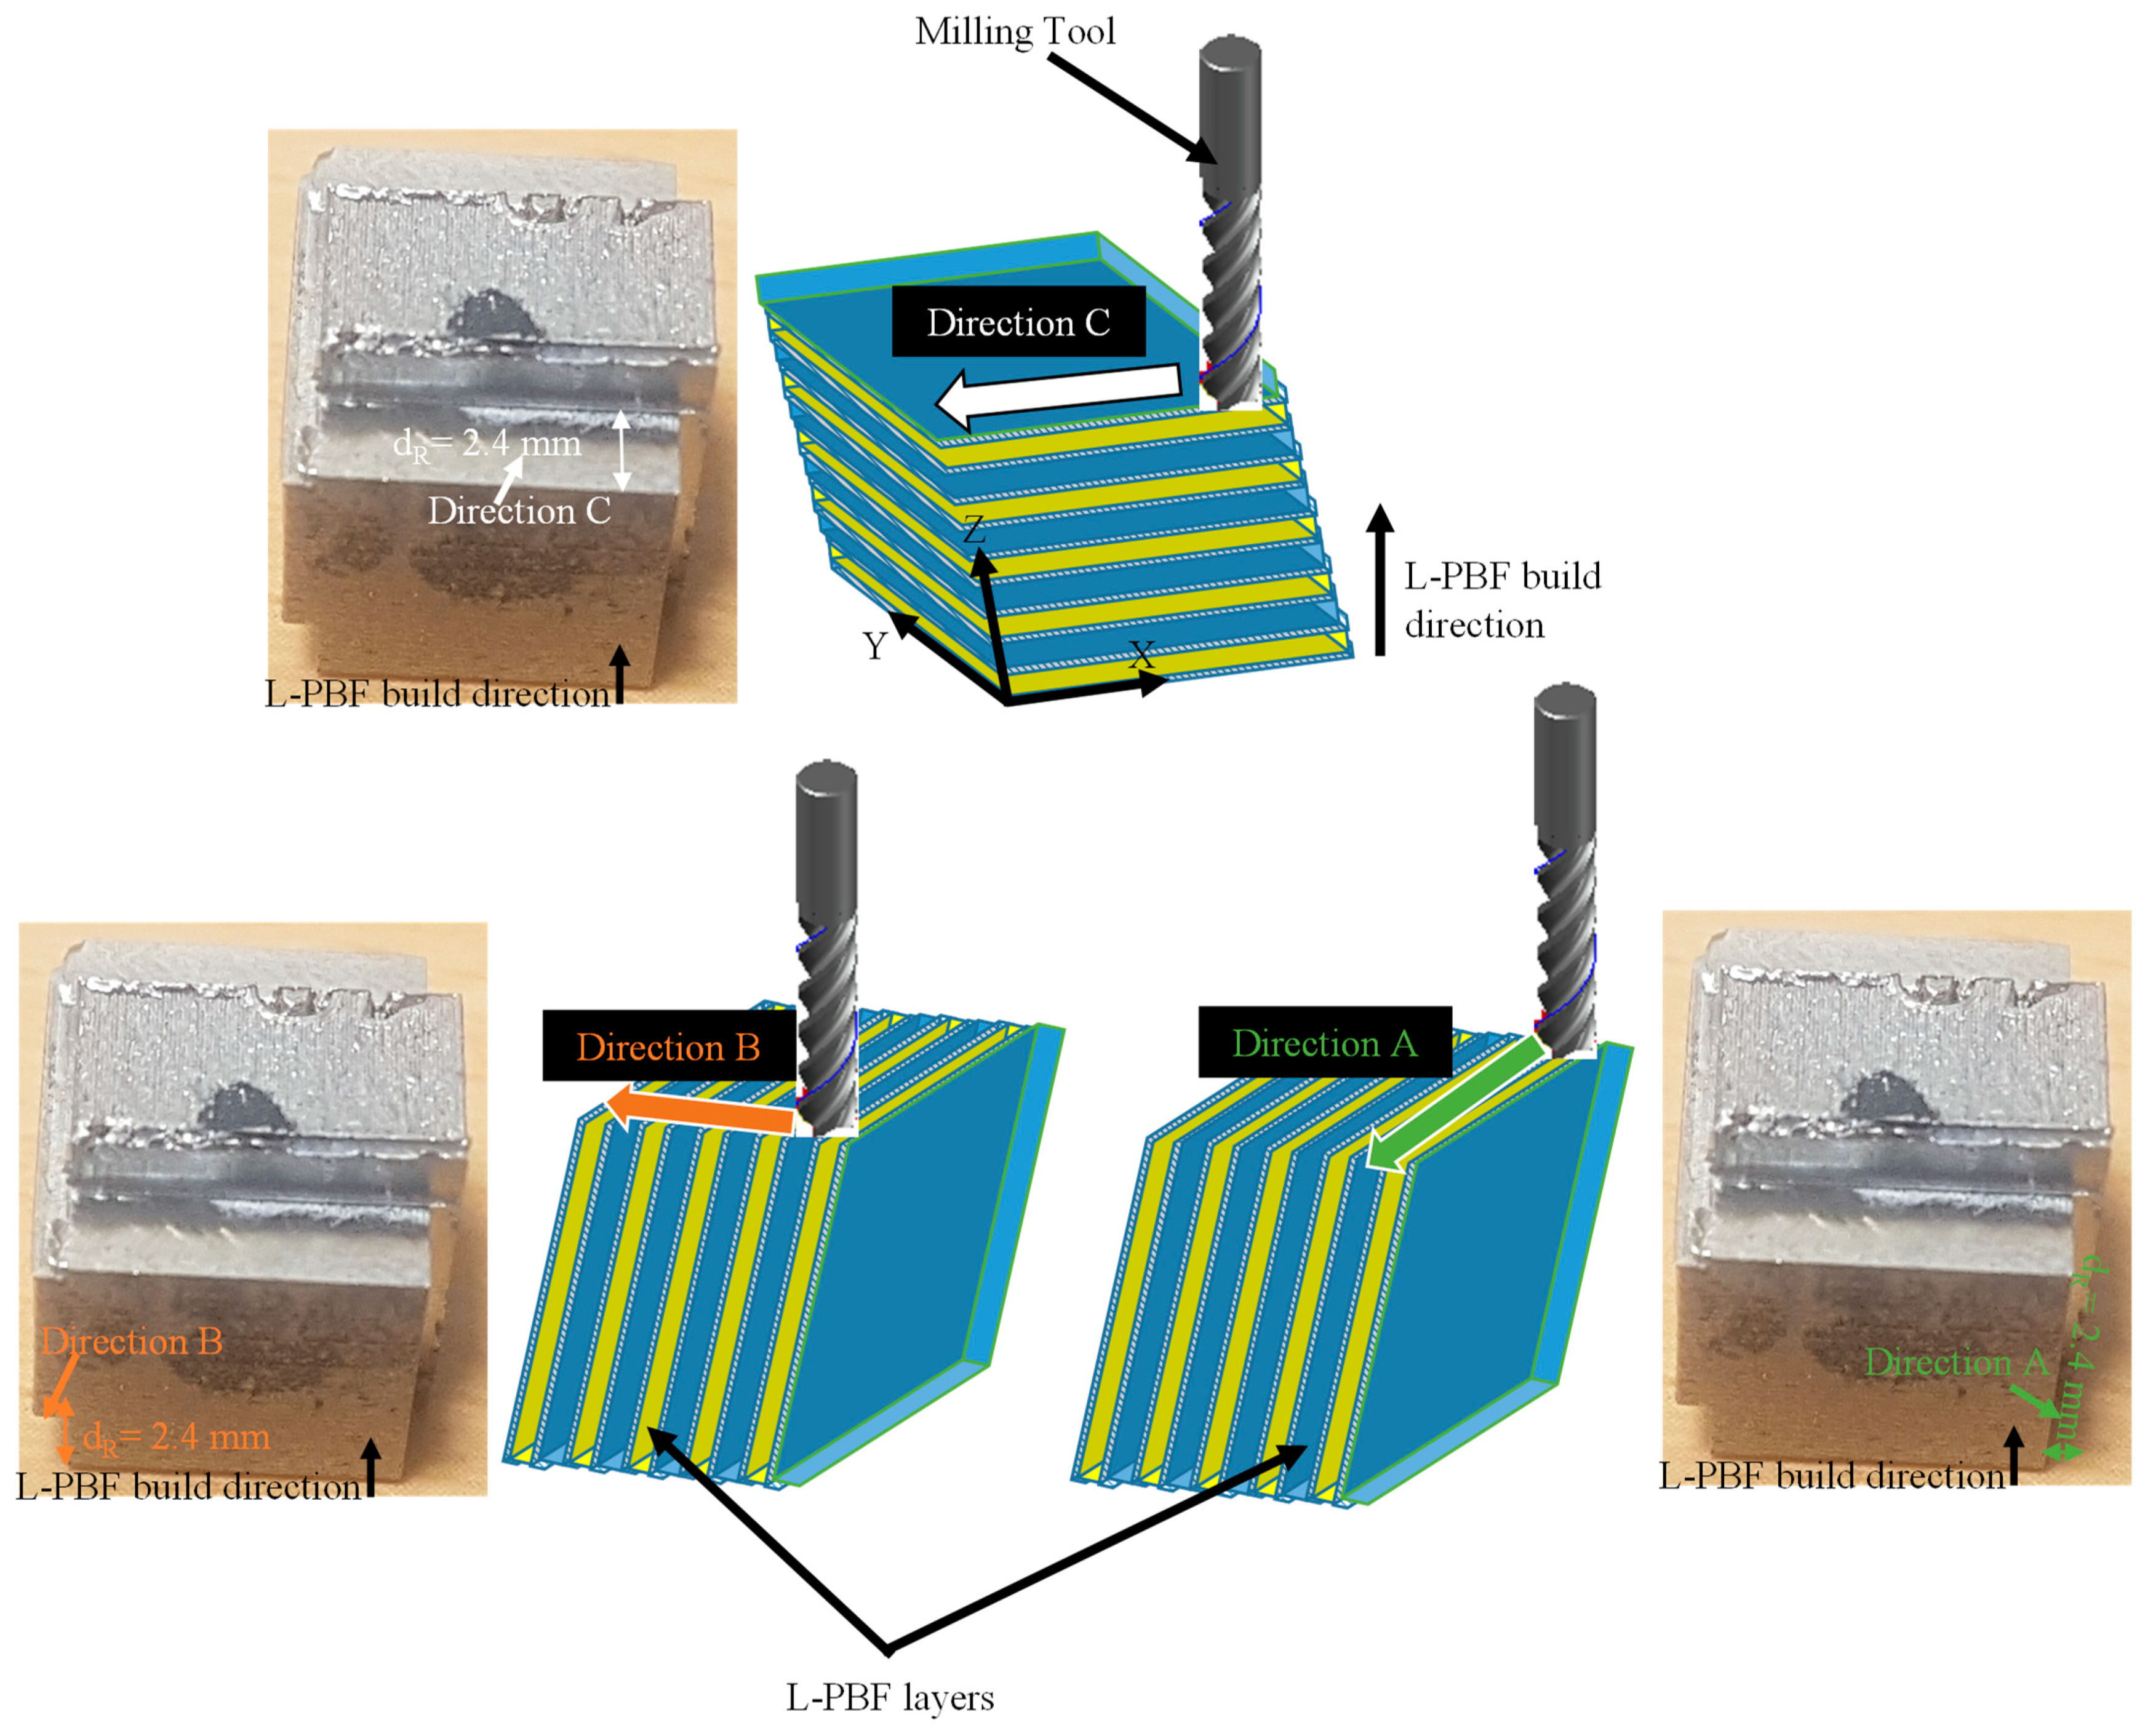
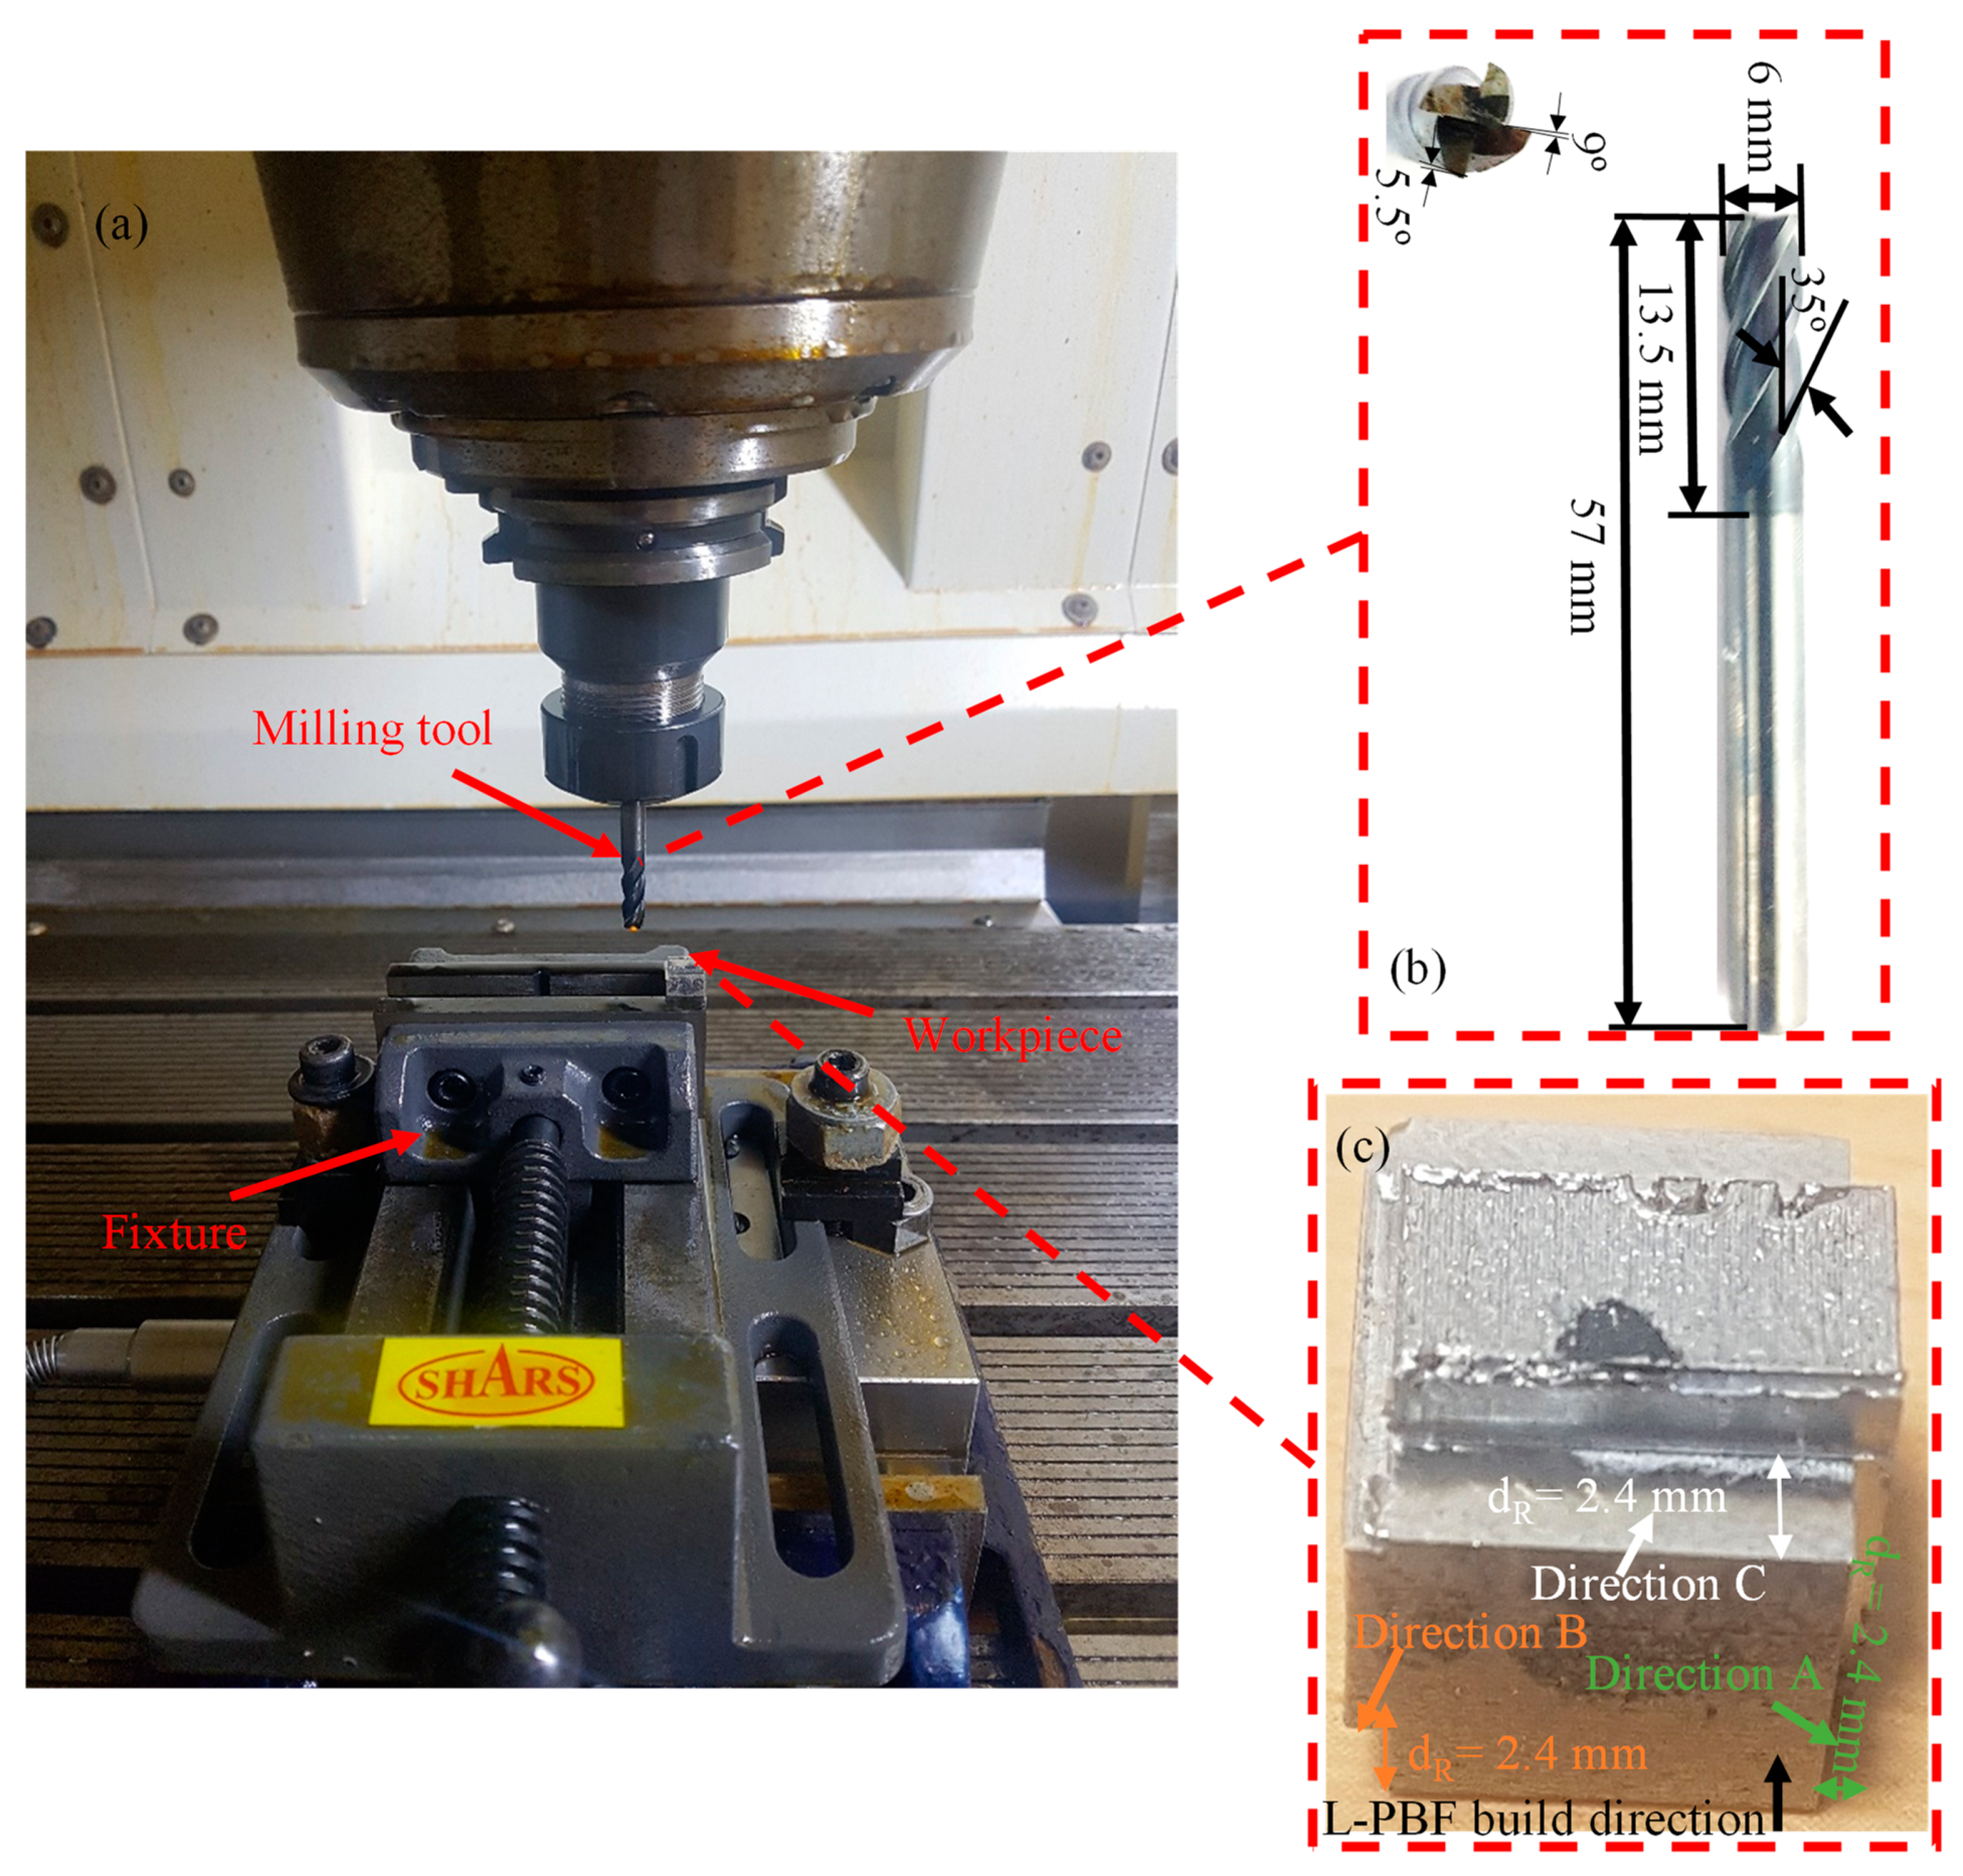
2.2. Milling Options and Measurement Setups
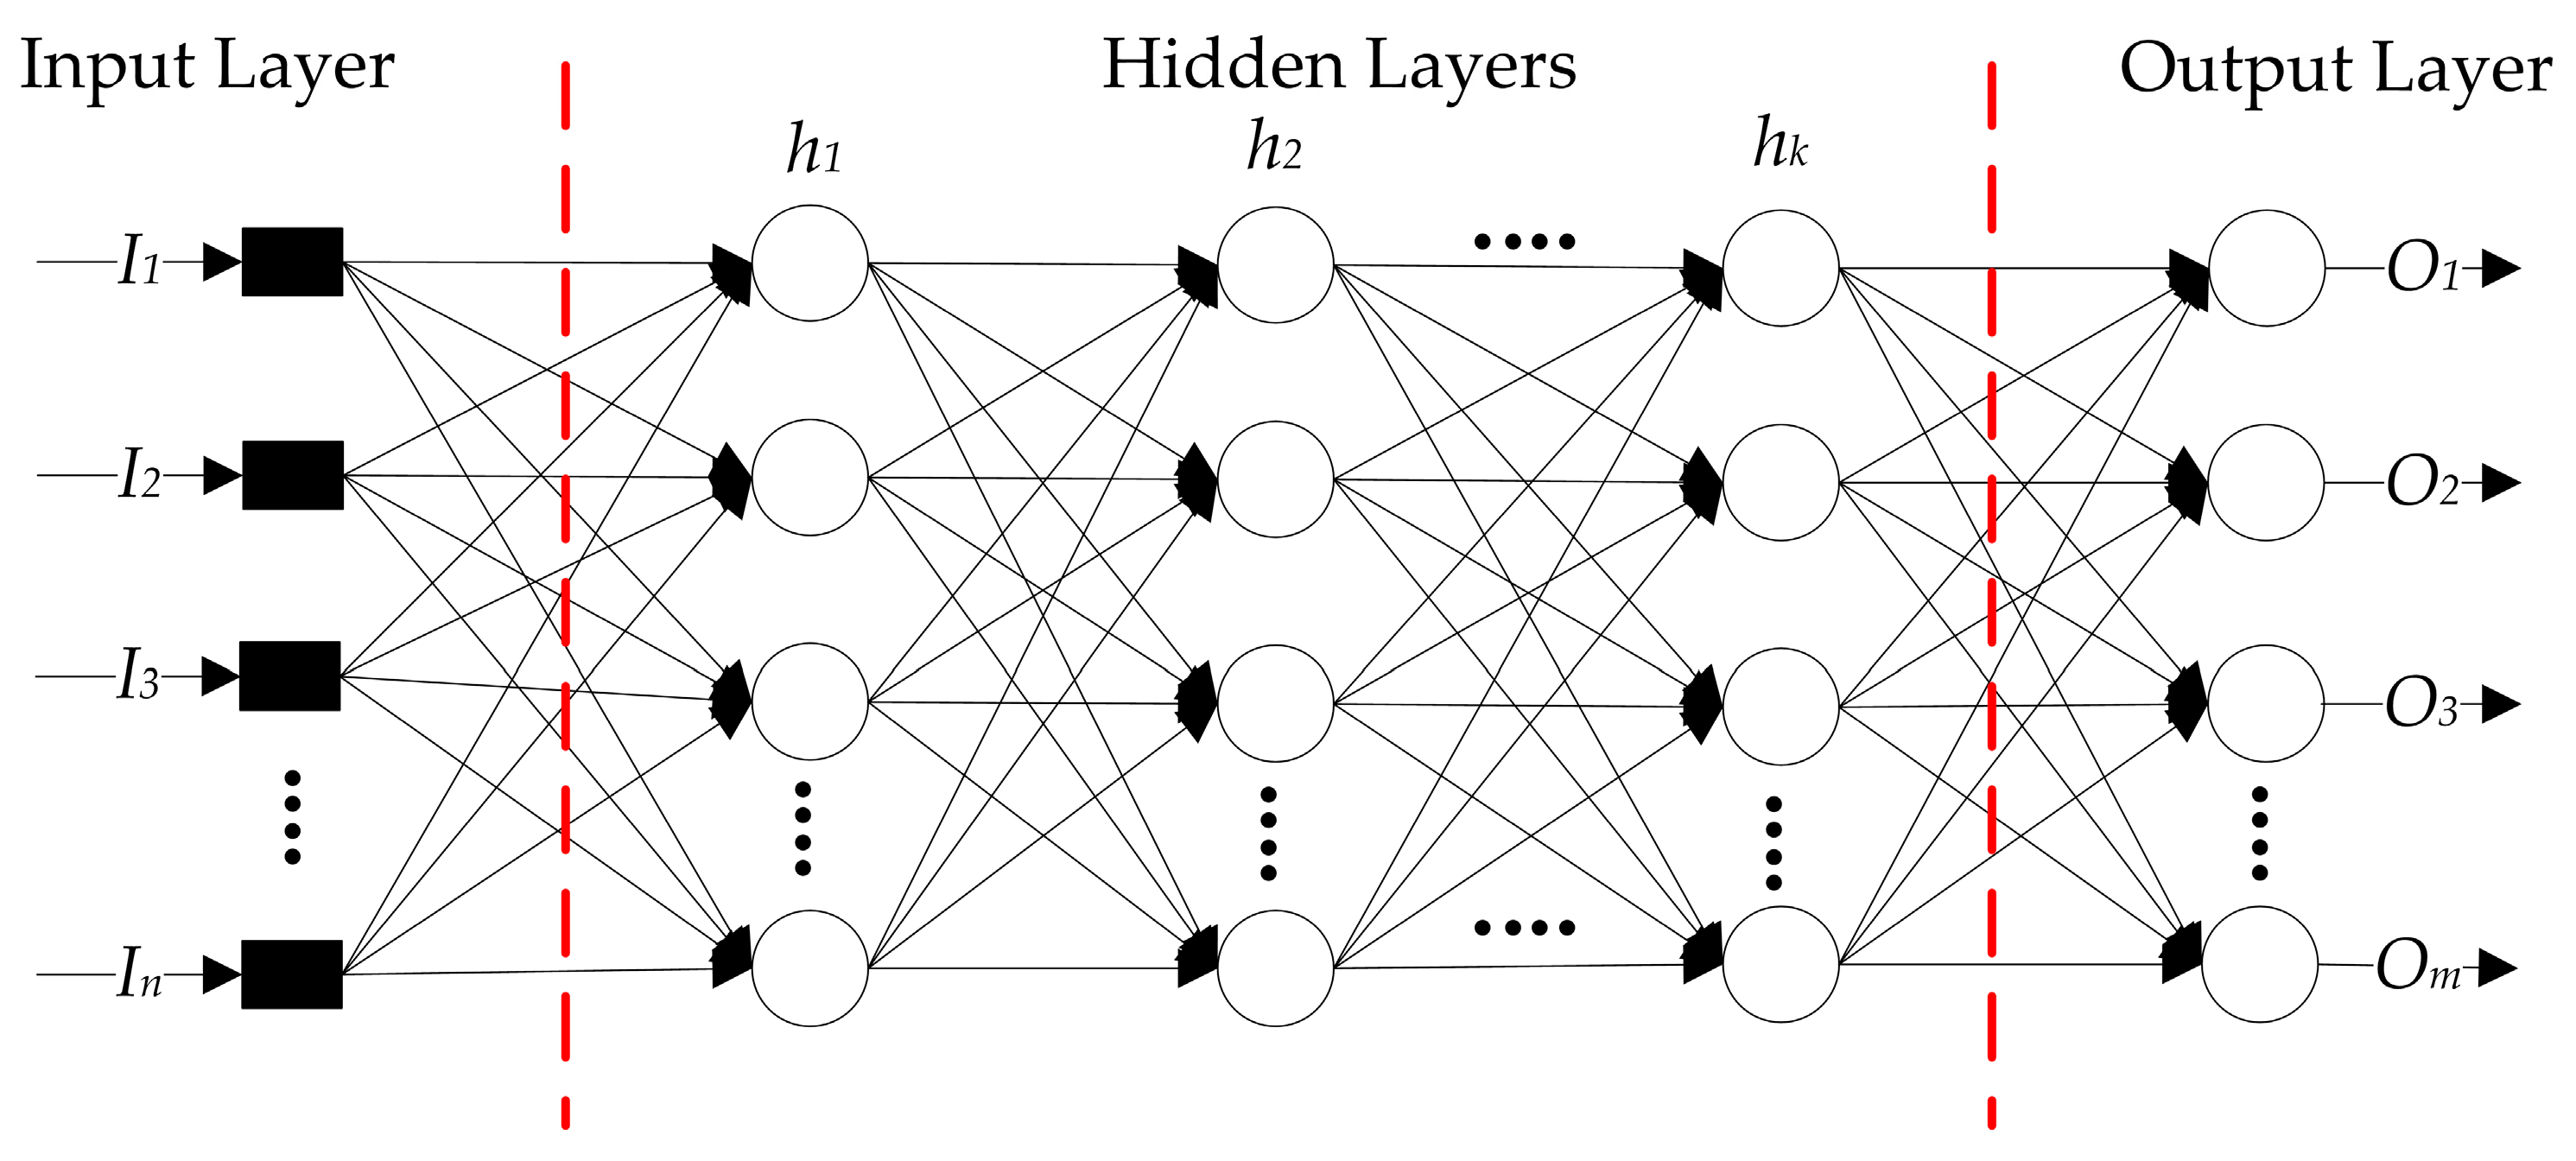
2.3. Artificial Neural Networks
2.4. Hybrid Neural Network Algorithm with PSO and the GA
2.4.1. Genetic Algorithm
| Algorithm 1: General pseudocode of the GA. |
| Begin j = 1 and MaxIt; /* j is an integer value, j > 0, and MaxIt is the maximum integer number of iterations*/ Initial_Population P(j); Calculate P(j); while j < MaxIt do P’(j) = Selection_Parent P(j); Crossover P’(j); Mutate P’(j); Calculate P’(j); P(j + 1) = Replace (P(j), P’(j)); j = j + 1; end while end begin |
2.4.2. Particle Swarm Optimization
| Algorithm 2: General pseudocode of the PSO. |
| Begin k = 1; Initial_Swarm for i = 1: S do /* S is the number of particles in the swarm */ Randomly initialize the position the velocity of particle i; Initialize the best known position of particle i: pi ← xi; if f(pi) < f(Ψ) then Modify the best-known position of the swarm: Ψ ← pi; end if end for while k < MaxIt do for each particle i = 1: S do for each dimension j = 1: n do Generate random numbers: r1, r2 ~ U(0, 1); Modify the velocity of particle i according to vi,d ← w vi,d + c1 r1 (pi,d − xi,d) + c1 r1 (Ψ d − xi,d); end for Modify the position of particle i: xi ← xi + vi; if f(xi) < f(pi) then Modify the best-known position of the particle: pi ← xi; if f(pi) < f(Ψ) then Modify the best-known position of the swarm: Ψ ← pi; end if end if k = k + 1; end for end while end begin |
3. Results and Discussions
3.1. ANOVA Results
3.2. Optimization of the ANN
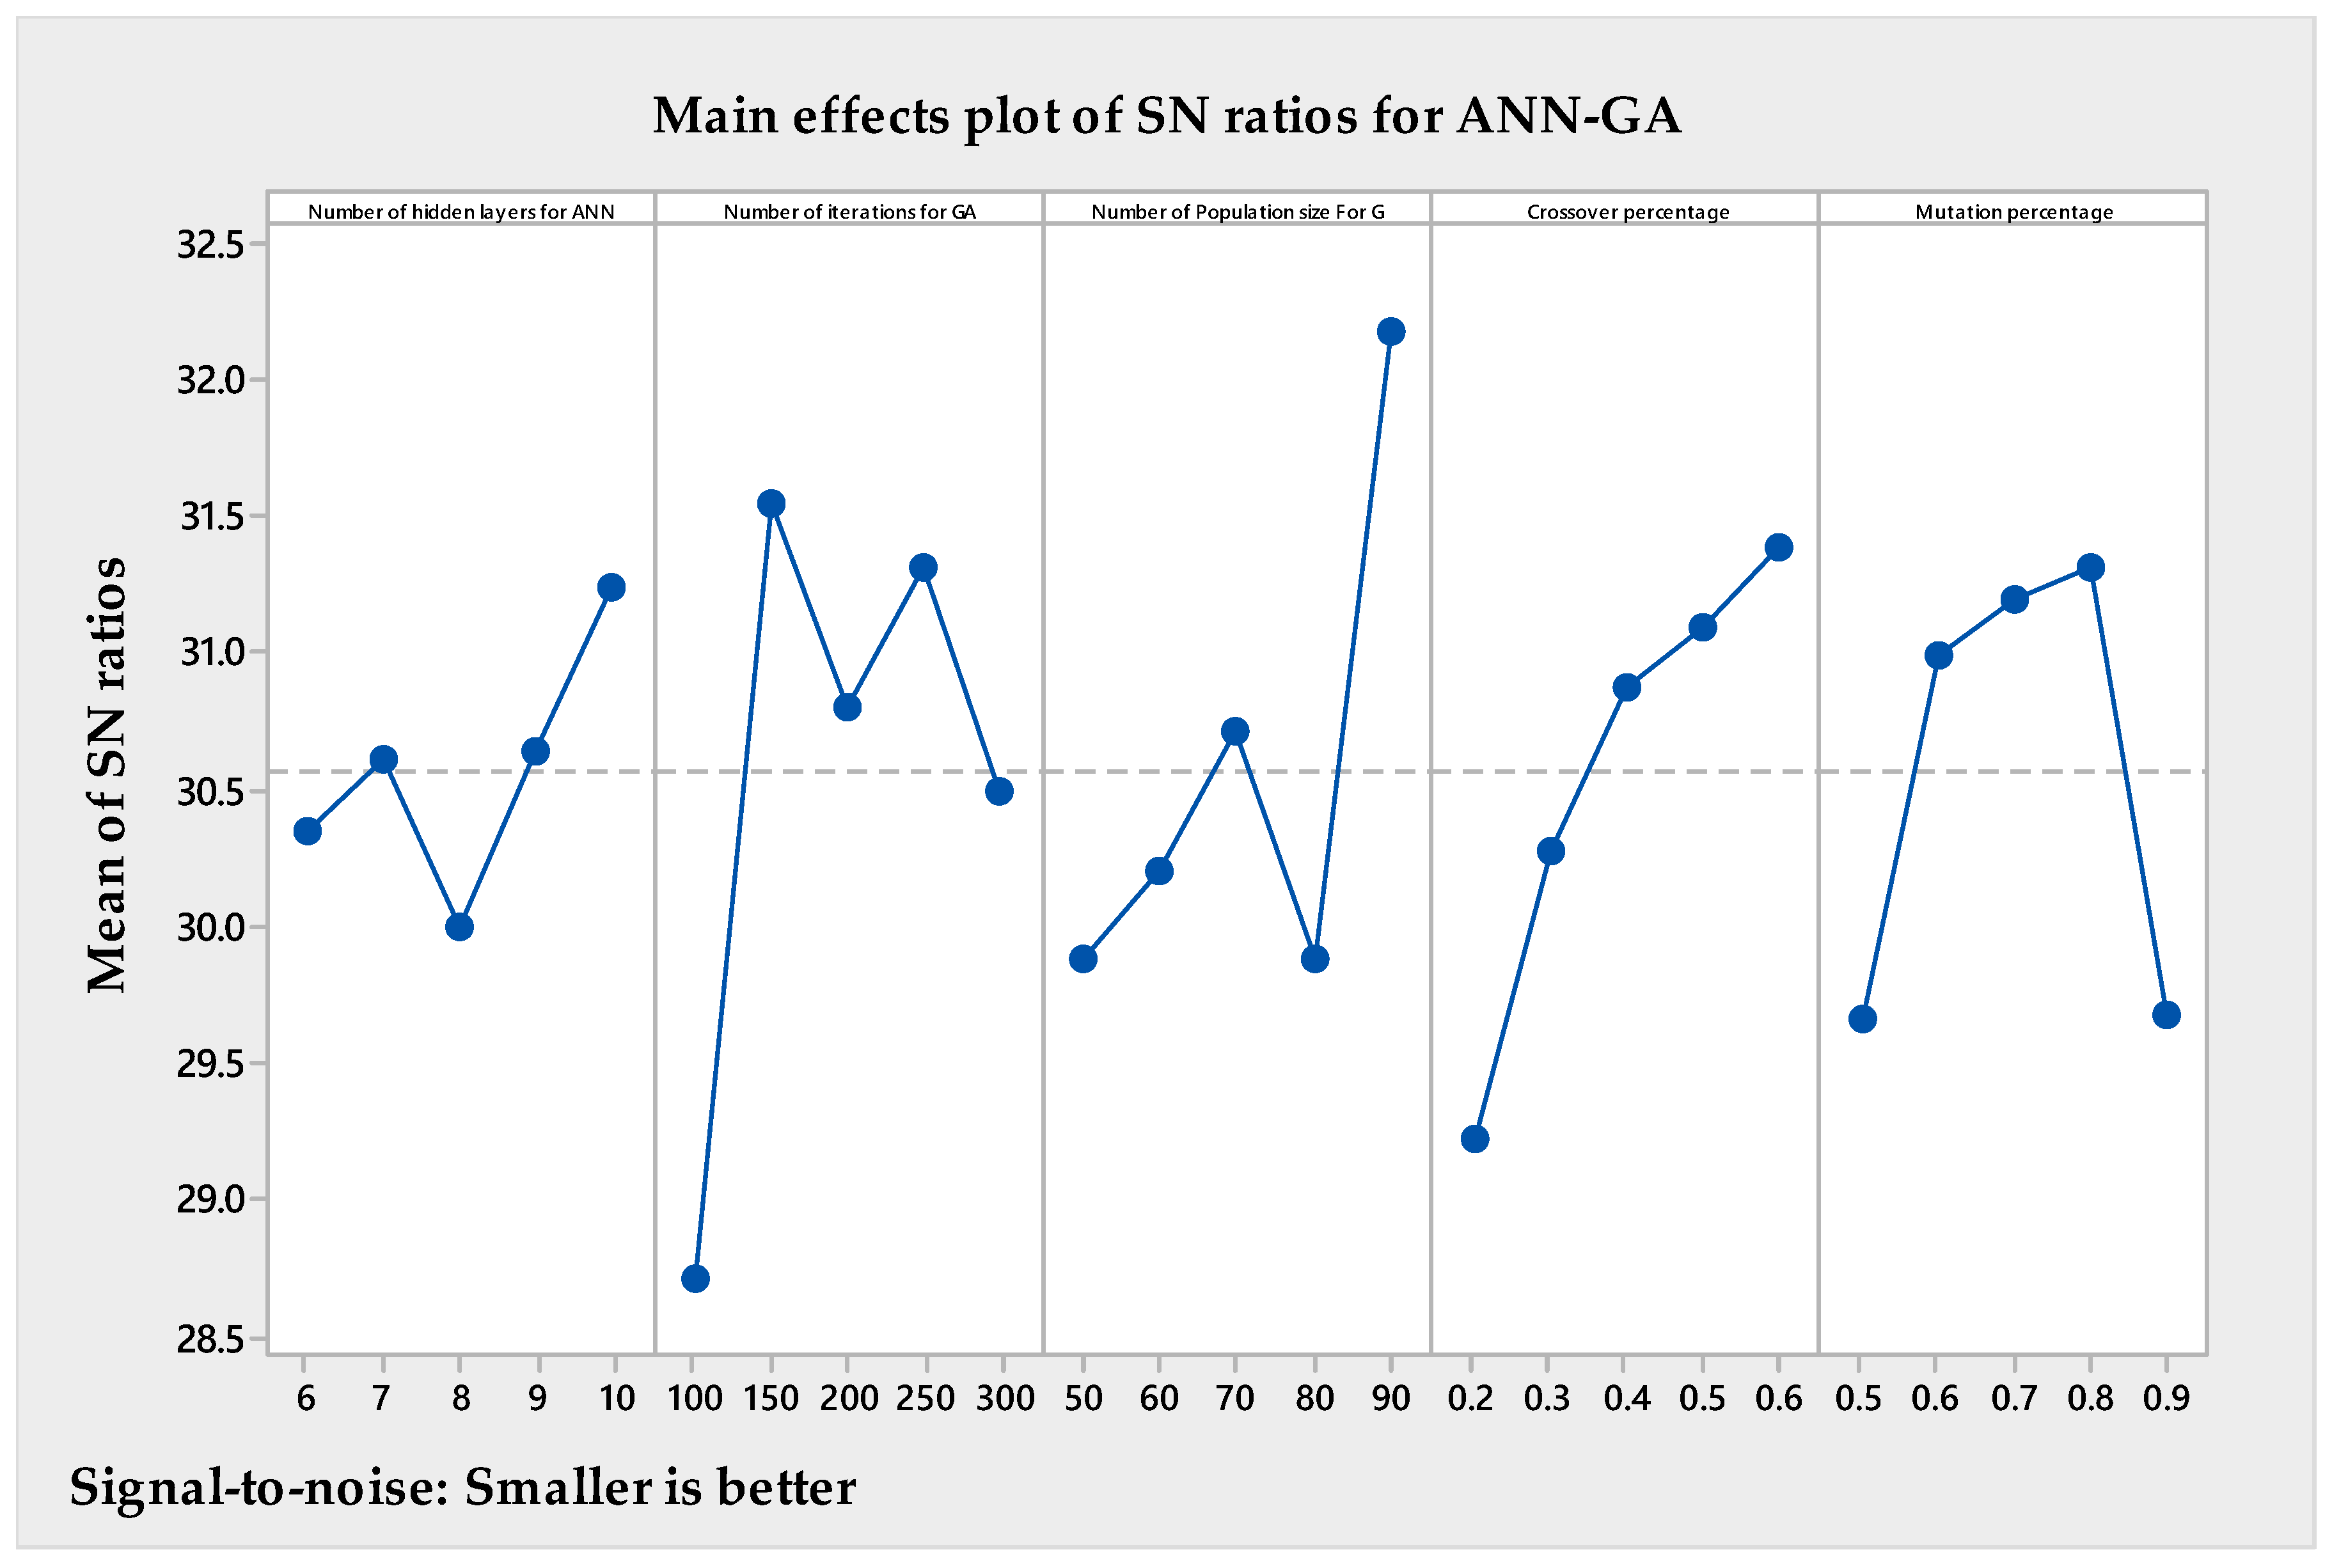
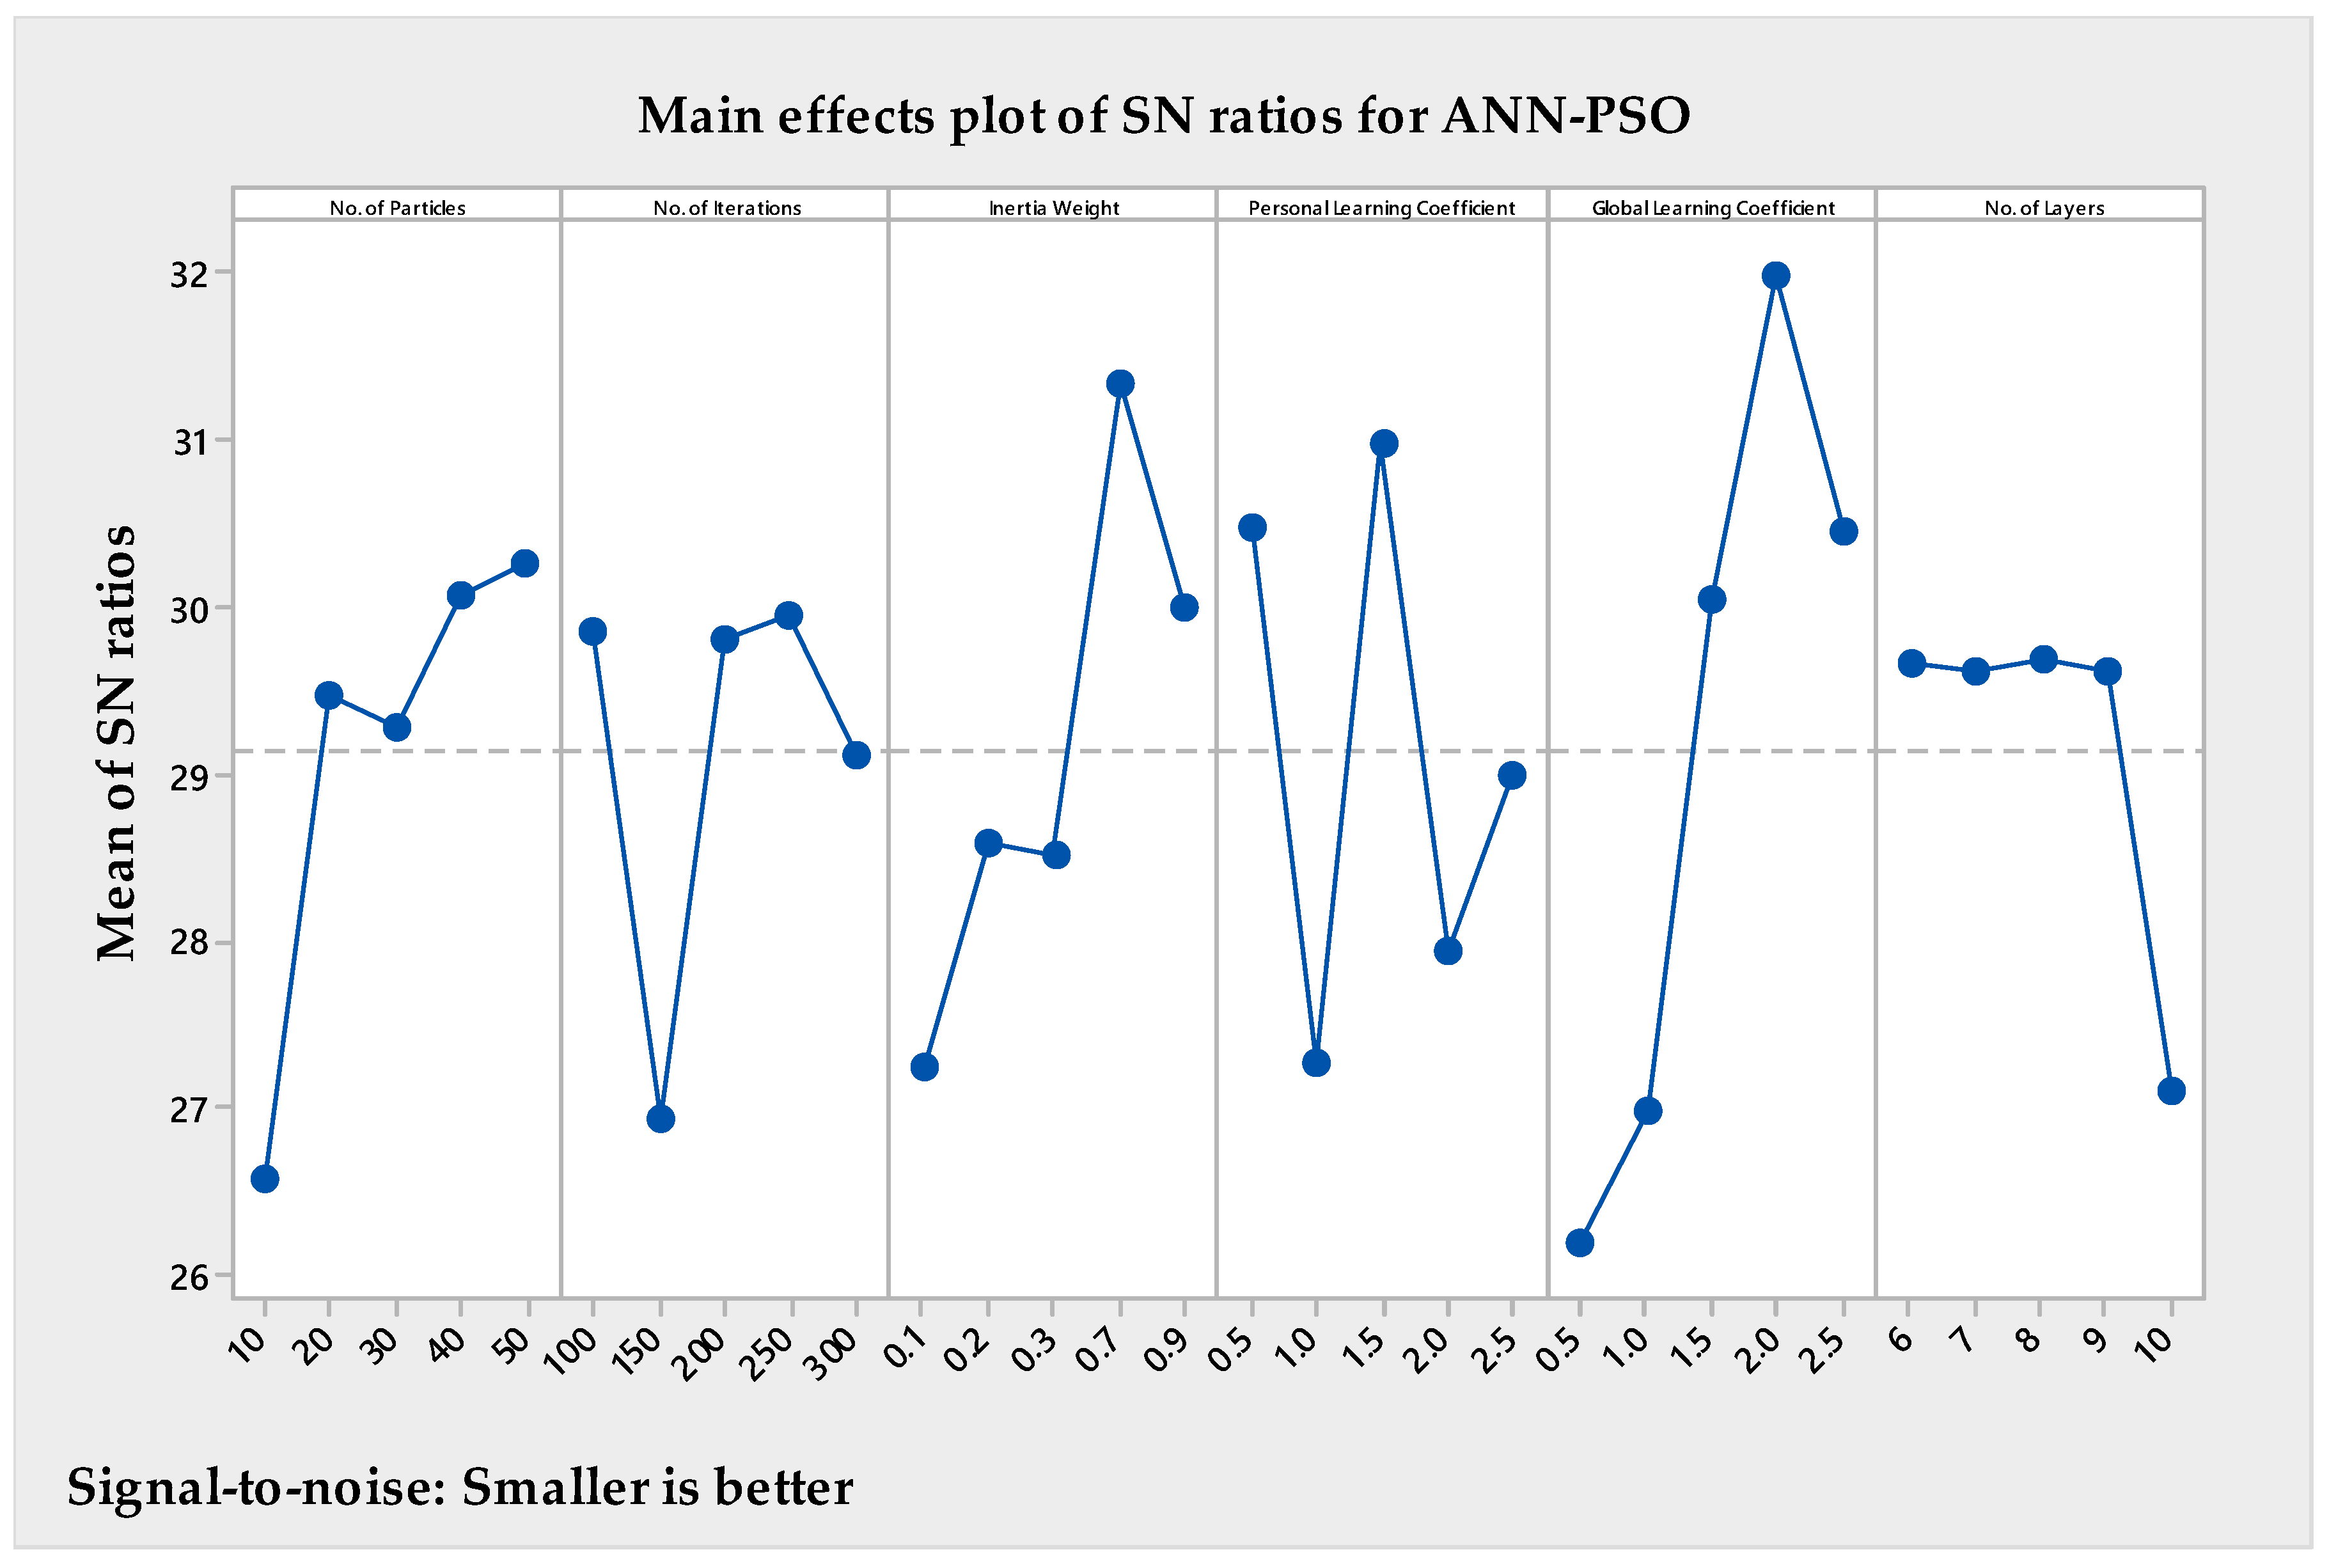
3.2.1. Tuning Parameters of the ANN-GA and ANN-PSO Models
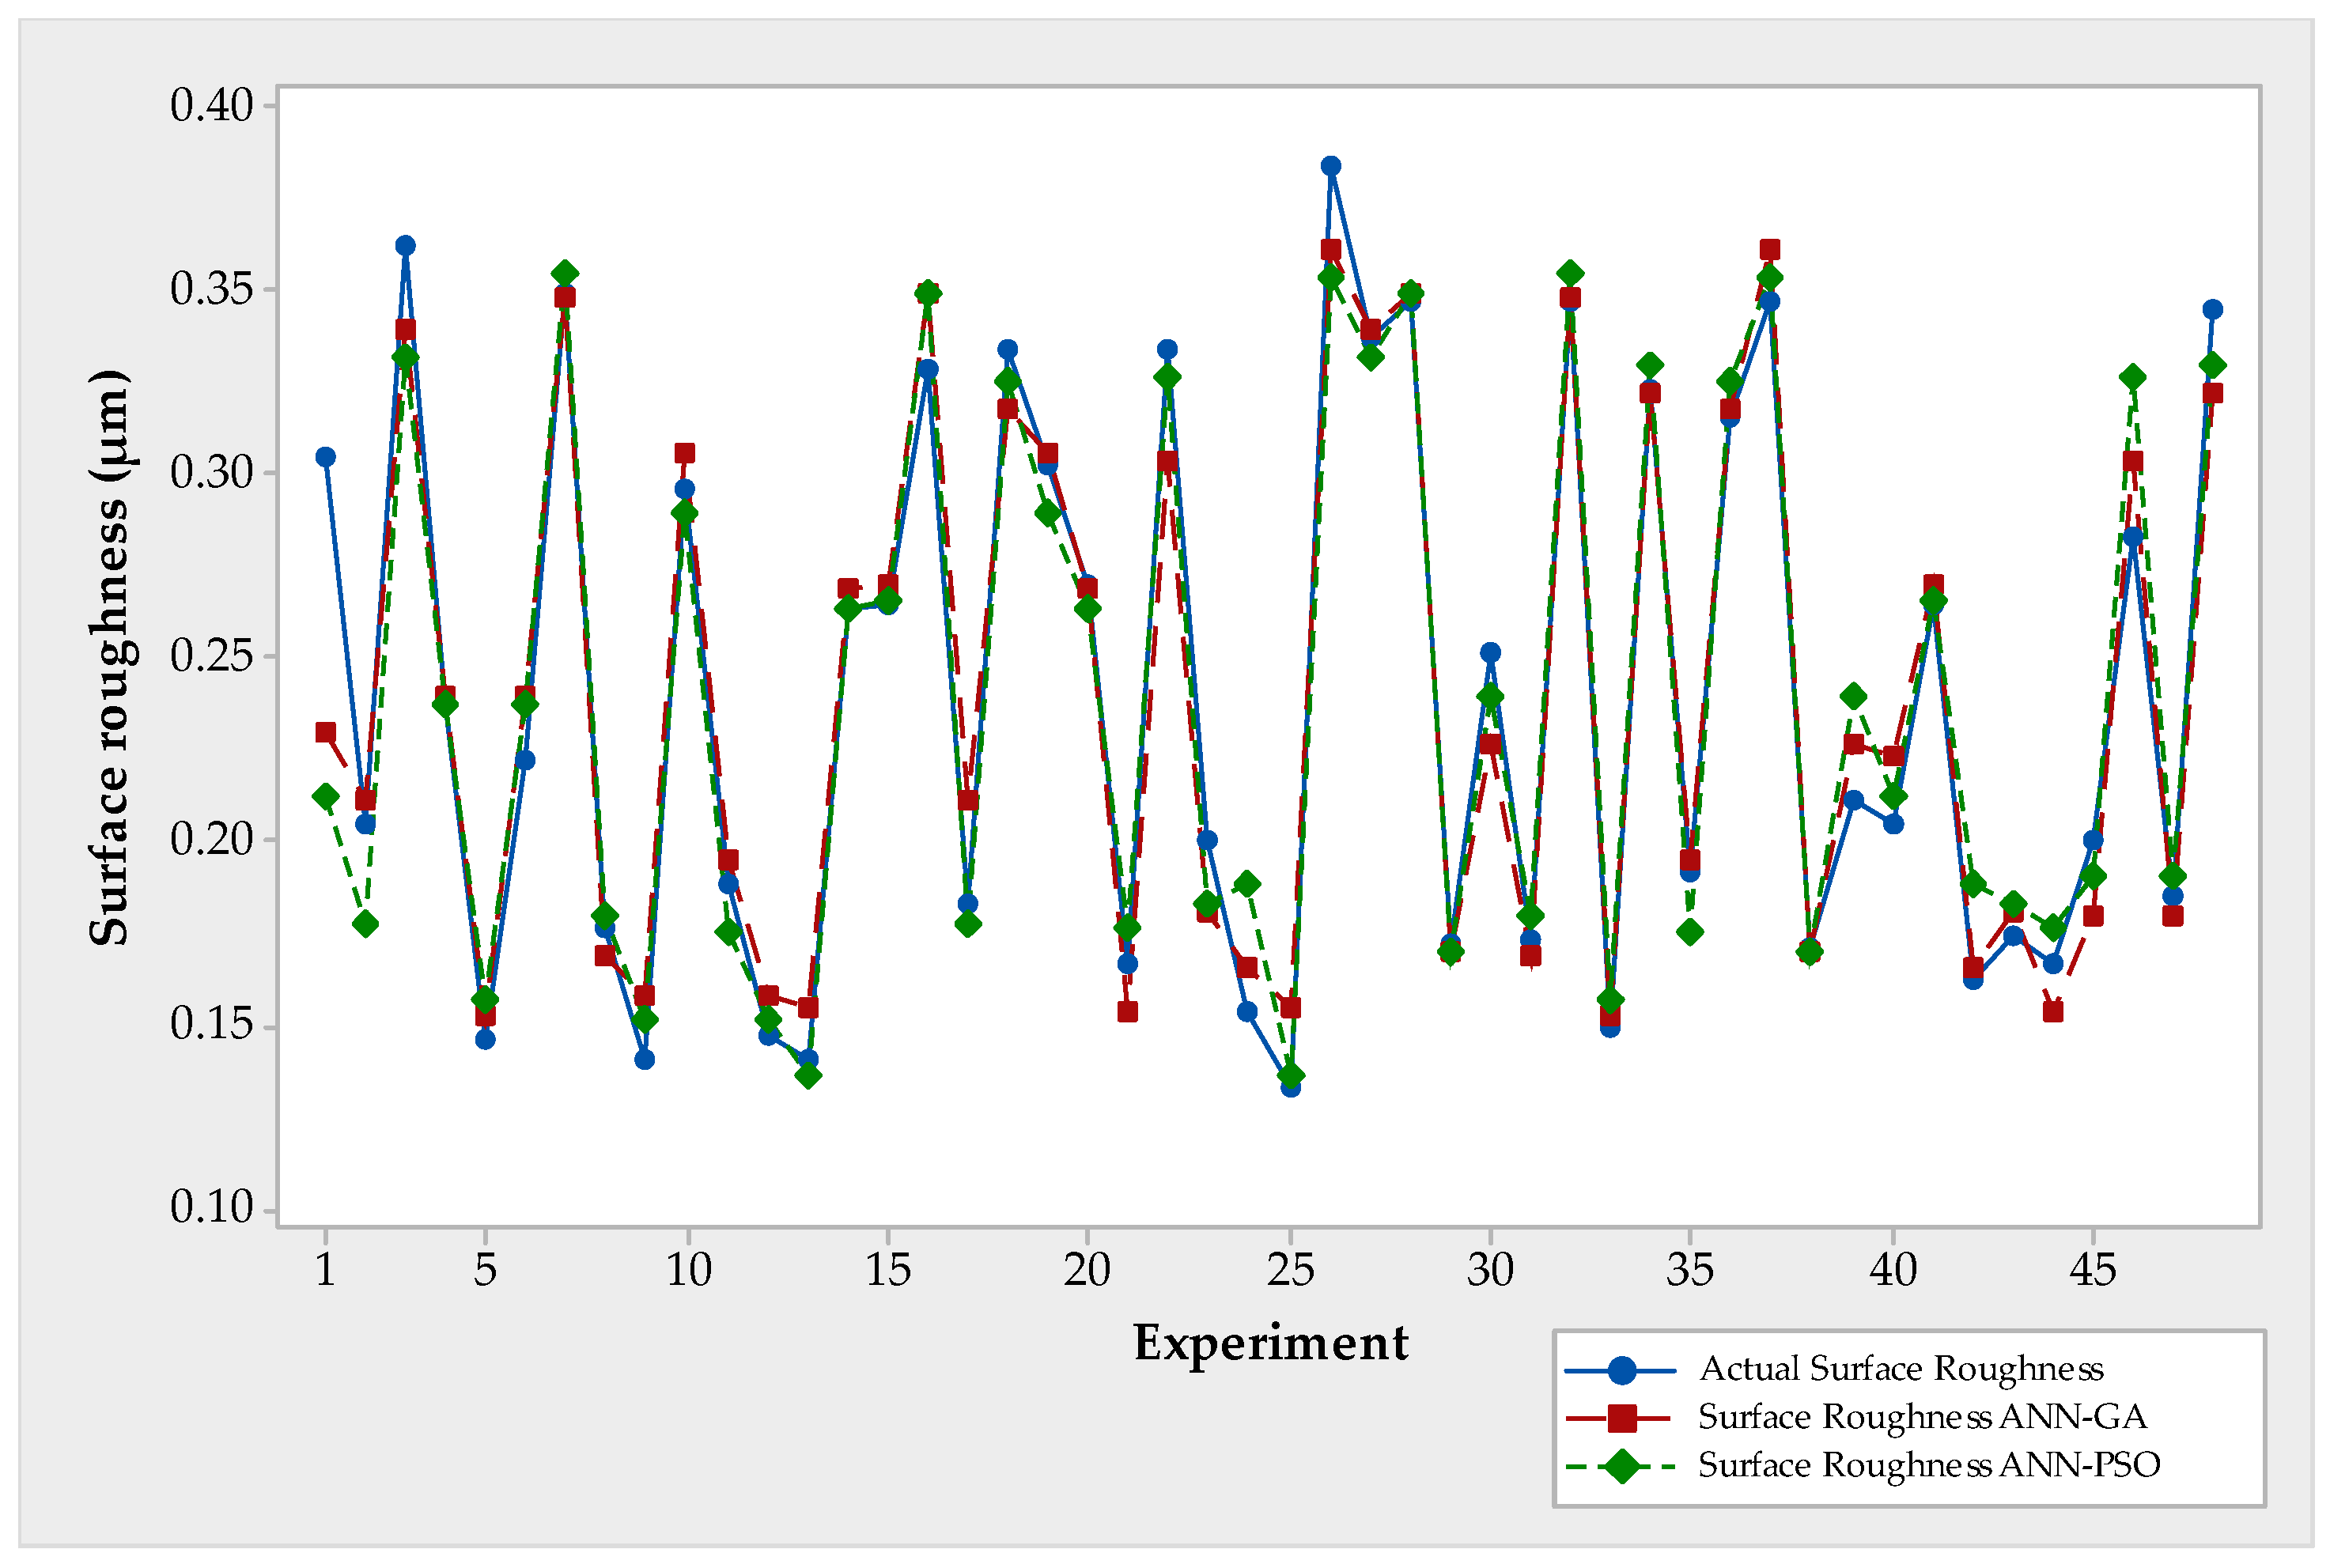
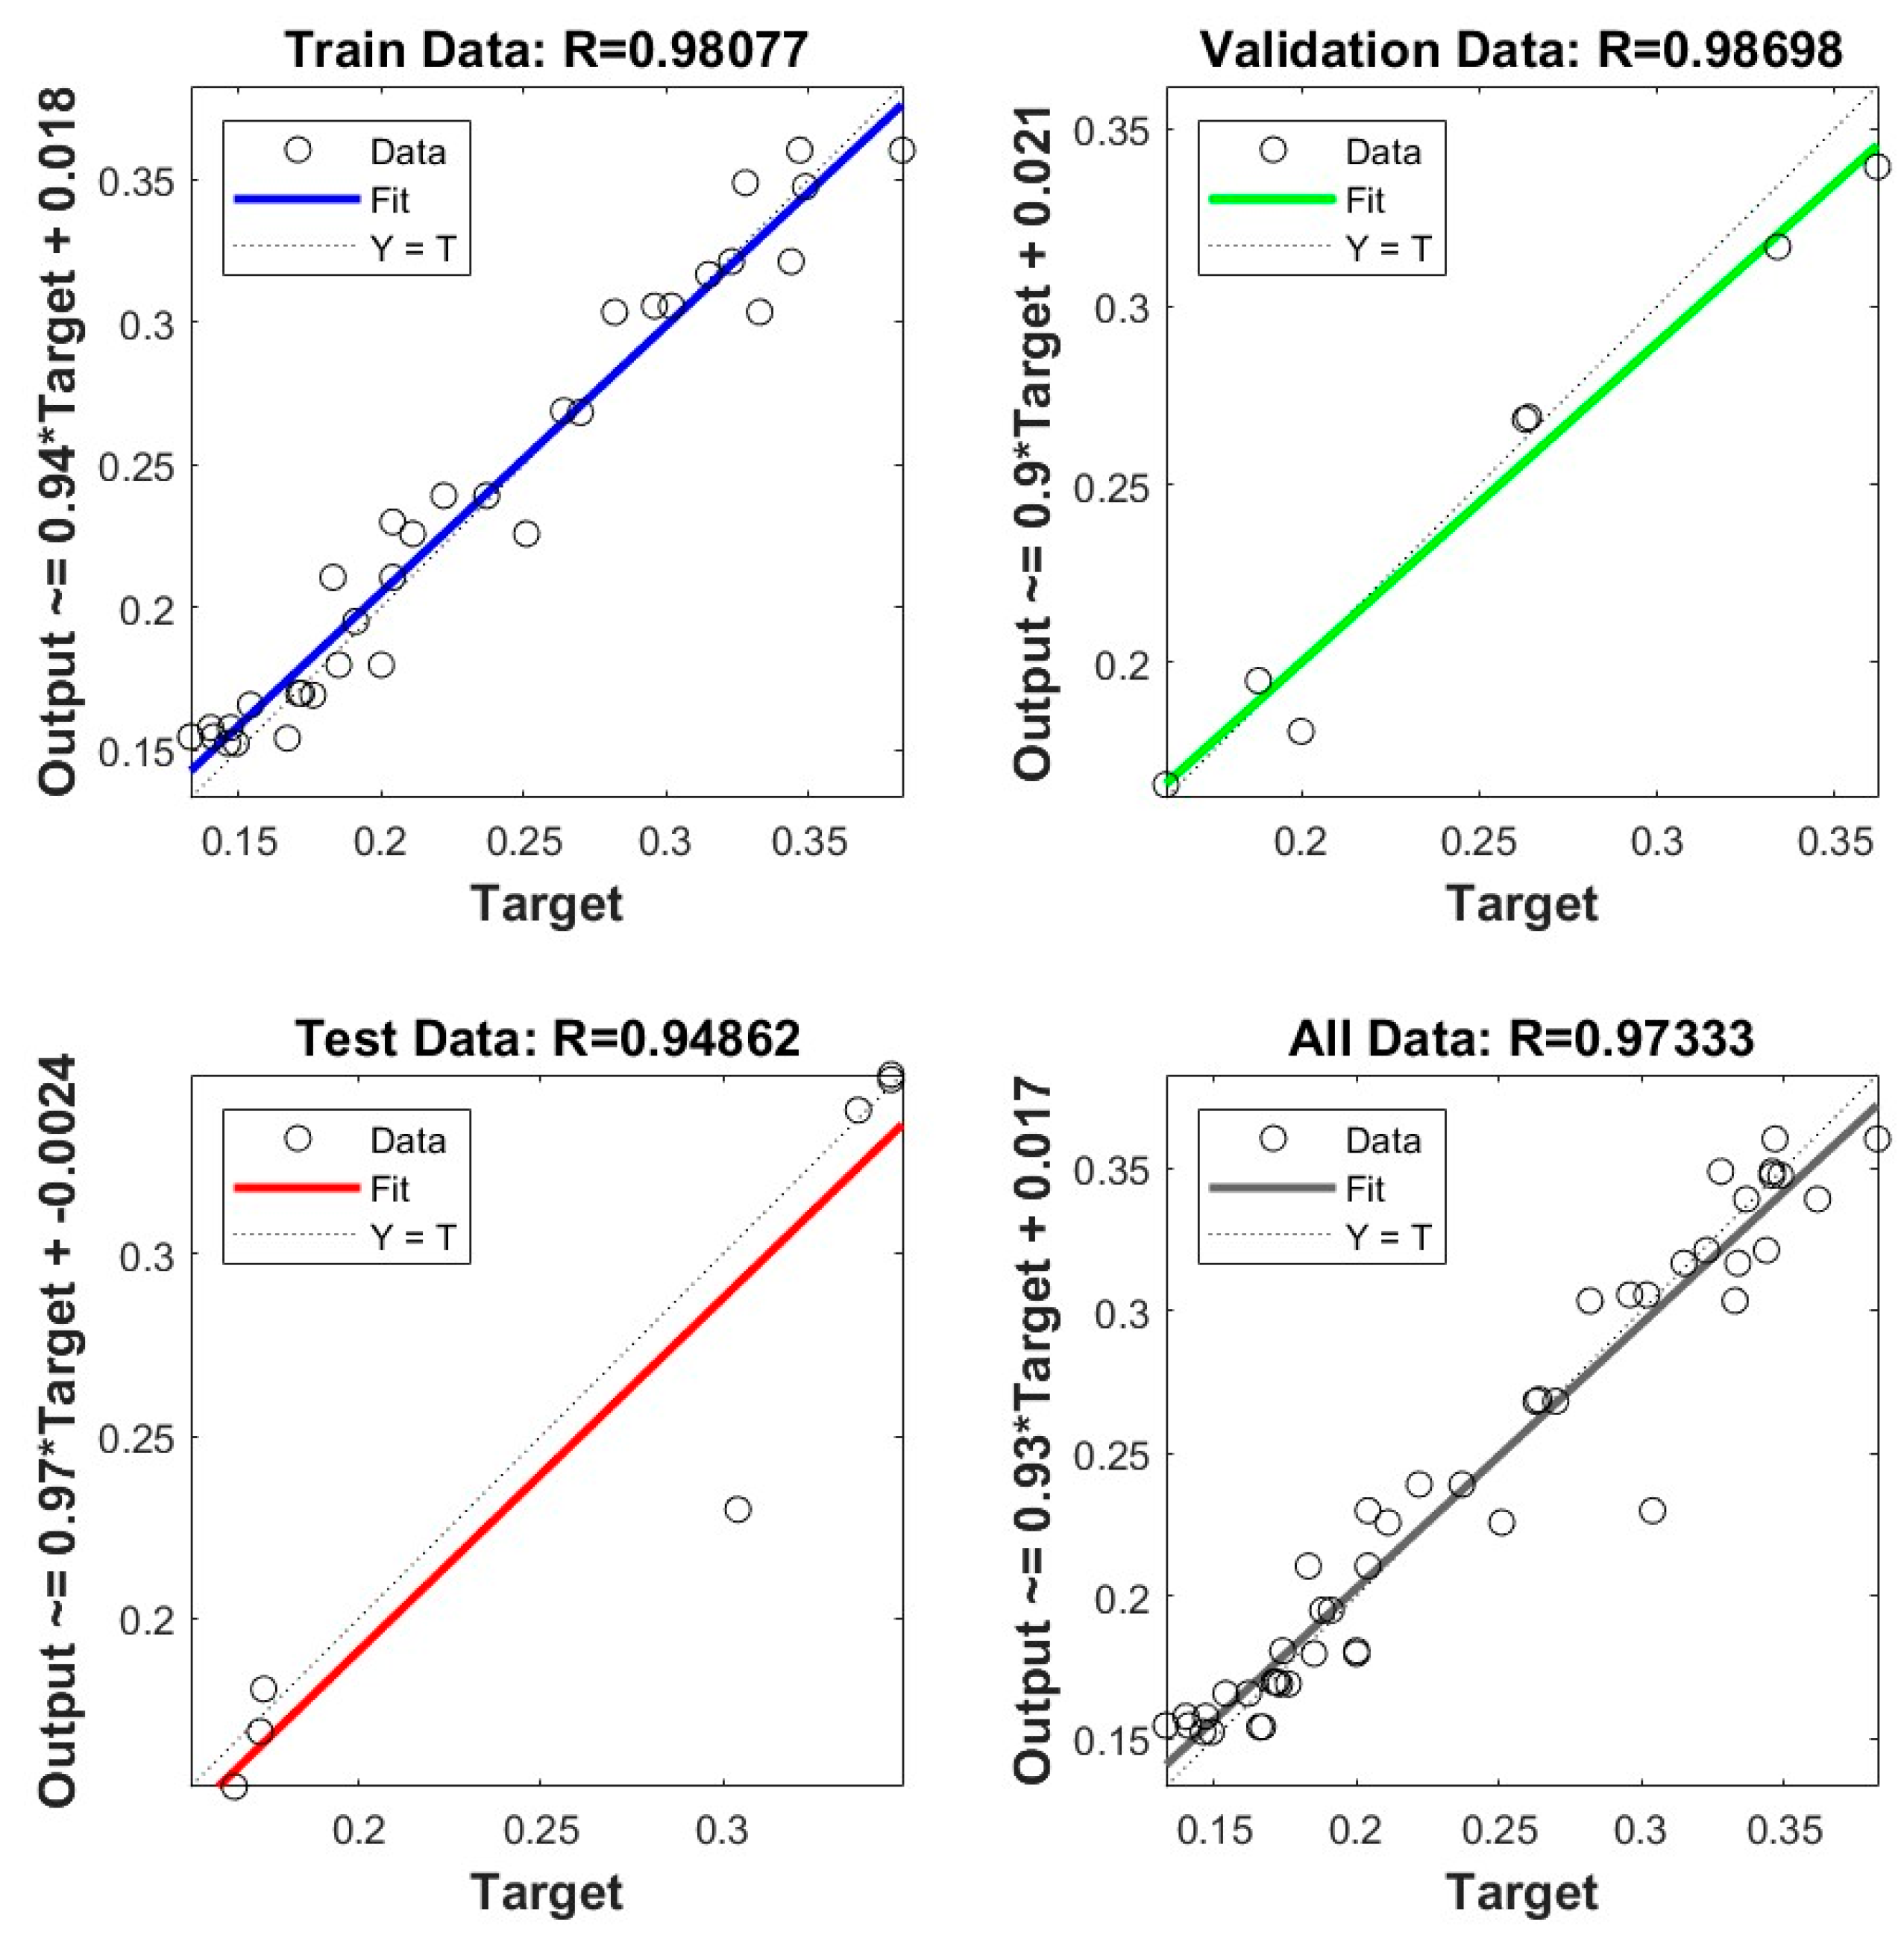
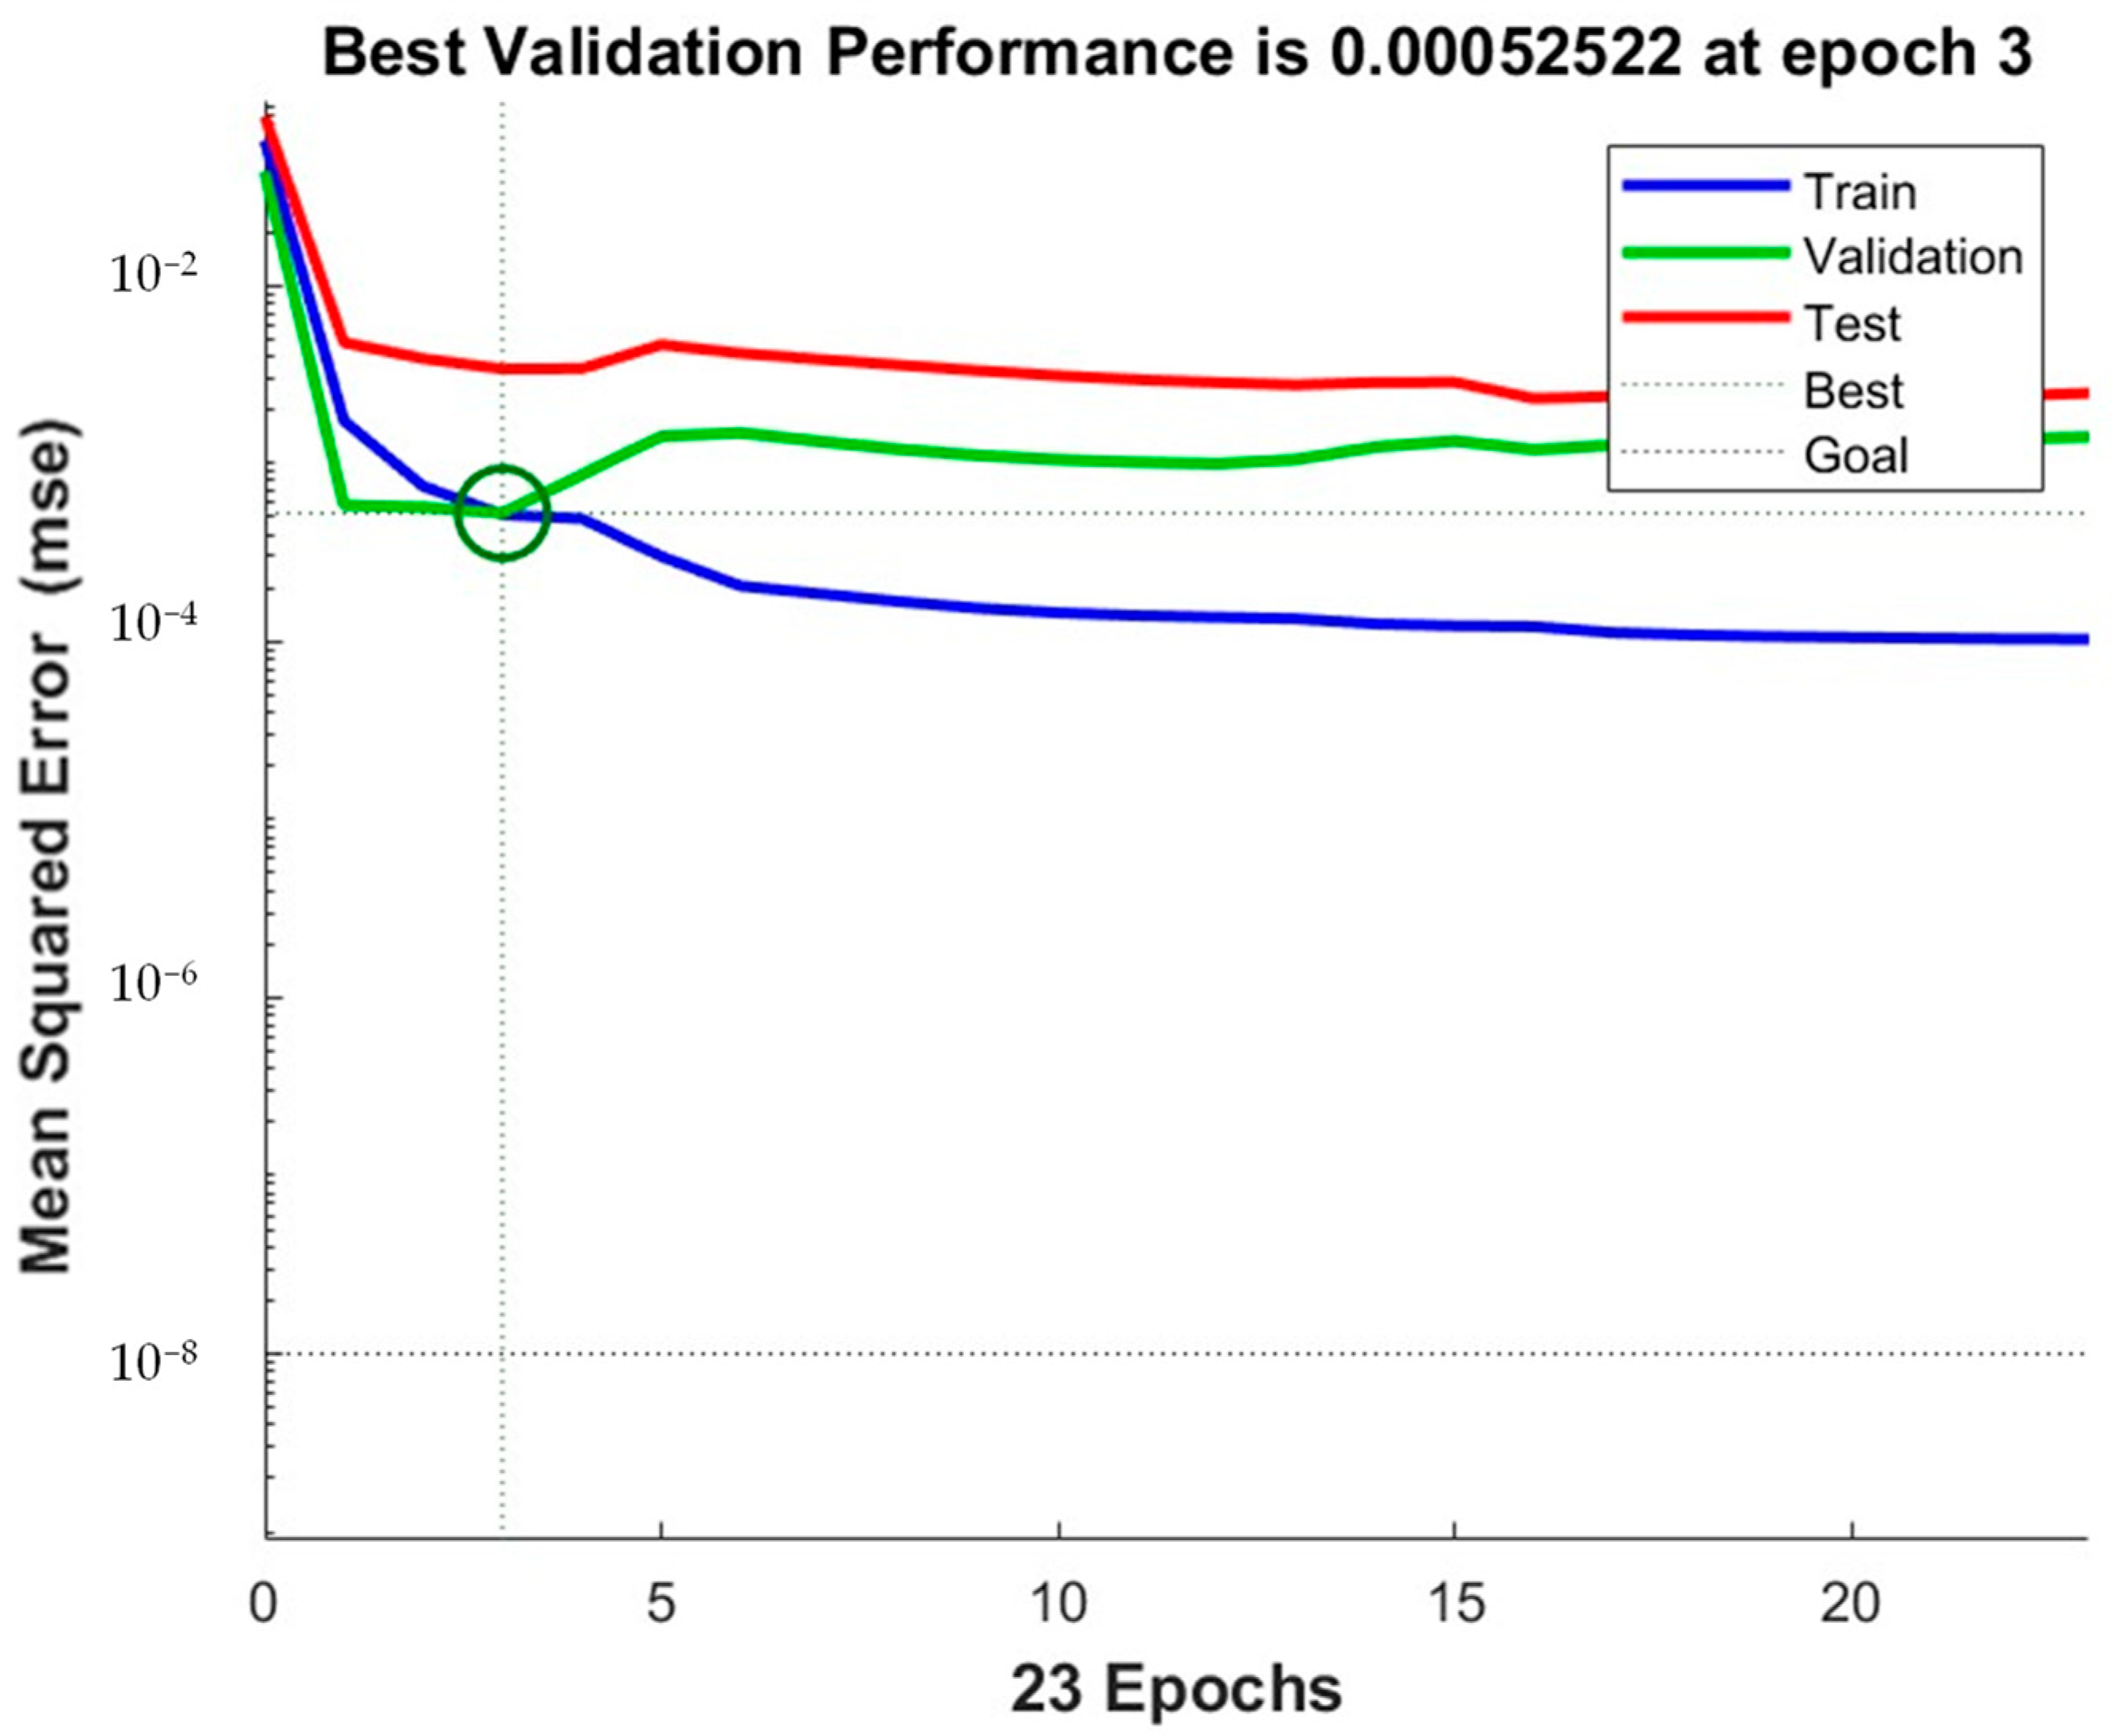
3.2.2. Training Optimization of the ANN-GA and ANN-PSO Models
4. Conclusions
Author Contributions
Funding
Data Availability Statement
Acknowledgments
Conflicts of Interest
References
- Serda, M.; Becker, F.G.; Cleary, M.; Team, R.M.; Holtermann, H.; The, D.; Agenda, N.; Science, P.; Sk, S.K.; Hinnebusch, R.; et al. Machinability of Aisi 410 Martensitic Stainless Steels Depending on Cutting Tool and Coating. J. Fac. Eng. Archit. GAZI Univ. 2009, 24, 343–354. [Google Scholar] [CrossRef]
- Kara, F.; Aslantas, K.; Çiçek, A. ANN and Multiple Regression Method-Based Modelling of Cutting Forces in Orthogonal Machining of AISI 316L Stainless Steel. Neural Comput. Appl. 2015, 26, 237–250. [Google Scholar] [CrossRef]
- Elthalabawy, W.M.; Khan, T.I. Eutectic Bonding of Austenitic Stainless Steel 316L to Magnesium Alloy AZ31 Using Copper Interlayer. Int. J. Adv. Manuf. Technol. 2011, 55, 235–241. [Google Scholar] [CrossRef]
- Chang, L.; Mukahiwa, K.; Volpe, L.; Scenini, F. Effect of Machining on Oxide Development in Type 316L Stainless Steel in High-Temperature Hydrogenated Water. Corros. Sci. 2021, 186, 109444. [Google Scholar] [CrossRef]
- Gurappa, I. Characterization of Different Materials for Corrosion Resistance under Simulated Body Fluid Conditions. Mater. Charact. 2002, 49, 73–79. [Google Scholar] [CrossRef]
- Sultan, A.Z.; Sharif, S.; Kurniawan, D. Effect of Machining Parameters on Tool Wear and Hole Quality of AISI 316L Stainless Steel in Conventional Drilling. Procedia Manuf. 2015, 2, 202–207. [Google Scholar] [CrossRef]
- Kumar, P.S.; Acharyya, S.G.; Rao, S.V.R.; Kapoor, K. Distinguishing Effect of Buffing vs. Grinding, Milling and Turning Operations on the Chloride Induced SCC Susceptibility of 304L Austenitic Stainless Steel. Mater. Sci. Eng. A 2017, 687, 193–199. [Google Scholar] [CrossRef]
- Umbrello, D.; Filice, L. Improving Surface Integrity in Orthogonal Machining of Hardened AISI 52100 Steel by Modeling White and Dark Layers Formation. CIRP Ann. 2009, 58, 73–76. [Google Scholar] [CrossRef]
- Zhou, N.; Pettersson, R.; Peng, R.L.; Schönning, M. Effect of Surface Grinding on Chloride Induced SCC of 304L. Mater. Sci. Eng. A 2016, 658, 50–59. [Google Scholar] [CrossRef]
- Sing, S.L.; An, J.; Yeong, W.Y.; Wiria, F.E. Laser and Electron-Beam Powder-Bed Additive Manufacturing of Metallic Implants: A Review on Processes, Materials and Designs. J. Orthop. Res. 2016, 34, 369–385. [Google Scholar] [CrossRef]
- Wang, D.; Liu, Y.; Yang, Y.; Xiao, D. Theoretical and Experimental Study on Surface Roughness of 316L Stainless Steel Metal Parts Obtained through Selective Laser Melting. Rapid Prototyp. J. 2016, 22, 706–716. [Google Scholar] [CrossRef]
- Liu, Y.J.; Wang, H.L.; Li, S.J.; Wang, S.G.; Wang, W.J.; Hou, W.T.; Hao, Y.L.; Yang, R.; Zhang, L.C. Compressive and Fatigue Behavior of Beta-Type Titanium Porous Structures Fabricated by Electron Beam Melting. Acta Mater. 2017, 126, 58–66. [Google Scholar] [CrossRef]
- Kaynak, Y.; Kitay, O. Porosity, Surface Quality, Microhardness and Microstructure of Selective Laser Melted 316L Stainless Steel Resulting from Finish Machining. J. Manuf. Mater. Process. 2018, 2, 36. [Google Scholar] [CrossRef]
- Li, R.; Liu, J.; Shi, Y.; Du, M.; Xie, Z. 316L Stainless Steel with Gradient Porosity Fabricated by Selective Laser Melting. J. Mater. Eng. Perform. 2010, 19, 666–671. [Google Scholar] [CrossRef]
- Spierings, A.B.; Levy, G. Comparison of Density of Stainless Steel 316L Parts Produced with Selective Laser Melting Using Different Powder Grades. 2009. Available online: https://repositories.lib.utexas.edu/handle/2152/88172 (accessed on 12 June 2023).
- Stamp, R.; Fox, P.; O’Neill, W.; Jones, E.; Sutcliffe, C. The Development of a Scanning Strategy for the Manufacture of Porous Biomaterials by Selective Laser Melting. J. Mater. Sci. Mater. Med. 2009, 20, 1839–1848. [Google Scholar] [CrossRef]
- Riemer, A.; Leuders, S.; Richard, H.A.; Tröster, T.; Riemer, A.; Leuders, S.; Thöne, M.; Richard, H.A.; Tröster, T.; Niendorf, T. On the Fatigue Crack Growth Behavior in 316L Stainless Steel Manufactured by Selective Laser Melting. Eng. Fract. Mech. 2014, 120, 15–25. [Google Scholar] [CrossRef]
- Yasa, E.; Kruth, J.P. Microstructural Investigation of Selective Laser Melting 316L Stainless Steel Parts Exposed to Laser Re-Melting. Procedia Eng. 2011, 19, 389–395. [Google Scholar] [CrossRef]
- Yasa, E.; Kruth, J.P.; Deckers, J. Manufacturing by Combining Selective Laser Melting and Selective Laser Erosion/Laser Re-Melting. CIRP Ann. Manuf. Technol. 2011, 60, 263–266. [Google Scholar] [CrossRef]
- Strano, G.; Hao, L.; Everson, R.M.; Evans, K.E. Surface Roughness Analysis, Modelling and Prediction in Selective Laser Melting. J. Mater. Process. Technol. 2013, 213, 589–597. [Google Scholar] [CrossRef]
- Delgado, J.; Ciurana, J.; Rodríguez, C.A. Influence of Process Parameters on Part Quality and Mechanical Properties for DMLS and SLM with Iron-Based Materials. Int. J. Adv. Manuf. Technol. 2012, 60, 601–610. [Google Scholar] [CrossRef]
- Nguyen, Q.B.; Luu, D.N.; Nai, S.M.L.; Zhu, Z.; Chen, Z.; Wei, J. The Role of Powder Layer Thickness on the Quality of SLM Printed Parts. Arch. Civ. Mech. Eng. 2018, 18, 948–955. [Google Scholar] [CrossRef]
- Lou, X.; Othon, M.A.; Rebak, R.B. Corrosion Fatigue Crack Growth of Laser Additively-Manufactured 316L Stainless Steel in High Temperature Water. Corros. Sci. 2017, 127, 120–130. [Google Scholar] [CrossRef]
- de Souza, A.F.; Al-Rubaie, K.S.; Marques, S.; Zluhan, B.; Santos, E.C. Effect of Laser Speed, Layer Thickness, and Part Position on the Mechanical Properties of Maraging 300 Parts Manufactured by Selective Laser Melting. Mater. Sci. Eng. A 2019, 767, 138425. [Google Scholar] [CrossRef]
- Tian, Y.; Tomus, D.; Rometsch, P.; Wu, X. Influences of Processing Parameters on Surface Roughness of Hastelloy X Produced by Selective Laser Melting. Addit. Manuf. 2017, 13, 103–112. [Google Scholar] [CrossRef]
- Guo, C.; Li, S.; Shi, S.; Li, X.; Hu, X.; Zhu, Q.; Ward, R.M. Effect of Processing Parameters on Surface Roughness, Porosity and Cracking of as-Built IN738LC Parts Fabricated by Laser Powder Bed Fusion. J. Mater. Process. Technol. 2020, 285, 116788. [Google Scholar] [CrossRef]
- Zhang, B.; Ziegert, J.; Farahi, F.; Davies, A. In Situ Surface Topography of Laser Powder Bed Fusion Using Fringe Projection. Addit. Manuf. 2016, 12, 100–107. [Google Scholar] [CrossRef]
- Yeung, H.; Lane, B.; Fox, J. Part Geometry and Conduction-Based Laser Power Control for Powder Bed Fusion Additive Manufacturing. Addit. Manuf. 2019, 30, 100844. [Google Scholar] [CrossRef]
- Al-Rubaie, K.S.; Mario Fernandes Paiva, J.J.; Veldhuis, S.; Melotti, S.; Rabelo, A.; Paiva, J.M.; Elbestawi, M.A.; Veldhuis, S.C. Machinability of SLM-Produced Ti6Al4V Titanium Alloy Parts. Artic. J. Manuf. Process. 2020, 57, 768–786. [Google Scholar] [CrossRef]
- Dabwan, A.; Anwar, S.; Al-Samhan, A.M.; AlFaify, A.; Nasr, M.M. Investigations on the Effect of Layers’ Thickness and Orientations in the Machining of Additively Manufactured Stainless Steel 316L. Materials 2021, 14, 1797. [Google Scholar] [CrossRef]
- Lebon, N.; Tapie, L.; Vennat, E.; Mawussi, B. Influence of CAD/CAM Tool and Material on Tool Wear and Roughness of Dental Prostheses after Milling. J. Prosthet. Dent. 2015, 114, 236–247. [Google Scholar] [CrossRef]
- Bordin, A.; Bruschi, S.; Ghiotti, A.; Bucciotti, F.; Facchini, L. Comparison between Wrought and EBM Ti6Al4V Machinability Characteristics. Key Eng. Mater. 2014, 611–612, 1186–1193. [Google Scholar] [CrossRef]
- Anwar, S.; Ahmed, N.; Abdo, B.M.; Pervaiz, S.; Chowdhury, M.A.K.; Alahmari, A.M. Electron Beam Melting of Gamma Titanium Aluminide and Investigating the Effect of EBM Layer Orientation on Milling Performance. Int. J. Adv. Manuf. Technol. 2018, 96, 3093–3107. [Google Scholar] [CrossRef]
- Anwar, S.; Ahmed, N.; Pervaiz, S.; Ahmad, S.; Mohammad, A.; Saleh, M. On the Turning of Electron Beam Melted Gamma-TiAl with Coated and Uncoated Tools: A Machinability Analysis. J. Mater. Process. Technol. 2020, 282, 116664. [Google Scholar] [CrossRef]
- Polishetty, A.; Nomani, J.; Littlefair, G. Evaluating and Comparing Secondary Machining Characteristics of Wrought and Additive Manufactured 316L Stainless Steel. Mater. Today Proc. 2023, in press. [CrossRef]
- Farooq, M.U.; Anwar, S.; Ullah, R.; Guerra, R.H. Sustainable Machining of Additive Manufactured SS-316L Underpinning Low Carbon Manufacturing Goal. J. Mater. Res. Technol. 2023, 24, 2299–2318. [Google Scholar] [CrossRef]
- Struzikiewicz, G.; Zȩbala, W.; Matras, A.; Machno, M.; Ślusarczyk, Ł.; Hichert, S.; Laufer, F. Turning Research of Additive Laser Molten Stainless Steel 316L Obtained by 3D Printing. Materials 2019, 12, 182. [Google Scholar] [CrossRef]
- Alqahtani, K.N.; Dabwan, A.; Abualsauod, E.H.; Anwar, S. Multi-Response Optimization of Additively Manufactured Ti6Al4V Component Using Grey Relational Analysis Coupled with Entropy Weights. Metals 2023, 13, 1130. [Google Scholar] [CrossRef]
- Dabwan, A.; Anwar, S.; Al-Samhan, A.M.; Alqahtani, K.N.; Nasr, M.M.; Kaid, H.; Ameen, W. CNC Turning of an Additively Manufactured Complex Profile Ti6Al4V Component Considering the Effect of Layer Orientations. Processes 2023, 11, 1031. [Google Scholar] [CrossRef]
- Dabwan, A.; Anwar, S.; Al-Samhan, A.M.; Nasr, M.M. On the Effect of Electron Beam Melted Ti6Al4V Part Orientations during Milling. Metals 2020, 10, 1172. [Google Scholar] [CrossRef]
- Dabwan, A.; Anwar, S.; Al-Samhan, A.M.; Nasr, M.M.; AlFaify, A. On the Influence of Heat Treatment in Suppressing the Layer Orientation Effect in Finishing of Electron Beam Melted Ti6Al4V. Int. J. Adv. Manuf. Technol. 2022, 118, 3035–3048. [Google Scholar] [CrossRef]
- Khorasani, A.M.; Yazdi, M.R.S. Development of a Dynamic Surface Roughness Monitoring System Based on Artificial Neural Networks (ANN) in Milling Operation. Int. J. Adv. Manuf. Technol. 2017, 93, 141–151. [Google Scholar] [CrossRef]
- Kant, G.; Singh, K. Predictive Modelling and Optimization of Machining Parameters to Minimize Surface Roughness Using Artificial Neural Network Coupled with Genetic Algorithm. Procedia CIRP 2015, 31, 453–458. [Google Scholar] [CrossRef]
- El-Bahloul, S.A. Optimization of Wire Electrical Discharge Machining Using Statistical Methods Coupled with Artificial Intelligence Techniques and Soft Computing. SN Appl. Sci. 2020, 2, 49. [Google Scholar] [CrossRef]
- Sivagurumanikandan, N.; Saravanan, S.; Kumar, G.S.; Raju, S.; Raghukandan, K. Prediction and Optimization of Process Parameters to Enhance the Tensile Strength of Nd: YAG Laser Welded Super Duplex Stainless Steel. Optik 2018, 157, 833–840. [Google Scholar] [CrossRef]
- Turkson, R.F.; Yan, F.; Ali, M.K.A.; Hu, J. Artificial Neural Network Applications in the Calibration of Spark-Ignition Engines: An Overview. Eng. Sci. Technol. Int. J. 2016, 19, 1346–1359. [Google Scholar] [CrossRef]
- Yadav, D.; Chhabra, D.; Kumar Garg, R.; Ahlawat, A.; Phogat, A. Optimization of FDM 3D Printing Process Parameters for Multi-Material Using Artificial Neural Network. Mater. Today Proc. 2020, 21, 1583–1591. [Google Scholar] [CrossRef]
- Giri, J.; Shahane, P.; Jachak, S.; Chadge, R.; Giri, P. Optimization of Fdm Process Parameters for Dual Extruder 3d Printer Using Artificial Neural Network. Mater. Today Proc. 2021, 43, 3242–3249. [Google Scholar] [CrossRef]
- Shirmohammadi, M.; Goushchi, S.J.; Keshtiban, P.M. Optimization of 3D Printing Process Parameters to Minimize Surface Roughness with Hybrid Artificial Neural Network Model and Particle Swarm Algorithm. Prog. Addit. Manuf. 2021, 6, 199–215. [Google Scholar] [CrossRef]
- Soler, D.; Telleria, M.; García-Blanco, M.B.; Espinosa, E.; Cuesta, M.; Arrazola, P.J. Prediction of Surface Roughness of SLM Built Parts after Finishing Processes Using an Artificial Neural Network. J. Manuf. Mater. Process. 2022, 6, 82. [Google Scholar] [CrossRef]
- Saad, M.S.; Mohd Nor, A.; Abd Rahim, I.; Syahruddin, M.A.; Mat Darus, I.Z. Optimization of FDM Process Parameters to Minimize Surface Roughness with Integrated Artificial Neural Network Model and Symbiotic Organism Search. Neural Comput. Appl. 2022, 34, 17423–17439. [Google Scholar] [CrossRef]
- AlFaify, A.; Hughes, J.; Ridgway, K. Controlling the Porosity of 316L Stainless Steel Parts Manufactured via the Powder Bed Fusion Process. Rapid Prototyp. J. 2019, 25, 162–175. [Google Scholar] [CrossRef]
- Grguraš, D.; Kern, M. Cutting Performance of Solid Ceramic and Carbide End Milling Tools in Machining of Nickel Based Alloy Inconel 718 and Stainless Steel 316L. Adv. Prod. Eng. Manag. 2019, 14, 27–38. [Google Scholar] [CrossRef]
- Khleif, A.A. Effect of Cutting Parameters on Wear and Surface Roughness of Stainless Steel (316L) Using Milling Process. Al-Nahrain Univ. Coll. Eng. J. 2016, 91, 286–292. [Google Scholar]
- Yasir, M.; Ginta, T.L.; Ariwahjoedi, B.; Alkali, A.U.; Danish, M. Effect of Cutting Speed and Feed Rate on Surface Roughness of AISI 316l SS Using End-Milling. ARPN J. Eng. Appl. Sci. 2016, 11, 2496–2500. [Google Scholar]
- Wade, S.A.; Javed, M.A.; Palombo, E.A.; McArthur, S.L.; Stoddart, P.R. On the Need for More Realistic Experimental Conditions in Laboratory-Based Microbiologically Influenced Corrosion Testing. Int. Biodeterior. Biodegrad. 2017, 121, 97–106. [Google Scholar] [CrossRef]
- Heinl, M.; Heinl, M.; Greiner, S.; Wudy, K.; Pobel, C.; Rasch, M.; Rasch, M.; Huber, F.; Huber, F.; Papke, T.; et al. Measuring Procedures for Surface Evaluation of Additively Manufactured Powder Bed-Based Polymer and Metal Parts. Meas. Sci. Technol. 2020, 31, 095202. [Google Scholar] [CrossRef]
- Gravano, A. Turn-Taking and Affirmative Cue Words in Task-Oriented Dialogue. Diss. Abstr. Int. B Sci. Eng. 2010, 70, 4943. [Google Scholar] [CrossRef]
- Goldberg, Y.; Liu, Y.; Zhang, M. Neural Network Methods for Natural Language Processing. Comput. Linguist. 2018, 44, 193–195. [Google Scholar] [CrossRef]
- Rumelhart, D.E.; Hinton, G.E.; Williams, R.J. Learning Representations by Back-Propagating Errors. Nature 1986, 323, 533–536. [Google Scholar] [CrossRef]
- Pimenov, D.Y.; Bustillo, A.; Mikolajczyk, T. Artificial Intelligence for Automatic Prediction of Required Surface Roughness by Monitoring Wear on Face Mill Teeth. J. Intell. Manuf. 2018, 29, 1045–1061. [Google Scholar] [CrossRef]
- Lin, Y. Neural Networks in Bioprocessing and Chemical Engineering; Elsevier: Amsterdam, The Netherlands, 2014. [Google Scholar]
- Ghanbary, F.; Modirshahla, N.; Khosravi, M.; Behnajady, M.A. Synthesis of TiO2 Nanoparticles in Different Thermal Conditions and Modeling Its Photocatalytic Activity with Artificial Neural Network. J. Environ. Sci. 2012, 24, 750–756. [Google Scholar] [CrossRef]
- Cao, R.; Fan, M.; Hu, J.; Ruan, W.; Wu, X.; Wei, X. Artificial Intelligence Based Optimization for the Se(IV) Removal from Aqueous Solution by Reduced Graphene Oxide-Supported Nanoscale Zero-Valent Iron Composites. Materials 2018, 11, 428. [Google Scholar] [CrossRef]
- Azadeh, A.; Ghaderi, S.F.; Tarverdian, S.; Saberi, M. Integration of Artificial Neural Networks and Genetic Algorithm to Predict Electrical Energy Consumption. Appl. Math. Comput. 2007, 186, 1731–1741. [Google Scholar] [CrossRef]
- Li, K.; Thompson, S.; Wieringa, P.A.; Peng, J.; Duan, G.R. Neural Networks and Genetic Algorithms Can Support Human Supervisory Control to Reduce Fossil Fuel Power Plant Emissions. Cogn. Technol. Work 2003, 5, 107–126. [Google Scholar] [CrossRef]
- Momeni, E.; Jahed Armaghani, D.; Hajihassani, M.; Mohd Amin, M.F. Prediction of Uniaxial Compressive Strength of Rock Samples Using Hybrid Particle Swarm Optimization-Based Artificial Neural Networks. Measurement 2015, 60, 50–63. [Google Scholar] [CrossRef]
- Meissner, M.; Schmuker, M.; Schneider, G. Optimized Particle Swarm Optimization (OPSO) and Its Application to Artificial Neural Network Training. BMC Bioinform. 2006, 7, 125. [Google Scholar] [CrossRef]
- Geethanjali, M.; Raja Slochanal, S.M.; Bhavani, R. PSO Trained ANN-Based Differential Protection Scheme for Power Transformers. Neurocomputing 2008, 71, 904–918. [Google Scholar] [CrossRef]
- Khayat, O.; Ebadzadeh, M.M.; Shahdoosti, H.R.; Rajaei, R.; Khajehnasiri, I. A Novel Hybrid Algorithm for Creating Self-Organizing Fuzzy Neural Networks. Neurocomputing 2009, 73, 517–524. [Google Scholar] [CrossRef]
- Jaddi, N.S.; Abdullah, S.; Hamdan, A.R. Optimization of Neural Network Model Using Modified Bat-Inspired Algorithm. Appl. Soft Comput. 2015, 37, 71–86. [Google Scholar] [CrossRef]
- Holland, J. Adaptation in Natural and Artificial Systems: An Introductory Analysis with Applications to Biology, Control, and Artificial Intelligence; MIT Press: Cambridge, MA, USA, 1992. [Google Scholar]
- Sivanandam, S.N.; Deepa, S.N. Genetic Algorithms. In Introduction to Genetic Algorithms; Springer: Berlin/Heidelberg, Germany, 2008; pp. 15–37. [Google Scholar] [CrossRef]
- Mirjalili, S. Evolutionary Algorithms and Neural Networks; Springer: Cham, Switzerland, 2019; Volume 780. [Google Scholar] [CrossRef]
- Kennedy, J.; Eberhart, R. Particle Swarm Optimization. In Proceedings of the ICNN’95—International Conference on Neural Networks, Perth, WA, Australia, 27 November–1 December 1995. [Google Scholar]
- Tyagi, K.; Tyagi, K. A Comparative Analysis of Optimization Techniques. Int. J. Comput. Appl. 2015, 131, 6–12. [Google Scholar] [CrossRef]
- Ghasri, M. Hybrid Artificial Neural Network with Genetic Algorithm. MATLAB Central File Exchange. Available online: https://www.Mathworks.Com/Matlabcentral/Fileexchange/124600-Hybrid-Artificial-Neural-Network-with-Genetic-Algorithm (accessed on 24 August 2023).
- Selva. Particle Swarm Optimized Neural Network. MATLAB Central File Exchange. Available online: https://www.Mathworks.Com/Matlabcentral/Fileexchange/64371-Particle-Swarm-Optimized-Neural-Network (accessed on 24 August 2023).

| Element | Cr | Ni | Mo | Mn | Si | Cu | N | O | P | C |
|---|---|---|---|---|---|---|---|---|---|---|
| Wt. (%) | 17.50–18.00 | 12.50–13.00 | 2.25–2.50 | ≤2.00 | ≤0.75 | ≤0.50 | ≤0.10 | ≤0.10 | ≤0.025 | ≤0.030 |
| LPBF Parameter | Value |
|---|---|
| Energy density | 50 J/mm3 |
| Point distance | 70 μm |
| Hatching distance | 120 μm |
| Laser power | 200 W |
| Layer thickness | 30, 60, 80, 100 μm |
| LT30 | LT60 | LT80 | LT100 | |
|---|---|---|---|---|
| Side face (μm) | 11.58 | 7.54 | 8.28 | 9.41 |
| Top side (μm) | 12.37 | 6.05 | 9.63 | 23.09 |
| Relative porosity (%) | 4.87 | 0.97 | 1.53 | 3.94 |
| Parameter | Values |
|---|---|
| Cutting speed, (V) m/min | 80, 120 |
| Feed rate, (f) mm/min | 50 |
| Depth of cut, (d) mm | 0.4 |
| Radial depth of cut, (dR) mm | 2.4 |
| Tool feed direction, (TFD) | Direction A, Direction B, and Direction C |
| Layer thickness, (LT) μm | 30, 60, 80, 100 |
| No. | Direction | Layer Thickness (μm) | Cutting Speed (m/min) | Surface Roughness (μm) |
|---|---|---|---|---|
| 1 | A | 80 | 80 | 0.304 |
| 2 | C | 100 | 80 | 0.204 |
| 3 | A | 60 | 120 | 0.362 |
| 4 | B | 100 | 120 | 0.237 |
| 5 | A | 100 | 80 | 0.146 |
| 6 | B | 100 | 120 | 0.222 |
| 7 | C | 30 | 120 | 0.349 |
| 8 | C | 80 | 80 | 0.176 |
| 9 | B | 30 | 80 | 0.14 |
| 10 | C | 80 | 120 | 0.296 |
| 11 | B | 80 | 80 | 0.188 |
| 12 | B | 30 | 80 | 0.147 |
| 13 | B | 60 | 80 | 0.141 |
| 14 | A | 100 | 120 | 0.263 |
| 15 | A | 30 | 120 | 0.264 |
| 16 | B | 60 | 120 | 0.328 |
| 17 | C | 100 | 80 | 0.183 |
| 18 | C | 60 | 120 | 0.334 |
| 19 | C | 80 | 120 | 0.302 |
| 20 | A | 100 | 120 | 0.27 |
| 21 | C | 60 | 80 | 0.167 |
| 22 | A | 80 | 120 | 0.333 |
| 23 | A | 30 | 80 | 0.2 |
| 24 | A | 60 | 80 | 0.154 |
| 25 | B | 60 | 80 | 0.133 |
| 26 | B | 80 | 120 | 0.383 |
| 27 | A | 60 | 120 | 0.337 |
| 28 | B | 60 | 120 | 0.346 |
| 29 | C | 30 | 80 | 0.172 |
| 30 | B | 100 | 80 | 0.251 |
| 31 | C | 80 | 80 | 0.173 |
| 32 | C | 30 | 120 | 0.346 |
| 33 | A | 100 | 80 | 0.149 |
| 34 | B | 30 | 120 | 0.323 |
| 35 | B | 80 | 80 | 0.191 |
| 36 | C | 60 | 120 | 0.315 |
| 37 | B | 80 | 120 | 0.347 |
| 38 | C | 30 | 80 | 0.171 |
| 39 | B | 100 | 80 | 0.211 |
| 40 | A | 80 | 80 | 0.204 |
| 41 | A | 30 | 120 | 0.264 |
| 42 | A | 60 | 80 | 0.162 |
| 43 | A | 30 | 80 | 0.174 |
| 44 | C | 60 | 80 | 0.166 |
| 45 | C | 100 | 120 | 0.2 |
| 46 | A | 80 | 120 | 0.282 |
| 47 | C | 100 | 120 | 0.185 |
| 48 | B | 30 | 120 | 0.344 |
| Source | DF | Adj SS | Adj MS | F-Value | p-Value |
|---|---|---|---|---|---|
| Model | 7 | 0.212360 | 0.030337 | 18.89 | 0.000 |
| Direction | 1 | 0.000284 | 0.000284 | 0.18 | 0.676 |
| LT | 1 | 0.002491 | 0.002491 | 1.55 | 0.220 |
| V | 1 | 0.188084 | 0.188084 | 117.10 | 0.000 |
| Direction * LT | 1 | 0.003679 | 0.003679 | 2.29 | 0.138 |
| Direction * V | 1 | 0.000205 | 0.000205 | 0.13 | 0.723 |
| LT * V | 1 | 0.019560 | 0.019560 | 12.18 | 0.001 |
| Direction * LT * V | 1 | 0.007834 | 0.007834 | 4.88 | 0.033 |
| R-sq = 83.44% | R-sq(adj) = 80.54% | R-sq(pred) = 76.15% | |||
| Algorithm | Parameter | Level | ||||
|---|---|---|---|---|---|---|
| 1 | 2 | 3 | 4 | 5 | ||
| ANN-PSO | No. of ANN hidden layers | 6 | 7 | 8 | 9 | 10 |
| No. of particles | 10 | 20 | 30 | 40 | 50 | |
| Inertia weight | 0.1 | 0.2 | 0.3 | 0.7 | 0.9 | |
| Personal learning coefficient | 0.5 | 1 | 1.5 | 2 | 2.5 | |
| Global learning coefficient | 0.5 | 1 | 1.5 | 2 | 2.5 | |
| No. of iterations | 100 | 150 | 200 | 250 | 300 | |
| ANN-GA | No. of hidden layers | 6 | 7 | 8 | 9 | 10 |
| Population size | 50 | 60 | 70 | 80 | 90 | |
| Crossover percentage | 0.2 | 0.3 | 0.4 | 0.5 | 0.6 | |
| Mutation percentage | 0.5 | 0.6 | 0.7 | 0.8 | 0.9 | |
| No. of iterations | 100 | 150 | 200 | 250 | 300 | |
| Experiment No. | Actual Value | ANN-PSO Predicted Value | ANN-GA Predicted Value | ANN-PSO RPD | ANN-GA RPD |
|---|---|---|---|---|---|
| 1 | 0.304 | 0.212 | 0.230 | 0.302 | 0.244 |
| 2 | 0.204 | 0.177 | 0.211 | 0.132 | 0.032 |
| 3 | 0.362 | 0.331 | 0.339 | 0.086 | 0.063 |
| 4 | 0.237 | 0.237 | 0.239 | 0.000 | 0.009 |
| 5 | 0.146 | 0.157 | 0.152 | 0.073 | 0.043 |
| 6 | 0.222 | 0.237 | 0.239 | 0.067 | 0.077 |
| 7 | 0.349 | 0.355 | 0.348 | 0.016 | 0.004 |
| 8 | 0.176 | 0.180 | 0.169 | 0.021 | 0.039 |
| 9 | 0.14 | 0.151 | 0.158 | 0.079 | 0.126 |
| 10 | 0.296 | 0.289 | 0.306 | 0.024 | 0.033 |
| 11 | 0.188 | 0.175 | 0.195 | 0.070 | 0.037 |
| 12 | 0.147 | 0.151 | 0.158 | 0.027 | 0.073 |
| 13 | 0.141 | 0.137 | 0.155 | 0.030 | 0.096 |
| 14 | 0.263 | 0.263 | 0.268 | 0.000 | 0.021 |
| 15 | 0.264 | 0.265 | 0.269 | 0.003 | 0.019 |
| 16 | 0.328 | 0.348 | 0.349 | 0.062 | 0.064 |
| 17 | 0.183 | 0.177 | 0.211 | 0.032 | 0.150 |
| 18 | 0.334 | 0.324 | 0.317 | 0.029 | 0.051 |
| 19 | 0.302 | 0.289 | 0.306 | 0.044 | 0.012 |
| 20 | 0.27 | 0.263 | 0.268 | 0.026 | 0.006 |
| 21 | 0.167 | 0.176 | 0.154 | 0.056 | 0.078 |
| 22 | 0.333 | 0.326 | 0.304 | 0.021 | 0.088 |
| 23 | 0.2 | 0.183 | 0.181 | 0.087 | 0.097 |
| 24 | 0.154 | 0.188 | 0.166 | 0.219 | 0.076 |
| 25 | 0.133 | 0.137 | 0.155 | 0.028 | 0.162 |
| 26 | 0.383 | 0.353 | 0.361 | 0.077 | 0.059 |
| 27 | 0.337 | 0.331 | 0.339 | 0.018 | 0.007 |
| 28 | 0.346 | 0.348 | 0.349 | 0.006 | 0.009 |
| 29 | 0.172 | 0.170 | 0.170 | 0.012 | 0.013 |
| 30 | 0.251 | 0.239 | 0.226 | 0.049 | 0.100 |
| 31 | 0.173 | 0.180 | 0.169 | 0.039 | 0.023 |
| 32 | 0.346 | 0.355 | 0.348 | 0.025 | 0.005 |
| 33 | 0.149 | 0.157 | 0.152 | 0.052 | 0.022 |
| 34 | 0.323 | 0.329 | 0.321 | 0.018 | 0.005 |
| 35 | 0.191 | 0.175 | 0.195 | 0.084 | 0.021 |
| 36 | 0.315 | 0.324 | 0.317 | 0.030 | 0.006 |
| 37 | 0.347 | 0.353 | 0.361 | 0.018 | 0.039 |
| 38 | 0.171 | 0.170 | 0.170 | 0.006 | 0.007 |
| 39 | 0.211 | 0.239 | 0.226 | 0.131 | 0.070 |
| 40 | 0.204 | 0.212 | 0.230 | 0.040 | 0.127 |
| 41 | 0.264 | 0.265 | 0.269 | 0.003 | 0.019 |
| 42 | 0.162 | 0.188 | 0.166 | 0.159 | 0.023 |
| 43 | 0.174 | 0.183 | 0.181 | 0.049 | 0.039 |
| 44 | 0.166 | 0.176 | 0.154 | 0.062 | 0.072 |
| 45 | 0.2 | 0.191 | 0.180 | 0.046 | 0.102 |
| 46 | 0.282 | 0.326 | 0.304 | 0.156 | 0.077 |
| 47 | 0.185 | 0.191 | 0.180 | 0.032 | 0.029 |
| 48 | 0.344 | 0.329 | 0.321 | 0.044 | 0.066 |
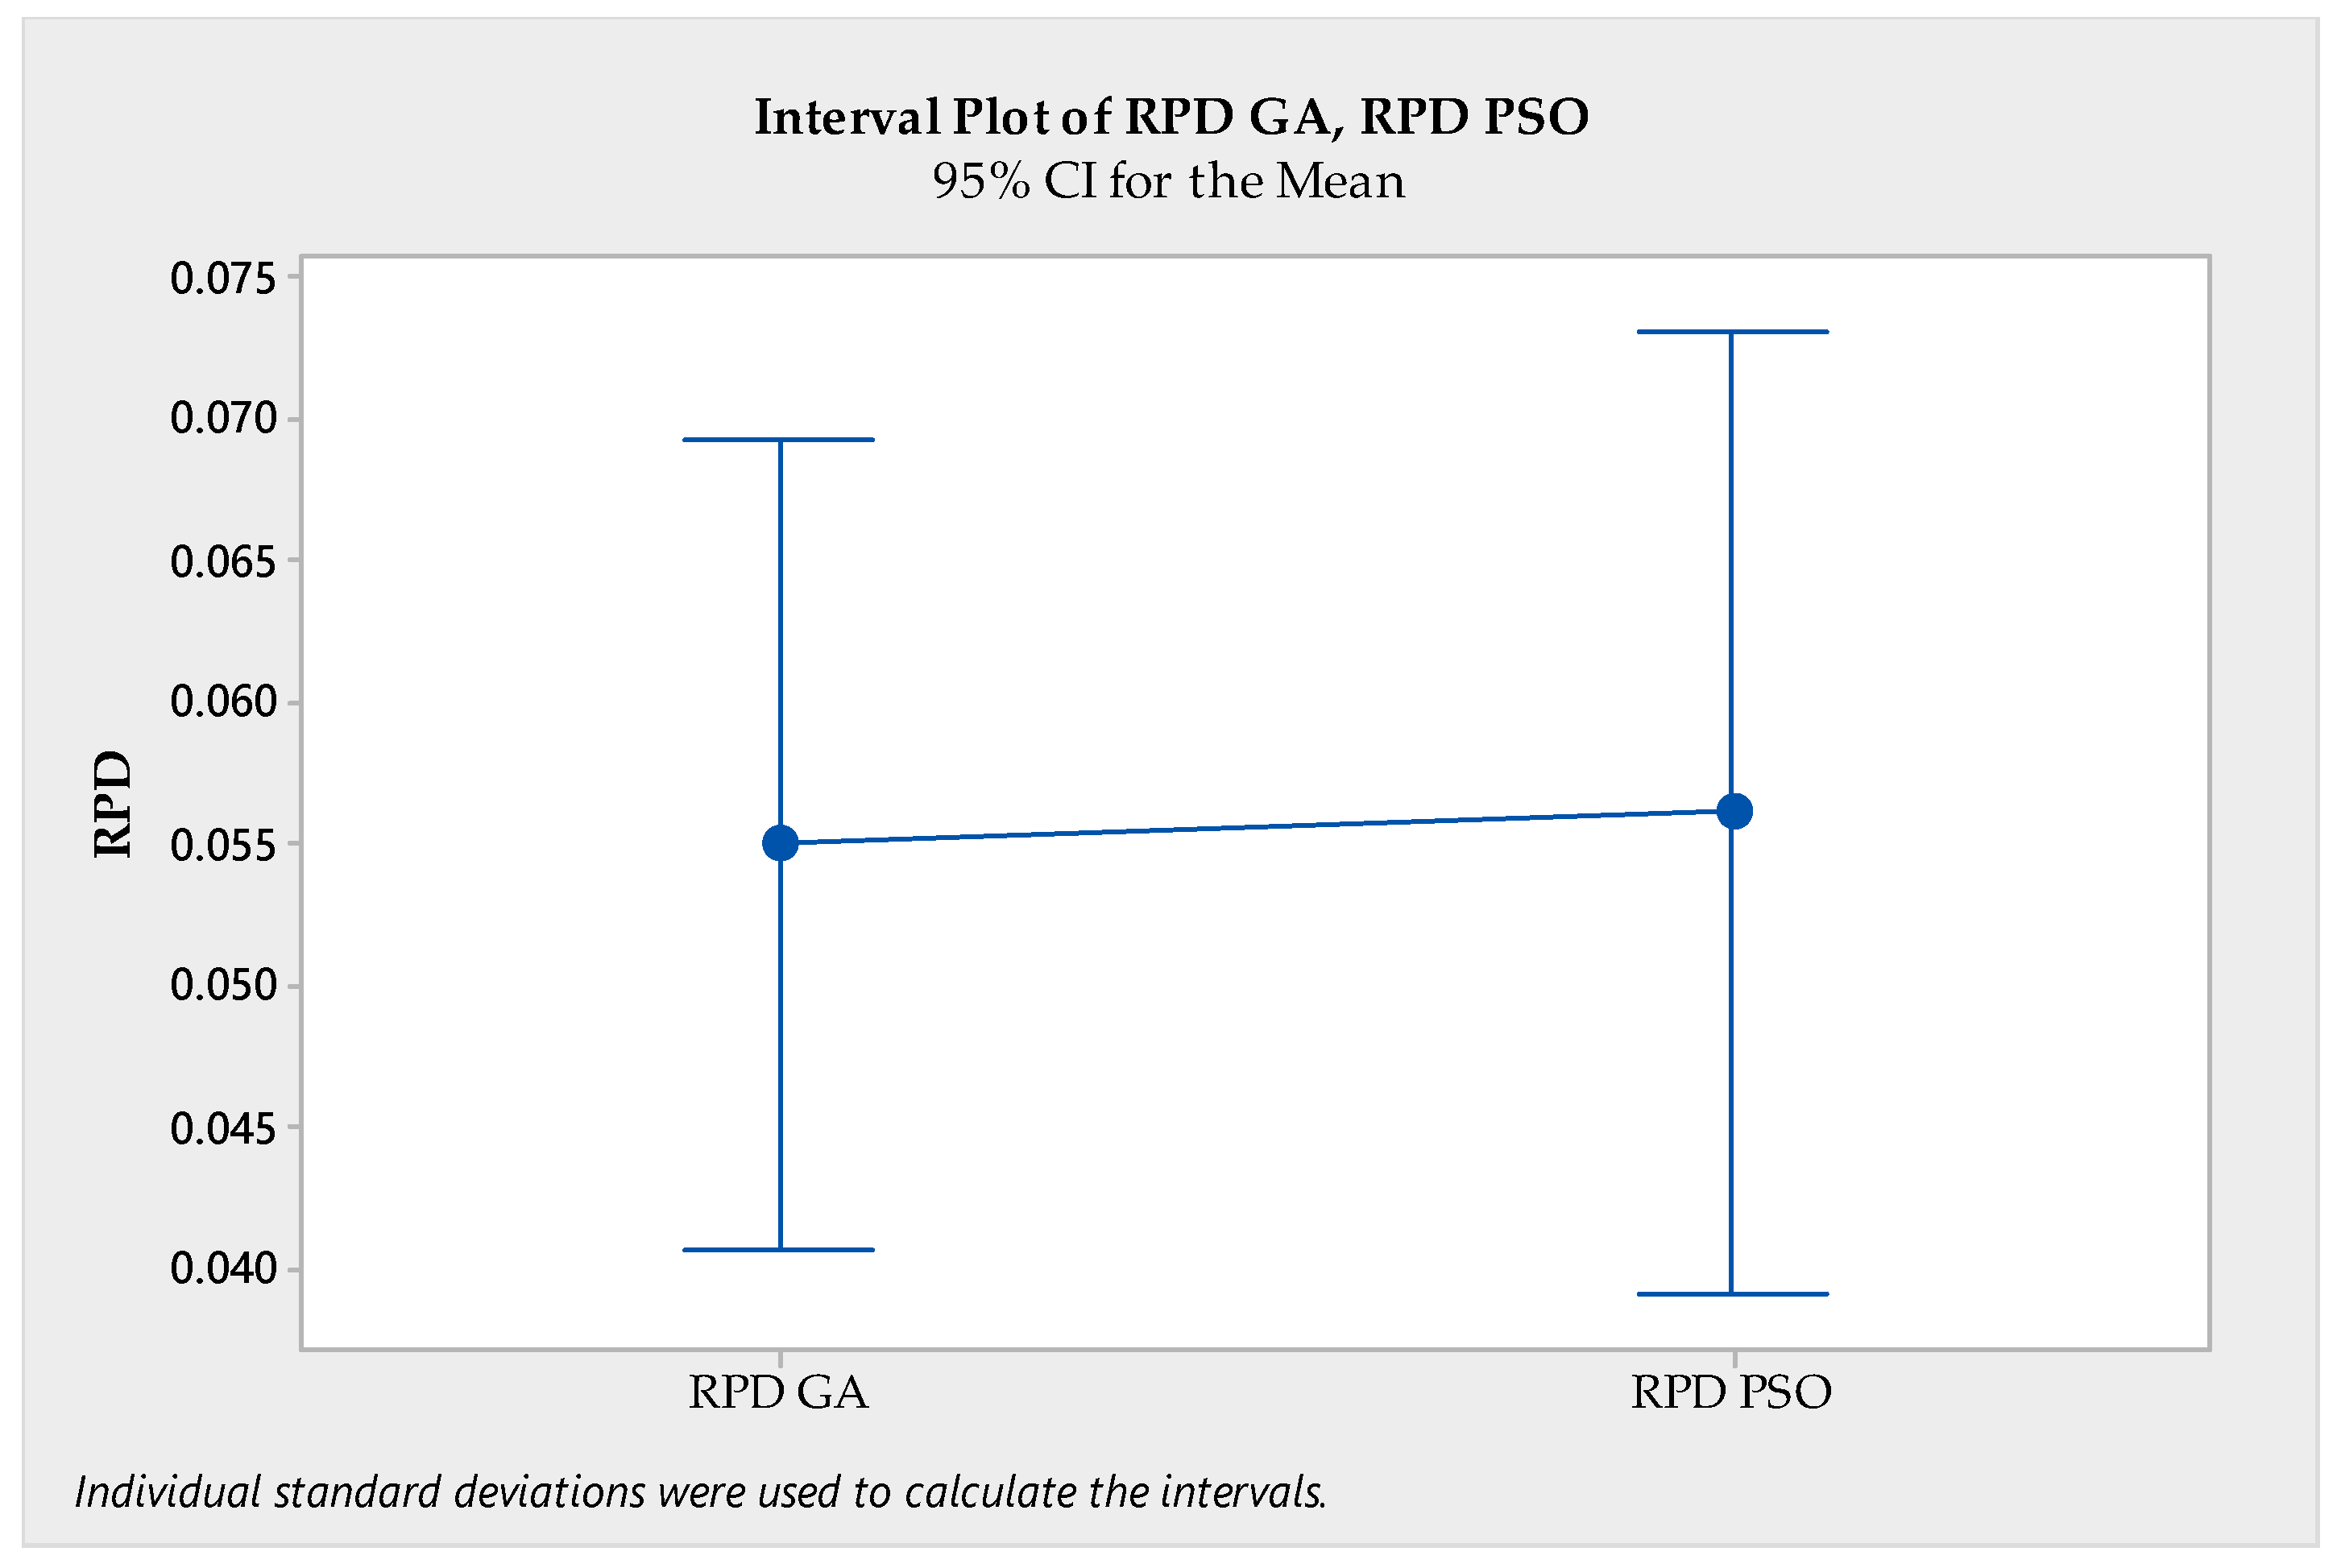
| N | Mean | StDev | SE Mean | T-Value | p-Value | |
|---|---|---|---|---|---|---|
| RPD ANN-GA | 48 | 0.05491 | 0.04929 | 0.0071 | −0.10 | 0.918 |
| RPD ANN-PSO | 48 | 0.0560 | 0.0583 | 0.0084 |
| N | Mean | StDev | Individual 95% CI for Mean | F-Value | p-Value | |
|---|---|---|---|---|---|---|
| Actual | 48 | 0.2404 | 0.07672 | (0.2181, 0.2627) | 0.00 | 0.999 |
| Predicted ANN-GA | 48 | 0.24007 | 0.07307 | (0.2188, 0.2613) | ||
| Predicted ANN-PSO | 48 | 0.23976 | 0.07363 | (0.2184, 0.2611) |
Disclaimer/Publisher’s Note: The statements, opinions and data contained in all publications are solely those of the individual author(s) and contributor(s) and not of MDPI and/or the editor(s). MDPI and/or the editor(s) disclaim responsibility for any injury to people or property resulting from any ideas, methods, instructions or products referred to in the content. |
© 2023 by the authors. Licensee MDPI, Basel, Switzerland. This article is an open access article distributed under the terms and conditions of the Creative Commons Attribution (CC BY) license (https://creativecommons.org/licenses/by/4.0/).
Share and Cite
Kaid, H.; Dabwan, A.; Alqahtani, K.N.; Abualsauod, E.H.; Anwar, S.; Al-Samhan, A.M.; AlFaify, A.Y. Optimization of the Effect of Laser Power Bed Fusion 3D Printing during the Milling Process Using Hybrid Artificial Neural Networks with Particle Swarm Optimization and Genetic Algorithms. Processes 2023, 11, 2892. https://doi.org/10.3390/pr11102892
Kaid H, Dabwan A, Alqahtani KN, Abualsauod EH, Anwar S, Al-Samhan AM, AlFaify AY. Optimization of the Effect of Laser Power Bed Fusion 3D Printing during the Milling Process Using Hybrid Artificial Neural Networks with Particle Swarm Optimization and Genetic Algorithms. Processes. 2023; 11(10):2892. https://doi.org/10.3390/pr11102892
Chicago/Turabian StyleKaid, Husam, Abdulmajeed Dabwan, Khaled N. Alqahtani, Emad Hashiem Abualsauod, Saqib Anwar, Ali M. Al-Samhan, and Abdullah Yahia AlFaify. 2023. "Optimization of the Effect of Laser Power Bed Fusion 3D Printing during the Milling Process Using Hybrid Artificial Neural Networks with Particle Swarm Optimization and Genetic Algorithms" Processes 11, no. 10: 2892. https://doi.org/10.3390/pr11102892