Information-Based Trade in German Real Estate and Equity Markets

Center for Real Estate Studies, Steinbeis University Berlin, Eisenbahnstrasse 56, 79098 Freiburg, Germany
Risks 2015, 3(4), 573-598; https://doi.org/10.3390/risks3040573
Submission received: 15 May 2015
/
Accepted: 25 November 2015
/
Published: 7 December 2015
(This article belongs to the Special Issue Information and market efficiency)
Abstract
:This paper employs four established market microstructure measures on information-based trade in financial markets. A set of German mid and small caps is used to analyze potential differential information content in real estate stocks compared to other asset classes. After linking substantially lower amounts of information-based trade in real estate stocks to higher liquidity premia, it is found that the evolution of the information content in real estate and other assets follows similar trends. Consequently, interdependence is tested for rolling time windows, revealing strong informational links between real estate and other assets. Particularly, small caps, financials, as well as companies offering consumer goods and services show a close relationship to real estate. Depending on the choice of the measure of information-based trade, up to 75% of the variation in the information content in real estate shares is related to other asset classes, pointing to the notion of high dependence.
JEL-classification:
D53; D82; G14; R301. Introduction
The literature on the market microstructure discusses extensively the role of information in (financial) markets. Beyond seminal contributions by [1] and [2] extending classical market theory to asymmetric information, a number of empirical measures on information-based trade were developed and applied to financial market data. While one strand of the literature relates these measures to corporate behavior, such as investment activity or CEO turnover, the contribution of this article is to stress the empirical observation that information-based trade relates to the market segment.
For example, [3] finds substantial differences in the information content for financials compared to other asset classes. Moreover, asset turnover and index affiliation reveal significant differentials, as well. Given that industry indices in financial markets often combine real estate with other financial data, this article relates prior findings to the real estate segment of the German market.
In order to analyze sector-specific informational asymmetries for real estate and other stocks, the four most established types of measures on information-based trade are analyzed for a set of German mid and small caps by comparing their temporal evolution and interdependence. Finding substantial differences in the amount of information-based trade and liquidity in real estate shares, strong relationships with the evolution of information-based trade in small caps, consumer sectors and particularly with financials are determined. In general, principal components in the amount of information-based trade for real estate and other assets range between 39% and 86% for the four measures analyzed, pointing to the notion that, at least in the short-run, informational links are quickly spread over the whole stock market, including real estate.
The article is organized as follows. The following Section 2 gives a brief discussion of the related literature. Section 3 defines relevant measures of information and describes the corresponding set of data used in the subsequent analysis. In Section 4, descriptive comparisons and intertemporal trends are analyzed before turning to the interdependence on the level of compound and sectoral indices in Section 5. Here, partial samples over the four quartiles of the distribution of the average amount of daily trading volume are discussed, as well. Section 6 summarizes and gives concluding remarks.
2. Related Literature
Discussing real estate as a specific asset class is not new to the finance literature, and even before the U.S. property market went down, the portfolio contribution of real estate was actively discussed. This can be seen for example in [4] and [5], who published two articles with almost identical titles aiming at the determination of the value of real estate for portfolio choice. However, the ongoing financial crisis originating from real estate mortgages in the U.S. indicates a certain interdependence with other classes, mitigating the role of real estate for portfolio diversification. For that reason and due to potentially different investor preferences, many articles concentrate on modeling and optimizing.
Beyond the analysis of simple mean-variance approaches, a more general question arises: although properties may be differentiated substantially from other assets in terms of liquidity and potentially investors’ holding period, it is not necessarily implied that exchange listed properties will do so, as well. The work in [4] already pointed to the notion of cycles within the contribution of real estate for portfolio diversification. A potential reason can be found within the link between underlying and security. On the one hand, securitized real estate may be essentially affected by the evolution of the property market itself (perspective underlying). On the other hand, supply and demand in the securities markets could be the main drivers for the evolution of the price and volume of real estate stocks or REITs (perspective security). From a theoretical perspective, one could argue that these two aspects account for any real asset being securitized and traded in financial markets. However, the ongoing debate in the financial literature, as well as investor preferences in financial markets induce that there may exist reasons to treat real estate as a specific asset class.
For example, [6] find that “during the 1990s, REITs began to exhibit a direct link to real estate returns, indicating that REITs do provide portfolios with some exposure to the real estate asset class. The strength of this link, however, is cyclical in nature. The sensitivity of REIT returns to large cap stocks has declined through time.”
In a subsequent study, [7] employ a variance decomposition to “show that the REIT market went from being driven largely by the same economic factors that drive large cap stocks through the 1970s and 1980s to being more strongly related to both small cap stock and real estate-related factors in the 1990s.” The work in [8] uses cointegration tests, which are well suited to integrate short- and long-term evolutions. Consequently, they contribute to the discussion with the finding that public real estate stocks follow stock markets in the short-run, but adjust to the long-run trends of private property markets.
Although their findings offer an elegant explanation for integrating different partial effects within the literature, extreme events, such as the financial crisis, may affect some of the discovered relationships. While market participants’ preferences and uncertainty may have changed dramatically, the financial and economic environment have substantially changed, as well, affecting equity and property markets to different extents. In order to prevent financial systems’ and, in some cases, state break-downs, dominant central banks provide liquidity at historically low interest rates, intensifying demand in any market for real assets.
The work in [9] takes up the point that the relationship between securitized real estate and other securities could be driven by market phases and develops an adjustment procedure for portfolio selection diversifying with real estate or other asset classes, when market phases change. Cyclical behavior in the relationship between property markets and equity markets was found by [10], as well. “During the boom phase, leverage and global portfolio allocation positively affected returns, while allocation to Germany had a negative effect.” Beyond temporal and cyclical behavior, [11] extend on the work of [7] in order to extract a common real estate factor inherent in securitized property and other securities by employing extensive corrections.
Given that the financial literature on real estate identifies potentially several interfering cyclicalities in securitized real estate, it is not surprising that [3] finds that measures of information-based trade vary significantly for different industries and over different levels of corporate government elements, such as listing standards at the stock exchange, while analyzing data for Russian financial markets.
From the perspective of informational asymmetries in financial markets, the instability within the relationship between securitized real estate and other securities could affect information transmission in general. Consequently, the aim of this article is to provide empirical evidence on information-based trade in financial and equity markets by concentrating on the dominant influence of equity or of real estate-specific factors.
3. Methodology and Data
The aim of the following section is to define the set of empirical measures used in this paper to analyze empirical links between real estate and other asset classes. Discussing theoretical basics, empirical characteristics and potential performance in estimating information-based trade is necessary to understand the way data are selected and transformed for the subsequent analysis.
3.1. Empirical Measures of Information-Based Trade
Employing classical methods of time series analysis, such as variance-decompositions, vector-autoregressive or cointegration approaches, is straightforward for the description of informational links between different financial assets. From the perspective of market microstructure, however, theory provides a different set of empirical measures covering the informational content of transactions. Assuming the availability of order book information, not just the frequency of the data departs from what is usually necessary for classical time series methods. Any measure discussed subsequently is rooted in a set of assumptions on informed and uninformed (liquidity) traders. Consequently, the results gained by these measures are beyond a simple mathematical verification of what has been found before, since they show a closer relation to economic theory.
Order book information contains price and volume combinations. Based on this observation, one could classify measures on information-based trade to volume-based, price- (or return-) based, as well as hybrid measures. For each of these three classes, one representative measure is employed.
Based on an ideal setting and due to its theoretical elegance, the probability of information-based trading (PIN), derived in [12], was the perfect transaction-based information measure. However, empirically, it is not without problems. Although a number of modifications can be employed to improve the convergence of the likelihood function, the PIN can rarely be estimated for every observation in the set of data. For that reason, it is proxied by the skewness in trading volume, which is available over the whole time series and proposed in [13].
As a representative for return-/price-based measures, [14] extracts firm-specific (idiosyncratic) variation out of the general market and industry evolution. In order to compute this statistic, return series for each asset are regressed on the corresponding industry and market indices to collect the amount of variation, which cannot be explained by these two variables.
Price-volume combinations are addressed by two other measures: The approach developed by [15] can be seen as a modification of the Roll88-criterion using a return-volume combination instead of additional information based on the market and industry evolution. Finally, the measure proposed by [16] is often used as an indication of illiquidity in financial markets, since it covers the absolute percentage price change per dollar of daily trading volume.
3.2. Volume
The PIN is well rooted in market microstructure theory, since it can be related to the seminal contributions in [1] and [2]. Consequently, a large number of empirical papers borrow from the idea proposed in [12] by enhancing the basic framework to specific applications.1
In order to compute the PIN as defined in Equation (1), the probability of information events α, as well as the amount of uninformed order flow, for buy orders and for sell orders, and the number of informed traders μ must be estimated. Based on further assumptions regarding the binomial and Poisson distributions, from which uninformed and informed traders emerge, as well as the share of trading days with negative information signals (δ), the following likelihood function is derived:
Although [29] provide us with an improved estimation procedure for the PIN, its empirical properties are weak. Using a set of 125 combinations of start parameters for the likelihood function, rarely more than 50% of the set of data shows converging solutions. Given this empirical criticism, [13] uses a set of simulated data in order to test the accuracy of different information measures and shows that skewness in trading volume serves as the second-best proxy in terms of accuracy, while its empirical advantage is straightforward: skewness scores are easily available over the whole range of data. The remainder of this paper relies on skewness scores as representative for volume-based information measures.
3.3. Price
Price data are the empirical basis for the Roll88 measure. As proposed in [14], is extracted from regressing , the return on stock i, on , the market return, and , the return of a firm’s industry index, as shown in Equation (3).
Given that represents the share of information, which is not due to industry or market trends, it can be interpreted as firm-specific information. While [30,31,32,33,34,35,36,37] represent only the part of the recent literature borrowing from this measure as the information statistic, [34] or [37] use to predict firms’ future earnings.
Comparing Roll88 to the PIN and the skewness of trading volume, a disadvantage of the latter is that it is not bound between zero and one, which is the case for the two other measures. However, only Roll88 and skewness are directly available for practical applications, while computational efforts needed for the PIN range beyond reasonable implementations in financial markets.
3.4. Price and Volume Combined
Two forms of price-volume combinations are used: while [15] try to disentangle risk-sharing from speculative trades, [16] uses the impact of transactions on returns.
The work in [15] assumes that “returns generated by risk-sharing trades tend to reverse themselves, while returns generated by speculative trades tend to continue themselves.”2 After filtering a firm’s return series for autocorrelation by means of (), the remaining interaction between lagged returns and trading volume shows whether trade patterns are persistent (speculative) or mean reverting (risk sharing). If is significant, it can be used as an indicator for the amount of information-based trade.
Although the authors perform extensive robustness tests on the measure, [13] shows some empirical weaknesses, complementing [30], who show that 40% of daily returns are zero, suggesting that potential market participants do not posses enough valuable information for conversion into trades. This finding may be addressed by [16], relating the absolute percentage price change to the value of daily trading volume. For his measure of illiquidity, he finds high correlation with the small firm effect.
3.5. Alternative Measures
It would not be difficult to find other variants of the measures outlined above in the relevant literature. A substantial number of PIN variants are proposed for the reason that its empirical properties are not very attractive.3 The work in [38] contributes to this strand of the literature by showing that simpler versions of order imbalance- or volume-based measures can work equally well.
In [14], variants of the measure outlined before were extensively tested without significant improvement of the performance of measuring informational asymmetries. While [39] focuses on illiquidity, a broader comparison of the accuracy of information measures is provided in [13]. Based on a set of simulated data, it is striking to note that the values calculated for the PIN measure almost perfectly fit the simulated informational content. Overall, the difference in accuracy between PIN and Roll88 amount to a range of 15% to 40%. Even though some extent of these differences and the high ratio of convergence may be due to the simulation technique, one general finding of the paper is that an isolated analysis of price-based measures may lack substantial informational content in securities’ informativeness. In general, it would be useful to use PIN or its proxy skewness and Roll88 as complements rather than substitutes.
3.6. Sample Selection
Given the empirical requirements defined in the antecedent section, comparable data on real estate and other stocks must be obtained to analyze the informational relationship between different asset classes. In order to obtain an almost complete picture on German real estate stocks, the constituent list of the DIMAXwas used as a starting point. Since 1995, the German private bank Ellwanger & Geiger, specializing in real estate and investment banking, has calculated the DIMAX. With 66 constituents (31 December 2014), the index covers nearly the complete set of German real estate stocks. Due to the fact that daily data are collected from Thomson Reuters Datastream over the period from 1 January until 31 December 2014, constituent adjustments during this period are tracked. Consequently, the total number of real estate stocks in the set of data amounts to 80, since a number of titles, which left the index (e.g., due to mergers or delistings), were re-added to accomplish the picture of the real estate segment of the stock market.
According to [43], less than 5% of the representative worldwide investable market portfolio accounts for real estate, and the amount of average daily trading volume in real estate stocks remains significantly below the range of market liquidity for Apple, IBM or other blue chips; reasonable comparisons between real estate and other stocks should rather focus on the mid cap and small cap segment of the market. For German exchanges, this segment is represented by the constituents of the MDAX and the SDAX balancing the sample to a total number of 164 titles.
Except for the PIN, all discussed empirical measures are based on volume and price. Time series of these two figures come from the number of daily trading volume (in thousands of shares), as well as the total return series, which are modified stock prices due to dividend payments and stock splittings.
For [14], idiosyncratic return series need to be complemented by market indices, as well as sector-specific indices. Since it is beyond the scope of this article, and as Roll shows, discussing the choice of the market portfolio does not contribute in this context. Consequently, it is assumed that DIMAX, MDAX and SDAX are well-suited market portfolios for the specific segments, and sector-specific return evolutions are tracked by means of respective DAX supersector indices.4
All time series on prices, indices and volume were transformed to logarithmic values to rule out statistical effects due to the level of the figures in the set of data. For that reason, some average scores may amount to negative values. To omit missing values for days when the trading volume was zero, an insignificant constant (0.00000255) was consistently added to the number of daily trading volume.
Instead of computing the measures on information-based trading over the entire period of time, rolling subsamples of 30 trade days were used. From a statistical point of view, these time frames of approximately 1.5 months generate a computational minimum of observations for the calculus. From the point of view of the nature of information-based trade, informational advantages in financial markets are rather short-lived, justifying time frames as short as possible.
4. Descriptive Analysis and Intertemporal Evolution
Based on the data from January 2010 until December 2014, descriptive statistics on total returns and the amount of trading volume are depicted in Table 1.

| Measure | n | Return | Volume |
|---|---|---|---|
| Real Estate | 80 | 0.0037 | 7.2397 |
| (0.0370) | (5.4321) | ||
| MDAX | 39 | 0.0009 | 24.6240 |
| (0.0124) | (14.5617) | ||
| SDAX | 43 | 0.0008 | 6.8527 |
| (0.0088) | (4.7077) | ||
| Basic Materials | 9 | 0.0005 | 3.5188 |
| (0.0125) | (2.4327) | ||
| Consumer Goods | 16 | 0.0011 | 7.4479 |
| (0.0111) | (9.0829) | ||
| Consumer Services | 16 | 0.0008 | 60.5713 |
| (0.0097) | (40.5200) | ||
| Industrials | 28 | 0.0008 | 114.1383 |
| (0.0132) | (108.9053) | ||
| IT | 3 | 0.0007 | 1.6819 |
| (0.0139) | (2.1285) | ||
| Pharma & Health | 4 | 0.0006 | 3.8218 |
| (0.0113) | (7.1063) | ||
| Financials | 9 | 0.0008 | 2.8203 |
| (0.0084) | (1.6357) |
The table presents descriptive statistics on total returns and the amount of trading volume. The first column gives the names of the different market segments for which column 2 indicates the numbers of respective constituents. Daily returns and volume information were averaged for each market segment. For these conditional average returns and volumes, Columns 3 and 4 show means and standard deviations (in parentheses).
For each index and industry sector, the second column of the table gives the numbers of the respective constituents as listed to the end of 2014. Due to this form of presentation, the figures in the first three rows only amount to 162, and not to 164, as indicated in the antecedent section. Within the period from 2010 until 2014, two companies switched their index classification to the DAX. The lower rows of the column rely on industry classification, which should not change dramatically over time. For that reason, Column 2 for the lower rows can be added to 80 real estate shares to sum to 164 titles.
Comparing daily mean returns, non-real estate shares yield from 0.05% per day for the average investment in the basic materials sector up to 0.11% per day for companies offering consumer goods. Based on a standard deviation of only 0.0084, financials show the least intra-industry variation in returns. Given these comparables, it is striking to note the over-performance of real estate investments, documented by average returns at about 0.37%. This finding is not surprising given the ongoing financial crisis, since it is frequently discussed that German investors relocate their funds to real estate due to low interest in fixed-income assets and concerns about rising inflation rates over the long run. Lacking the possibility to short real estate and since the supply side can only adjust in the long-term, the market for real estate investments is rather demand driven. These rates may only mirror observations in German rental rates, particularly in core markets. Although the subset of real estate shares amounts to almost one half of the set of data, differential return dynamics do not cancel each other out. Standard deviations in the real estate sector are substantially higher than in other asset classes.
The return and volume series aggregated in Table 1 are used to calculate skewness coefficients for the amount of daily trading volume, the Roll, as well as the Llorente information measure and the Amihud illiquidity coefficient for rolling windows of 30 trading days. Aggregate figures are presented in the following Table 2.
| Measure | Skewness | Roll | Llorente | Amihud |
|---|---|---|---|---|
| Real Estate | 0.5254 | 0.1103 | 3.5702 | 3.6739 |
| (0.2916) | (0.0225) | (35.7714) | (0.3332) | |
| MDAX | −1.5438 | 0.3973 | 0.0000 | −6.1257 |
| (0.8445) | (0.1089) | (0.0025) | (0.6868) | |
| SDAX | −1.3218 | 0.2197 | −0.0001 | −2.9633 |
| (0.3881) | (0.0770) | (0.0007) | (0.6097) | |
| Basic Materials | −1.3560 | 0.3917 | −0.0003 | −4.8689 |
| (0.9129) | (0.0951) | (0.0009) | (0.7407) | |
| Consumer Goods | −1.3937 | 0.2541 | −0.0001 | −4.6909 |
| (0.6432) | (0.0820) | (0.0011) | (0.7357) | |
| Consumer Services | −1.1604 | 0.2635 | 0.0003 | −3.7287 |
| (0.5407) | (0.0846) | (0.0043) | (0.6756) | |
| Industrials | −1.5926 | 0.3664 | 0.0000 | −5.5809 |
| (0.7380) | (0.1202) | (0.0015) | (0.7374) | |
| IT | −1.6804 | 0.3077 | −0.0002 | −3.1368 |
| (0.8041) | (0.1084) | (0.0008) | (0.9215) | |
| Pharma & Health | −1.0197 | 0.2934 | −0.0001 | −3.4399 |
| (0.7949) | (0.0950) | (0.0008) | (1.3123) | |
| Financials | −1.6095 | 0.2375 | 0.0001 | −3.8645 |
| (0.6656) | (0.0862) | (0.0006) | (0.6895) |
The table presents descriptive statistics of four measures related to information-based trade. The first column gives the names of the different market segments. The following columns depict means and standard deviations (in parentheses) over the four information measures (skewness in volume, the Roll and Llorente information measures, Amihud illiquidity coefficient).
Relying particularly on the first three double rows of the table, comparing real estate to the MDAX and SDAX figures reveals substantial differences according to any measure used in this article. While mean skewness coefficients of trading volume in real estate stocks exhibit positive coefficients (right-skewed), all remaining asset classes are left-skewed. The table shows lower skewness coefficients for mid caps compared to small caps. Sector-specific values for IT, industrial and financial stocks yield the lowest coefficients. This finding is nontrivial, since banks, insurance companies and other financials are often bound with real estate to one industry index. Splitting financial services and real estate companies, which was necessary for the analysis conducted in this article, reveals opposing trends within one sectoral index of the DAX family.
The following column on the Roll information measure offers figures on informational content, which can be interpreted as follows. Over the whole period of analysis, the highest idiosyncratic return variation, which is the Roll proxy for informational content in the return distribution, is found for mid caps with 39.73% on average. Return variation in small caps is explained to a greater extent by their market- and sector-specific trends. Here, the average Roll score only yields up to 21.97%. The least figures are determined for real estate stocks. The probability for information-based trade tends to be only one quarter as in comparable mid caps titles. Roll coefficients are aggregated to 11.03% on average.
Given the Roll information measure, similarities between real estate and financials are stronger. The average Roll score for financials is among the least values for non-real estate asset classes, supporting the empirical findings for Russian stocks in [3].
While exploding Llorente coefficients for real estate in comparison to other asset classes are quickly described, the last column with Amihud illiquidity coefficients can be easily linked to the findings in the Roll column. Note that negative values for the Amihud figures do not point to negative illiquidity. These figures are due to the logarithmic transformation of original data.
Observing the least values for mid caps and industrials is reasonable, since stocks joining the MDAX show substantially higher trading intensity than non-indexed or SDAX titles. Real estate stocks account for the highest illiquidity coefficients. Systematically higher liquidity premia in the real estate sector may relate to lower Roll scores, because they may generate higher covariation with the market trend. Finding the second-lowest Roll scores mirrored by the second-highest Amihud coefficients lends more support to this argument.
After analyzing aggregate statistics over the whole period of analysis, the following figures give more precise insight into the temporal evolution of information-based trade.
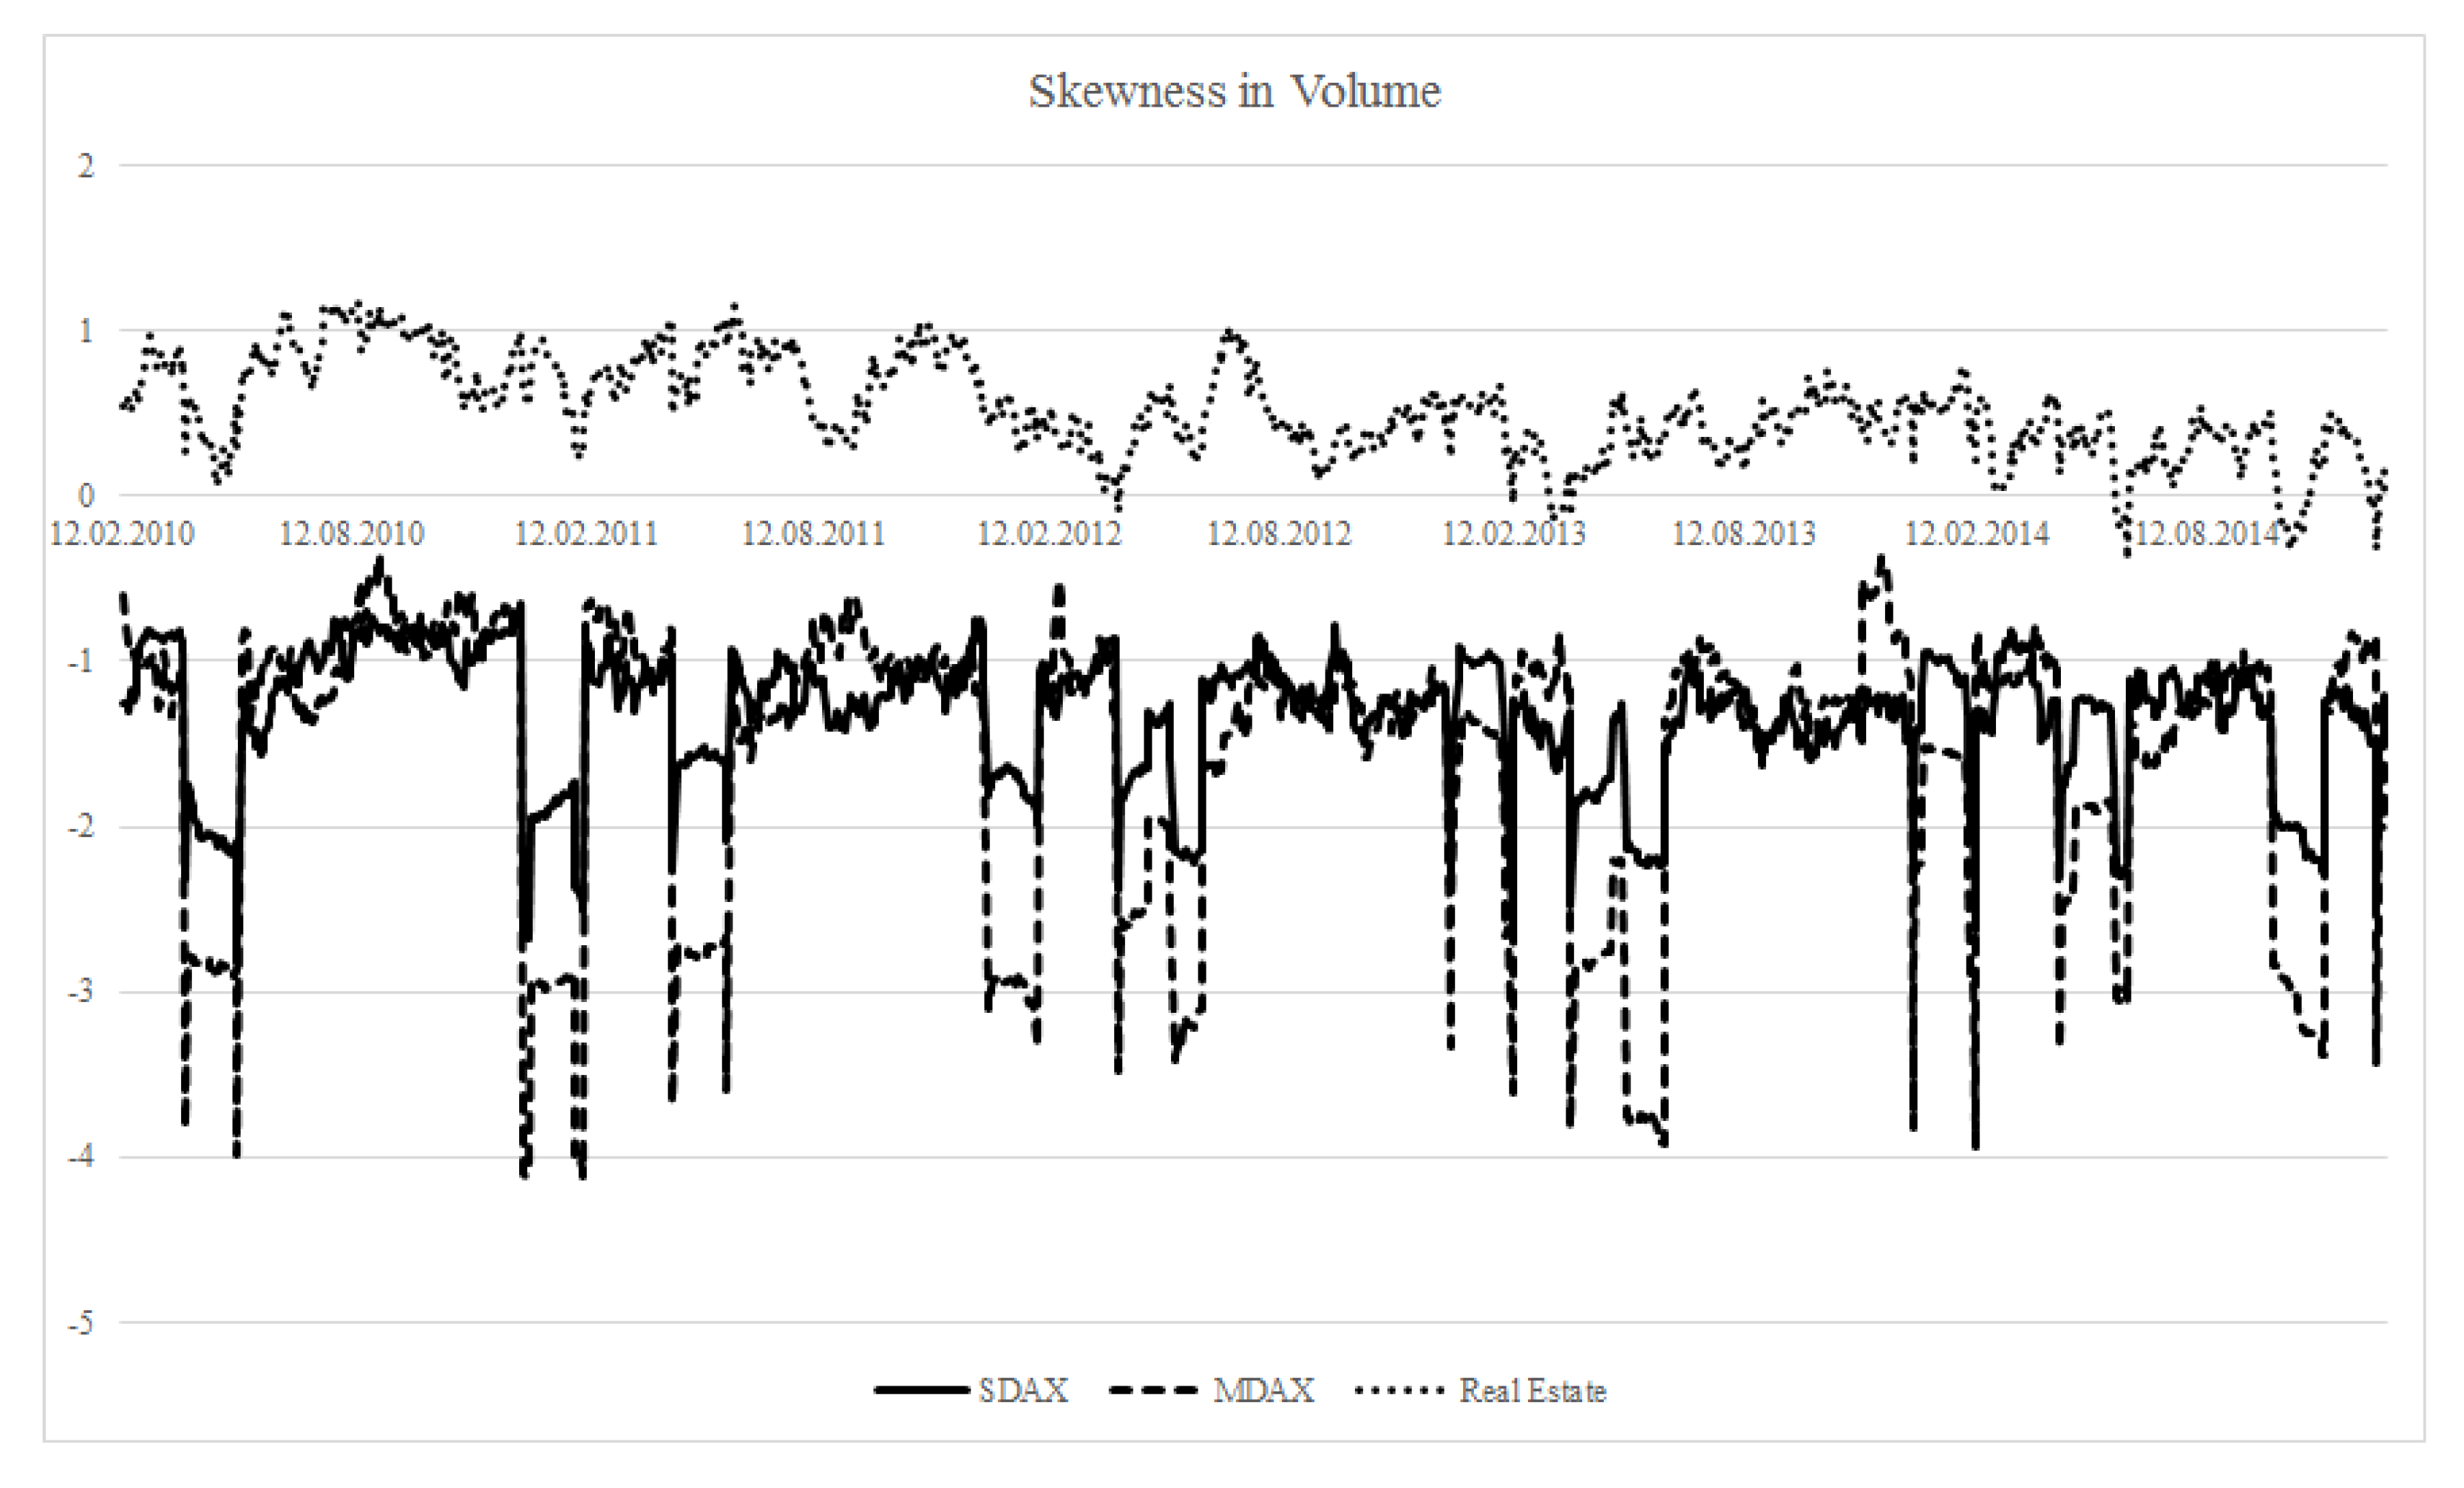
Figure 1, Figure 2, Figure 3 and Figure 4 again verify substantial differences in the amount of information-based trade between real estate and other assets. Analyzing the temporal evolution of the measures, Figure 2 reveals an effect that replicates to some extent over the other figures, as well. As [44] assume, the information content for every asset class is time varying.
Moreover, the figures shows similar trends over the assets. Raising (decreasing) lines in the MDAX and SDAX series are accompanied by raising (decreasing) lines for real estate. Although the amount of information-based trade differs substantially over asset classes, an impression of covariation emerges, given that similar observations may be made for the other measures, as well. This finding points to the need for analyzing the interdependence among the measures for different asset classes to determine potential information links. In this respect, this article contributes to the literature implementing volatility spillovers in returns to track information flows in financial markets by a complementary methodological approach.
Figure 1.
Estimates of rolling window skewness coefficients. The figure is a graphical representation of rolling window skewness coefficients averaged for the sub-samples of real estate stocks, as well as the constituents of the MDAX and the SDAX.
Figure 1.
Estimates of rolling window skewness coefficients. The figure is a graphical representation of rolling window skewness coefficients averaged for the sub-samples of real estate stocks, as well as the constituents of the MDAX and the SDAX.

Figure 2.
Estimates of rolling window roll information measures. The figure is a graphical representation of rolling window Roll information measures averaged for the sub-samples of real estate stocks, as well as the constituents of the MDAX and the SDAX.
Figure 2.
Estimates of rolling window roll information measures. The figure is a graphical representation of rolling window Roll information measures averaged for the sub-samples of real estate stocks, as well as the constituents of the MDAX and the SDAX.
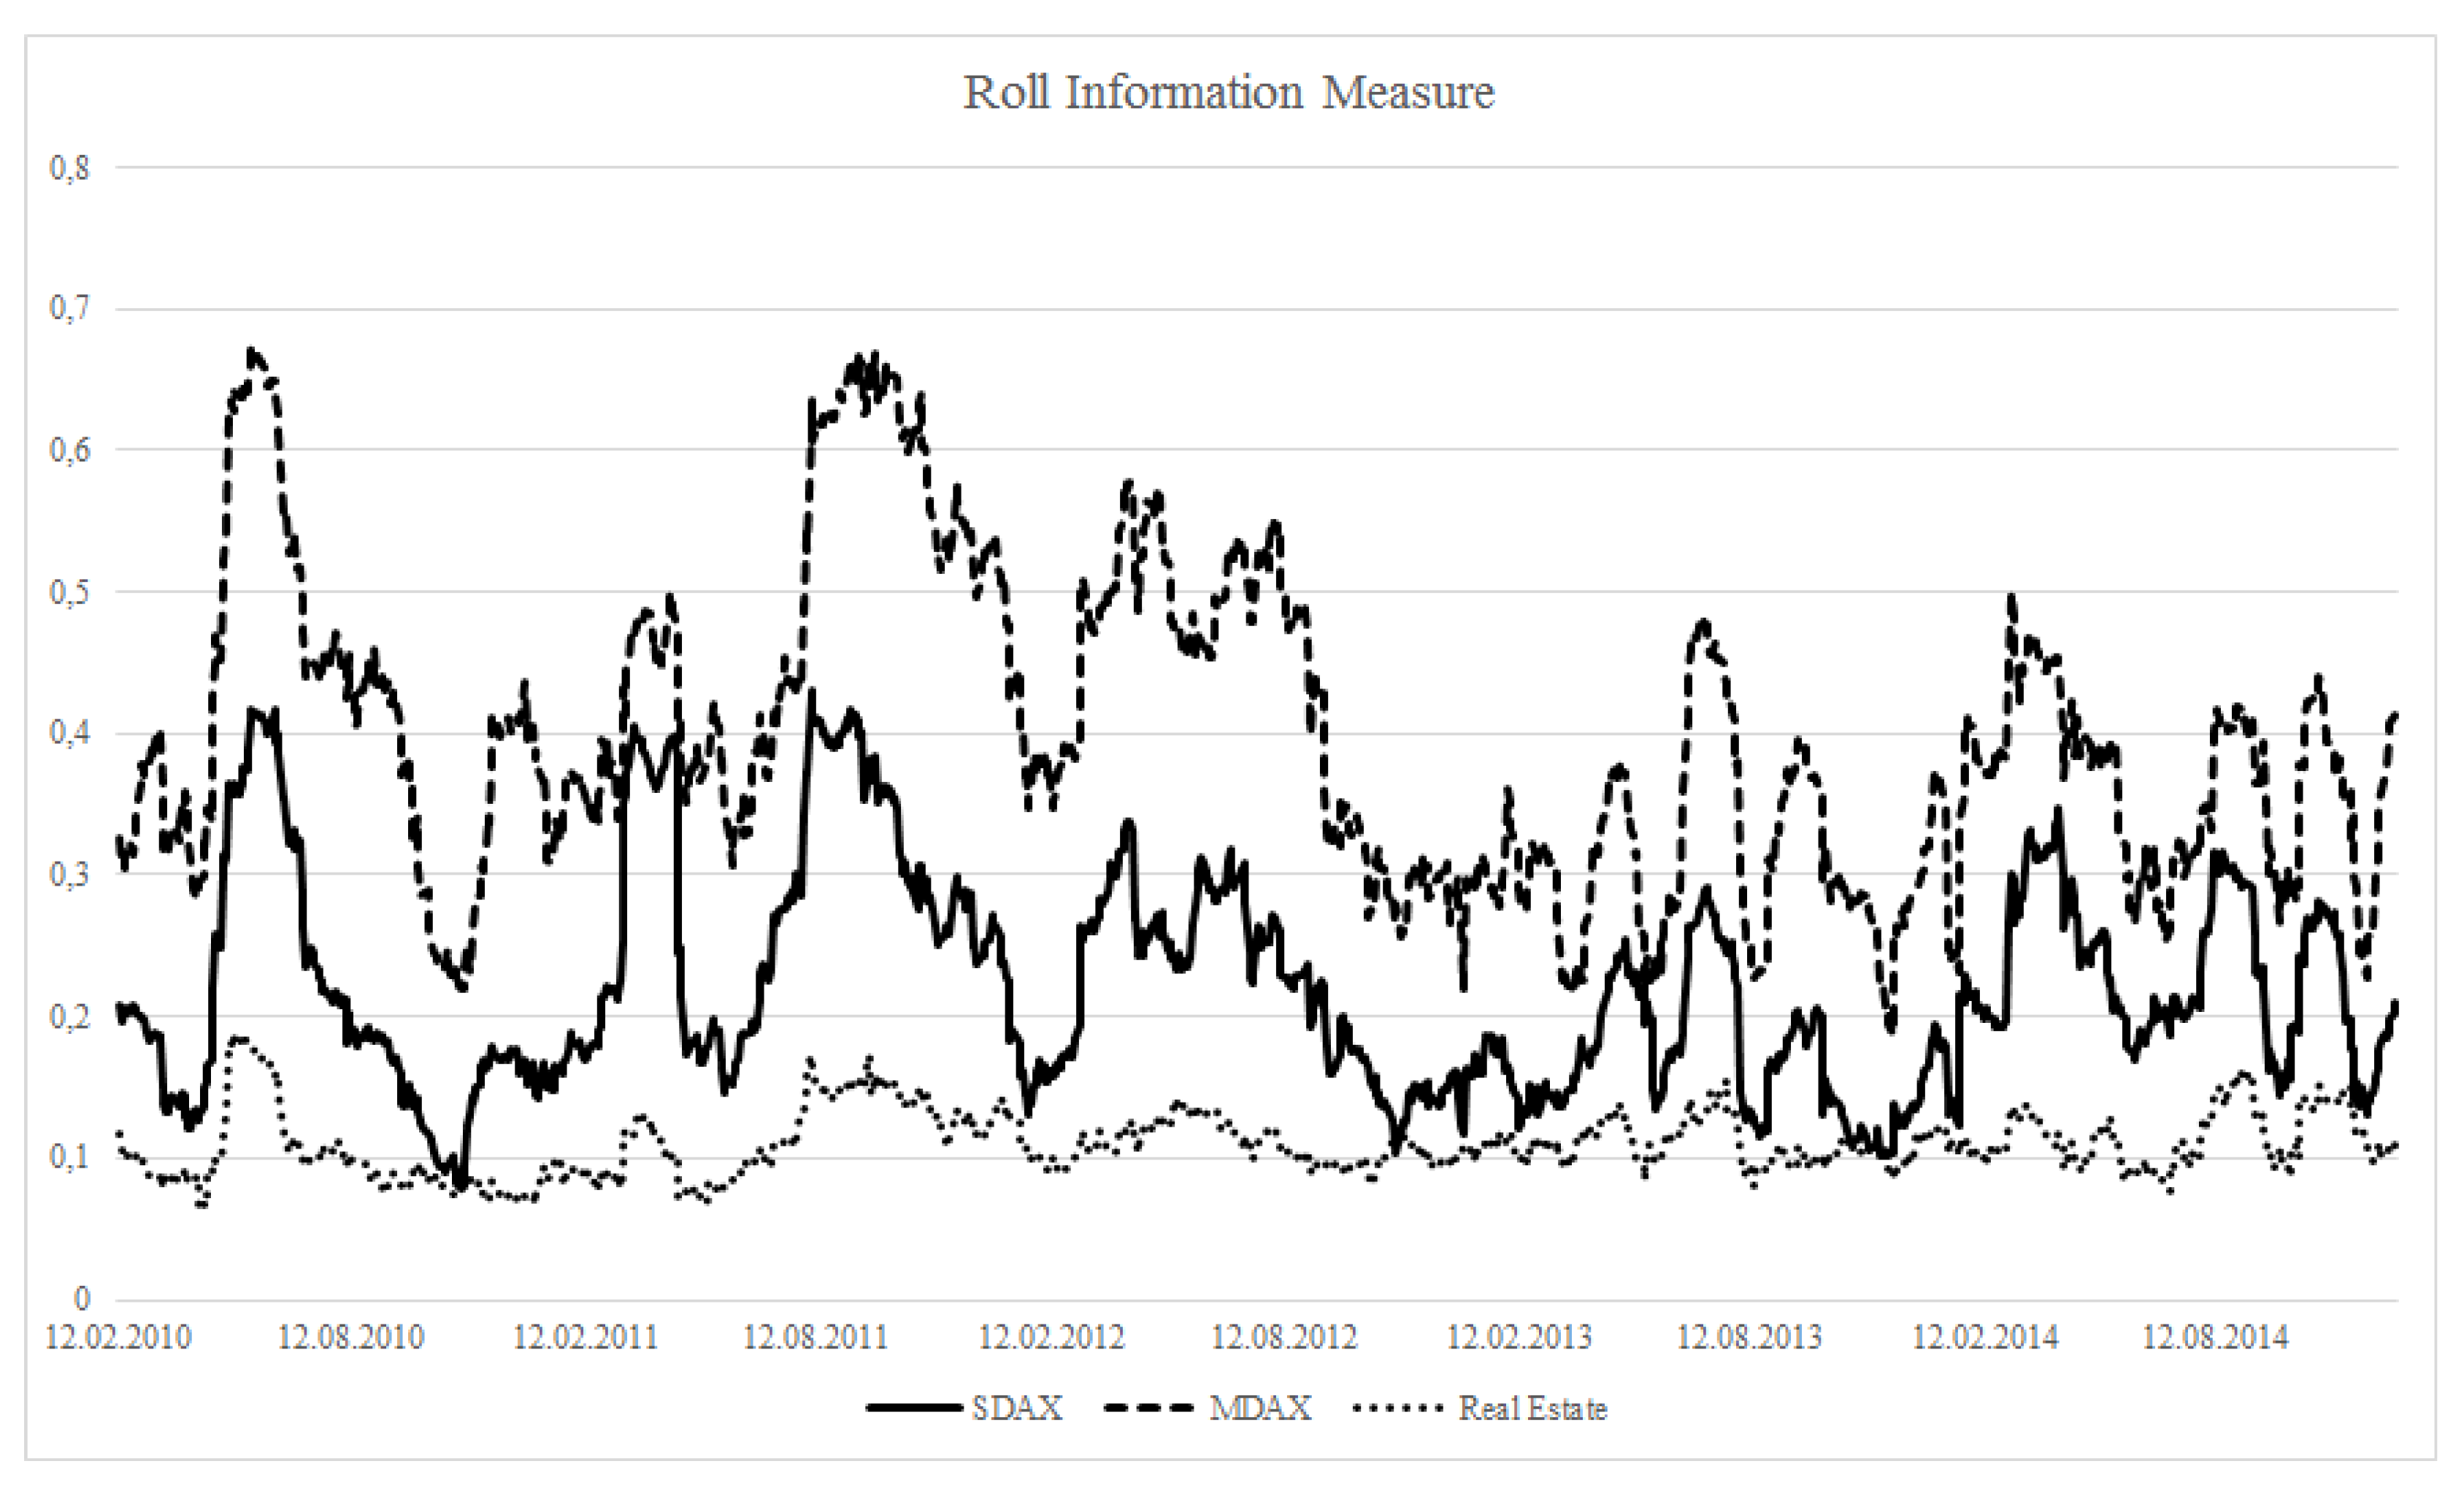
Figure 3.
Estimates of rolling window Llorente information measures. The figure is a graphical representation of rolling window Llorente information measures averaged for the sub-samples of real estate stocks, as well as the constituents of the MDAX and the SDAX.
Figure 3.
Estimates of rolling window Llorente information measures. The figure is a graphical representation of rolling window Llorente information measures averaged for the sub-samples of real estate stocks, as well as the constituents of the MDAX and the SDAX.
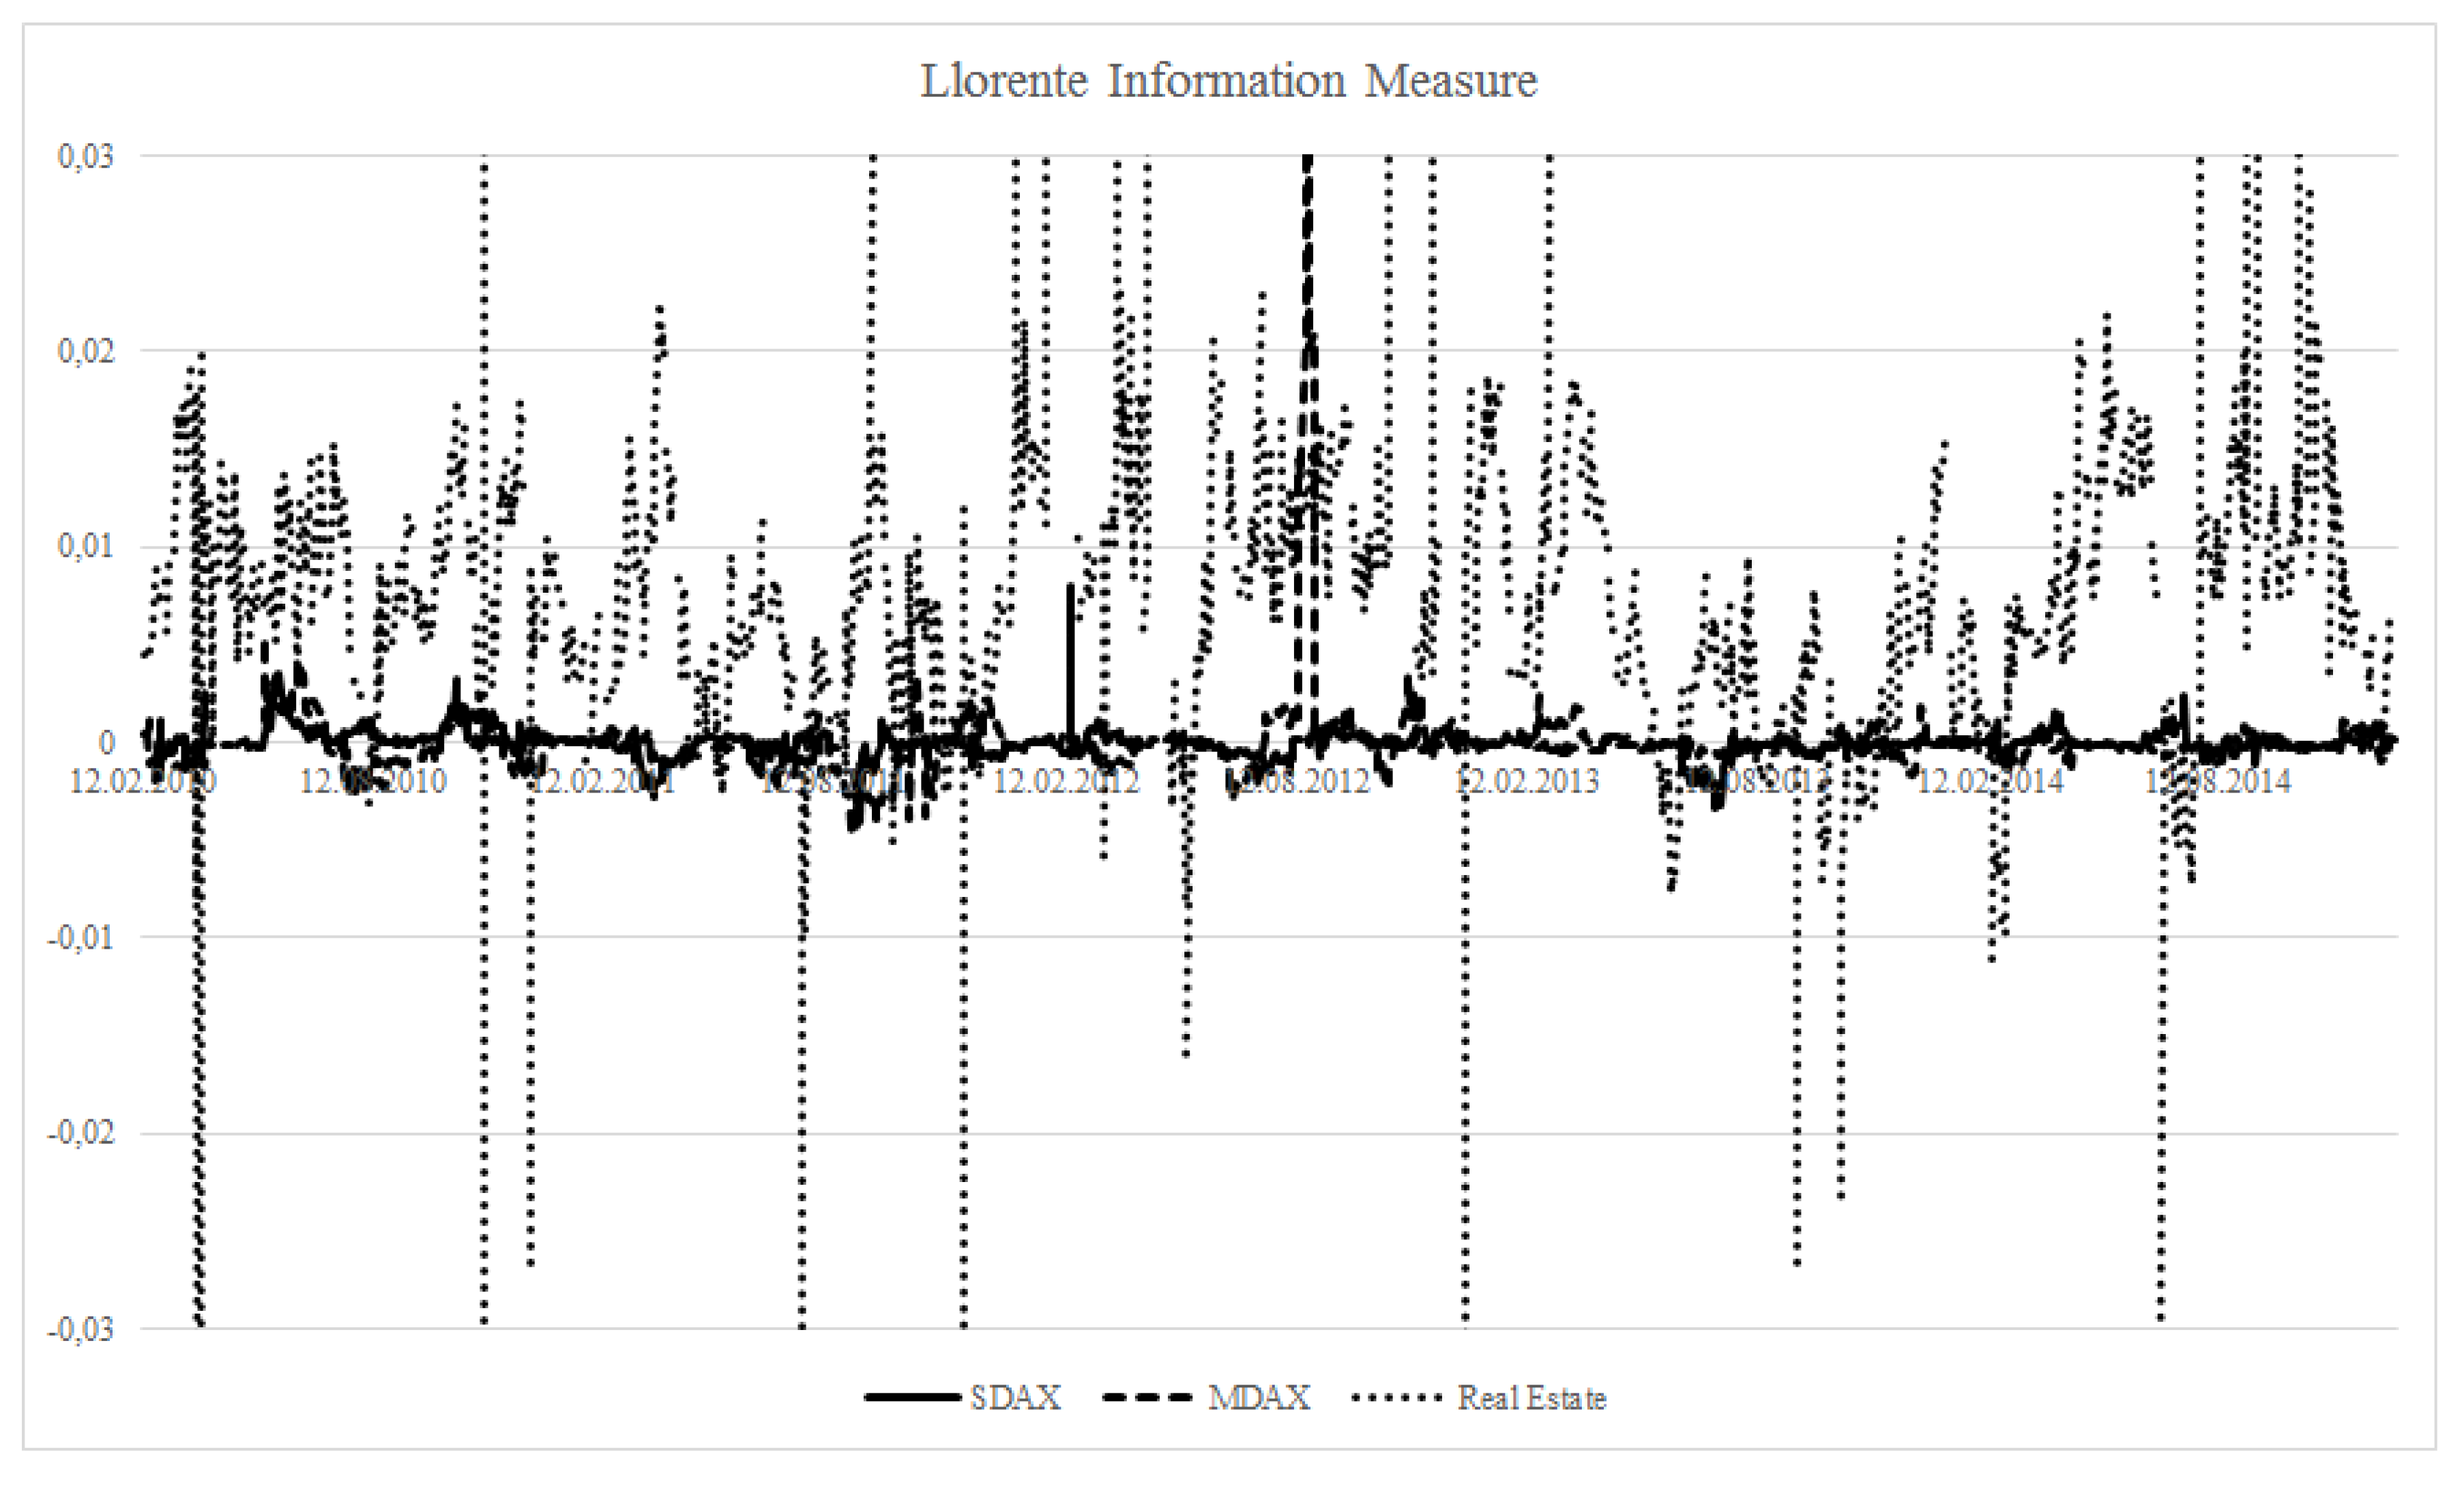
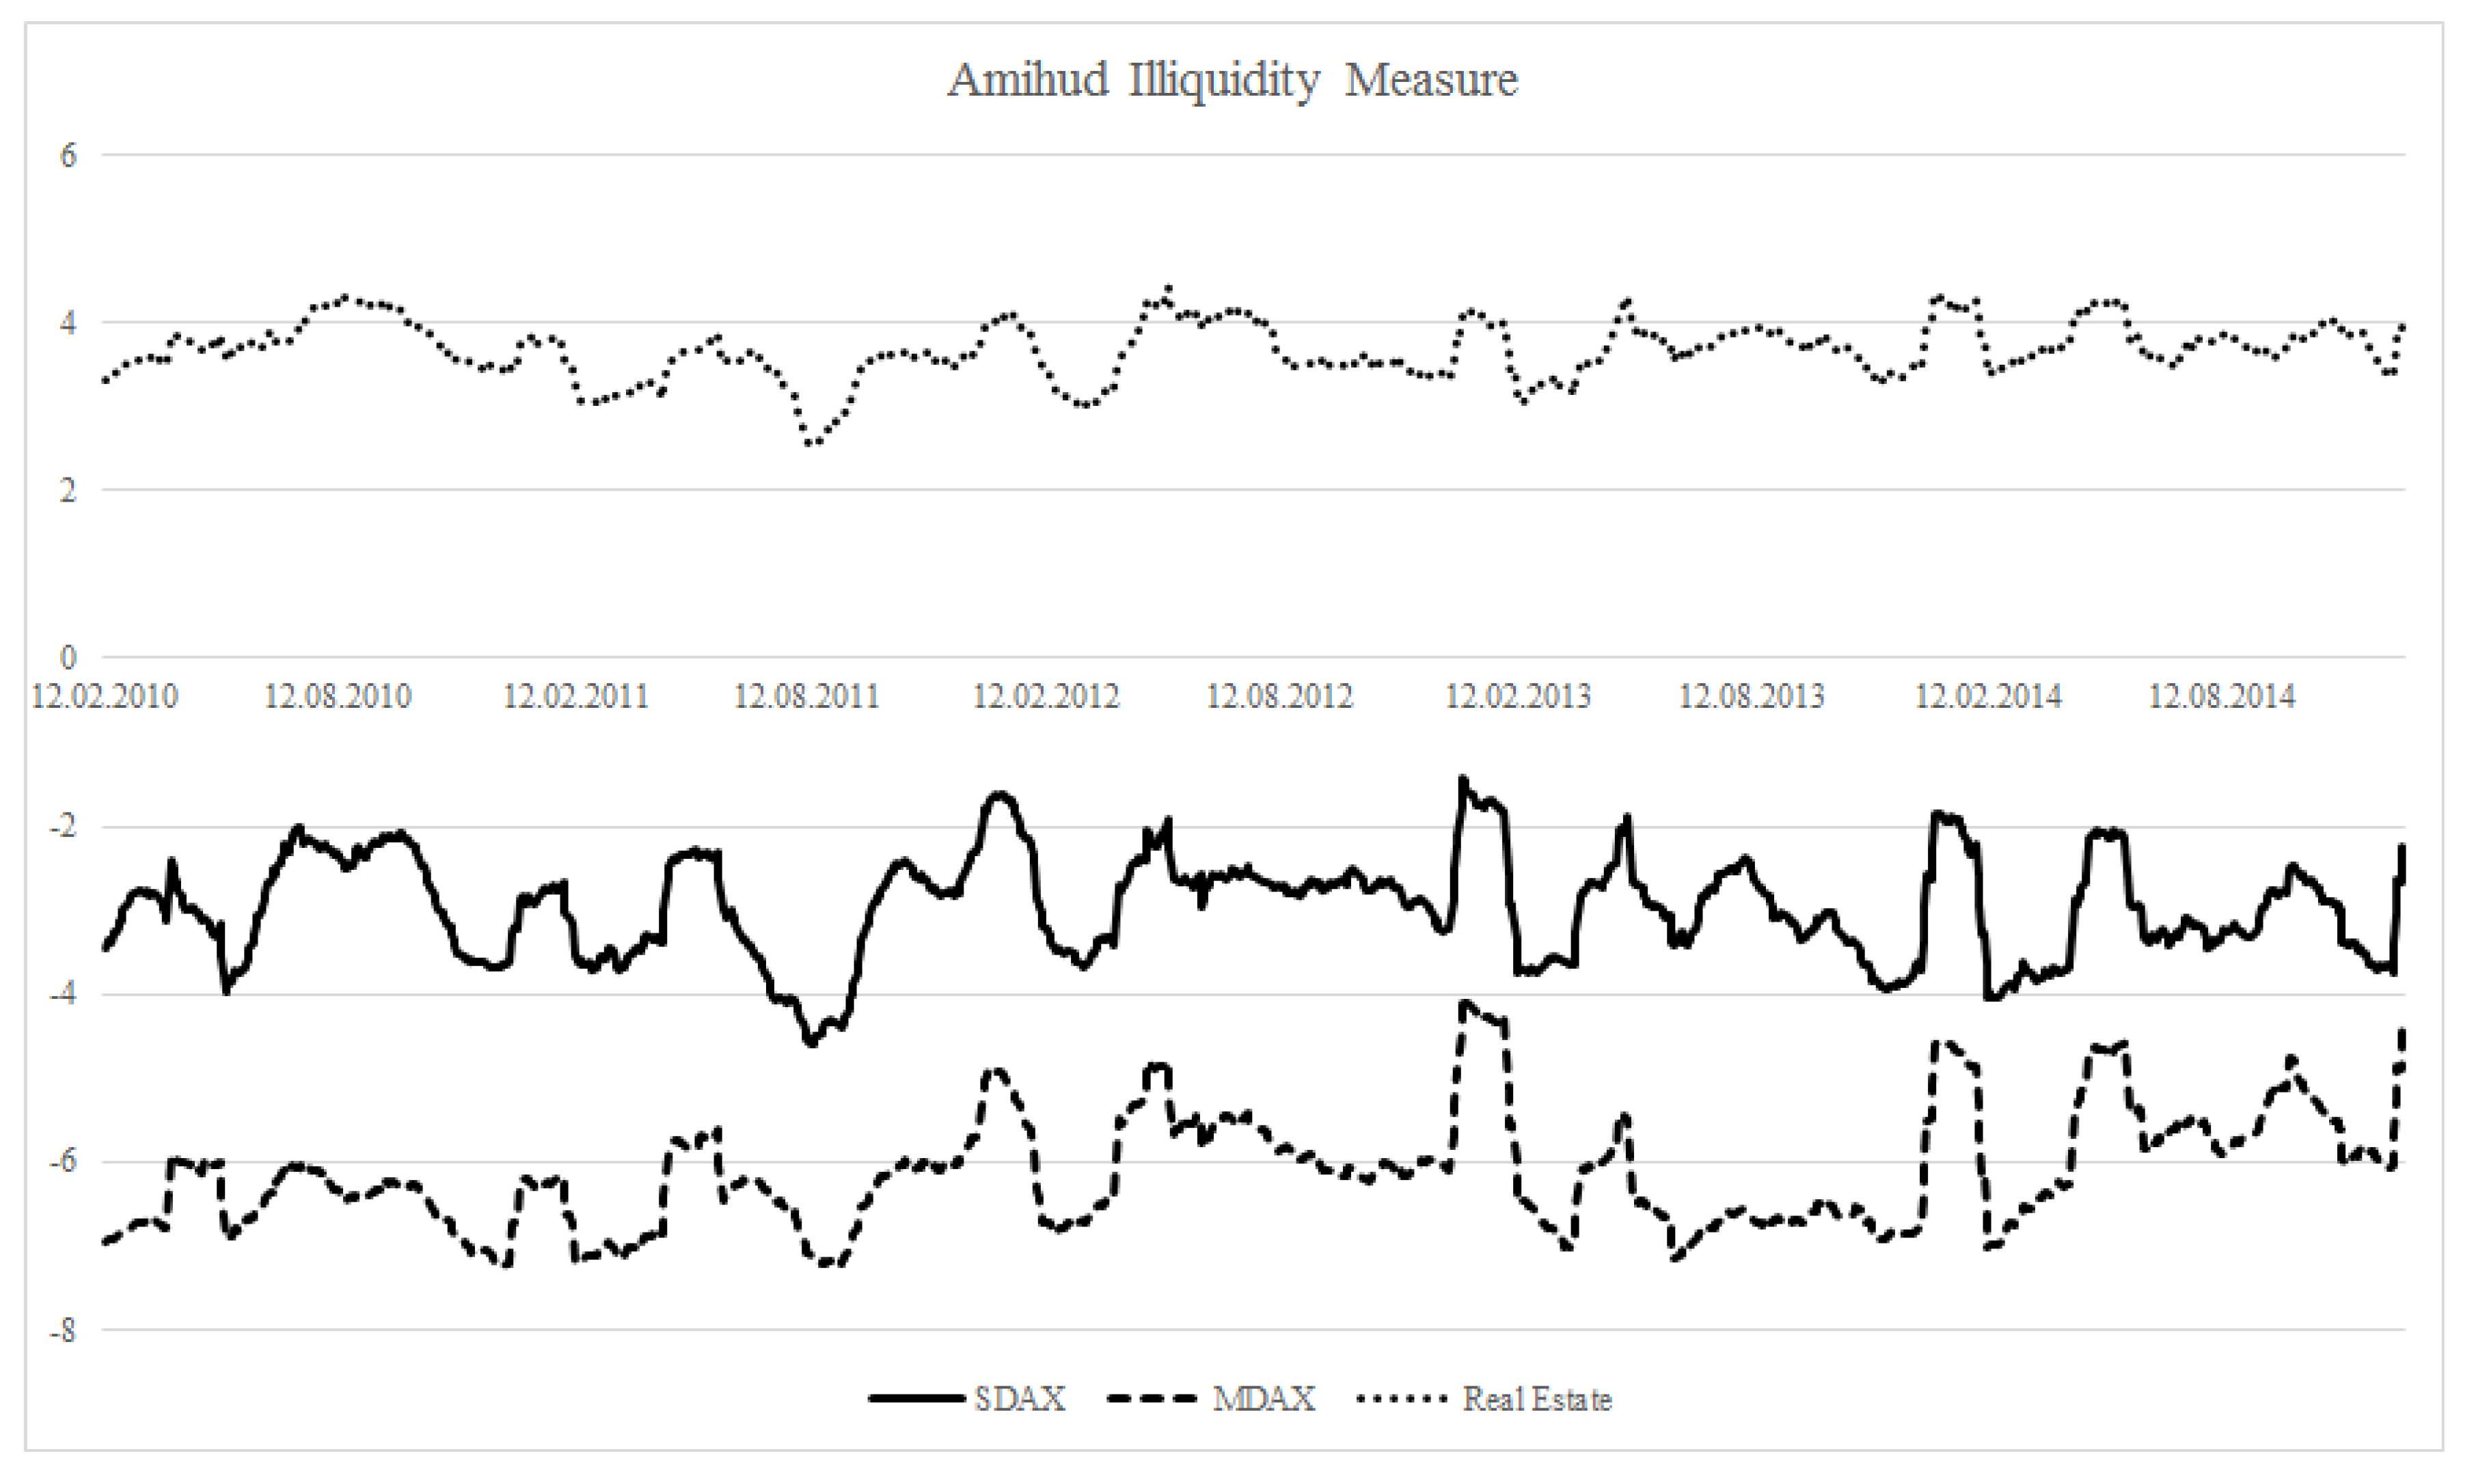
Figure 4.
Estimates of rolling window Amihud illiquidity coefficients. The figure is a graphical representation of rolling window Amihud illiquidity coefficients averaged for the sub-samples of real estate stocks, as well as the constituents of the MDAX and the SDAX.
Figure 4.
Estimates of rolling window Amihud illiquidity coefficients. The figure is a graphical representation of rolling window Amihud illiquidity coefficients averaged for the sub-samples of real estate stocks, as well as the constituents of the MDAX and the SDAX.

5. Interdependence
As discussed in Section 2, a large body of empirical literature discusses whether real estate stocks either follow the evolution of the general stock market or the property market. In order to analyze the interdependence between real estate and other asset classes, for each information measure, pairwise correlation coefficients between two asset classes are depicted in Table A1, Table A2, Table A3 and Table A4 in the Appendix.
To compute 0.3299 as the correlation coefficient between real estate and MDAX shares in Table A1 (Appendix), for each point in time, skewness scores are calculated over all real estate shares. This time series of mean skewness in real estate volume is consequently correlated to the mean skewness in MDAX shares. Based on Table A1 with correlation coefficients in the skewness in volume, it is striking to note that high significance is broadly spread over the sample. Most important for the analysis of real estate in comparison to other asset classes is the first interior column of the table.
Although all correlation coefficients are significant at the 1% level, correlation with IT (0.1172) amounts to only one quarter of the corresponding value for consumer goods. Based on these values on skewness, it seems well justified to put real estate close together with financial assets. The correlation coefficient between financials and real estate yields 0.4224, surpassing any other sector-specific correlation coefficient.
Within the upper section of the table, it is not surprising to see that real estate not only correlates with other sectors, but also with compound indices. Comparing correlation with MDAX and SDAX points to the notion that real estate shares behave rather like small caps instead of mid caps.
While Table A2 (Appendix) and Table A4 (Appendix) indicate similar, but in quantitative terms, even stronger correlations, correlation coefficients given in Table A3 (Appendix) remain insignificant in the first interior column. As the Llorente measure is seen as controversial in the literature, this finding does not necessarily weaken the correlations determined by means of the other three measures. Nevertheless, the tables indicate a substantial amount of correlation between other sectors, as well. In order to come closer to answering the question “what drives dynamics in informational content in real estate stocks?”, heteroskedasticity robust linear regressions with standardized values are estimated on the compound index and the industry index level.
Table 3 presents us not only with comparable statistics on the indices, but with comparable figures on information measures. Given the criteria for the goodness of fit for the models in general, the regression in Roll outperforms with an AIC of round −6957. As the adjusted indicates with 0.5115, more than half of the variation in the mean Roll variance can be attributed to MDAX and SDAX informational dynamics. Comparing the two standardized coefficients of 0.0787 and 0.6465, it becomes clear that a substantial part of the covariation originates from small cap dynamics. The impact of a 1% change in mean SDAX informational content is almost nine-times as large as the comparable impact for mean MDAX.
The regressions for Amihud, skewness and Llorente lend support to this finding in specific ways. While the second-best performing model, Amihud, only differs in terms of criteria on the goodness of fit and the relative size of standardized regression coefficients, the skewness regression reveals adverse effects in MDAX and SDAX. Given the negative coefficient for mean MDAX in the Llorente regression, support can be found for the adverse effect in the skewness regression. In general, all regressions reveal a stronger impact of informational content in SDAX to real estate than in MDAX.
| Measure | Skewness | Roll | Llorente | Amihud |
|---|---|---|---|---|
| Dependent | Real Estate | Real Estate | Real Estate | Real Estate |
| MDAX | −0.2981 | 0.0787 | 0.0166 | 0.1945 |
| (0.0000) | (0.0670) | (0.1690) | (0.0000) | |
| SDAX | 0.7250 | 0.6465 | −0.0296 | 0.6297 |
| (0.0000) | (0.0000) | (0.0090) | (0.0000) | |
| adj. | 0.2389 | 0.5108 | −0.0008 | 0.6081 |
| AIC | 130.955 | −6956.663 | 10,707.66 | −375.0091 |
| VIF | 4.00 | 3.79 | 1.02 | 2.03 |
The table presents results over four heteroskedasticity robust linear regressions. For each information measure, index-/sector-specific means are calculated. Based on the assumption that the general stock market drives real estate dynamics, real estate mean values are used as dependent variables, with MDAX and SDAX means as independent variables. The upper double rows indicate standardized regression coefficients, followed by p-values in parentheses. In the lower part of the table, regression statistics, such as adjusted , the Akaike Information Criterion (AIC) and variance inflation factors, are shown.
Sector-specific regressions are shown in Table 4. Again, Roll regressions show the best model performance, while Llorente regressions failed on the sector level. The interior fields of the table reveal an unbalanced set of independent variables, due to the reason that the table only contains consolidated information on fitted regressions. Starting with fully-parametrized models, insignificant explanatory variables are excluded. Moreover, in order to avoid multicollinearity, variable-specific variance inflation factors are analyzed. Explanatory variables surpassing a VIFof 5.0 are excluded, as well, although they have shown significance in previous regressions.
As the lower rows of the table show, the sector-specific regressions show slightly better goodness of fits as the previous regressions. Comparing combined regressions with the correlation tables, the importance of the financial sector and both consumer sectors is supported. However, combining and standardizing within information measure-specific regressions reveal their relative importance and nature. In particular, skewness in volume reveals negative impacts originating from the financial sector, while the pairwise correlation coefficient is positive, and the corresponding Roll and Llorente coefficients are positive, as well.
In order to analyze interdependence from other empirical perspectives, the remainder of this section employs principal components and tests on specific sub-samples of the data. First, for each measure of information-based trade, principal components are extracted out of all non-real estate mean time series and then correlated with the real estate mean series. Table 5 reports on the results.
| Measure | Skewness | Roll | Llorente | Amihud |
|---|---|---|---|---|
| Dependent | Real Estate | Real Estate | Real Estate | Real Estate |
| Basic | −0.2298 | |||
| Materials | (0.0670) | |||
| Consumer | 0.3861 | 0.2671 | 0.4692 | |
| Goods | (0.0000) | (0.0000) | (0.0000) | |
| Consumer | 0.1599 | 0.3280 | −0.3658 | |
| Services | (0.0000) | (0.0000) | (0.0000) | |
| Industrials | −0.3508 | 0.6459 | ||
| (0.0000) | (0.0000) | |||
| IT | 0.0952 | |||
| (0.0000) | ||||
| Pharma & | −0.0865 | |||
| Health | (0.0000) | |||
| Financials | 0.3207 | 0.3391 | 0.3081 | |
| (0.0000) | (0.0000) | (0.0000) | ||
| adj. | 0.2407 | 0.6186 | 0.7344 | |
| AIC | 129.9849 | −7270.865 | −867.6107 | |
| VIF | 2.89 | 3.49 | 3.18 |
The table presents results over four heteroskedasticity robust linear regressions. For each information measure, index-/sector-specific means are calculated. Based on the assumption that the general stock market drives real estate dynamics, real estate mean values are used as dependent variables, with means of basic materials, consumer goods, consumer services, industrials, IT, pharma and healthcare, as well as financials as independent variables. The upper double rows indicate standardized regression coefficients, followed by p-values in parentheses. In the lower part of the table, regression statistics, such as adjusted , the Akaike Information Criterion (AIC) and variance inflation factors, are shown.
| Measure | Skewness | Roll | Llorente | Amihud |
|---|---|---|---|---|
| Principal | 0.3910 | 0.7100 | 0.8640 | 0.7180 |
| Component | (0.0000) | (0.0000) | (0.0000) | (0.0000) |
The table gives correlation coefficients followed by their p-values in parentheses. Principal components of mean information criteria are extracted out of all non-real estate sectors and then correlated to the mean information criterion for real estate stocks.
Correlations between the principal components of real estate and other assets amount to more than 70% for the Roll, the Llorente and the Amihud measure. Even the lowest interdependence, which is found in the skewness correlation, yields more than 39%, supporting the notion of strong interdependence.
Second, all stock time series are split into the four quartiles of the distribution of average daily trading volume to determine whether the sector-specific differentials in the amount of daily trading volume relateto the results found before. The distribution of real estate, MDAX and SDAX constituents is given in the following Table 6.
| Index | Real Estate | MDAX | SDAX |
|---|---|---|---|
| Q1 | 36 | 0 | 4 |
| (45%) | (0%) | (0%) | |
| Q2 | 24 | 7 | 12 |
| (30%) | (18%) | (28%) | |
| Q3 | 12 | 14 | 14 |
| (15%) | (36%) | (33%) | |
| Q4 | 8 | 18 | 13 |
| (10%) | (46%) | (30%) | |
| n | 80 | 39 | 43 |
The table presents the numbers of the constituents of real estate, MDAX and SDAX, sorted by the four quartiles of the average number of daily trading volume.
Table 7 reports quartile-specific summary statistics on the four quartiles, which need to be compared to the summaries in Table 2. In the overall view, skewness, Llorente and Amihud scores are substantially higher for real estate, while the corresponding Roll measure shows lower amounts of information-based trade. Except for the Llorente measure, this general trend can be supported by analyzing the quartile figures. Although the specific figures differ between Quartiles 1 through 4, the distances between real estate, MDAX and SDAX averages remain roughly stable. Table 8 differentiates the notion of correlation over the four quarters of the sample. Again, except for the Llorente measure, correlation remains highly significant over the whole sample. Moreover, within the correlations for the Roll measure, higher amounts of trading volume tend to increase the dependence between real estate and other assets. In Quarter2, the correlation between real estate and the MDAX yields only 0.3579 in Quartile 2 and amounts to 0.7168 in Quartile 4 (stocks with the highest trading volume). Correspondingly, in SDAX 0.2114 in Quartile 1 raises to 0.7743 in Quartile 4.
| Skewness | Roll | |||||
| Real Estate | MDAX | SDAX | Real Estate | MDAX | SDAX | |
| Q1 | 2.9899 | - | −0.8750 | 0.0706 | - | 0.1546 |
| (0.4211) | (-) | (0.4835) | (0.0170) | (-) | (0.0773) | |
| Q2 | 0.4041 | −0.4259 | −0.3024 | 0.0885 | 0.2016 | 0.1506 |
| (0.3256) | (1.1212) | (0.3329) | (0.0222) | (0.1022) | (0.0504) | |
| Q3 | −1.4182 | −1.9650 | −1.8539 | 0.1763 | 0.3717 | 0.1997 |
| (0.3411) | (0.5506) | (0.3774) | (0.0592) | (0.1164) | (0.0853) | |
| Q4 | −1.8297 | −1.3788 | −1.6604 | 0.2067 | 0.4487 | 0.3042 |
| (0.6749) | (1.2772) | (1.0235) | (0.0717) | (0.1191) | (0.1010) | |
| Llorente | Amihud | |||||
| Real Estate | MDAX | SDAX | Real Estate | MDAX | SDAX | |
| Q1 | 7.7318 | - | −0.0003 | 7.9384 | - | −1.1694 |
| (77.2151) | (-) | (0.0003) | (0.2363) | (-) | (1.6976) | |
| Q2 | −0.0024 | 0.0011 | 0.0000 | 3.4078 | −0.3455 | 0.7080 |
| (0.1044) | (0.0071) | (0.0002) | (0.6627) | (3.1162) | (0.8620) | |
| Q3 | −0.0002 | −0.0002 | 0.0000 | −2.3762 | −5.5019 | −3.4542 |
| (0.0010) | (0.0006) | (0.0005) | (0.8137) | (0.7987) | (0.7173) | |
| Q4 | 0.0000 | −0.0002 | −0.0001 | −4.6706 | −7.5286 | −5.7146 |
| (0.0033) | (0.0015) | (0.0018) | (0.8894) | (0.6996) | (0.6997) |
The table presents means and standard deviations in parentheses over the four volume quartiles of the sample for real estate, MDAX and SDAX.
| Measure | Q1 | Q2 | Q3 | Q4 |
|---|---|---|---|---|
| Skewness MDAX | - | 0.4302 *** | 0.1309 *** | 0.7579 *** |
| Skewness SDAX | 0.4825 *** | 0.5738 *** | 0.4608 *** | 0.7853 *** |
| Roll MDAX | - | 0.3579 *** | 0.6327 *** | 0.7168 *** |
| Roll SDAX | 0.2114 *** | 0.3869 *** | 0.6362 *** | 0.7743 *** |
| Llorente MDAX | - | −0.0502 | 0.0802 | 0.1232 *** |
| Llorente SDAX | 0.0522 | −0.0319 | 0.0076 | 0.2334 *** |
| Amihud MDAX | - | −0.0568 ** | 0.4994 *** | 0.4892 *** |
| Amihud SDAX | 0.8492 *** | 0.3986 *** | 0.6616 *** | 0.6102 *** |
The table presents correlation coefficients for the information measure between real estate and MDAX/SDAX over the four volume quartiles. For each correlation coefficient in the table, significance at the 10% level is indicated by one asterisk, while significance at the 5% and 1% levels is indicated by two and three asterisks, respectively.
A small number of real estate stocks is indexed as constituents of MDAX (seven titles) and SDAX (five titles). Given that Table 6 shows that real estate shares concentrate in the lower ranges of trading volume, potential size effects need to be analyzed, as well. While the correlations discussed before are based on means over the complete set of all 80 real estate stocks, the results in Table 9 are based on subsamples. Mean information scores for real estate as MDAX and SDAX constituents are computed separately from the remaining real estate titles. Then, the real estate constituents’ mean series are correlated to the mean series of the remaining real estate titles, as well as the corresponding mean figures for the other index constituents.
Although the remaining real estate stocks, as well as index series significantly correlate with most constituent real estate titles, the table reveals the dominant influence of the general stock market on real estate shares. For example, the first interior row of the table reveals that the correlation of constituent real estate with the MDAX information score is nearly ten-times as large as with the remaining real estate sample. Beyond the information given in the table, one could also implement this procedure of analysis as a filter and interpret correlations between the remaining set of real estate stocks to the general MDAX and SDAX series. Except for the Llorente information measure, highly significant (1%) correlations are found, indicating the robustness of the results discussed before against potential size effects.
| Measure | Remaining | ||
|---|---|---|---|
| Real Estate | MDAX | SDAX | |
| Skewness MDAX | 0.0567 *** | 0.5477 *** | - |
| Skewness SDAX | 0.3436 *** | - | 0.2919 *** |
| Roll MDAX | 0.4560 *** | 0.7095 *** | - |
| Roll SDAX | 0.5975 *** | - | 0.7573 *** |
| Llorente MDAX | 0.0102 | 0.1248 *** | - |
| Llorente SDAX | 0.1366 ** | - | −0.1625 *** |
| Amihud MDAX | 0.6219 *** | 0.5189 *** | - |
| Amihud SDAX | −0.0265 | - | 0.3889 *** |
The table presents correlation coefficients for the information measures by separating real estate stocks, which are constituents of MDAX and SDAX, from the rest of the sample. Mean information measures for indexed real estate stocks are correlated with the mean information measure remaining of the remaining real estate stocks, as well as the corresponding mean index score. For each correlation coefficient in the table, significance at the 10% level is indicated by one asterisk, while significance at the 5% and 1% levels is indicated by two and three asterisks, respectively.
6. Conclusions
Aiming at the discovery of informational links in the evolution of real estate and other assets in financial markets, four established, market microstructure measures on information-based trade and illiquidity are applied to a set of real estate, mid and small caps in German exchanges. Given the specific return and volume developments over the last five years, measures computed for MDAX, as well as SDAX constituents are compared to German real estate stocks, yielding substantially lower amounts of information-based trade, which may be linked to higher liquidity premia and longer investment horizons.
From the perspective of market microstructure, the results can be interpreted, on the one hand, as indicators for lower amounts of information production for real estate shares. On the other hand, however, further studies may concentrate on the balance between liquidity traders and informed traders in a multi-market setup, as analyzed by [45]. When shares are traded at comparable exchanges, informed traders may relocate to the market place with the highest potential to camouflage their trades behind liquidity traders.
From the perspective of portfolio selection, the study reveals specific characteristics of real estate shares for diversifying portfolio risk. The general findings are robust to the separation of MDAX and SDAX constituents into their respective sector indices, as well as into the four quartiles of trading volume. Moreover, the results on German stocks mirror comparable approaches for Russian stocks, where [3] finds that financials (including real estate) yield the lowest probabilities for information-based trade. While analyzing real estate separately from financial assets, this article also reveals that information-based trade in financial assets is the second lowest.
As indicated by [44], the relationships between real estate stocks and other financial assets may be time varying. For that reason, the evolution of information-based trade for each measure is tracked and compared between real estate and other financial assets. A significant correlation between real estate and other stocks is widely spread over the whole sample for three out of the four measures.
Moreover, regressing standardized information coefficients for MDAX and SDAX on real estate coefficients reveals the relative importance of the mid and small cap segment of the market. Except for Llorente, all regressions reveal the significant influence of stock market evolutions on real estate. Comparing standardized betas shows that the link between real estate and other stocks is substantially stronger, concentrating on small caps instead of mid caps. On the level of industry sectors, real estate shows the closest links to shares of financial companies. Nevertheless, it assumes influences originating from consumer goods and services, as well. Based on the regressions, the general conclusion emerges that up to three quarters of the amount of information-based trade in real estate stocks relate to the evolution of other asset classes.
For future research, two potential extensions are straightforward. First, [37] use measures of information-based trade in relation to the investment behavior of U.S. companies. Following this approach by collecting additional information on balance sheets and investment activity in the sample would allow one to relate their findings (1) to the German market and (2) to differential market segments, but this would broaden the scope of this article extensively.
Second, U.K. and U.S. markets for real estate shares are believed to be developed to a higher extent compared to other countries. Therefore, it would be interesting to know whether the results determined for Russian shares in other articles and for German shares in this article replicate for Anglo-Saxon markets. Moreover, this would allow one to complement recent literature contributions, which analyze variations in information asymmetries over the business cycle by means of well-founded market microstructure measures.
Appendix
| Correlation Roll | Real Estate | MDAX | SDAX | Basic Mat | ConsGoods | Cons Serv | Indust | IT | Pharma/Health | Fin |
|---|---|---|---|---|---|---|---|---|---|---|
| Real Estate | 1 | |||||||||
| MDAX | 0.3299 *** | 1 | ||||||||
| SDAX | 0.4668 *** | 0.8662 *** | 1 | |||||||
| Basic Materials | 0.3001 *** | 0.9211 *** | 0.8087 *** | 1 | ||||||
| Consumer Goods | 0.4037 *** | 0.8848 *** | 0.8206 *** | 0.7854 *** | 1 | |||||
| Consumer Services | 0.3357 *** | 0.8180 *** | 0.8528 *** | 0.7596 *** | 0.6832 *** | 1 | ||||
| Industrials | 0.2906 *** | 0.9524 *** | 0.8653 *** | 0.8478 *** | 0.8219 *** | 0.7526 *** | 1 | |||
| IT | 0.1172 *** | 0.2660 *** | 0.2764 *** | 0.2631 *** | 0.1855 *** | 0.2635 *** | 0.1844 *** | 1 | ||
| Pharma and Health | 0.1942 *** | 0.6876 *** | 0.6366 *** | 0.6884 *** | 0.5612 *** | 0.6287 *** | 0.6545 *** | 0.0060 | 1 | |
| Financials | 0.4224 *** | 0.6948 *** | 0.7427 *** | 0.5924 *** | 0.6133 *** | 0.5491 *** | 0.6353 *** | 0.1721 *** | 0.3990 *** | 1 |
The table presents pairwise correlation coefficients for the skewness in trading volume computed between combinations of asset classes. Rolling window skewness coefficients are computed and averaged for each asset class. Resulting asset class averages are correlated. For each correlation coefficient in the table, significance at the 10% level is indicated by one asterisk, while significance at the 5% and 1% levels is indicated by two and three asterisks, respectively.
| Correlation Roll | Real Estate | MDAX | SDAX | Basic Mat | Cons Goods | Cons Serv | Indust | IT | Pharma/Health | Fin |
|---|---|---|---|---|---|---|---|---|---|---|
| Real Estate | 1 | |||||||||
| MDAX | 0.6335 *** | 1 | ||||||||
| SDAX | 0.7141 *** | 0.8582 *** | 1 | |||||||
| Basic Materials | 0.4494 *** | 0.8760 *** | 0.7156 *** | 1 | ||||||
| Consumer Goods | 0.7307 *** | 0.8307 *** | 0.9049 *** | 0.6255 *** | 1 | |||||
| Consumer Services | 0.7294 *** | 0.8460 *** | 0.9241 *** | 0.6715 *** | 0.8460*** | 1 | ||||
| Industrials | 0.6205 *** | 0.9742 *** | 0.9025 *** | 0.8300 *** | 0.8290 *** | 0.8494 *** | 1 | |||
| IT | 0.4640 *** | 0.7787 *** | 0.6136 *** | 0.7393 *** | 0.5674 *** | 0.6078 *** | 0.7099 *** | 1 | ||
| Pharma and Health | 0.5256 *** | 0.6107 *** | 0.6647 *** | 0.4996 *** | 0.5932 *** | 0.6140 *** | 0.5953 *** | 0.5361 *** | 1 | |
| Financials | 0.7220 *** | 0.8034 *** | 0.9078 *** | 0.6536*** | 0.8138 *** | 0.8020 *** | 0.8280 *** | 0.5541 *** | 0.6295 *** | 1 |
The table presents pairwise correlation coefficients for the Roll measure on information-based trade computed between combinations of asset classes. Rolling window Roll measures are computed and averaged for each asset class. Resulting asset class averages are correlated. For each correlation coefficient in the table, significance at the 10% level is indicated by one asterisk, while significance at the 5% and 1% levels is indicated by two and three asterisks, respectively.
| Correlation Roll | Real Estate | MDAX | SDAX | Basic Mat | Cons Goods | Cons Serv | Indust | IT | Pharma/Health | Fin |
|---|---|---|---|---|---|---|---|---|---|---|
| Real Estate | 1 | |||||||||
| MDAX | 0.0103 | 1 | ||||||||
| SDAX | −0.0239 | 0.1282 *** | 1 | |||||||
| Basic Materials | 0.0689 | 0.2984 *** | 0.3269 *** | 1 | ||||||
| Consumer Goods | −0.0217 | 0.1805 *** | 0.5548 *** | 0.2172 *** | 1 | |||||
| Consumer Services | 0.0013 | 0.8654 *** | 0.0898 *** | 0.0495 | 0.0273 | 1 | ||||
| Industrials | 0.0059 | 0.3821 *** | 0.5928 *** | 0.2584*** | 0.2370 *** | 0.1582 *** | 1 | |||
| IT | −0.0009 | 0.4215 *** | 0.2569 *** | 0.0732 | 0.2064 *** | 0.1544 *** | 0.3579 *** | 1 | ||
| Pharma and Health | 0.0000 | 0.3939 *** | 0.2067 *** | 0.1796 * | −0.0117 | 0.1385 ** | 0.2131 *** | 0.2171 ** | 1 | |
| Financials | −0.0269 | 0.0894 ** | 0.5099 *** | 0.2848 *** | 0.3271 *** | −0.0460 | 0.2031 *** | 0.0180 | 0.0753 | 1 |
The table presents pairwise correlation coefficients computed for the Llorente measure on information-based trade computed between combinations of asset classes. Rolling window Llorente measures are computed and averaged for each asset class. Resulting asset class averages are correlated. For each correlation coefficient in the table, significance at the 10% level is indicated by one asterisk, while significance at the 5% and 1% levels is indicated by two and three asterisks, respectively.
| Correlation Roll | Real Estate | MDAX | SDAX | Basic Mat | Cons Goods | Cons Serv | Indust | IT | Pharma/Health | Fin |
|---|---|---|---|---|---|---|---|---|---|---|
| Real Estate | 1 | |||||||||
| MDAX | 0.6428 *** | 1 | ||||||||
| SDAX | 0.7682 *** | 0.7120 *** | 1 | |||||||
| Basic Materials | 0.6142 *** | 0.9053 *** | 0.7255 *** | 1 | ||||||
| Consumer Goods | 0.7342 *** | 0.5033 *** | 0.8064 *** | 0.3877 *** | 1 | |||||
| Consumer Services | 0.5559 *** | 0.8022 *** | 0.8456 *** | 0.7436 *** | 0.6232 *** | 1 | ||||
| Industrials | 0.6788 *** | 0.9458 *** | 0.7224*** | 0.8984 *** | 0.4622 *** | 0.6854 *** | 1 | |||
| IT | 0.2086 *** | 0.5006 *** | 0.3898*** | 0.5525 *** | −0.0071 | 0.4176 *** | 0.4643*** | 1 | ||
| Pharma and Health | 0.3301 *** | 0.7061*** | 0.5392 *** | 0.7287*** | 0.2390 *** | 0.5939 *** | 0.6946 *** | 0.4580*** | 1 | |
| Financials | 0.5985 *** | 0.5265 *** | 0.8061 *** | 0.4878 *** | 0.6980 *** | 0.7724 *** | 0.4116 *** | 0.2856 *** | 0.2371 *** | 1 |
The table presents pairwise correlation coefficients for the Amihud illiquidity coefficient computed between combinations of asset classes. Rolling window Amihud coefficients are computed and averaged for each asset class. Resulting asset class averages are correlated. For each correlation coefficient in the table, significance at the 10% level is indicated by one asterisk, while significance at the 5% and 1% levels is indicated by two and three asterisks, respectively.
References
- L.R. Glosten, and P.R. Milgrom. “Bid, Ask, and Transaction Prices in a Specialist Market with Heterogeneously Informed Traders.” J. Financ. Econ. 14 (1985): 71–100. [Google Scholar] [CrossRef]
- A. Kyle. “Continuous auctions and insider trading.” Econometrica 53 (1985): 1315–1335. [Google Scholar] [CrossRef]
- M. Wölfle. “Information-based trade in Russia and the effects of listing abroad.” Econ. Chang. Restruct. 42 (2009): 229–262. [Google Scholar] [CrossRef]
- W. Goetzmann, and R. Ibbotson. “The performance of real estate as an asset class.” J. Appl. Corp. Financ. 3 (1990): 65–76. [Google Scholar] [CrossRef]
- J. Fisher, and W. Goetzmann. “Performance of real estate portfolios.” J. Portf. Manag. 32 (2005): 32–45. [Google Scholar] [CrossRef]
- J. Clayton, and G. MacKinnon. “The Time-Varying Nature of the Link between REIT, Real Estate and Financial Asset Returns.” J. Real Estate Portf. Manag. 7 (2001): 43–54. [Google Scholar]
- J. Clayton, and G. MacKinnon. “The Relative Importance of Stock, Bond and Real Estate Factors in Explaining REIT Returns.” J. Real Estate Financ. Econ. 27 (2003): 39–60. [Google Scholar] [CrossRef]
- J. Morawski, H. Rehkugler, and R. Fss. “The Nature of Listed Real Estate Companies - Property or Equity Market? ” Financ. Mark. Portf. Manag. 22 (2008): 101–126. [Google Scholar] [CrossRef]
- J. Sa-Aadu, J. Shilling, and T. Ashish. “On the Portfolio Properties of Real Estate in Good Times and Bad Times.” Real Estate Econ. 38 (2010): 529–565. [Google Scholar] [CrossRef]
- T. Heuvel, and J. Morawski. “Performance drivers of German institutional property funds.” J. Prop. Invest. Financ. 32 (2014): 154–167. [Google Scholar] [CrossRef]
- A. Ang, N. Nabar, and S. Wald. “Searching for a Common Factor in Public and Private Real Estate Returns.” J. Portf. Manag. 39 (2013): 120–133. [Google Scholar] [CrossRef]
- D. Easley, and M. O’Hara. “Price, Trade Size and Information in Securities Markets.” J. Financ. Econ. 19 (1987): 69–90. [Google Scholar] [CrossRef]
- M. Wölfle. “How information measures perform in different market environments.” Manag. Innov. 1 (2015). [Google Scholar]
- R. Roll. “R2.” J. Financ. 43 (1988): 541–566. [Google Scholar] [CrossRef]
- G. Llorente, R. Michaely, G. Saar, and J. Wang. “Dynamic Volume-Return Relation of Individual Stocks.” Rev. Financ. Stud. 15 (2002): 1005–1047. [Google Scholar] [CrossRef]
- Y. Amihud. “Illiquidity and stock returns: Cross-section and time-series effects.” J. Financ. Mark. 5 (2002): 31–56. [Google Scholar] [CrossRef]
- D. Easley, and M. O’Hara. “Time and the process of security price adjustment.” J. Financ. 47 (1992): 576–605. [Google Scholar] [CrossRef]
- D. Easley, N.M. Kiefer, and M. O’Hara. “Cream-skimming or profit sharing? The curious role of purchased order flow.” J. Financ. 51 (1996): 811–833. [Google Scholar] [CrossRef]
- D. Easley, N.M. Kiefer, M. O’Hara, and J.B. Paperman. “Liquidity, Information, and Infrequently Traded Stocks.” J. Financ. 51 (1996): 1405–1436. [Google Scholar] [CrossRef]
- D. Easley, N.M. Kiefer, and M. O’Hara. “The information content of the trading process.” J. Empir. Financ. 4 (1997): 811–833. [Google Scholar] [CrossRef]
- D. Easley, S. Hvidkjaer, and M. O’Hara. “One day in the life of a very common stock.” Rev. Financ. Stud. 10 (1997): 805–835. [Google Scholar] [CrossRef]
- D. Easley, M. O’Hara, and J. Papermann. “Financial analysts and information-based trade.” J. Financ. Mark. 1 (1998): 175–201. [Google Scholar] [CrossRef]
- D. Easley, S. Hvidkjaer, and M. O’Hara. “Is information risk a determinant of asset returns? ” J. Financ. 57 (2002): 2185–2221. [Google Scholar] [CrossRef]
- D. Easley, and M. O’Hara. “Information and the cost of capital.” J. Financ. 59 (2004): 1553–1583. [Google Scholar] [CrossRef]
- D. Easley, S. Hvidkjaer, and M. O’Hara. Factoring Information into Returns. Working Paper; New York, NY, USA: Cornell University, 2005. [Google Scholar]
- H. Bessembinder. “Trade execution costs and market quality after decimalization.” J. Financ. Quant. Anal. 38 (2003): 747–777. [Google Scholar] [CrossRef]
- S. Brown, S. Hillegeist, and K. Lo. “Conference Calls and information asymmetry.” J. Account. Econ. 37 (2004): 343–366. [Google Scholar] [CrossRef]
- C. Vega. “Stock price reaction to public and private information.” J. Financ. Econ. 82 (2006): 103–133. [Google Scholar] [CrossRef]
- Y. Yan, and S. Zhang. “An Improved Estimation Method and Empirical Properties of PIN.” 2006. Available online: http://ssrn.com/abstract=890486 (accessed on 3 December 2015).
- D.A. Lesmond, J. Ogden, and C. Trzcinka. “A New Estimate of Transaction Costs.” Rev. Financ. Stud. 12 (1999): 1113–1141. [Google Scholar] [CrossRef]
- R. Morck, B. Yeung, and W. Yu. “The information content of stock markets: Why do emerging markets have synchronous stock price movements? ” J. Financ. Econ. 58 (2000): 215–260. [Google Scholar] [CrossRef]
- J. Wurgler. “Financial markets and the allocation of capital.” J. Financ. Econ. 58 (2000): 187–214. [Google Scholar] [CrossRef]
- R. Bushman, J. Piotroski, and A. Smith. “What determines corporate transparency? ” J. Account. Res. 42 (2004): 207–252. [Google Scholar] [CrossRef]
- A. Durnev, R. Morck, B. Yeung, and P. Zarowin. “Does greater firm-specific return variation mean more or less informed stock pricing? ” J. Account. Res. 41 (2003): 797–836. [Google Scholar] [CrossRef]
- A. Durnev, R. Morck, and B. Yeung. “Value-Enhancing Capital Budgeting and Firm-Specific Stock Return Variation.” J. Financ. 59 (2004): 65–105. [Google Scholar] [CrossRef]
- M. DeFond, and M. Hung. “Investore protection and corporate governance: Evidence from worldwide CEO turnover.” J. Account. Res. 42 (2004): 269–312. [Google Scholar] [CrossRef]
- Q. Chen, I. Goldstein, and W. Jiang. “Price Informativeness and Investment Sensitivity to Stock Price.” Rev. Financ. Stud. 20 (2007): 619–650. [Google Scholar] [CrossRef]
- J. Dennert. “Price Competition between Market Makers.” Rev. Econ. Stud. 60 (1993): 735–751. [Google Scholar] [CrossRef]
- D. Lesmond. “Liquidity of emerging markets.” J. Financ. Econ. 77 (2005): 411–452. [Google Scholar] [CrossRef]
- H. Van Oppens. Information Asymmetry: A New Measure. Working Paper; Strasbourg, France: University de Strasbourg, 2004. [Google Scholar]
- J. Venter, and D. de Jongh. “Extending the EKOP Model to Estimate the Probability of Informed Trading.” 2004. Available online: http://ssrn.com/abstract=547062 (accessed on 3 December 2015).
- S. Brown, S.A. Hillegeist, and K. Lo. “The Effect of Meeting or Missing Earnings Expectations on Information Asymmetry.” 2006. Available online: http://ssrn.com/abstract=922128 (accessed on 3 December 2015).
- R. Doeswijk, T. Lan, and L. Swinkels. “Strategic Asset Allocation: The Global Multi-Asset Market Portfolio 1959–2011.” Available online: http://papers.ssrn.com/sol3/Papers.cfm?abstract-id=2170275 (accessed on 4 December 2015).
- K. Liow, and F. Schindler. “An Assessment of the Relationship between Public Real Estate and Stock Markets at the Local, Regional, and Global Levels.” Int. Real Estate Rev. 17 (2014): 157–202. [Google Scholar] [CrossRef]
- J. Grammig, and F. Peter. “Telltale Tails: A New Approach to Estimating Unique Market Information Shares.” J. Financ. Quant. Anal. 48 (2013): 459–488. [Google Scholar] [CrossRef]
© 2015 by the author; licensee MDPI, Basel, Switzerland. This article is an open access article distributed under the terms and conditions of the Creative Commons Attribution license (http://creativecommons.org/licenses/by/4.0/).
Share and Cite
MDPI and ACS Style
Wölfle, M. Information-Based Trade in German Real Estate and Equity Markets. Risks 2015, 3, 573-598. https://doi.org/10.3390/risks3040573
AMA Style
Wölfle M. Information-Based Trade in German Real Estate and Equity Markets. Risks. 2015; 3(4):573-598. https://doi.org/10.3390/risks3040573
Chicago/Turabian StyleWölfle, Marco. 2015. "Information-Based Trade in German Real Estate and Equity Markets" Risks 3, no. 4: 573-598. https://doi.org/10.3390/risks3040573