
Synthetic Smectite Colloids: Characterization of Nanoparticles after Co-Precipitation in the Presence of Lanthanides and Tetravalent Elements (Zr, Th)

Abstract
:
1. Introduction
2. Experimental Section
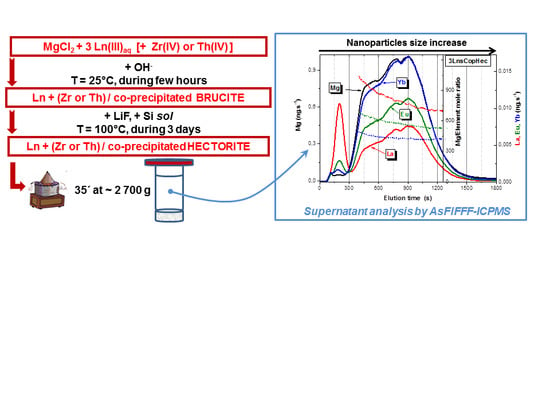
2.1. Hectorite Synthesis and Nanoparticles Separation

| Element (Ionic radii rVI [15]) / Sample | Mg (0.72 Å) | La (1.03 Å) | Eu (0.95 Å) | Yb (0.87 Å) | Zr (0.72 Å) | Th (0.94 Å) | Mg:Si (mol:mol) |
|---|---|---|---|---|---|---|---|
| 3LnCopHec-sup | - | - | 0.50 ± 0.02 | ||||
| mg.L−1 | 72 ± 4 | 0.71 ± 0.01 | 0.81 ± 0.01 | 1.13 ± 0.01 | |||
| mmol.L−1 | 3.0 ± 0.2 | 0.0051 ± 0.0001 | 0.0053 ± 0.0001 | 0.0065 ± 0.0001 | |||
| 3LnZrCopHec-sup | - | 0.32 ± 0.02 | |||||
| mg.L−1 | 49 ± 3 | 0.48 ± 0.02 | 0.95 ± 0.04 | 1.5 ± 0.1 | 0.7 ± 0.1 | ||
| mmol.L−1 | 2.0 ± 0.1 | 0.0034 ± 0.0001 | 0.0063 ± 0.0001 | 0.0087 ± 0.0005 | 0.008 ± 0.001 | ||
| 3LnThCopHec-sup | - | 0.57 ± 0.02 | |||||
| mg.L−1 | 2629 ± 40 | 22.5 ± 0.3 | 26.6 ± 0.3 | 33.9 ± 0.4 | 40.2 ± 0.5 | ||
| mmol.L−1 | 108 ± 2 | 0.162 ± 0.002 | 0.175 ± 0.002 | 0.196 ± 0.002 | 0.173 ± 0.002 |
2.2. Asymmetric Flow Field-Flow Fractionation (AsFlFFF) coupled to MALLS/ICP-MS Detectors

2.3. Photon Correlation Spectroscopy
3. Results and Discussion
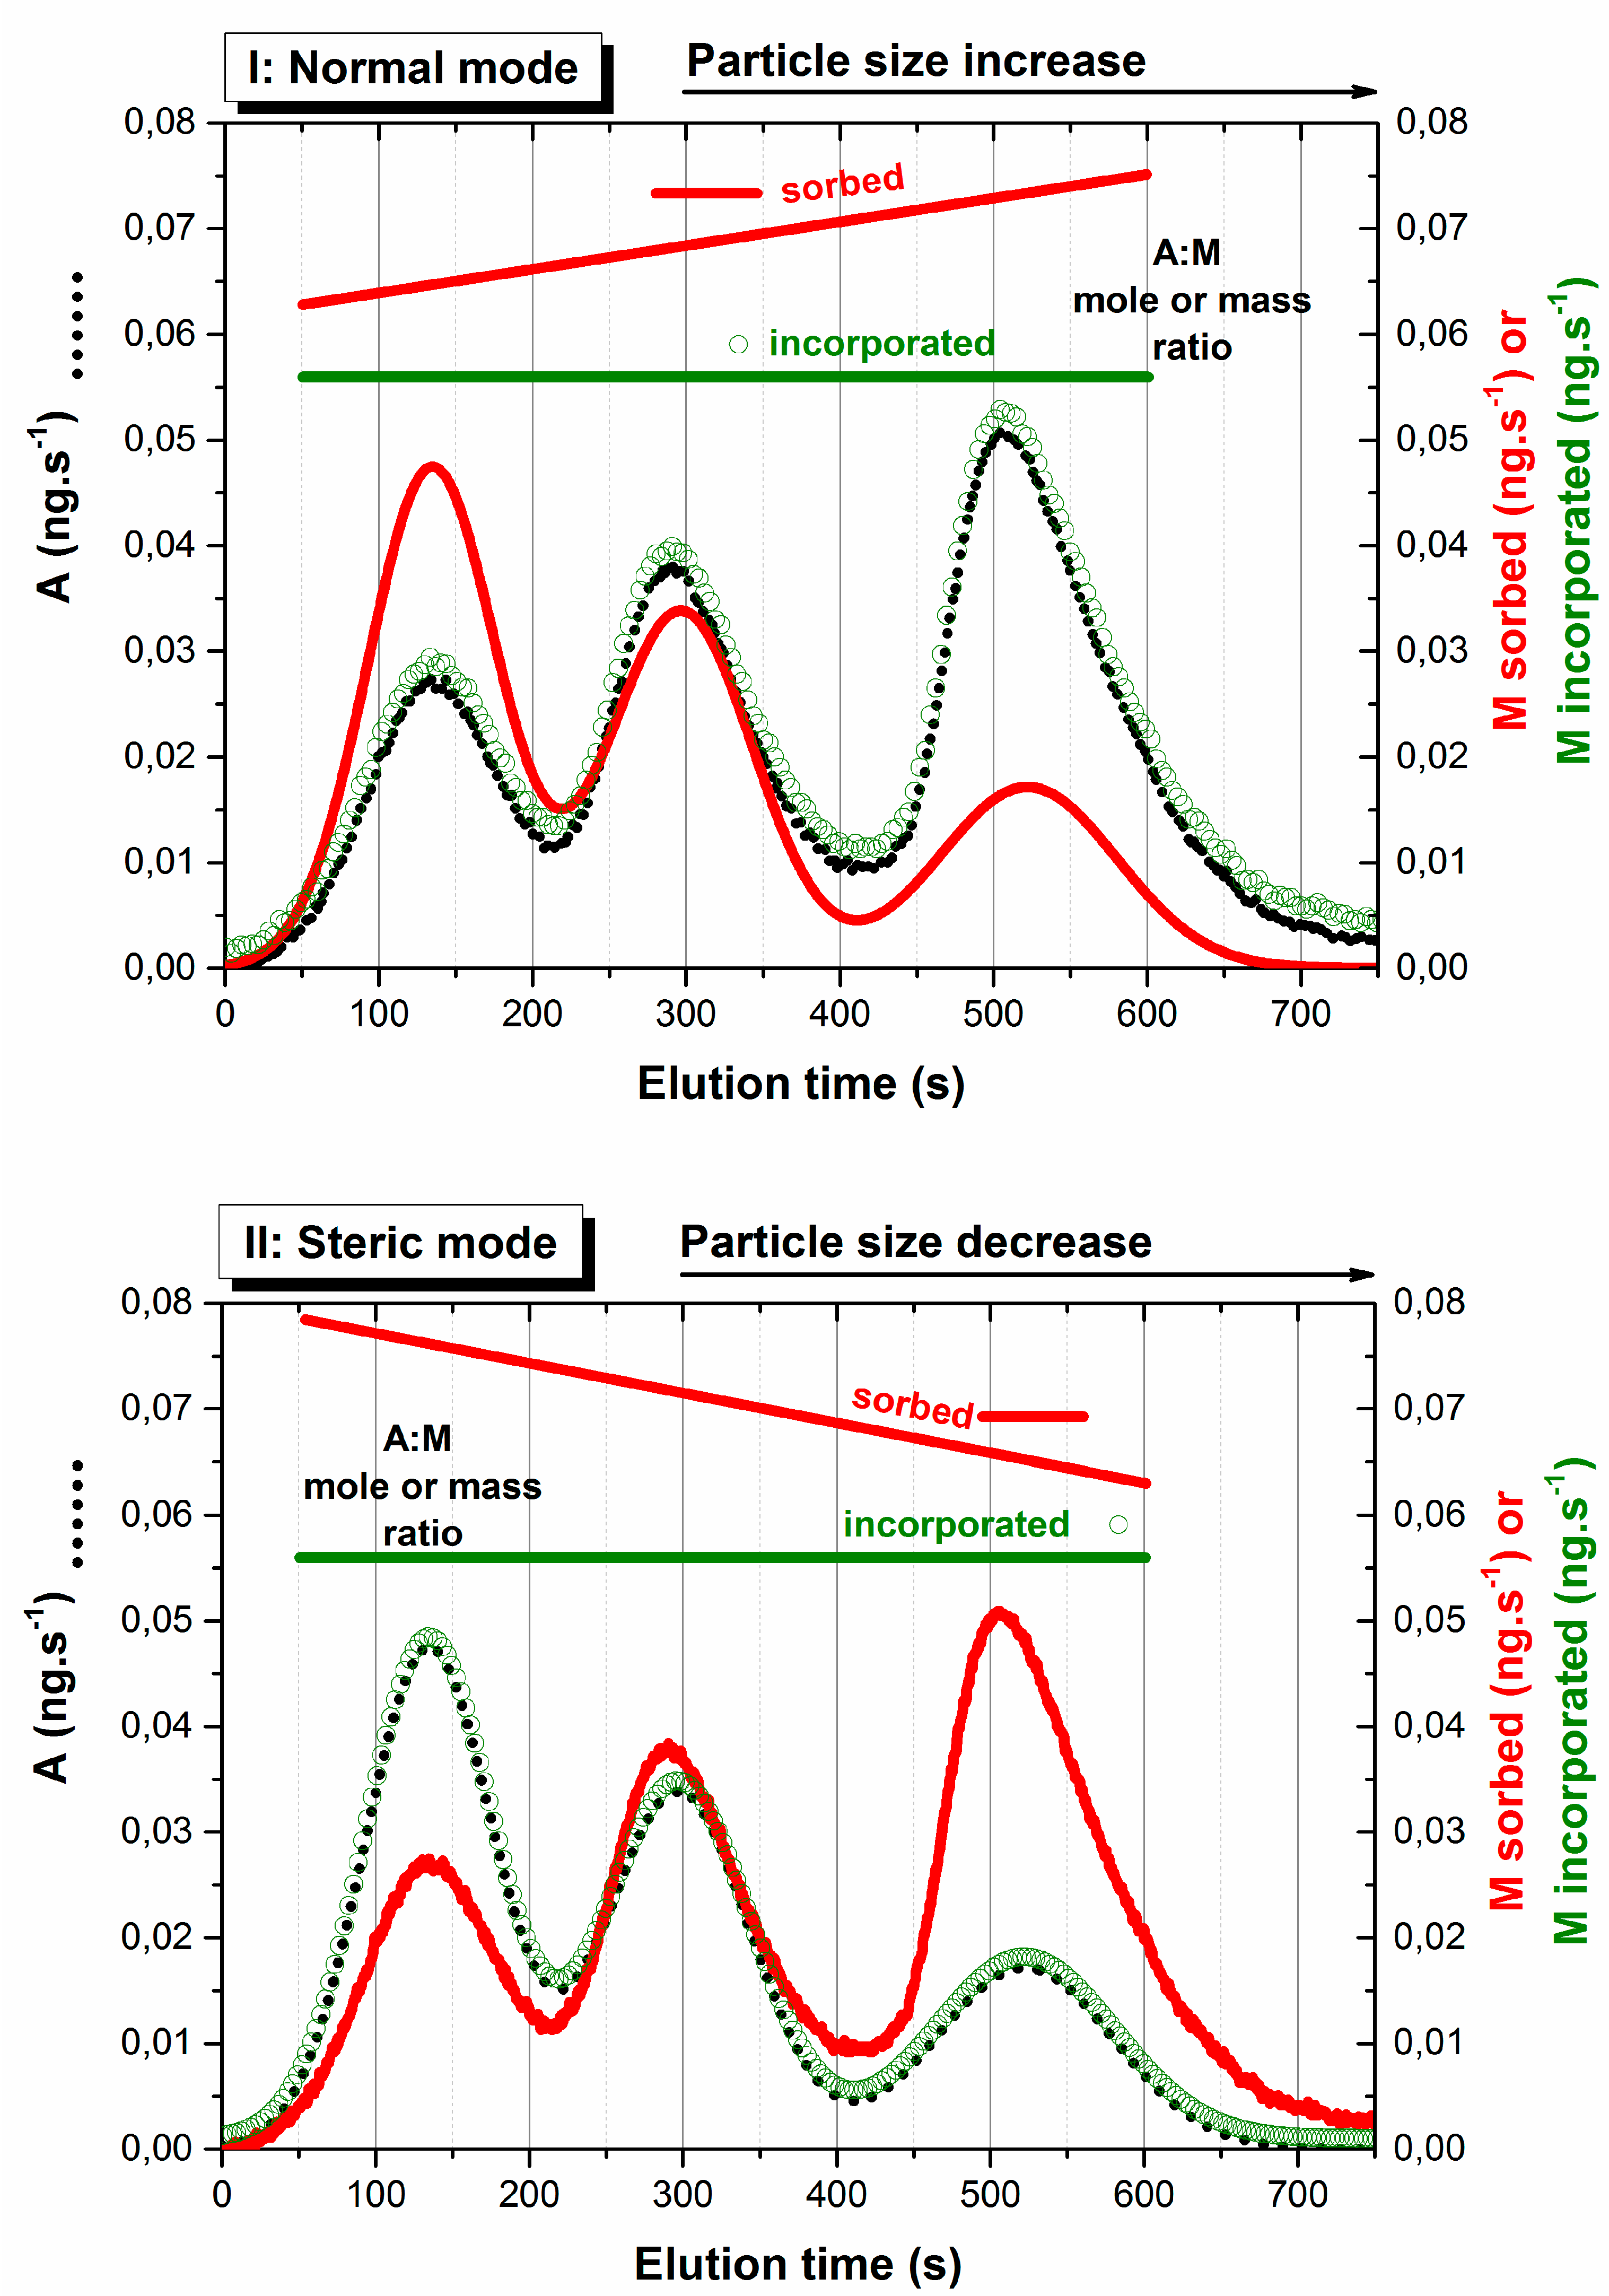
3.1. Preliminary Considerations: Distinguishing Adsorption from Incorporation of Pollutant on/in Nanoparticles from an AsFlFFF/ICP-MS Fractogram
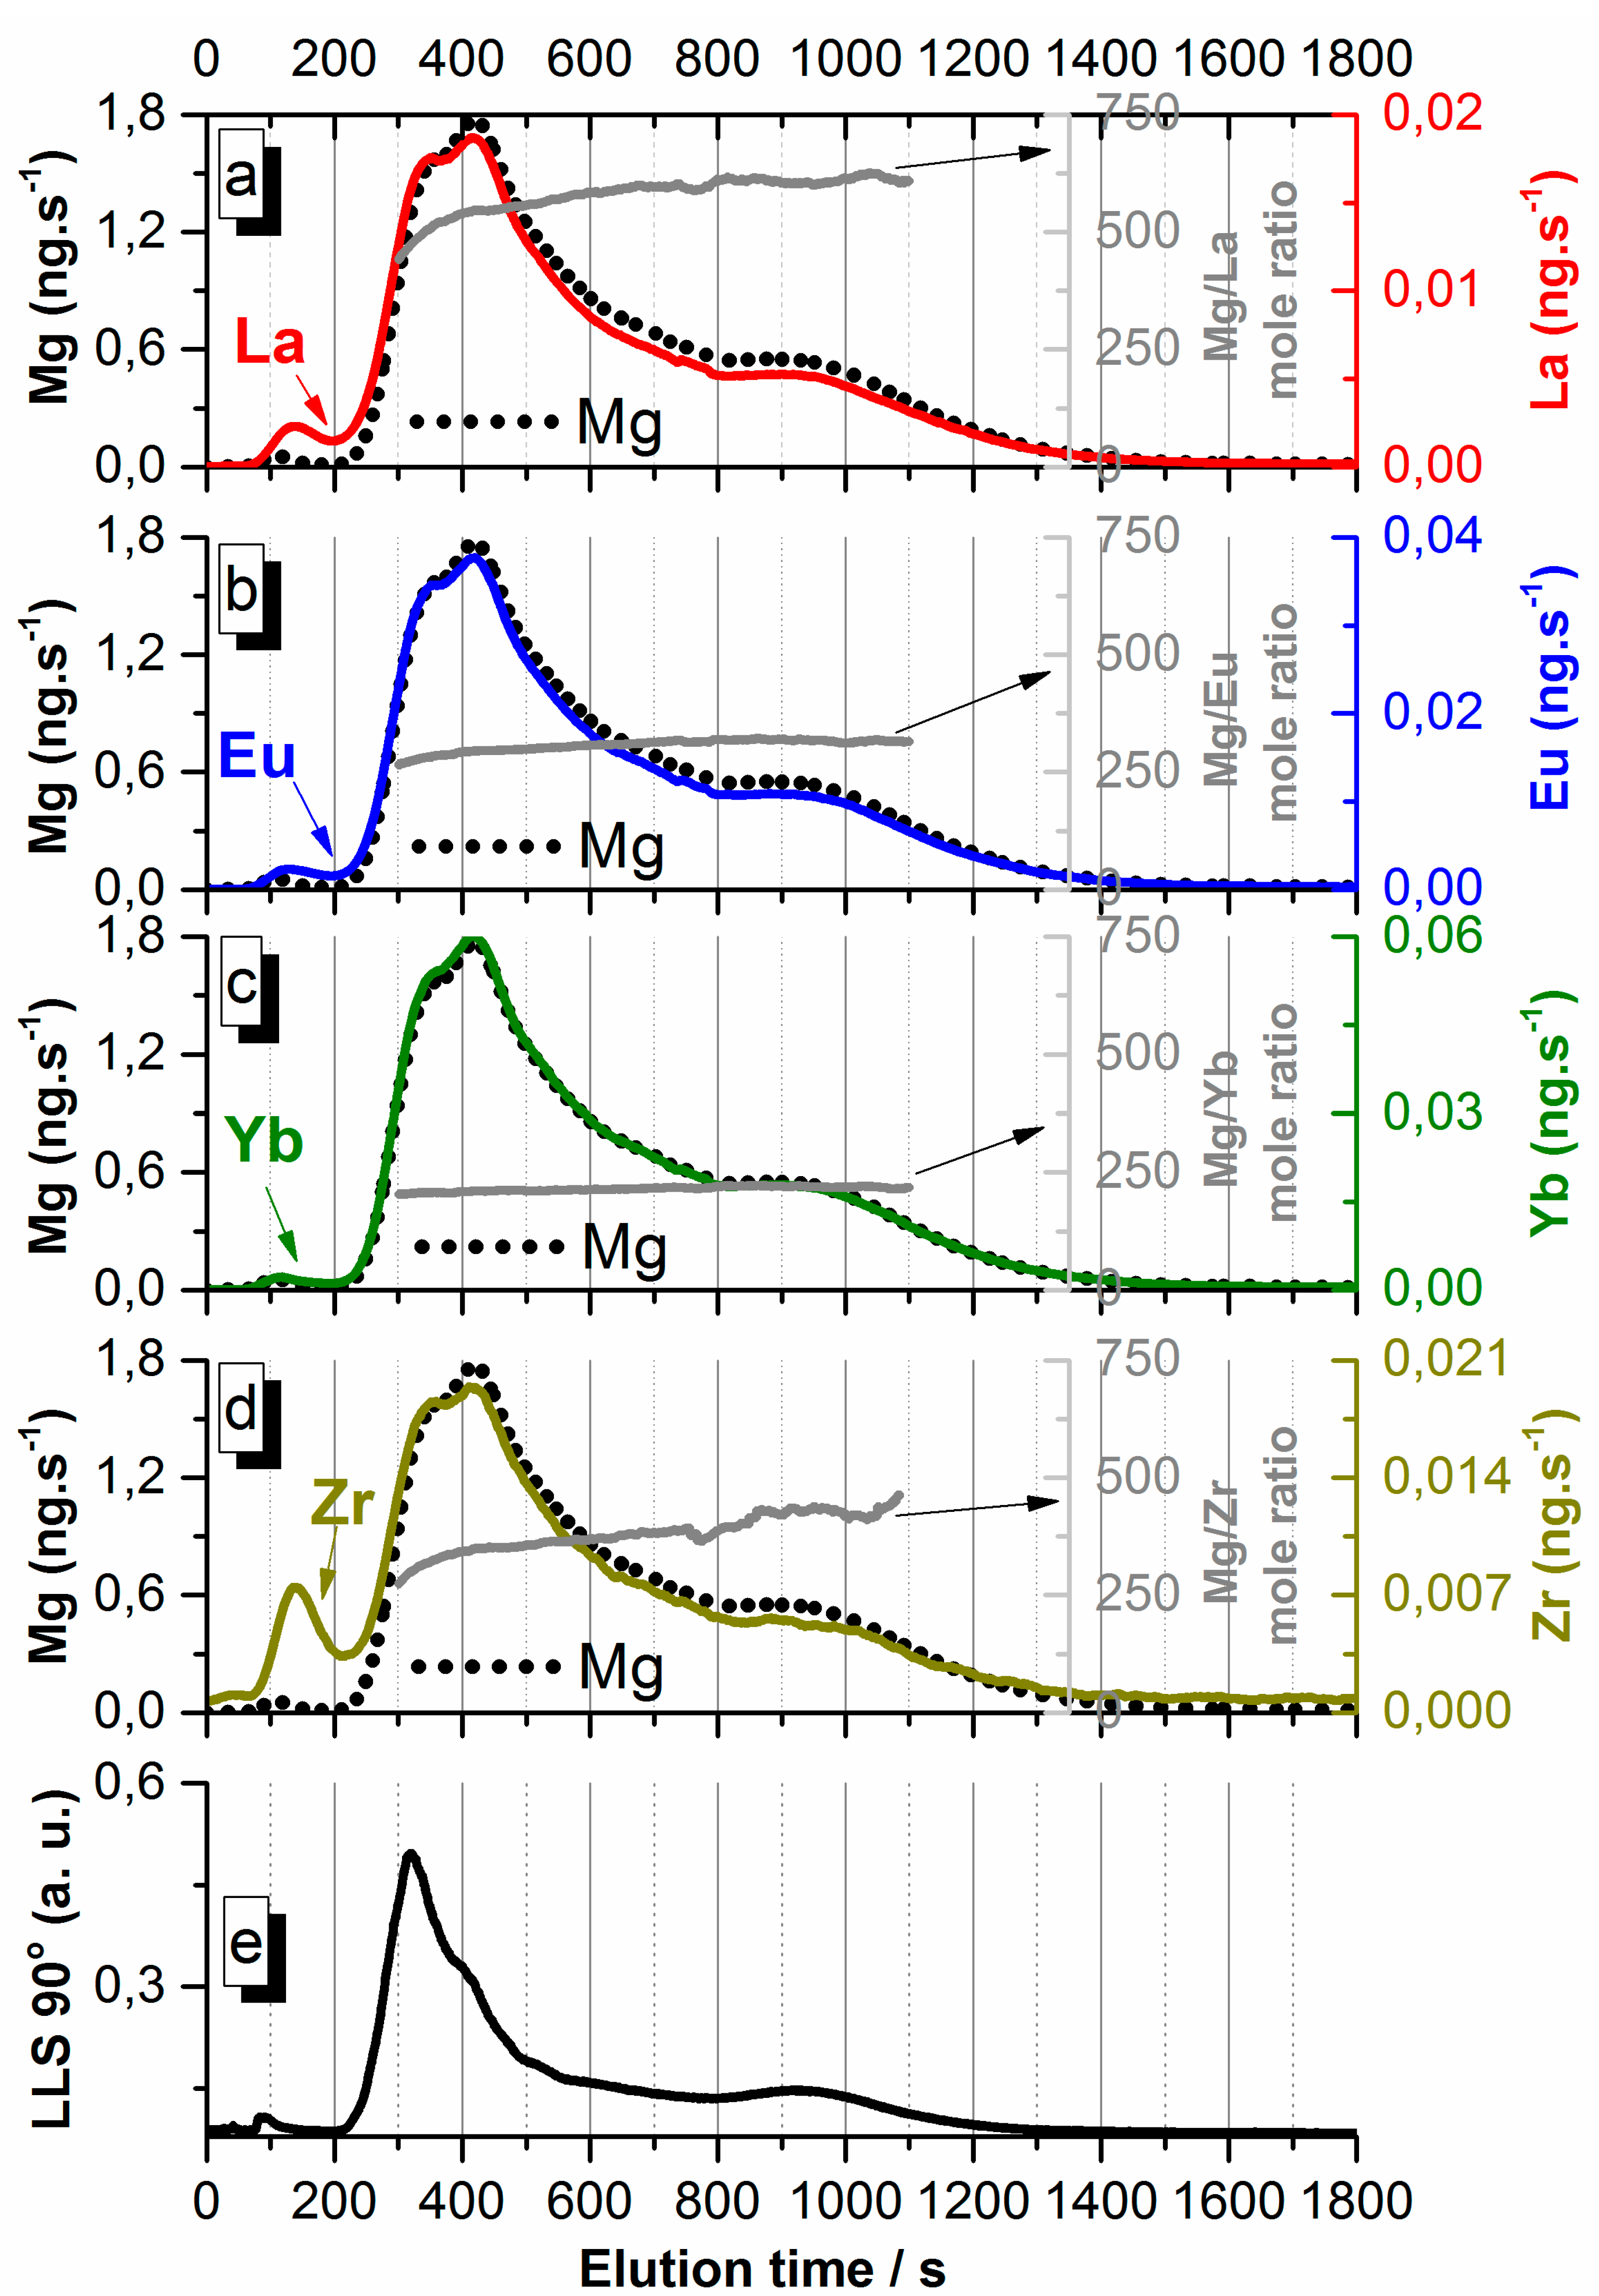
3.2. Analysis of Hectorite Nanoparticles Synthesized in the Presence of La, Eu, Yb
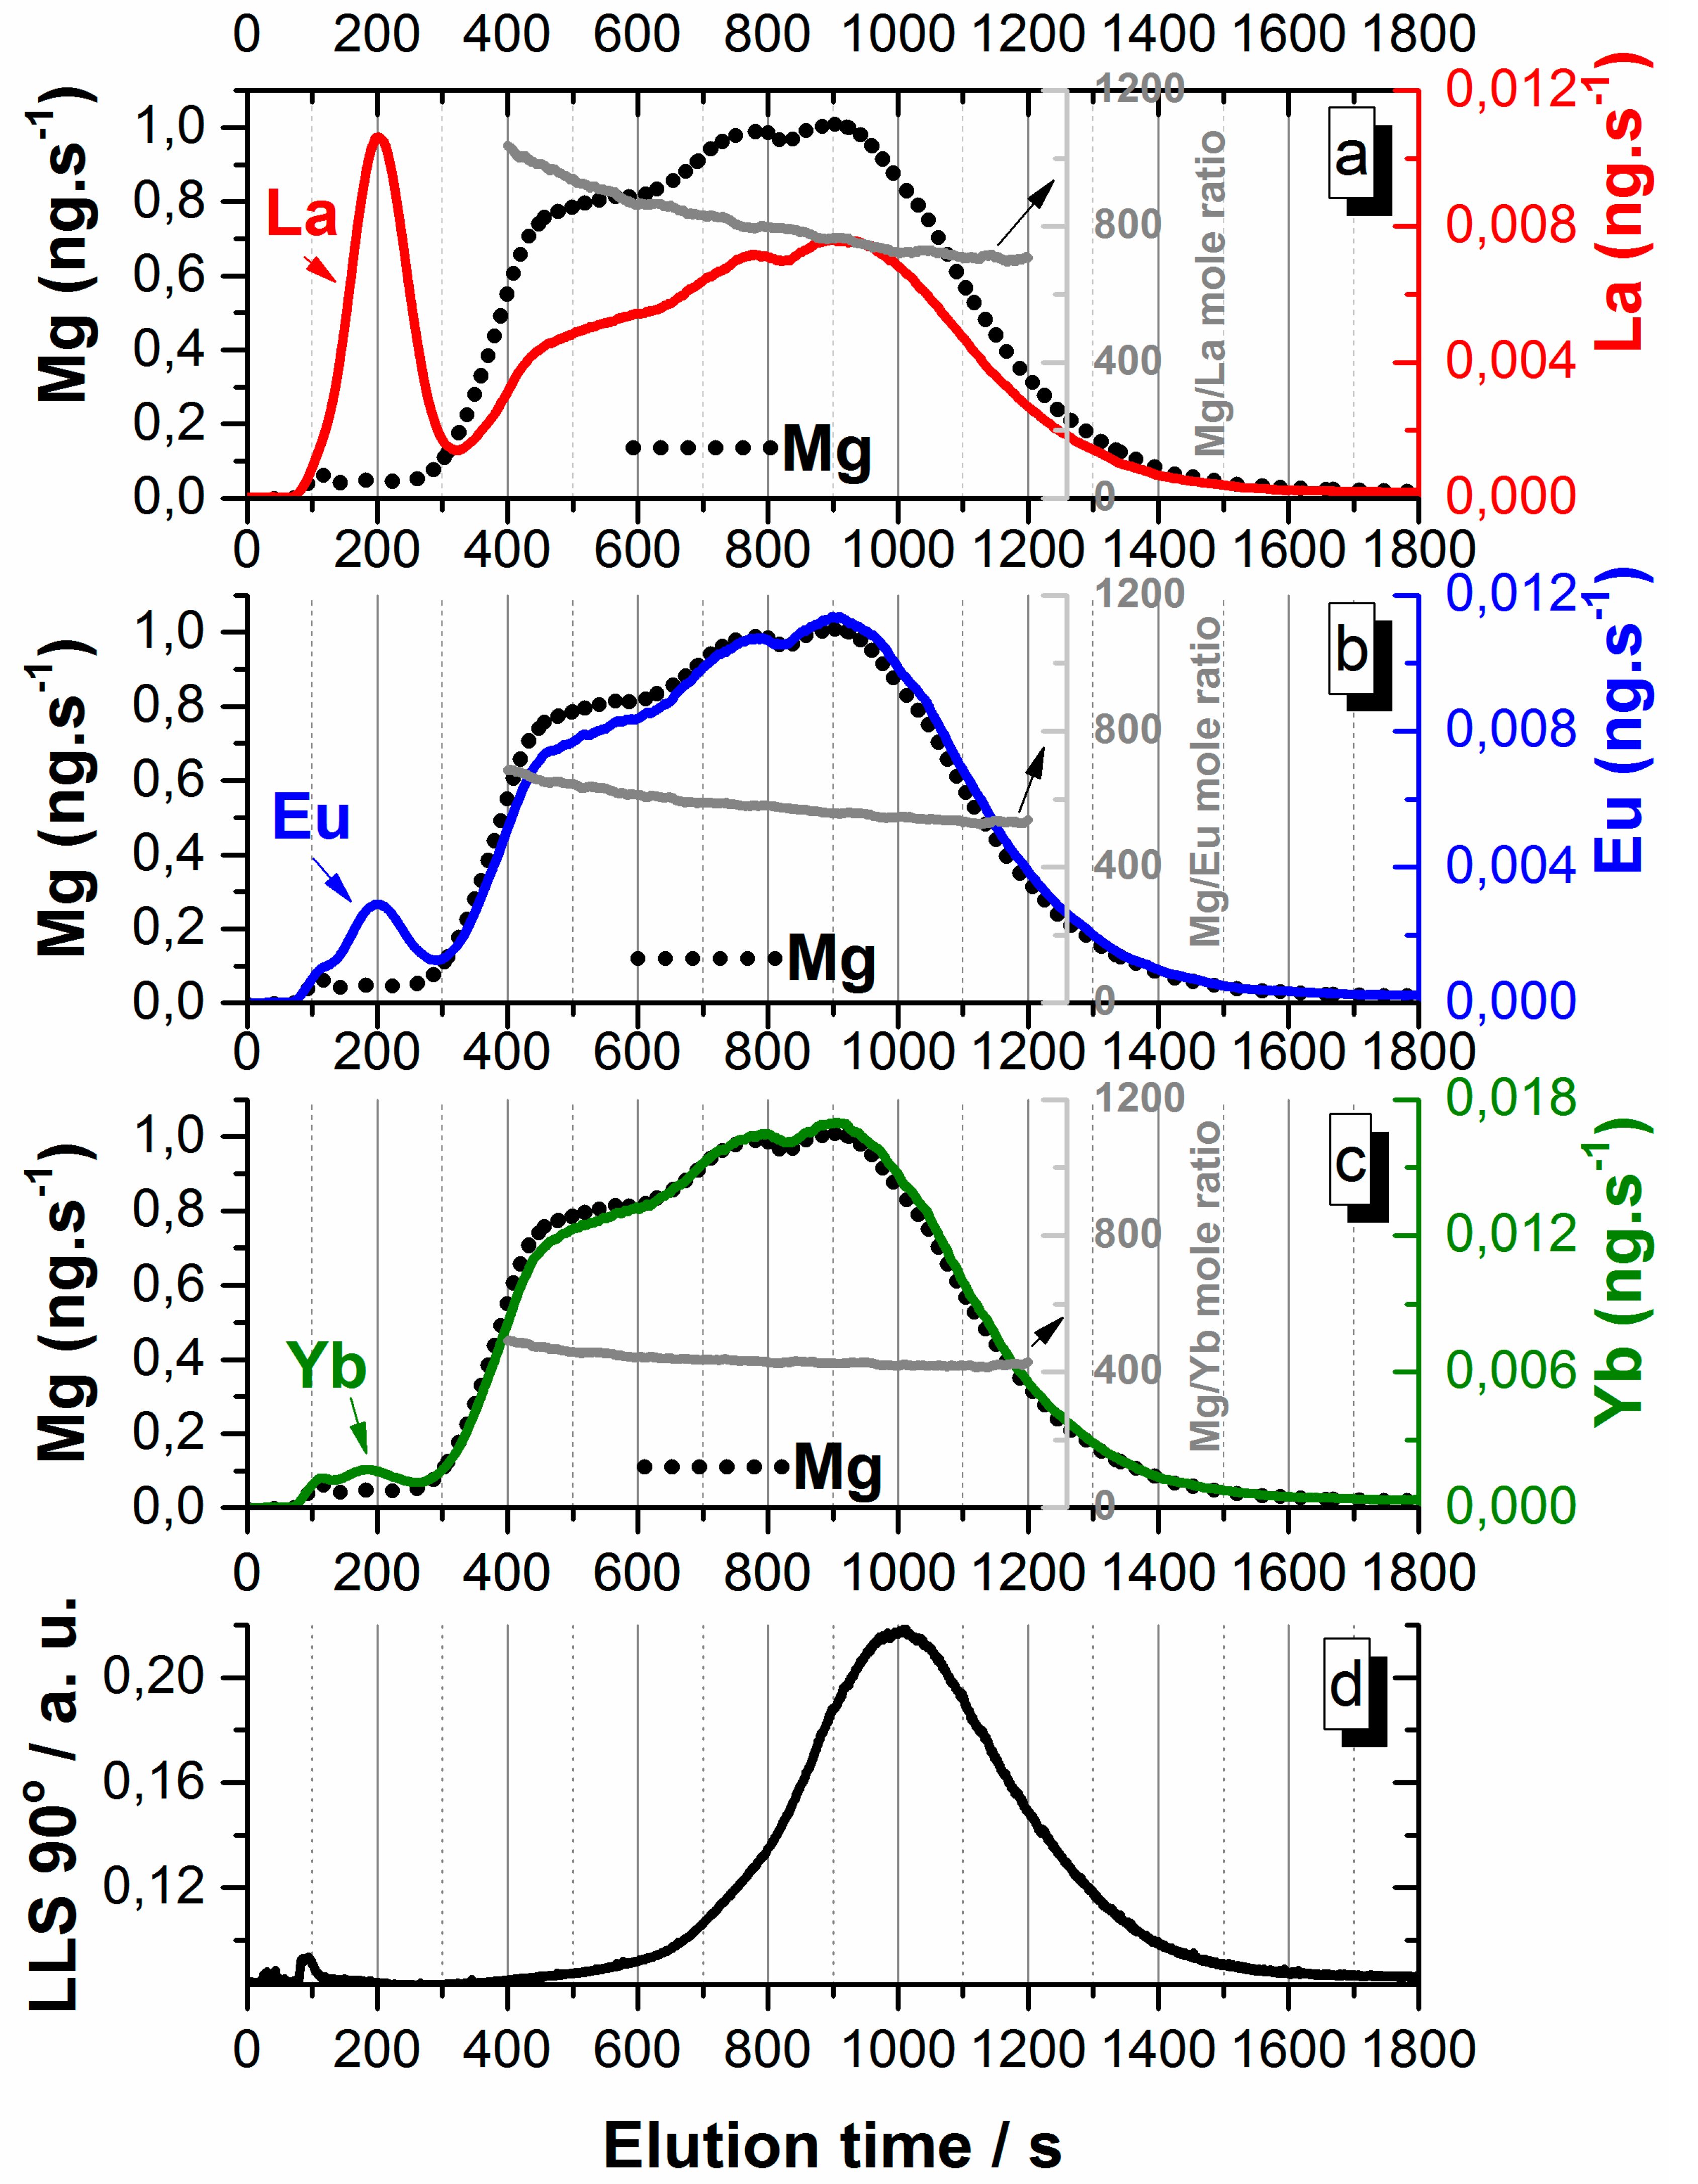
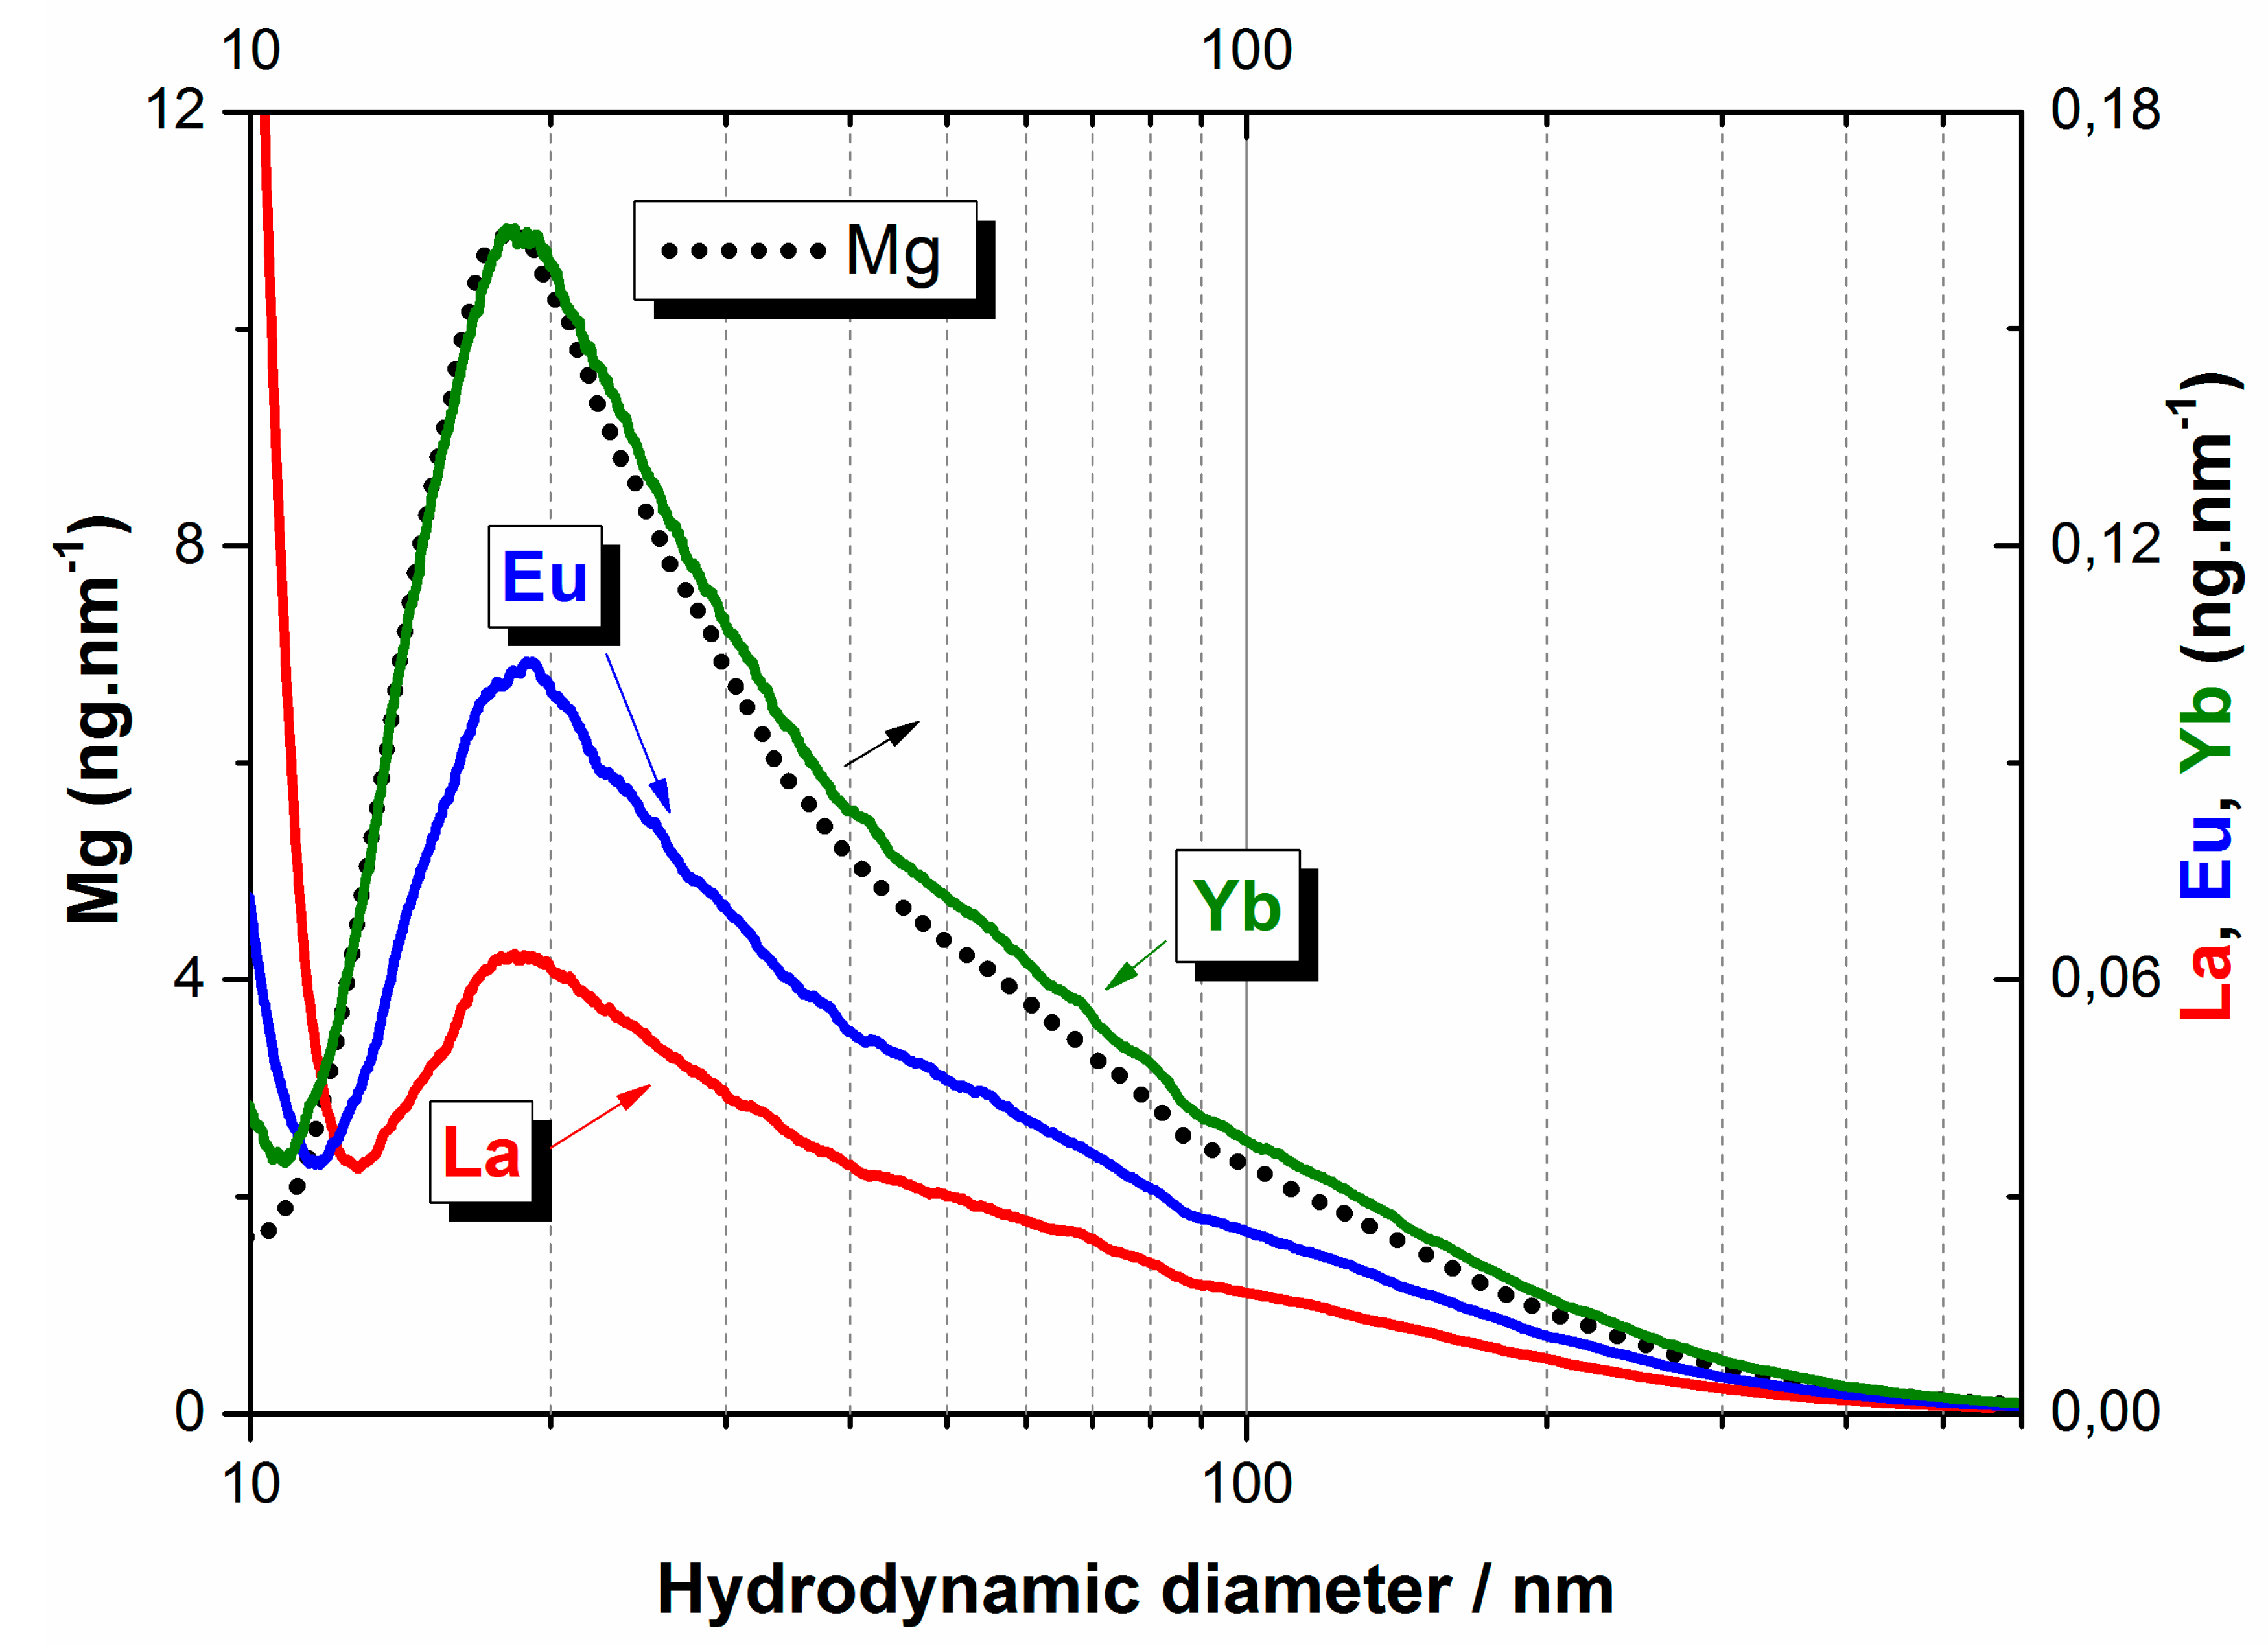
3.2.1. Fractograms and Particle Size Distribution


3.2.2. Lanthanides Interaction with Hectorite in 3LnCopHec-sup
| 3LnCopHec-sup | |||||
| Mg | La | Eu | Yb | ||
| Recovery (%) <300 s | 0.40 ± 0.05 | 7.9 ± 0.1 | 2.0 ± 0.1 | 3.8 ± 0.1 | |
| Recovery (%) 300–1800 s | 59 ± 4 | 45 ± 4 | 58 ± 4 | 63 ± 4 | |
| Mg/Mn+ | - | ||||
| 3LnZrCopHec-sup | |||||
| Mg | La | Eu | Yb | Zr | |
| Recovery (%) <200 s | 0.28 ± 0.05 | 1.62 ± 0.02 | 0.89 ± 0.03 | 0.48 ± 0 03 | 4.9 ± 0.2 |
| Recovery (%) 200–1800 s | 59 ± 2 | 63 ± 2 | 64 ± 2 | 65 ± 3 | 61 ± 1 |
| Mg : Mn+ | |||||
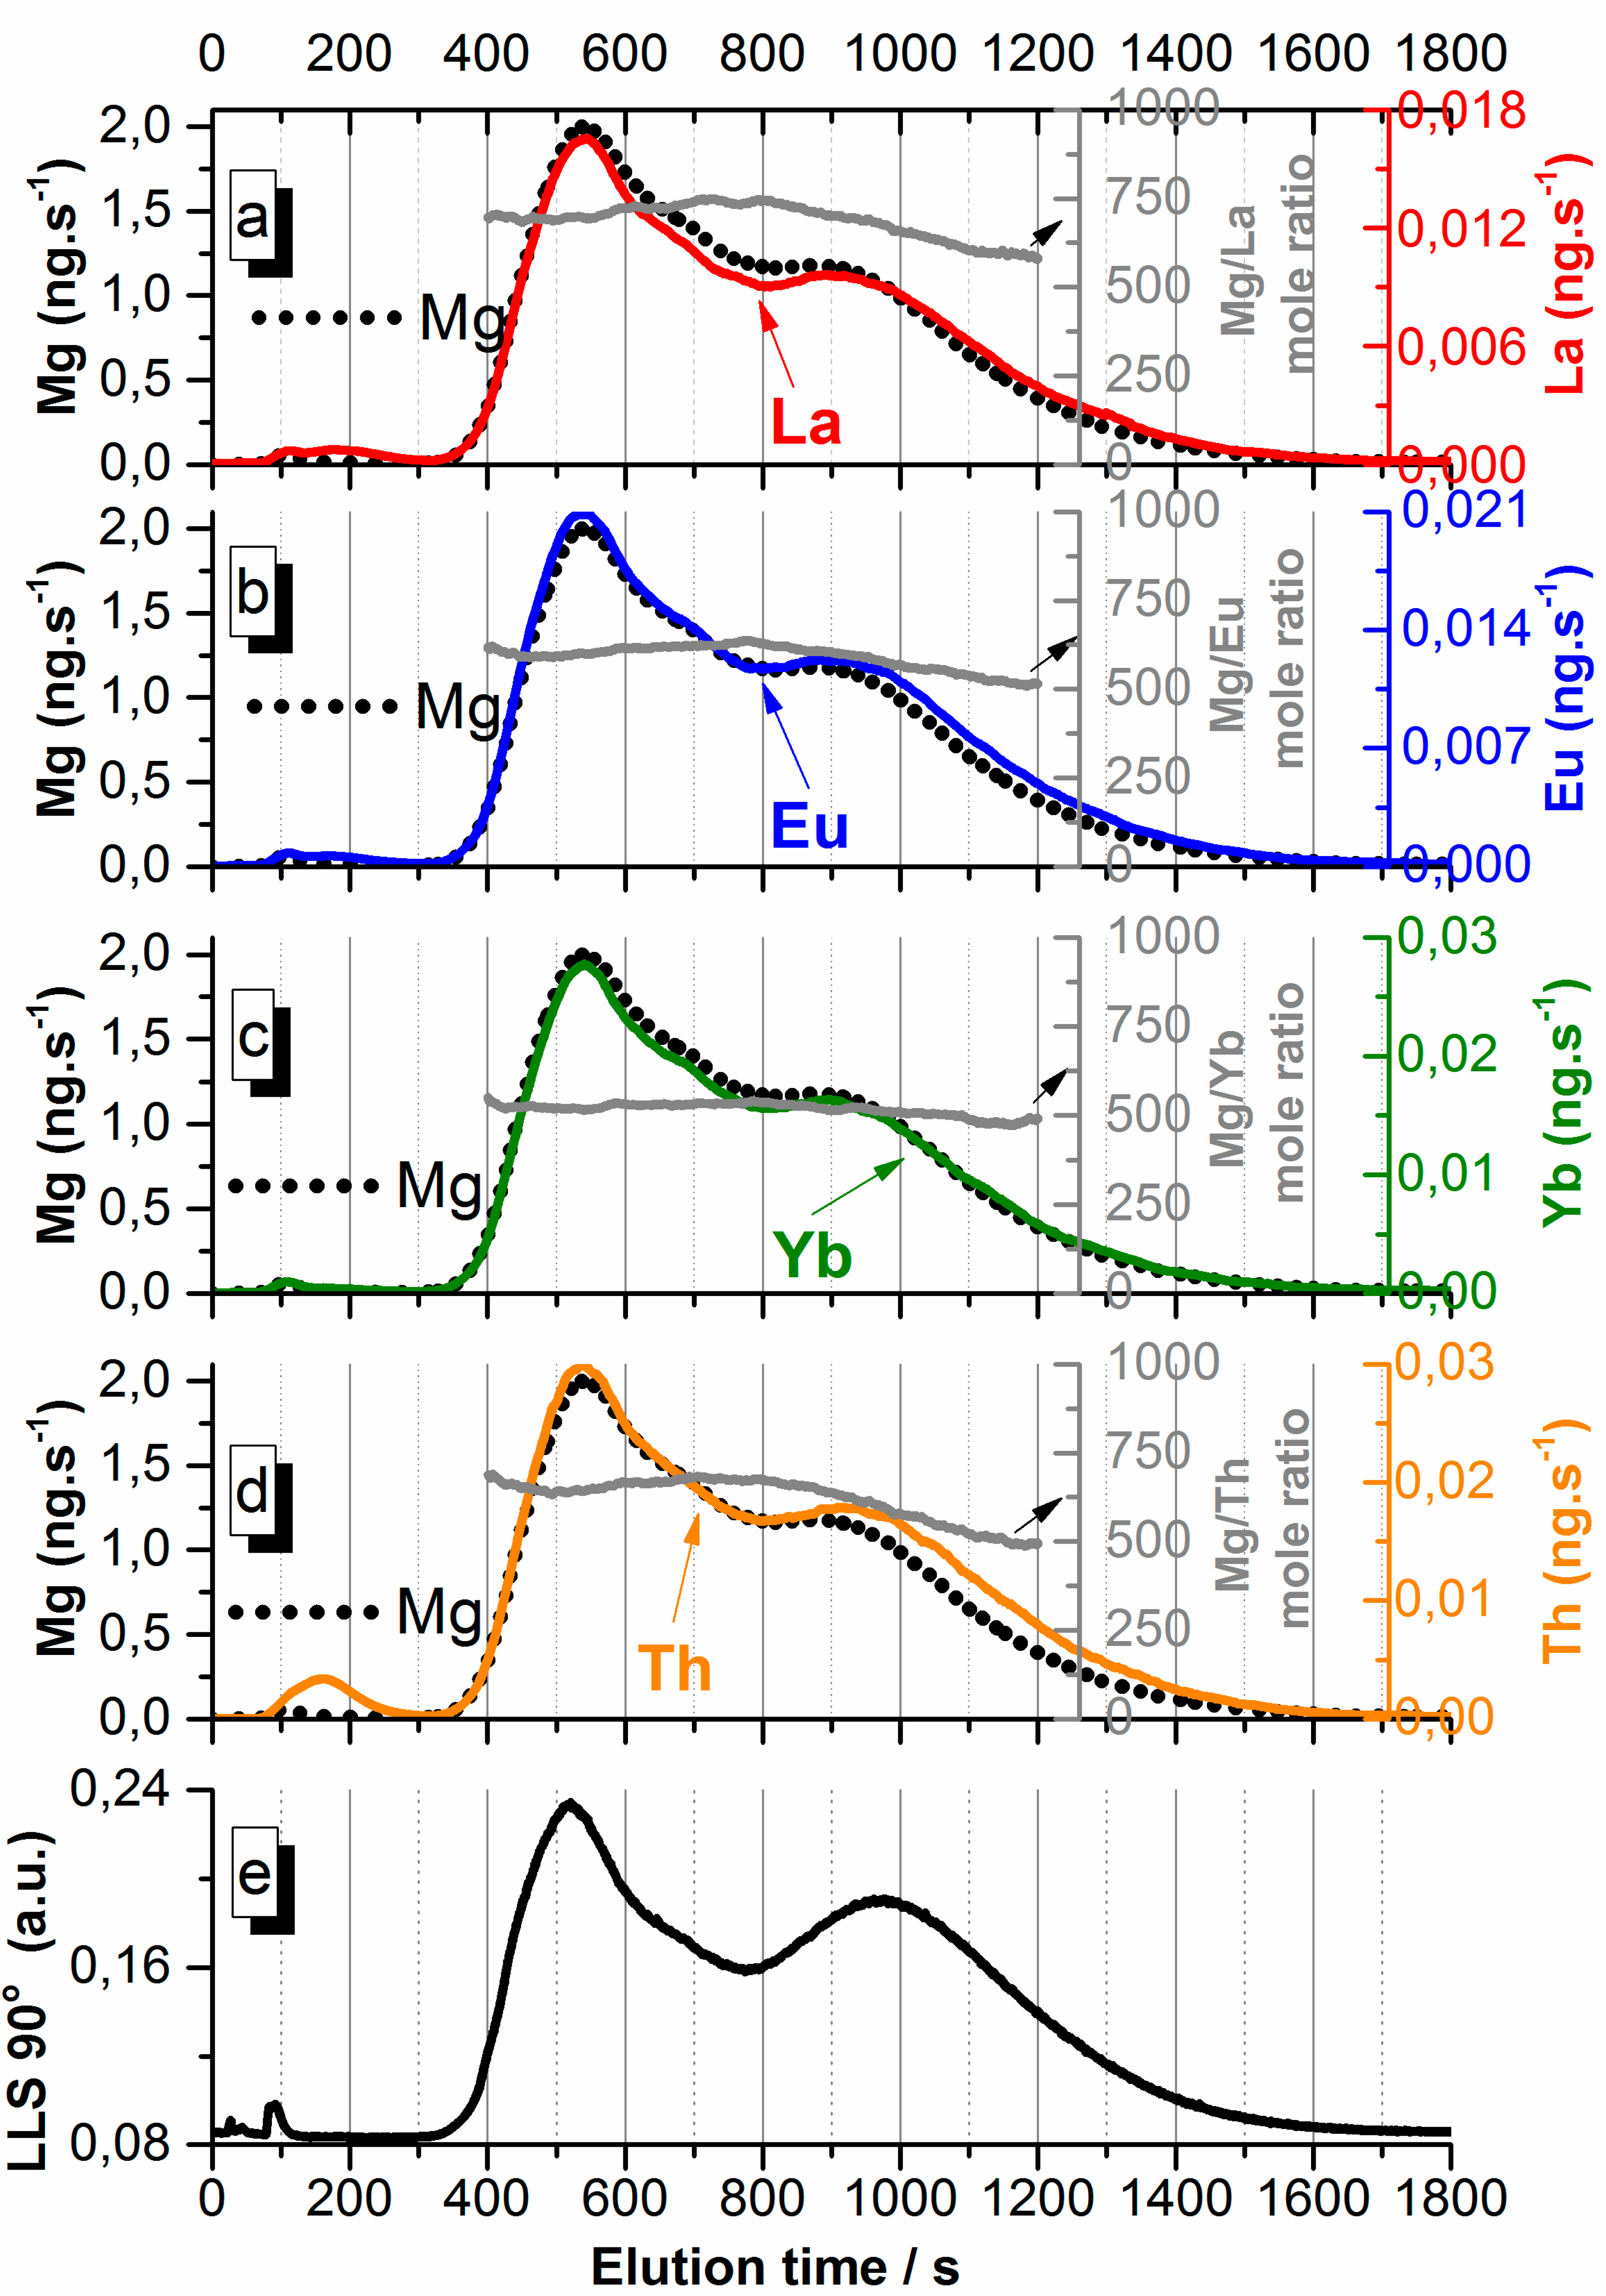
| 3LnThCopHec-sup | |||||
| Mg | La | Eu | Yb | Th | |
| Recovery (%) <300 s | 0.03 ± 0.06 | 0.9 ± 0.1 | 0.69 ± 0.01 | 0.48 ± 0.03 | 1.6 ± 0.2 |
| Recovery (%) 300–1800 s | 64 ± 2 | 64 ± 2 | 68 ± 2 | 69 ± 2 | 66 ± 3 |
| Mg : Mn+ | - | ||||
3.3. Analysis of Hectorite Nanoparticles Synthesized in the Presence of La, Eu, Yb and Zr or Th
3.3.1. Fractograms and Particle Size Distributions


3.3.2. Lanthanides and Tetravalent Elements Interaction with Hectorite in 3LnZrCopHec-sup and 3LnThCopHec-sup
4. Conclusions
Acknowledgments
Author Contributions
Conflicts of Interest
Appendix

References
- Donald, I.W. Waste Immobilization in Glass and Ceramic Based Hosts: Radioactive Toxic and Hazardous Wastes; John Wiley and Sons, Ltd.: Chichester, West Sussex, UK, 2010. [Google Scholar]
- Thien, B.; Godon, N.; Hubert, F.; Angéli, F.; Gin, S.; Ayral, A. Structural identification of a trioctahedral smectite formed by the aqueous alteration of a nuclear glass. Appl. Clay Sci. 2010, 49, 135–141. [Google Scholar] [CrossRef]
- Debure, M.; Frugier, P.; De Windt, L.; Gin, S. Borosilicate glass alteration driven by magnesium carbonates. J. Nucl. Mater. 2012, 420, 347–361. [Google Scholar] [CrossRef]
- Buck, E.C.; Bates, J.K. Microanalysis of colloids and suspended particles from nuclear waste glass alteration. Appl. Geochem. 1999, 14, 635–653. [Google Scholar] [CrossRef]
- Ledergerber, G.; Herbst, R.; Zwicky, H.U.; Kutter, H.; Fischer, P. Characterization and quality control of uranium-plutonium carbide for the AC-3/FFTF experiment. J. Nucl. Mater. 1988, 153, 189–204. [Google Scholar] [CrossRef]
- Jollivet, P.; Gin, S.; Schumacher, S. Forward dissolution rate of silicate glasses of nuclear interest in clay-equilibrated groundwater. Chem. Geol. 2012, 330–331, 207–217. [Google Scholar] [CrossRef]
- Jollivet, P.; Frugier, P.; Parisot, G.; Mestre, J.P.; Brackx, E.; Gin, S.; Schumacher, S. Effect of clayey groundwater on the dissolution rate of the simulated nuclear waste glass SON68. J. Nucl. Mater. 2012, 420, 508–518. [Google Scholar] [CrossRef]
- Brandt, H.; Bosbach, D.; Panak, P.J.; Fanghänel, T. Structural incorporation of Cm(III) in trioctahedral smectite hectorite: A time-resolved laser fluorescence spectroscopy (TRLFS) study. Geochim. Cosmochim. Acta 2007, 71, 145–154. [Google Scholar] [CrossRef]
- Pieper, H.; Bosbach, D.; Panak, P.J.; Rabung, T.; Fanghänel, T. Eu(III) coprecipitation with the trioctahedral clay mineral, hectorite. Clays Clays Miner. 2006, 54, 45–53. [Google Scholar] [CrossRef]
- Finck, N.; Stumpf, T.; Walther, C.; Bosbach, D. TRLFS characterization of Eu(III)-doped synthetic organo-hectorite. J. Contamin. Hydrol. 2008, 102, 253–262. [Google Scholar] [CrossRef] [PubMed]
- Carrado, K.A.; Thiyagarajan, P.; Song, K. A study of organo-hectorite clay crystallization. Clay Miner. 1997, 32, 29–40. [Google Scholar] [CrossRef]
- Finck, N.; Schlegel, M.L.; Bosbach, D. Sites of Lu(III) sorbed to and coprecipitated with hectorite. Environ. Sci. Technol. 2009, 43, 8807–8812. [Google Scholar] [CrossRef] [PubMed]
- Finck, N.; Bouby, M.; Dardenne, K.; Geckeis, H. Characterization of Eu(III) co-precipitated with and adsorbed on hectorite: From macroscopic crystallites to nanoparticles. Mineral. Magaz. 2012, 76, 2723–2740. [Google Scholar] [CrossRef]
- Finck, N.; Dardenne, K.; Geckeis, H. Am(III) coprecipitation with and adsorption on the smectite hectorite. Chem. Geol. 2015, 409, 12–19. [Google Scholar] [CrossRef]
- Shannon, R.D. Revised effective ionic radii and systematic studies of interatomic distances in halides and chalcogenides. Acta Crystallogr. 1976, A32, 751–767. [Google Scholar] [CrossRef]
- Bouby, M.; Finck, N.; Geckeis, H. Flow field-flow fractionation (FlFFF) coupled to sensitive detection techniques: A way to examine radionuclide interactions with nanoparticles. Mineral. Magaz. 2012, 76, 2709–2721. [Google Scholar] [CrossRef]
- Taylor, H.E.; Garbarino, J.R.; Murphy, D.M.; Beckett, R. Inductively coupled plasma-mass spectrometry as an element-specific detector for field-flow fractionation particle separation. Anal. Chem. 1992, 64, 2036–2041. [Google Scholar] [CrossRef] [PubMed]
- Dubascoux, S.; Le Hécho, I.; Hassellöv, M.; Von Der Kammer, F.; Potin Gautier, M.; Lespes, G. Field-flow fractionation and inductively coupled plasma mass spectrometer coupling: History, development and applications. J. Anal. Atom. Spectrom. 2010, 25, 613–623. [Google Scholar] [CrossRef]
- Wahlund, K.-G. Flow field-flow fractionation: Critical overview. J. Chromatogr. A 2013, 1287, 97–112. [Google Scholar] [CrossRef] [PubMed]
- Gigault, J.; Pettibone, J.M.; Schmitt, C.; Hackley, V.A. Rational strategy for characterization of nanoscale particles by asymmetric-flow field flow fractionation: A tutorial. Anal. Chim. Acta 2014, 809, 9–24. [Google Scholar] [CrossRef] [PubMed]
- Herrero, P.; Bäuerlein, P.S.; Emke, E.; Pocurull, E.; de Voogt, P. Asymmetrical flow field-flow fractionation hyphenated to Orbitrap high resolution mass spectrometry for the determination of (functionalised) aqueous fullerene aggregates. J. Chromatogr. A 2014, 1356, 277–282. [Google Scholar] [CrossRef] [PubMed]
- Pornwilard, M.-M.; Siripinyanond, A. Field-flow fractionation with inductively coupled plasma mass spectrometry: Past, present, and future. J. Anal. Atom. Spectrom. 2014, 29, 1739–1752. [Google Scholar] [CrossRef]
- Lapresta-Fernández, A.; Salinas-Castillo, A.; Anderson De La Llana, S.; Costa-Fernández, J.M.; Domínguez-Meister, S.; Cecchini, R.; Capitán-Vallvey, L.F.; Moreno-Bondi, M.C.; Marco, M.-P.; Sánchez-López, J.C.; et al. A general perspective of the characterization and quantification of nanoparticles: Imaging, spectroscopic, and separation techniques. Crit. Rev. Solid State Mater. Sci. 2014, 39, 423–458. [Google Scholar] [CrossRef]
- Hell, J.; Kneifel, W.; Rosenau, T.; Böhmdorfer, S. Analytical techniques for the elucidation of wheat bran constituents and their structural features with emphasis on dietary fiber—A review. Trends Food Sci. Technol. 2014, 35, 102–113. [Google Scholar] [CrossRef]
- Yohannes, G.; Jussila, M.; Hartonen, K.; Riekkola, M.-L. Asymmetrical flow field-flow fractionation technique for separation and characterization of biopolymers and bioparticles. J. Chromatogr. A 2011, 1218, 4104–4116. [Google Scholar] [CrossRef] [PubMed]
- Qureshi, R.N.; Kok, W.T. Application of flow field-flow fractionation for the characterization of macromolecules of biological interest: A review. Anal. Bioanal. Chem. 2011, 399, 1401–1411. [Google Scholar] [CrossRef] [PubMed]
- Rambaldi, D.C.; Reschiglian, P.; Zattoni, A. Flow field-flow fractionation: Recent trends in protein analysis. Anal. Bioanal. Chem. 2011, 399, 1439–1447. [Google Scholar] [CrossRef] [PubMed]
- Horie, M.; Kato, H.; Iwahashi, H. Cellular effects of manufactured nanoparticles: Effect of adsorption ability of nanoparticles. Arch. Toxicol. 2013, 87, 771–781. [Google Scholar] [CrossRef] [PubMed]
- Zattoni, A.; Roda, B.; Borghi, F.; Marassi, V.; Reschiglian, P. Flow field-flow fractionation for the analysis of nanoparticles used in drug delivery. J. Pharm. Biomed. Anal. 2014, 87, 53–61. [Google Scholar] [CrossRef] [PubMed]
- Wagner, M.; Holzschuh, S.; Traeger, A.; Fahr, A.; Schubert, U.S. Asymmetric flow field-flow fractionation in the field of nanomedicine. Anal. Chem. 2014, 86, 5201–5210. [Google Scholar] [CrossRef] [PubMed]
- Thang, N.M.; Knopp, R.; Geckeis, H.; Kim, J.I.; Beck, H.P. Detection of nanocolloids with flow-field flow fractionation and laser- induced breakdown detection. Anal. Chem. 2000, 72, 1–5. [Google Scholar] [CrossRef] [PubMed]
- Geckeis, H.; Ngo Manh, T.; Bouby, M.; Kim, J.I. Aquatic colloids relevant to radionuclide migration: Characterization by size fractionation and ICP-mass spectrometric detection. Colloid. Surf. A 2003, 217, 101–108. [Google Scholar] [CrossRef]
- Bouby, M.; Geckeis, H.; Ngo Manh, T.; Yun, J.-I.; Dardenne, K.; Schäfer, T.; Walther, C.; Kim, J.-I. Laser-induced breakdown detection combined with asymmetrical flow field-flow fractionation: Application to iron oxi/hydroxide colloid characterization. J. Chromatogr. A 2004, 1040, 97–104. [Google Scholar] [CrossRef] [PubMed]
- Schäfer, T.; Geckeis, H.; Bouby, M.; Fanghänel, T. U, Th, Eu and colloid mobility in a granite fracture under near-natural flow conditions. Radiochim. Acta 2004, 92, 731–737. [Google Scholar] [CrossRef]
- Suteerapataranon, S.; Bouby, M.; Geckeis, H.; Fanghänel, T.; Grudpan, K. Interaction of trace elements in acid mine drainage solution with humic acid. Water Res. 2006, 40, 2044–2054. [Google Scholar] [CrossRef] [PubMed]
- Domingos, R.F.; Baalousha, M.A.; Ju-Nam, Y.; Reid, M.M.; Tufenkji, N.; Lead, J.R.; Leppard, G.G.; Wilkinson, K.J. Characterizing manufactured nanoparticles in the environment: Multimethod determination of particle sizes. Environ. Sci. Technol. 2009, 43, 7277–7284. [Google Scholar] [CrossRef] [PubMed]
- Hassellöv, M.; Kaegi, R. Analysis and Characterization of Manufactured Nanoparticles in Aquatic Environments. Environ. Human Health Imp. Nanotechnol. 2009, 211–266. [Google Scholar]
- Baalousha, M.; Stolpe, B.; Lead, J.R. Flow field-flow fractionation for the analysis and characterization of natural colloids and manufactured nanoparticles in environmental systems: A critical review. J. Chromatogr. A 2011, 1218, 4078–4103. [Google Scholar] [CrossRef] [PubMed]
- Bouby, M.; Geckeis, H.; Lützenkirchen, J.; Mihai, S.; Schäfer, T. Interaction of bentonite colloids with Cs, Eu, Th and U in presence of humic acid: A flow field-flow fractionation study. Geochim. Cosmochim. Acta 2011, 75, 3866–3880. [Google Scholar] [CrossRef]
- Jiménez, M.S.; Gómez, M.T.; Bolea, E.; Laborda, F.; Castillo, J. An approach to the natural and engineered nanoparticles analysis in the environment by inductively coupled plasma mass spectrometry. Int. J. Mass Spectrom. 2011, 307, 99–104. [Google Scholar] [CrossRef]
- Kammer, F.V.D.; Legros, S.; Hofmann, T.; Larsen, E.H.; Loeschner, K. Separation and characterization of nanoparticles in complex food and environmental samples by field-flow fractionation. TrAC - Trends Anal. Chem. 2011, 30, 425–436. [Google Scholar] [CrossRef]
- Rezić, I. Determination of engineered nanoparticles on textiles and in textile wastewaters. TrAC - Trends Anal. Chem. 2011, 30, 1159–1167. [Google Scholar] [CrossRef]
- Silva, B.F.D.; Pérez, S.; Gardinalli, P.; Singhal, R.K.; Mozeto, A.A.; Barceló, D. Analytical chemistry of metallic nanoparticles in natural environments. TrAC - Trends Anal. Chem. 2011, 30, 528–540. [Google Scholar] [CrossRef]
- Ulrich, A.; Losert, S.; Bendixen, N.; Al-Kattan, A.; Hagendorfer, H.; Nowack, B.; Adlhart, C.; Ebert, J.; Lattuada, M.; Hungerbühler, K. Critical aspects of sample handling for direct nanoparticle analysis and analytical challenges using asymmetric field flow fractionation in a multi-detector approach. J. Anal. Atom. Spectrom. 2012, 27, 1120–1130. [Google Scholar] [CrossRef]
- Bandyopadhyay, S.; Peralta-Videa, J.R.; Gardea-Torresdey, J.L. Advanced analytical techniques for the measurement of nanomaterials in food and agricultural samples: A review. Environ. Eng. Sci. 2013, 30, 118–125. [Google Scholar] [CrossRef] [PubMed]
- Lapworth, D.J.; Stolpe, B.; Williams, P.J.; Gooddy, D.C.; Lead, J.R. Characterization of suboxic groundwater colloids using a multi-method approach. Environ. Sci. Technol. 2013, 47, 2554–2561. [Google Scholar] [CrossRef] [PubMed]
- Plathe, K.L.; von der Kammer, F.; Hassellöv, M.; Moore, J.N.; Murayama, M.; Hofmann, T.; Hochella, M.F. The role of nanominerals and mineral nanoparticles in the transport of toxic trace metals: Field-flow fractionation and analytical TEM analyses after nanoparticle isolation and density separation. Geochim. Cosmochim. Acta 2013, 102, 213–225. [Google Scholar] [CrossRef]
- Stolpe, B.; Guo, L.; Shiller, A.M. Binding and transport of rare earth elements by organic and iron-rich nanocolloids in alaskan rivers, as revealed by field-flow fractionation and ICP-MS. Geochim. Cosmochim. Acta 2013, 106, 446–462. [Google Scholar] [CrossRef]
- Bolea, E.; Jiménez-Lamana, J.; Laborda, F.; Abad-Álvaro, I.; Bladé, C.; Arola, L.; Castillo, J.R. Detection and characterization of silver nanoparticles and dissolved species of silver in culture medium and cells by AsFlFFF-UV-Vis-ICPMS: Application to nanotoxicity tests. Analyst 2014, 139, 914–922. [Google Scholar] [CrossRef] [PubMed]
- Gottselig, N.; Bol, R.; Nischwitz, V.; Vereecken, H.; Amelung, W.; Klumpp, E. Distribution of phosphorus- containing fine colloids and nanoparticles in stream water of a forest catchment. Vadose Zone J. 2014, 13, 1539–1663. [Google Scholar] [CrossRef]
- Regelink, I.C.; Voegelin, A.; Weng, L.; Koopmans, G.F.; Comans, R.N.J. Characterization of colloidal Fe from soils using field-flow fractionation and Fe K-edge X-ray absorption spectroscopy. Environ. Sci. Technol. 2014, 48, 4307–4316. [Google Scholar] [CrossRef] [PubMed]
- Stolpe, B.; Zhou, Z.; Guo, L.; Shiller, A.M. Colloidal size distribution of humic- and protein-like fluorescent organic matter in the northern Gulf of Mexico. Marine Chem. 2014, 164, 25–37. [Google Scholar] [CrossRef]
- Huber, F.M.; Heck, S.; Truche, L.; Bouby, M.; Brendlé, J.; Hoess, P.; Schäfer, T. Radionuclide desorption kinetics on synthetic Zn/Ni-labeled montmorillonite nanoparticles. Geochim. Cosmochim. Acta 2015, 148, 426–441. [Google Scholar] [CrossRef]
- Severmann, S.; Mills, R.A.; Palmer, M.R.; Fallick, A.E. The origin of clay minerals in active and relict hydrothermal deposits. Geochim. Cosmochim. Acta 2004, 68, 73–88. [Google Scholar] [CrossRef]
- Uysal, I.T.; Golding, S.D. Rare earth element fractionation in authigenic illite-smectite from late Permian clastic rocks, Bowen basin, Australia: Implications for physic-chemical environments of fluids during illitization. Chem. Geol. 2003, 193, 167–179. [Google Scholar] [CrossRef]
- Piper, D.Z. Rare earth elements in the sedimentary cycle: A summary. Chem. Geol. 1974, 14, 285–304. [Google Scholar] [CrossRef]
- Carrado, K.A.; Xu, L.; Gregory, D.M.; Song, K.; Seifert, S.; Botto, R.E. Crystallization of a layered silicate clay as monitored by small-angle X-ray scattering and NMR. Chem. Mater. 2000, 12, 3052–3059. [Google Scholar] [CrossRef]
- Giddings, J.C.; Yang, F.J.; Myers, M.N. Theoretical and experimental characterization of flow field flow fractionation. Anal. Chem. 1976, 48, 1126. [Google Scholar] [CrossRef]
- Schimpf, M.; Caldwell, K.; Giddings, J.C. Field Flow Fractionation Handbook. In Field Flow Fractionation Handbook; Wiley Interscience: New York, NY, USA, 2000. [Google Scholar]
- Bouby, M.; Geckeis, H.; Geyer, F.W. Application of asymmetric flow field-flow fractionation (AsFlFFF) coupled to inductively coupled plasma mass spectrometry (ICPMS) to the quantitative characterization of natural colloids and synthetic nanoparticles. Anal. Bioanal. Chem. 2008, 392, 1447–1457. [Google Scholar] [CrossRef] [PubMed]
- Wijnhoven, J.E.G.J.; Koorn, J.P.; Poppe, H.; Kok, W.T. Hollow-fibre flow field-flow fractionation of polystyrene sulphonates. J. Chromatogr. A 1995, 699, 119–129. [Google Scholar] [CrossRef]
- Benincasa, M.A.; Giddings, J.C. Separation and Characterization of Cationic, Anionic, and Nonionic Water-Soluble Polymers by Flow FFF: Sample Recovery, Overloading, and Ionic Strength Effects. J. Microcolumn Sep. 1997, 9, 479–495. [Google Scholar] [CrossRef]
- Ngo Manh, T.; Geckeis, H.; Kim, J.I.; Beck, H.P. Application of the flow field flow fractionation (FFFF) to the characterization of aquatic humic colloids: Evaluation and optimization of the method. Colloid. Surf. A 2001, 181, 289–301. [Google Scholar] [CrossRef]
- Henrist, C.; Mathieu, J.-P.; Vogels, C.; Rulmont, A.; Clooots, R. Morphological study of magnesium hydroxide nanoparticles precipitated in dilute aqueous solution. J. Crystal Growth 2003, 249, 321–330. [Google Scholar] [CrossRef]
- Phillips, V.A.; Kolbe, J.L.; Opperhauser, H. Effect of pH on the growth of Mg(OH)2 crystals in an aqueous environment at 60 °C. J. Crystal Growth 1977, 41, 228–234. [Google Scholar] [CrossRef]
- Rumyantsev, M.; Shauly, A.; Yiantsios, S.G.; Hasson, D.; Karabelas, A.J.; Semiat, R. Parameters affecting the properties of dynamic membranes formed by Zr hydroxide colloids. Desalination 2000, 131, 189–200. [Google Scholar] [CrossRef]
- Cho, H.-R.; Walther, C.; Rothe, J.; Neck, V.; Denecke, M.A.; Dardenne, K.; Fanghänel, T. Combined LIBD and XAFS investigation of the formation and structure of Zr(IV) colloids. Anal. Bioanal. Chem. 2005, 383, 28–40. [Google Scholar] [CrossRef] [PubMed]
© 2015 by the authors; licensee MDPI, Basel, Switzerland. This article is an open access article distributed under the terms and conditions of the Creative Commons Attribution license (http://creativecommons.org/licenses/by/4.0/).
Share and Cite
Bouby, M.; Finck, N.; Geckeis, H. Synthetic Smectite Colloids: Characterization of Nanoparticles after Co-Precipitation in the Presence of Lanthanides and Tetravalent Elements (Zr, Th). Chromatography 2015, 2, 545-566. https://doi.org/10.3390/chromatography2030545
Bouby M, Finck N, Geckeis H. Synthetic Smectite Colloids: Characterization of Nanoparticles after Co-Precipitation in the Presence of Lanthanides and Tetravalent Elements (Zr, Th). Chromatography. 2015; 2(3):545-566. https://doi.org/10.3390/chromatography2030545
Chicago/Turabian StyleBouby, Muriel, Nicolas Finck, and Horst Geckeis. 2015. "Synthetic Smectite Colloids: Characterization of Nanoparticles after Co-Precipitation in the Presence of Lanthanides and Tetravalent Elements (Zr, Th)" Chromatography 2, no. 3: 545-566. https://doi.org/10.3390/chromatography2030545