1. Introduction
A wide range of chromatographic separation techniques are available utilizing various target properties, including size, polarity, charge, and hydrophobicity. These methods typically provide an effective “temporal” distribution of components due to differences in the rate of target passage through the separation medium (batch process). By contrast, separations using small-scale geometric features, like those of the current study, provide an effectively “spatial” distribution of targets. That is, at a given time, targets are physically distributed across the endpoint of the device. This type of distribution makes a continuous separation process possible. These types of devices can be applied for both deterministic and nondeterministic separations. Nondeterministic methods rely on the effects of Brownian motion under asymmetric field conditions, where the amount of separation depends on the properties of the field. Similar effects can be achieved using an applied field resulting from electromagnetic, acoustic, or chemical considerations. In a device utilizing geometrical shapes for separation, the feature causes movement based on differences in native diffusivities. The other applied fields lead to separation on the basis of the effective diffusivities, resulting from a combination of the native diffusivity and the field effect. These types of effects have been evaluated in a range of miniature, planar devices [
1,
2,
3,
4]. Field driven devices have the potential to separate similarly sized targets with different field dependencies (charge, for example), while geometrical devices separate on the basis of size and shape. In either case, flow rates through the field must be sufficiently slow to allow the diffusion process to influence target movement in the direction perpendicular to the flow. At higher laminar flow rates, a deterministic separation can be induced. In this case, smaller particles follow the lines of flow around the geometric objects while large particles are deflected upon contact [
5,
6].
Geometrical Boltzmann and deterministic ratchets present attractive options due to the relative simplicity in construction and provide continuous spatial separation of mixtures rather than the temporal separation of classic chromatographic techniques. These approaches can also be utilized for other applications, such as preconcentration [
7]. Experimental effort has focused on the physical shapes of the features for achieving separations based on Brownian motion with little consideration of the properties utilized in chromatographic separations [
7,
8,
9,
10]. There is significant literature on the use of these types of devices in mixing and flow control (Volume 75, Issue 2 of
Applied Physics A focuses on these topics) [
11,
12]. A large amount of theoretical work in the area is also available [
13,
14,
15,
16,
17,
18]. A major weakness for Boltzmann type ratchets is that flow rates must be very low to allow for the diffusive separation resulting in behaviors observed only over long time scales. In fact, achieving conditions dominated by nondeterministic effects is difficult for real systems.
In addition to concerns regarding flow rates, the dimensions of the features in real-world systems are constrained often resulting in significant surface area to fluid volume ratios. Under this condition surface effects begin to play an important role in the expected outcomes. This idea led us to consider the impact of surface-target interactions within devices comprised of geometric ratchets. The premise was that it might be possible to separate similarly sized molecules of similar native diffusivities on the basis of distinct surface interactions, with the presence of geometrical features impacting the spatial distribution of targets. This would provide chromatography-like separation in a spatial, rather than temporal, format. The study described here sought to investigate the impact of surface-target interactions in a device comprised of an array of geometrical features. Rather than starting with a system where both Boltzmann type behaviors and behaviors resulting from surface interactions are present, the flow rates considered in this study are sufficiently higher than those required for Boltzmann separations, and the pattern of features chosen should not lead to deterministic movement of particles. The effort seeks to identify the presence of surface-target interaction effects and to quantify those effects under conditions for which nondeterministic aspects and other flow considerations may contribute to the observed behavior while not dominating it.
2. Experimental Section
Hydrogen peroxide (30%), sulfuric acid, sodium phosphate dibasic, and sodium phosphate monobasic were obtained from Sigma-Aldrich (St. Louis, MO, USA). Carboxyethylsilanetriol (CES), 3-aminopropyltriethoxysilane (APS), nonafluorohexyltriethoxysilane (NFS), and phenyltrimethoxysilane (PTS) were obtained from Gelest (Morrisville, PA, USA). Carboxyl orange fluorescent polystyrene nanospheres were manufactured by Phosphorex (Hopkinton, MA, USA); these materials were selected for their narrow distribution of particle diameters. The nanoparticles had a diameter of 40 nm with an excitation wavelength of 460 nm and an emission wavelength of 500 nm. All chemicals were used as received. Water was deionized to 18.2 MΩ using a Mill-Q water purification system. Buffer solutions at three pH values (6.5, 7.5, and 9.5) were prepared through mixing 0.5 M sodium phosphate monobasic and dibasic solutions. These stock solutions were diluted to obtain 50 mM final concentrations for the experimental samples.
2.1. Fluorescence
The as-received nanoparticle solution was 1% solids. This solution was diluted 1:7140 in deionized water to produce a stock solution of 1.11 × 10¹⁶ particles per liter (p/L). This stock and two dilutions of this stock (1:500, 2.2 × 10¹³ p/L and 1:50, 2.2 × 10¹⁴ p/L) were utilized in experiments. A calibration curve relating the fluorescence of the solutions to the concentration of the nanoparticles was collected for each experiment. This curve was prepared in the microtiter plate used for the experimental samples and was measured during analysis of the experimental results. The calibration curve consisted of six points prepared by serial dilution (2× each step) of the experimental solution. A linear fit of the resulting data utilized as fluorescence intensity versus nanoparticle concentration was generated for each curve (slope = 1 × 10⁻¹⁰; y-intercept = 3965). The variation between experiments was approximately 10%; variations for replicate measurements within a single experiment were less than 3%. Fluorescence measurements were completed using a Tecan XSafire microtiter plate reader (Tecan Group Ltd., Männedorf, Switzerland) at 460 nm excitation and 500 nm emission (10 nm bandwidth).
2.2. Experimental Setup
Two generations of devices were fabricated for the work described here. The first generation used soda lime glass microscope slides as the substrate. Features were etched using buffered oxide etch solution and were based on transparency masks. Second generation devices used four-inch silicon wafers as the substrate. Features were etched using the Bosch deep reactive-ion etching (DRIE) process. Details for fabrication of both devices are provided in the
Supplementary Information.
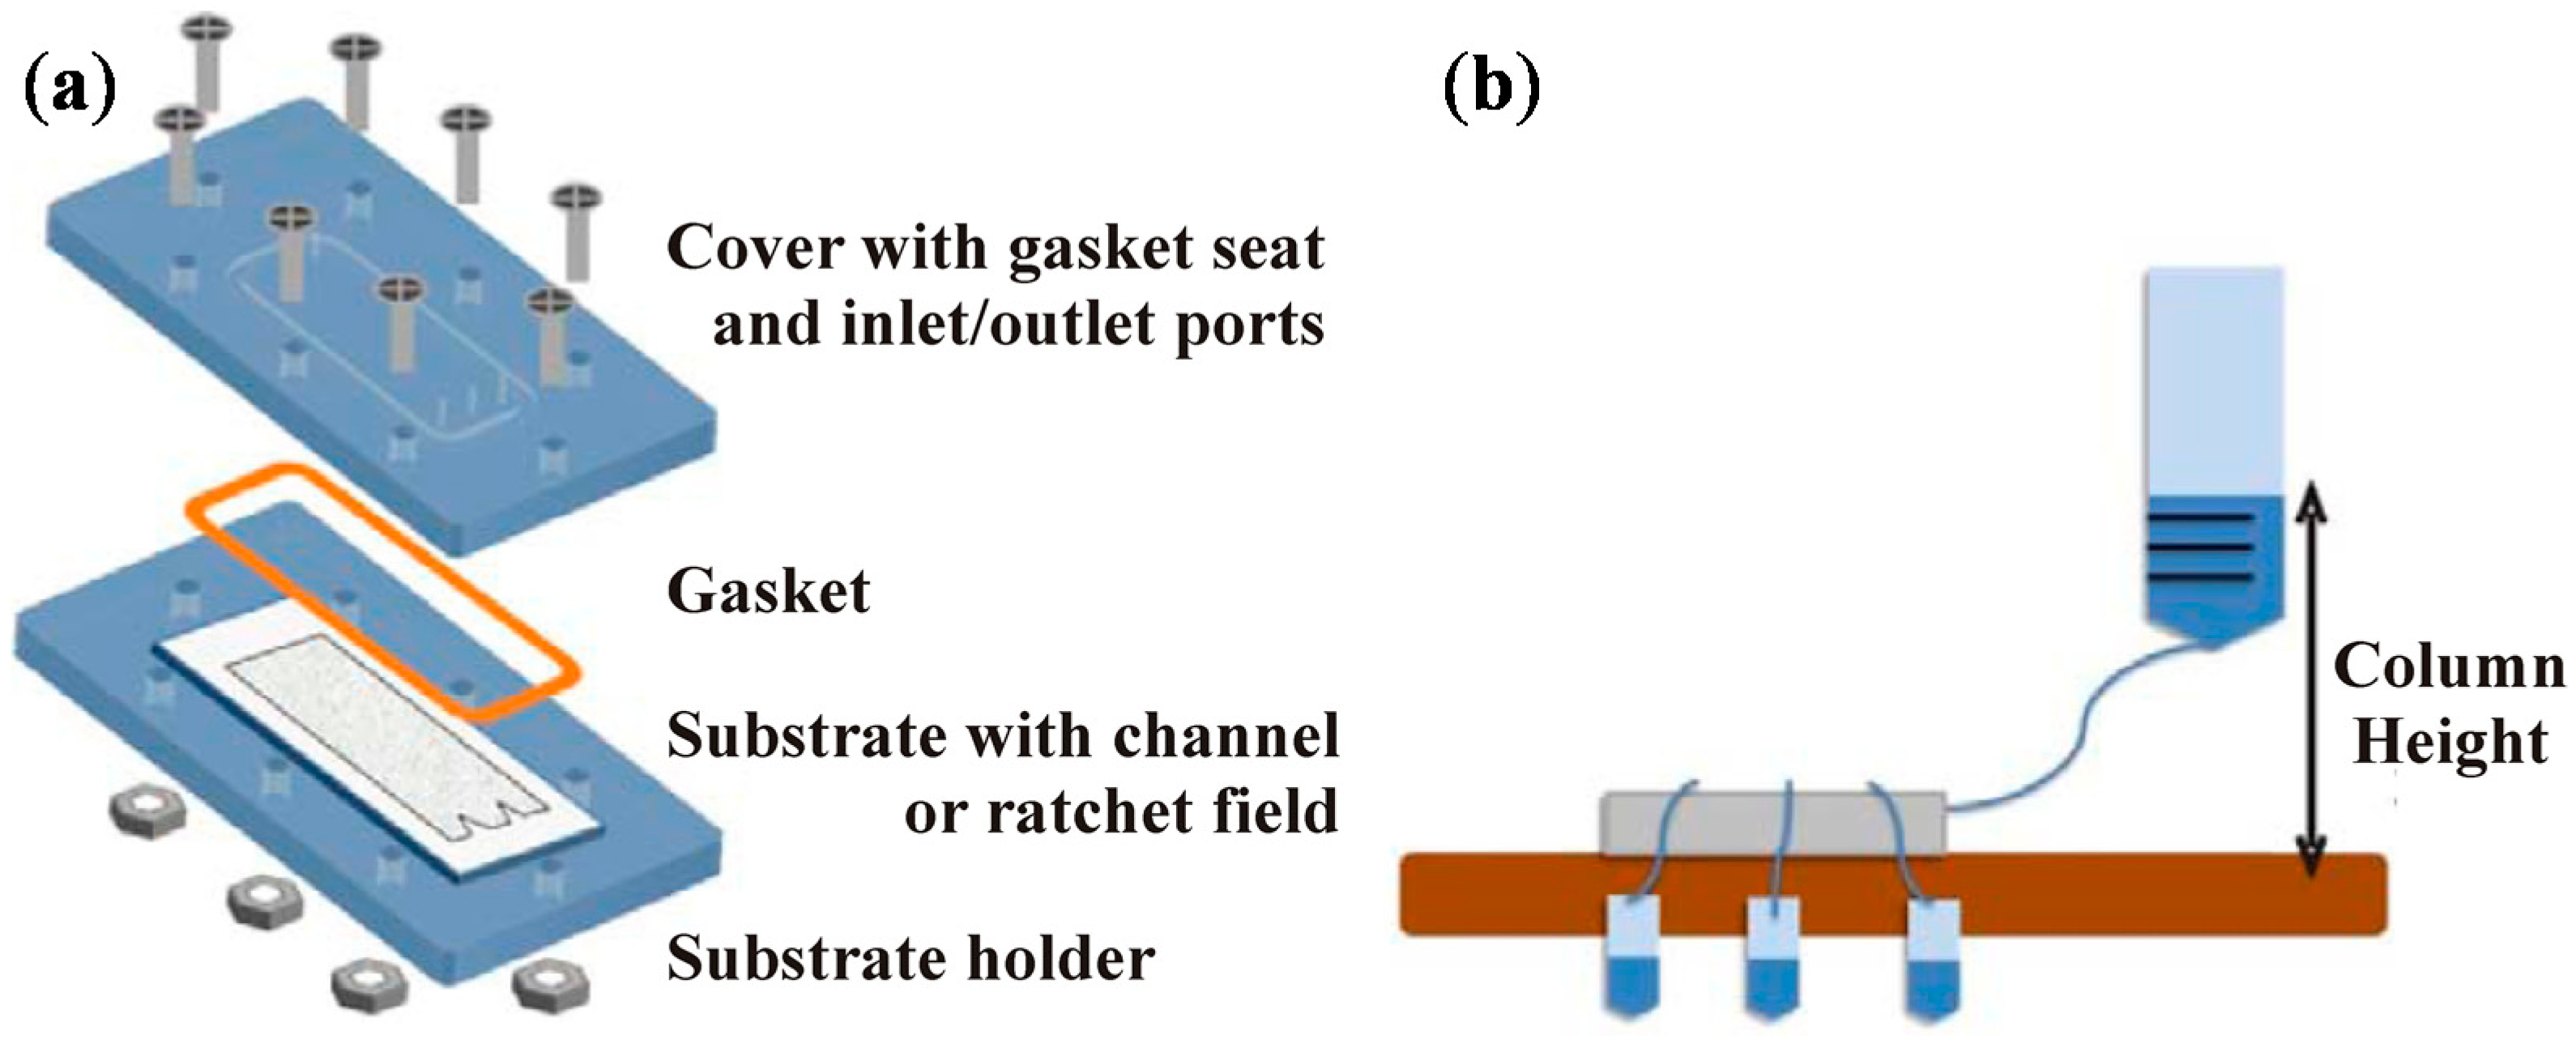
Custom holders for both device generations were fabricated in Plexiglas-G and sealed with O-rings (
Figure 1). The holders were designed to provide flow of the solution between the features on the substrates rather than over the top of the features. Dispensing syringe tips (Nordson EFD, Westlake, OH, USA) were inserted into the holders to facilitate connections to silicone tubing. For both device generations, gravity-fed flow rates were controlled through adjusting the distance from the top of the fluid column (60 mL syringe used as sample reservoir) and the device inlet. This was accomplished by altering the fill volume of the syringe and/or the height of the syringe above the device. Tubing (Tygon, formula R-3603, inner diameter (ID) = 0.0173'', outer diameter (OD) = 0.0893'', Cole-Parmer, Vernon Hills, IL, USA) connected the syringe to the inlet port and the three outlet ports to the collection vials (typically, Eppendorf tubes). All solutions were de-gassed prior to use; air in the devices was found to result in inconsistent flow rates. For the first generation glass devices, 1 mL of the solution being used was allowed to pass through the device so that the system could come to equilibrium before samples were collected. For each trial, the solution flow time was measured, and the individual collection vessels were weighed before and after filling so that flow rates could be monitored. The second generation wafer devices were used similarly with one exception, the equilibrium time was extended to 1 h prior to sample collection. For the Generation 1 glass devices, flow rates between 0.22 mL/min and 0.24 mL/min were utilized in all cases. Flow rates for the Generation 2 devices are specified in the text and/or figure captions.
Figure 1.
Experimental setup. The assembly for the Generation 1 glass devices is shown (a). The assembly for Generation 2 silicon devices is identical except for dimensions. Also shown is the experimental setup (b) including the water column and the collection vessels. The schematic below illustrates proper and improper inlet orientation.
2.3. Chemical Surface Functionalization
Etched devices were cleaned prior to use in experiments. Cleaning involved soaking in piranha cleaning solution, a mixture of 30% hydrogen peroxide and 70% sulfuric acid, for 30 min. Following the piranha bath, devices were repeatedly rinsed in deionized water and dried at 110 °C. Functionalization of Generation 2 wafers was accomplished by immersing the wafer in a solution of toluene with 20 mM silane precursor (CES, APS, PTS, or NFS) for 45 min. The wafers were then dipped sequentially in toluene baths (3) to remove excess solution and dried at 110 °C overnight. Both feature-bearing and channel-only wafers were functionalized using each of the precursors. Functionalization of Generation 1 devices was accomplished similarly; however, concentrations of 50 and 150 mM APS, PTS, and NFS were utilized.
3. Results and Discussion
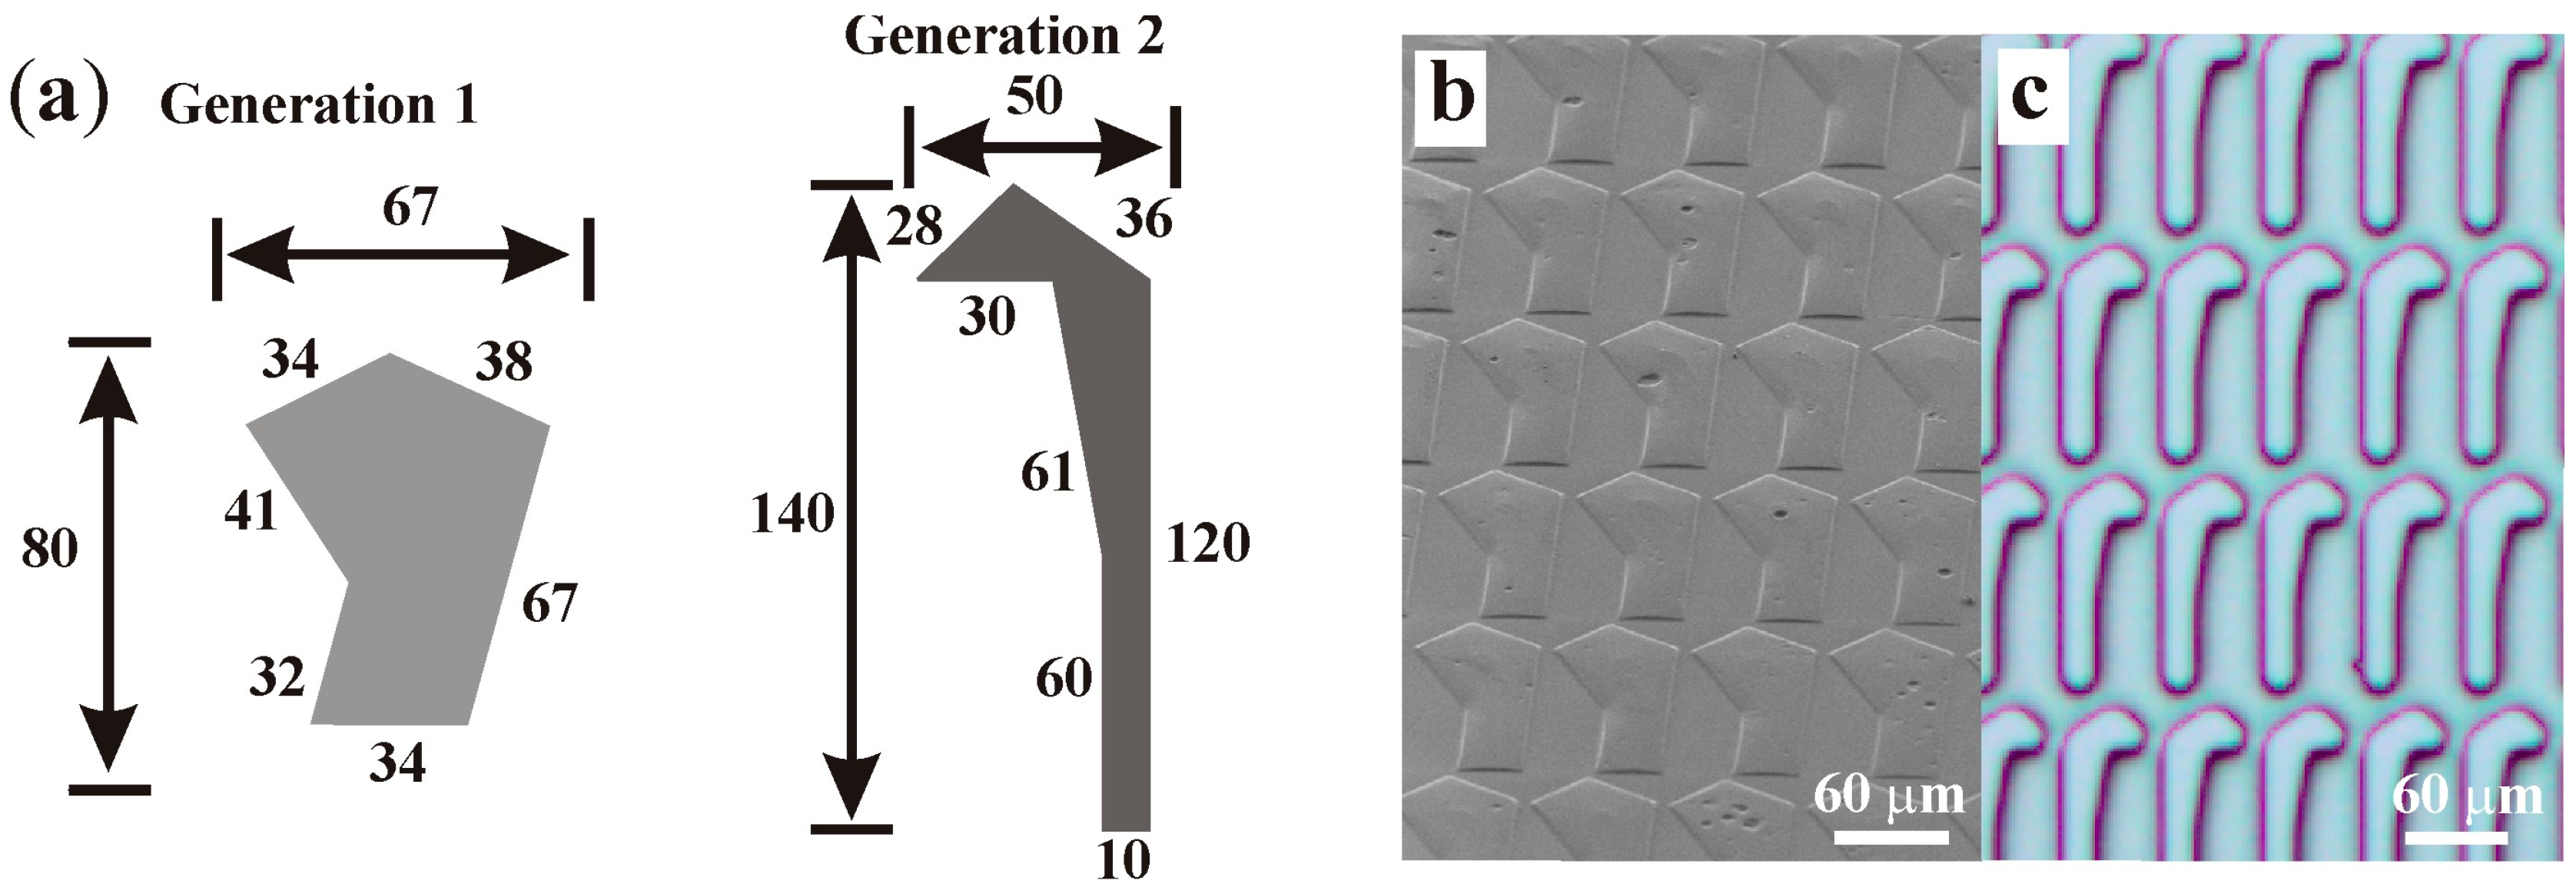
Generation 1 glass devices were designed with asymmetric features of overall dimensions 67 × 80 μm etched between 5 μm and 6 μm into the surface (
Figure 2).
Figure 2.
Asymmetric features: (a) feature dimensions for both the Generation 1 (glass) and 2 (silicon) devices are presented. All dimensions are provided in μm; (b) the scanning electron microscope (SEM) image shows a field of Generation 1 features; and (c) the image shows a field of Generation 2 features.
Asymmetric features are required to achieve a separation effect for these devices. Minimum requirements for devices are a region for diffusion of flow across the tops of the features, a peak which results in a separation of flow, and a component of the device that limits diffusion back into the original flow pattern. The fraction of molecules expected to diffuse down each side of the feature (
P) can be estimated with the following equation [
14,
19,
20]:
The diffusivity (D) of the molecules is the factor that differs and leads to a separation effect as molecules pass through the field. Whether or not the effect occurs is highly dependent on the dimension of the feature, xb and yb and the flow rate (vy) through the device. Estimates for the diffusion coefficient of the nanoparticles can be made using the Stokes–Einstein equation, which depends on temperature, the viscosity of the fluid, and the diameter of the particles. Based on the device dimensions and the above equation, a significant Boltzmann separation effect will be observed beginning at volume flow rates of 0.3 μL/min; the flow rates used in these experiments are three orders of magnitude larger. Another common measure of the importance of diffusion effects is provided by the Péclet number. For the systems considered here, the Péclet numbers range between ~200 and 7000 depending on the definition used. For these considerations to be dominant, the value should be less than one.
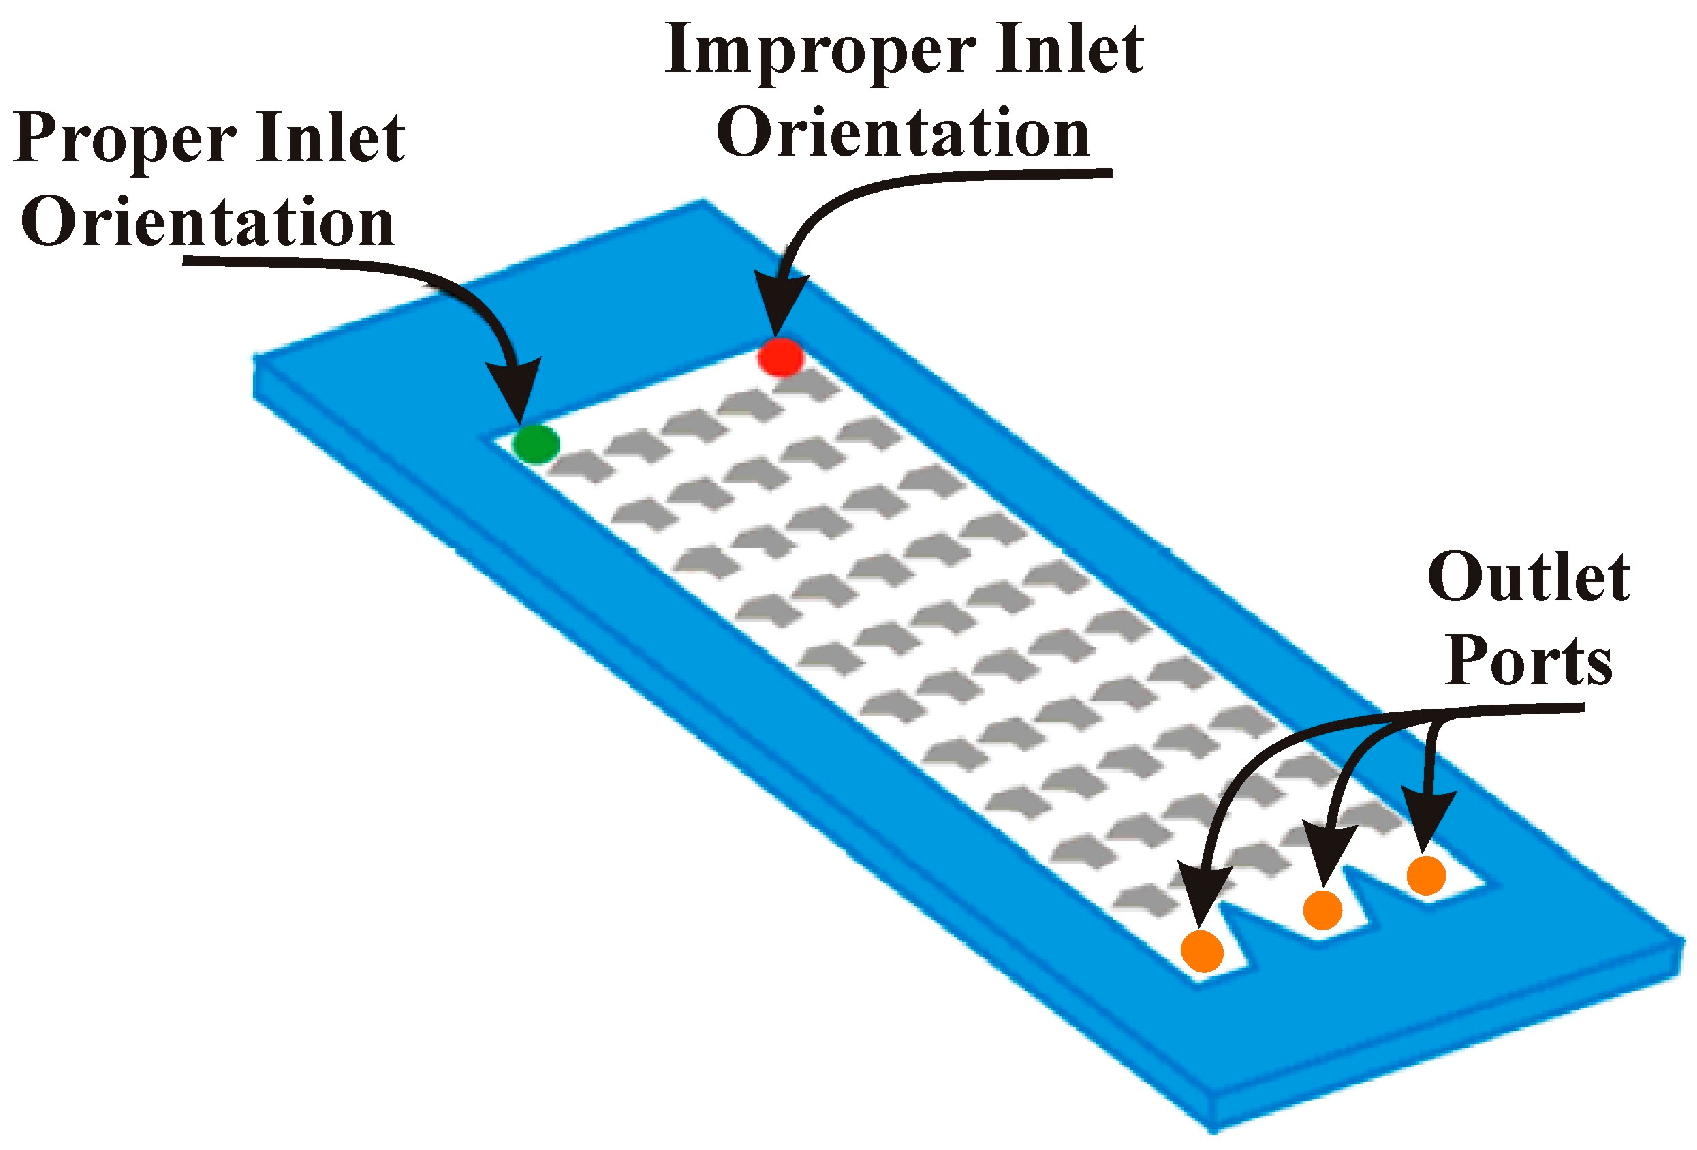
The analysis used here compared the concentrations at three exit ports distributed across the 1.4 cm width of the devices at the end of the 4.45 cm field. These results were compared to the initial concentration of the nanoparticle solution as well as to results obtained for channels of identical form etched without the asymmetric features. It is important to note that the inlet port on the device was oriented on the short side of the asymmetric features (
Figure 3). Altering this orientation strongly impacts the performance of the device (
Supplementary Information Table S1). Initial evaluation of the device indicated a slight increase in concentration (1.5%) for the far side outlet port (#3) while the inlet port side (#1) had a slightly reduced concentration (
Figure 4). These changes in concentration across the device were, however, within the noise noted for the experiments. Results for the channel only device are included for comparison.
Figure 3.
Inlet orientation. The schematic illustrates proper and improper inlet orientation as well as the location of the outlet ports.
Figure 3.
Inlet orientation. The schematic illustrates proper and improper inlet orientation as well as the location of the outlet ports.
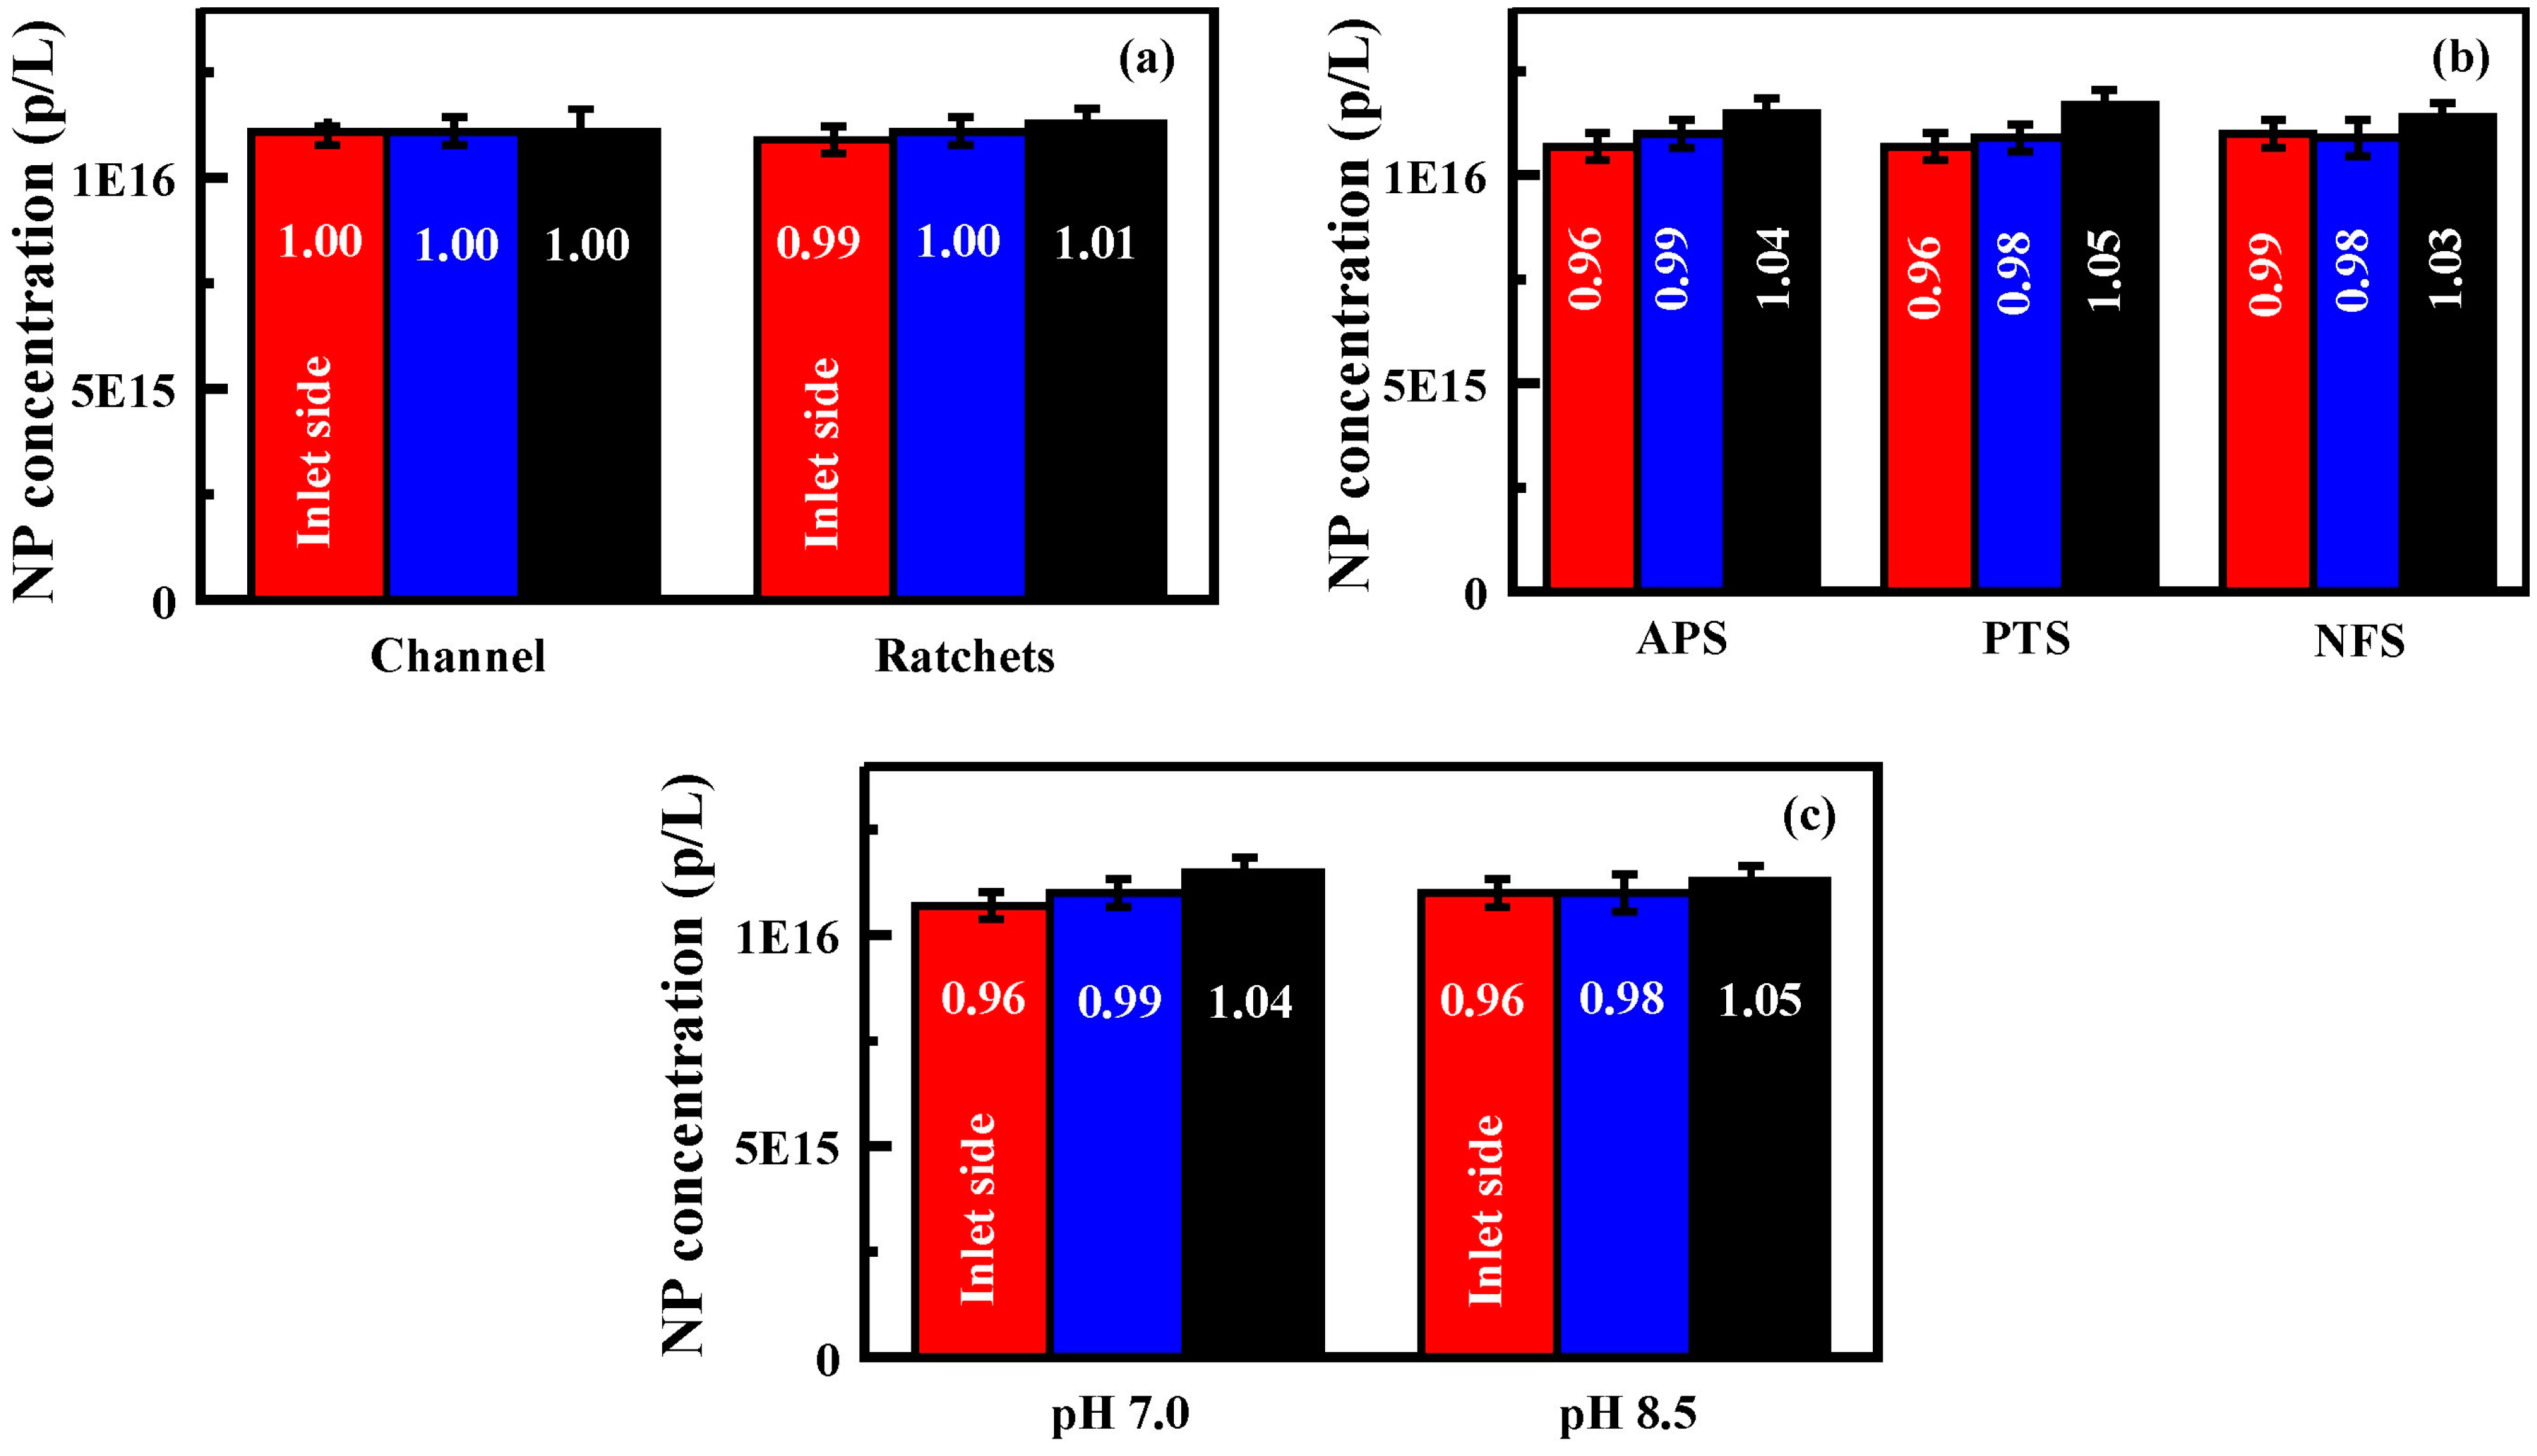
The Generation 1 glass devices were functionalized with APS, PTS, and NFS in order to evaluate the potential of chemical surface functionality for enhancing separation effects. The goal was to increase the interactions between the particles and the surfaces within the devices to generate further bias in the movement of the particles. These chemical functionalities produced very little change in the particle distributions across the three exit ports (
Figure 4,
Supplementary Information Figure S1 and Table S2). While the data set did serve to confirm the enhanced concentration noted at port #3 for the unfunctionalized device, enhancements upon surface functionalization were only a few percent regardless of the concentration of precursor utilized (50 or 150 mM). Because both the nanoparticles and the APS functionalized surfaces bear charged groups, it was thought that altering the pH of the nanoparticle solutions might serve to enhance the bias on the particle diffusion. Solution pHs of 4.5, 7.0, and 8.5 were considered. At low pH (4.5), the nanoparticles were observed to precipitate from solution; results at this pH were discarded. Results for solutions at pH 7.0 and 8.5 are presented in
Figure 4 (see also
Supplementary Information Figure S2 and Table S2). The solutions produced similar concentration profiles to those prepared in deionized water. The changes in concentration noted for these devices, regardless of surface functionalization or charge, were within a few percent of the total particle concentration.
Figure 4.
Generation 1 performance: (
a) nanoparticle concentrations obtained for each exit port of an unfunctionalized Generation 1 device. Results for both the channel only and the feature bearing devices are shown; (
b) nanoparticle concentrations obtained for each exit port of functionalized (50 mM) Generation 1 devices; and (
c) nanoparticle concentrations obtained for each exit port of a 3-aminopropyltriethoxysilane (APS) functionalized device (50 mM) when the pH of the solutions was controlled. In all panels, bars are, from left to right, exit port on the inlet side, at the center, and furthest from the inlet side. Nanoparticle solutions utilized for these experiments were 1.11 × 10
16 p/L. Data presented are the average of three replicates. Additional results provided in the
Supplementary Information, Table S2 and Figures S2 and S3.
3.1. Generation 2 Devices
A number of factors were considered with a view toward achieving a useful degree of bias in the diffusion of the particles. First, the Generation 2 silicon devices were designed with a feature field that is 7.48 cm long as compared to the 4.45 cm fields of the Generation 1 devices (field widths were 1.4 cm;
Figure 3). The shape of the features was also modified to obtain a shape that would provide greater bias at flow rates that could be consistently achieved. The features were narrowed and lengthened (50 µm × 140 µm). Second, the experiments with the Generation 2 devices utilized an equilibration time of 1 h before collection of data. This provided the potential to completely flush previously used solutions as well as to establish behaviors that may not be observed during the introduction of new solutions. Finally, functionalization of the wafers using carboxyl groups was considered as well as the amine, phenyl, and fluorine groups considered above.
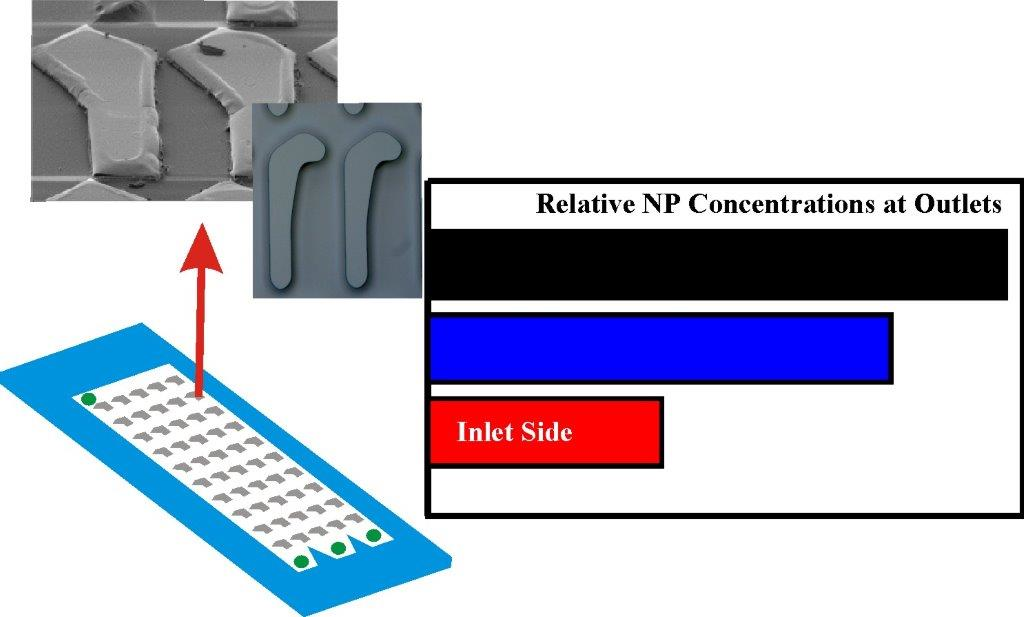
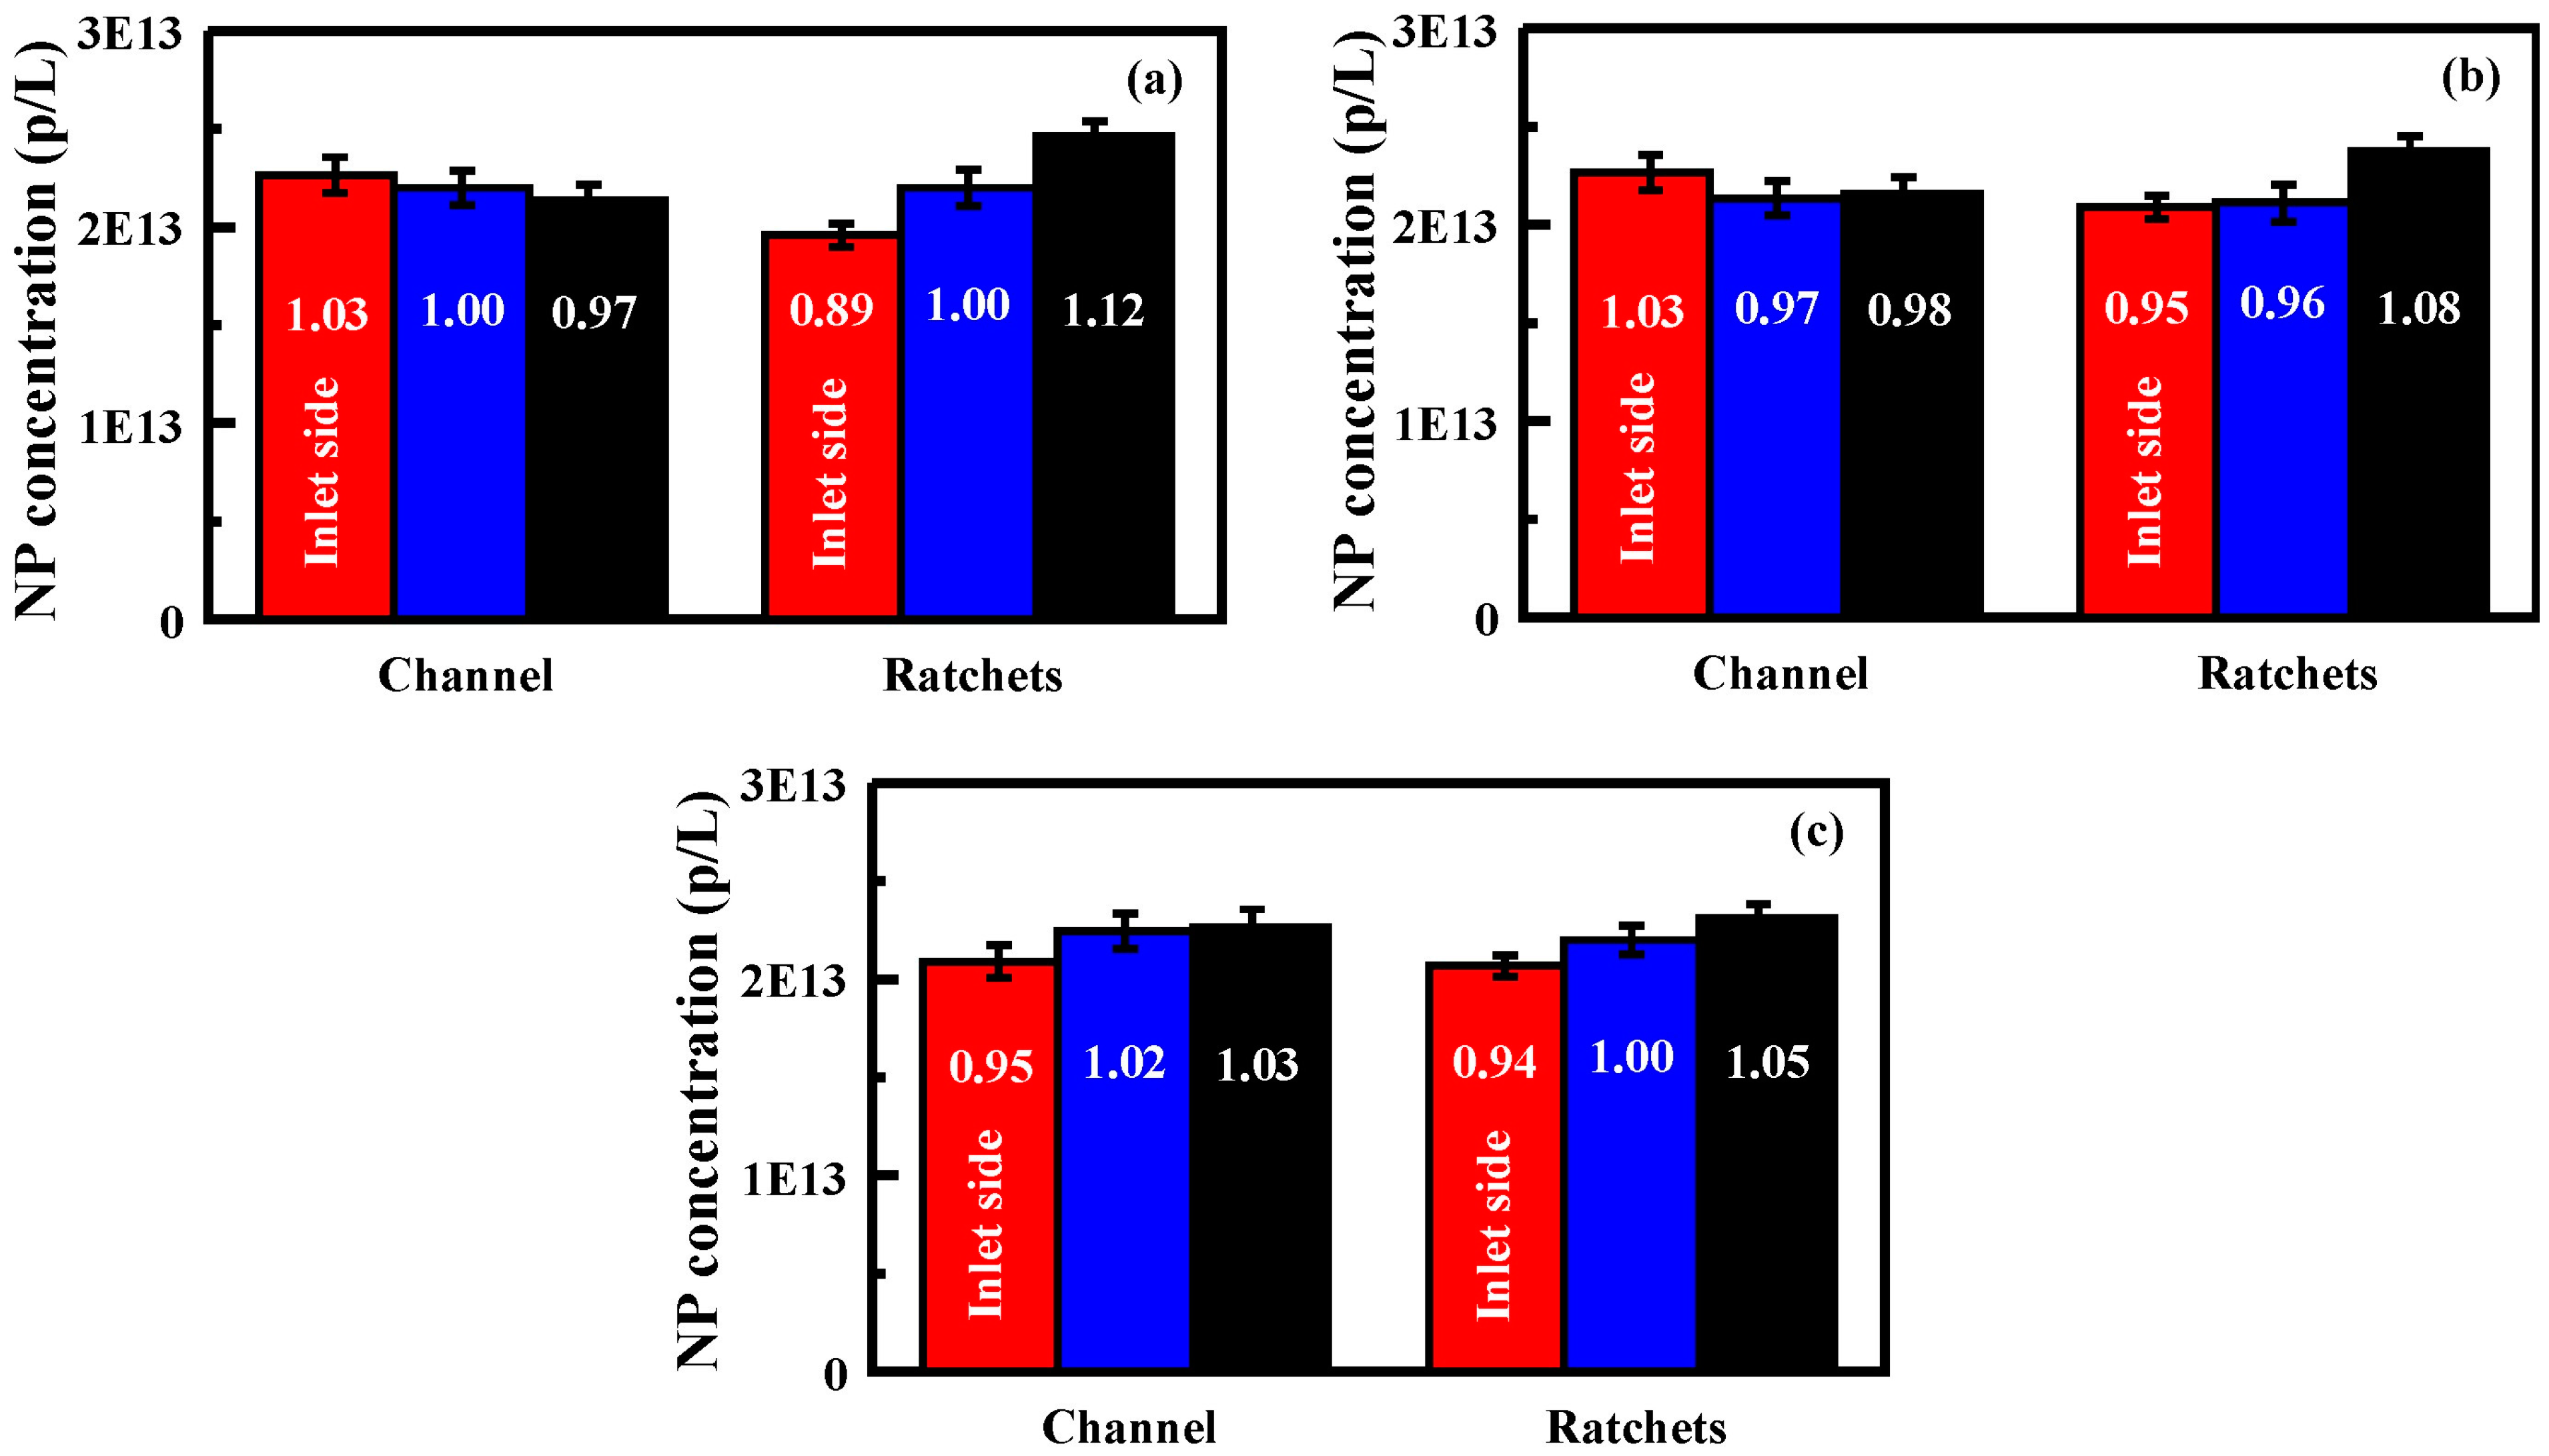
Initial studies using the Generation 2 devices with no surface functionalization and nanoparticle solutions in deionized water saw differences in concentration across the exit ports that were greater than those observed with the Generation 1 devices. Concentration enhancements on the order of 6% to 12% were noted (
Figure 5,
Supplementary Information Table S3). Devices in which the inlet side was oriented on the opposite side of the field did not result in changes to concentrations (
Figure 3 and
Table S4). Similar experiments were completed for wafers functionalized with CES, APS, PTS, and NFS. The results obtained for PTS and NFS surfaces were similar to those for the unfunctionalized wafers (
Supplementary Information Table S3 and Figure S3). APS functionalized wafers showed up to a 33% greater concentration of nanoparticles at the far side outlet port (#3) than that obtained for the inlet side (#1;
Figure 5,
Supplementary Information Figure S3). CES functionalized wafers showed a 12% greater concentration of nanoparticles at the far side exit port (#3).
Figure 5.
Generation 2 performance following functionalization: (
a) nanoparticle concentrations obtained for each exit port of an unfunctionalized Generation 2 device; (
b) nanoparticle concentrations obtained for each exit port of an APS functionalized (20 mM) Generation 2 device; and (
c) nanoparticle concentrations obtained for each exit port of a Carboxyethylsilanetriol (CES) functionalized (20 mM) Generation 2 device. Results for both the channel only and the feature bearing devices are shown. Bars are, from left to right, exit port on the inlet side, at the center, and furthest from the inlet side. Nanoparticle solutions utilized for these experiments were 2.2 × 10
13 p/L. Flow rates are 0.25–0.26 mL/min. Data presented is the average of three replicates. Additional results provided in the
Supplementary Information, Table S3 and Figure S3.
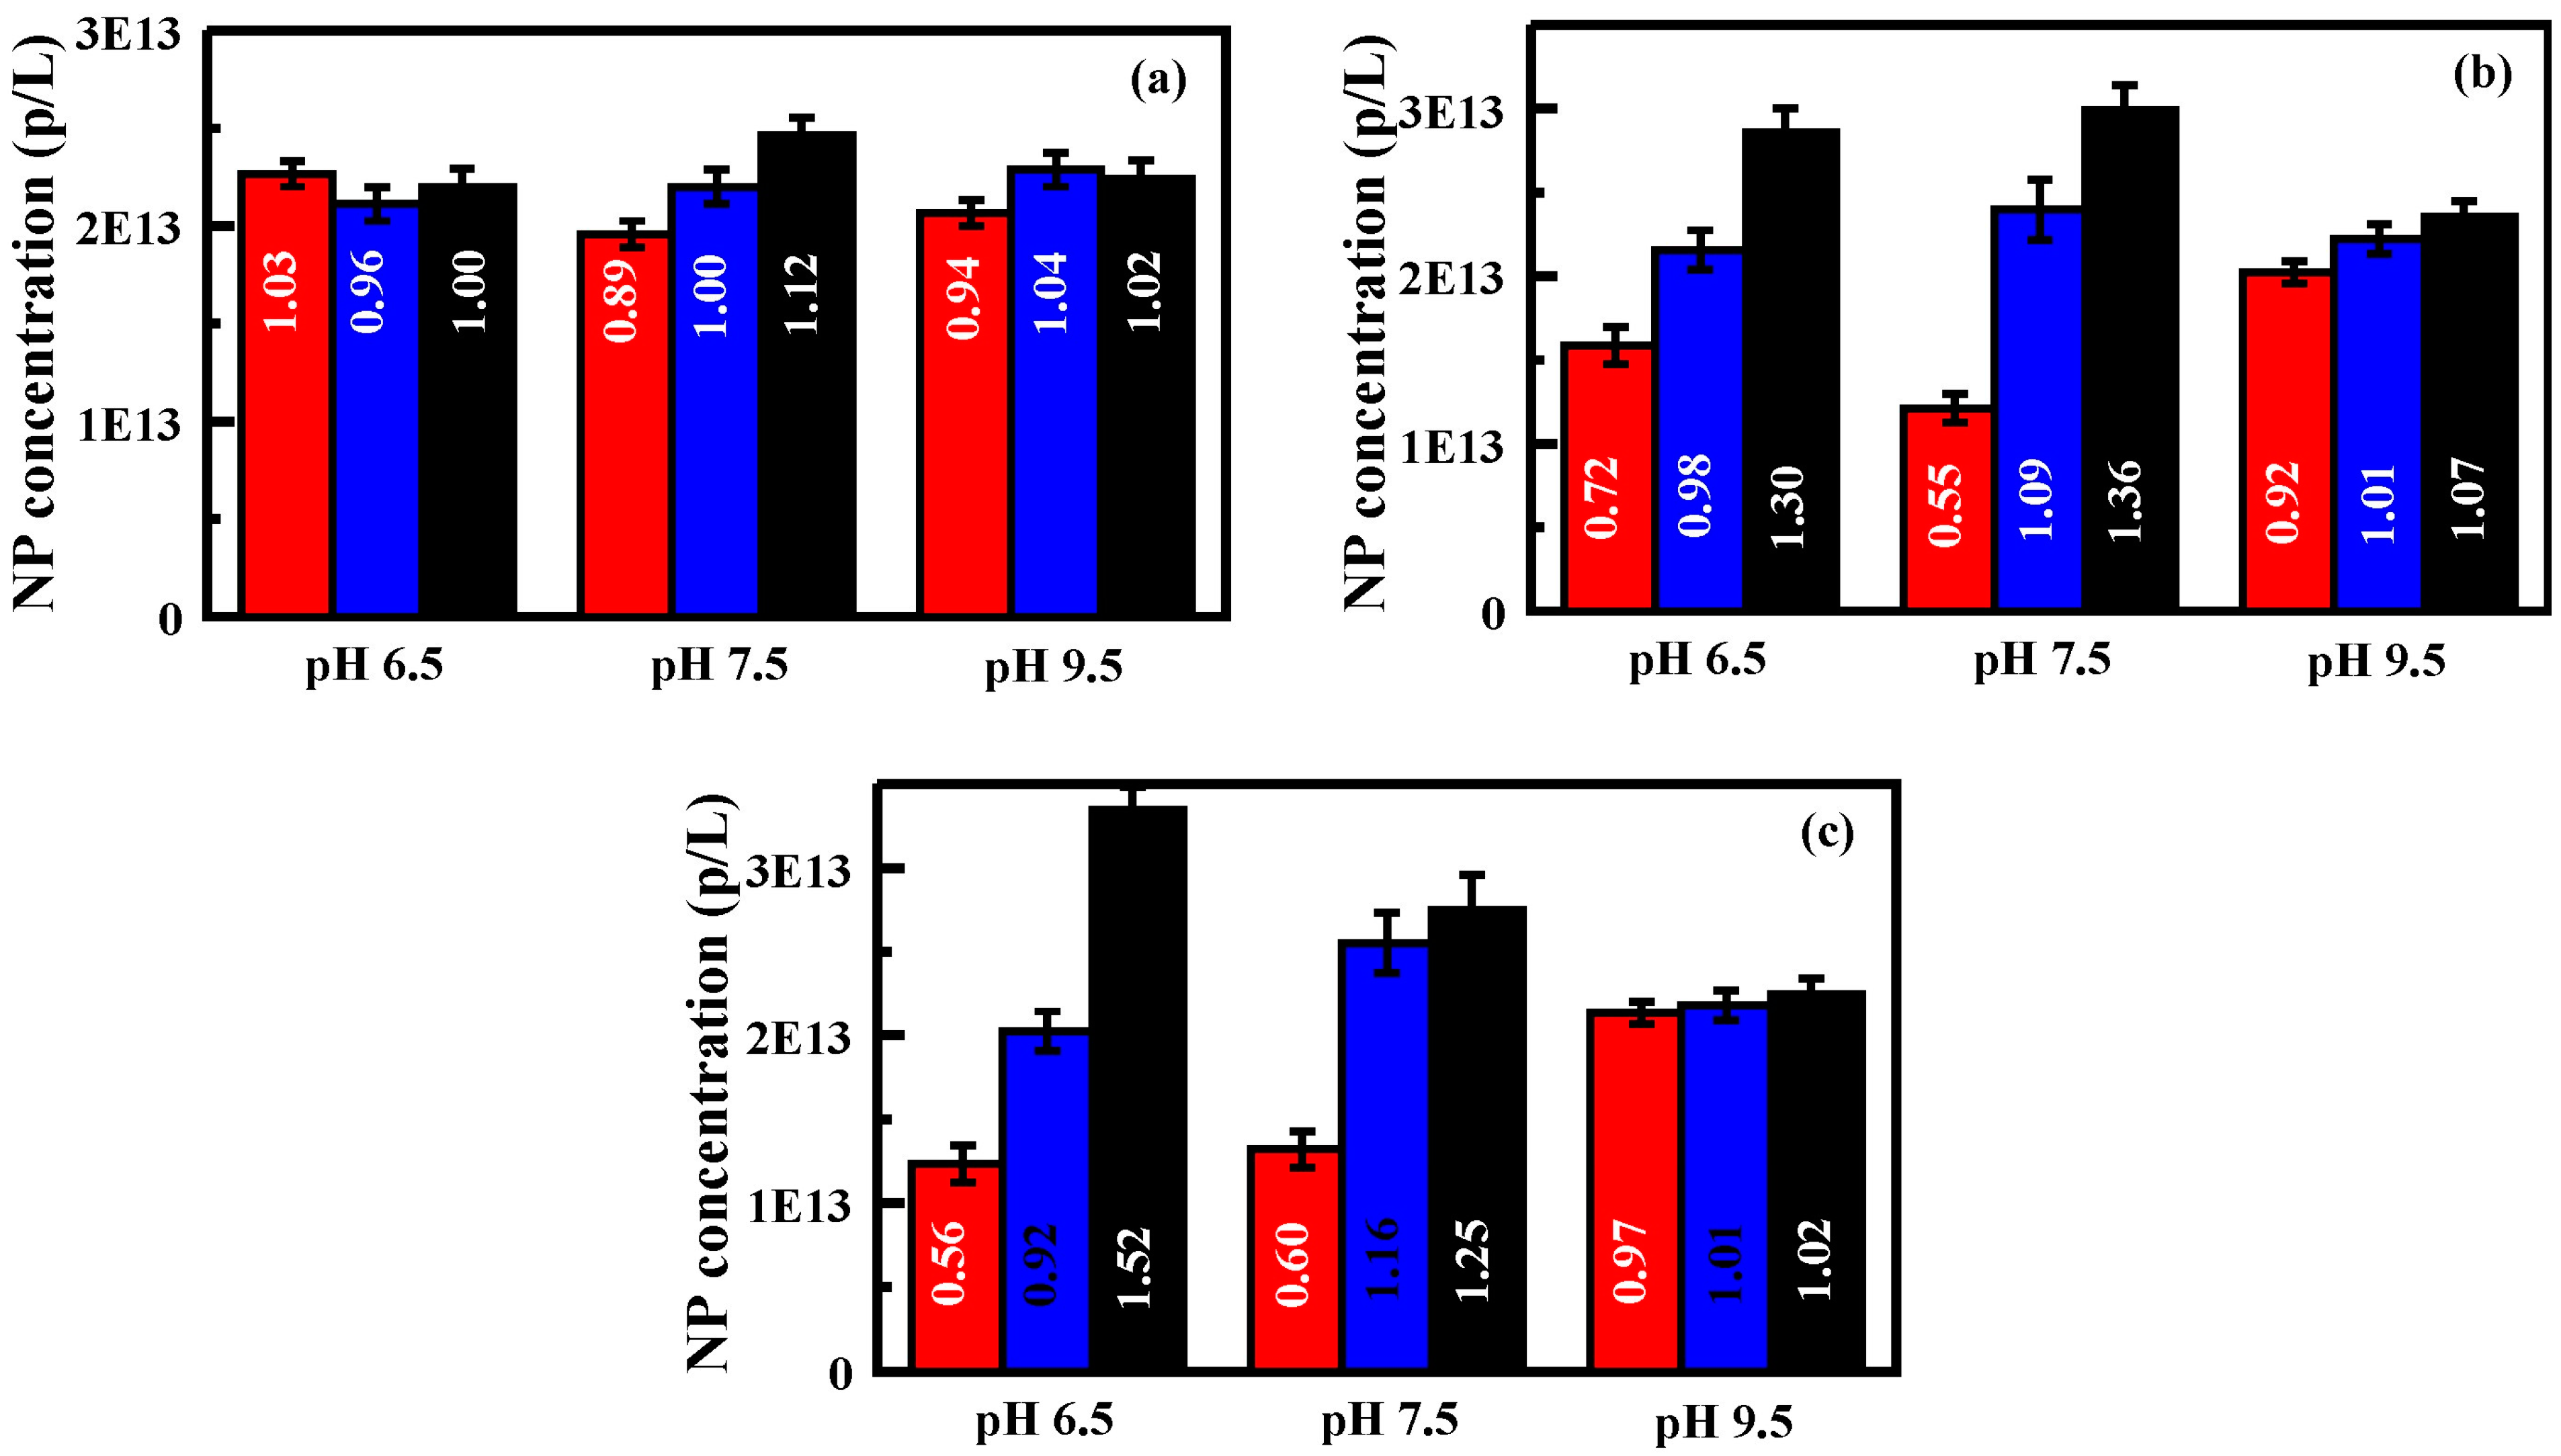
As with the Generation 1 devices, nanoparticle solutions of varied pH (6.5, 7.5, and 9.5) were evaluated. Though pH 6.5 will not provide fully protonated carboxyl groups on the nanoparticles, it should be sufficient to determine if the change in protonation has an impact. In addition, for the functionalized surfaces (amine and carboxyl groups), the protonation state of the surface groups will be expected to change across this pH range. Changing the pH of the nanoparticle solutions did not significantly impact the concentration distributions for the unfunctionalized wafers (
Figure 6,
Supplementary Information Table S5 and Figure S4). As shown in
Figure 6, however, solution pH did have an impact on concentration profiles across the CES and APS wafers. While the CES functionalized device and the nanoparticles both bear carboxylate groups, the difference in the environments of those groups will cause their pKa to vary. This is reflected by the changing concentration profiles as the pH of the solution is shifted (
Figure 6). At pHs 6.5 and 9.5, the surface and the nanoparticles are more likely to have similar charge; they behave more like the particles on the unfunctionalized surfaces. At pH 7.5, where the charge distributions are most likely to vary, some additional shifting of the concentration profile is observed (~12%). The APS device and the nanoparticles bear opposite charges. As pH is decreased, the nanoparticles become more neutral while the surface becomes more positively charged. Conversely, as the pH is increased, the surface becomes more neutral while the particles become more negatively charged. As shown in
Figure 6, the pH 6.5 nanoparticle solution resulted in the greatest difference in concentration across the exit ports. The far side outlet port (#3) had an 80% greater concentration of nanoparticles than that obtained for the inlet side (#1). For pH 7.5 this difference was 22%, and it was 14% for pH 9.5.
3.2. Other Considerations
In addition to surface functionalization and protonation state, two conditions were of interest here. First, the flow rate in the device was an acknowledged consideration based on the results with Generation 1 glass devices. Separations were strongly dependent on achieving slow, controlled flow. While flow rates below 0.20 mL/min tended to result in cessation of flow from one or more of the exit ports in the feature bearing devices, flow rates of as little as 0.17 mL/min were sufficient in the channel only devices. This is likely a result of the increased back pressure in the feature devices. Syringe and peristaltic pumps were found that could deliver flow rates in this range; however, both types of pump introduced pulsing, an undesirable characteristic for this type of separation. The data presented in
Figure 6 and the
Supplementary Information (Table S5 and Figure S4) provide several examples of the impact of flow rate. For the APS functionalized device, the concentration at the far side exit port (#3) was lower for experiments at 0.29 mL/min (ratio 1.24) as compared to those at 0.27 mL/min (ratio 1.30). Similarly, for the CES functionalized device at pH 6.5, the concentration at the far side exit port (#3) is lower for experiments at 0.28 mL/min (ratio 1.34) than for those at 0.26 mL/min (ratio 1.52).
The second consideration was related to particle concentration. The Generation 1 experiments utilized a concentration of 1.11 × 10
16 p/L. Experiments with Generation 2 devices focused on concentrations of 2.2 × 10
14 and 2.2 × 10
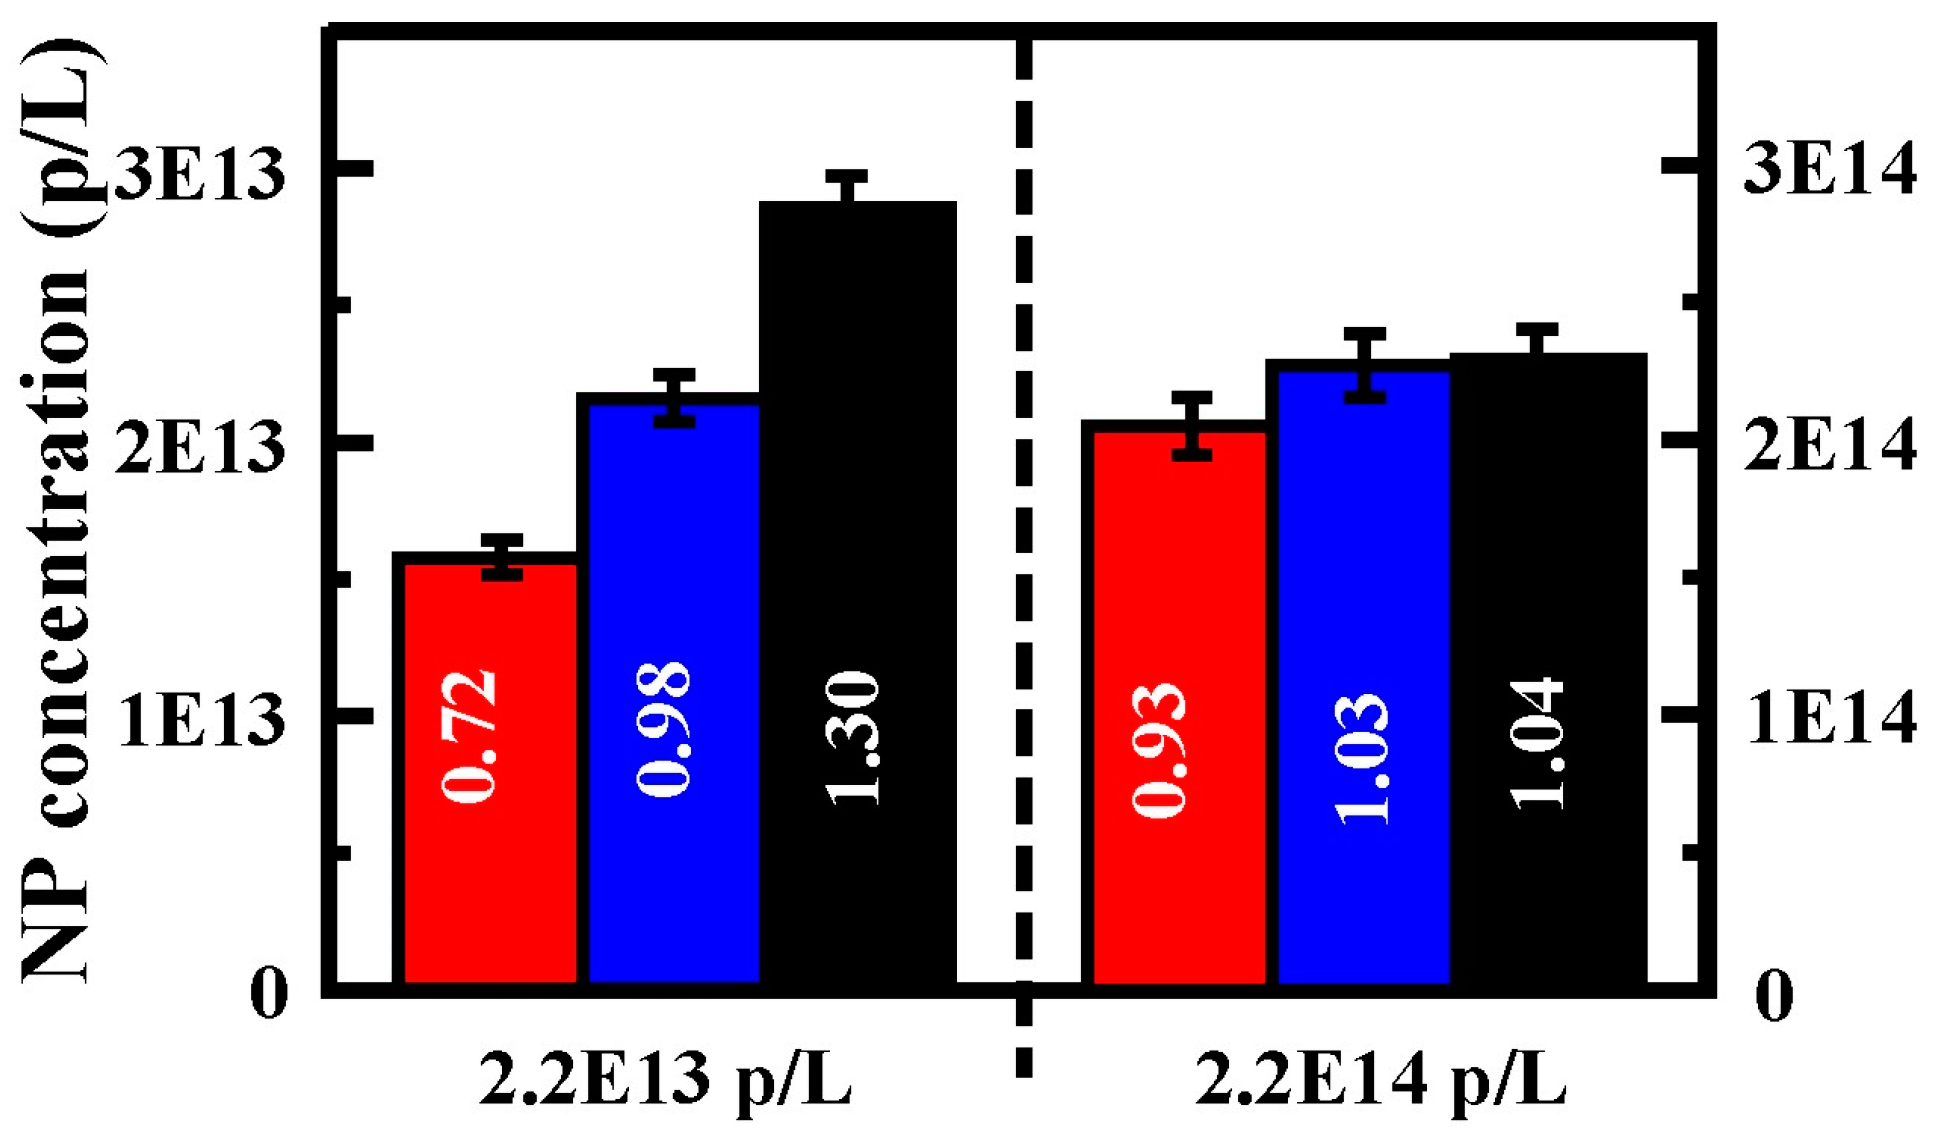
13 p/L. It was found that at lower concentrations of nanoparticles, the shift in the concentration profile was significantly enhanced. As an example (
Figure 7), when the nanoparticle concentration was increased by an order of magnitude in the APS functionalized device (pH 6.5), the concentration enhancement at the exit port drops from 1.30 to 1.04 (0.27 mL/min) (also refer to
Supplementary Information Tables S6 and S7). This may be related to the reduction in effectiveness of the surface interaction as a result of overcrowding within the devices; large populations of particles may flow through the device with no significant surface effect. A similar drop in enhancement (1.52 to 1.09; 0.26 mL/min) was noted for the CES functionalized device (pH 6.5).
Figure 6.
Generation 2 performance, pH. Here, solutions of nanoparticles at pH 6.5, 7.5, and 9.5 were evaluated: (
a) nanoparticle concentrations obtained for each exit port of an unfunctionalized Generation 2 device; (
b) nanoparticle concentrations obtained for each exit port of an APS functionalized (20 mM) Generation 2 device; and (
c) nanoparticle concentrations obtained for each exit port of a CES functionalized (20 mM) Generation 2 device. Bars are, from left to right, exit port on the inlet side, at the center, and furthest from the inlet side. Nanoparticle solutions utilized for these experiments were 2.2 × 10
13 p/L. Flow rates are 0.25 to 0.27 mL/min. Data presented is the average of three replicates. Additional results provided in the
Supplementary Information, Table S5 and Figure S4.
Figure 7.
Nanoparticle concentration, Generation 2. Here, concentrations for the three exit ports are compared in experiments that were identical with the exception of nanoparticle concentration. This data is for an APS functionalized Generation 2 device with the solution at pH 6.5. Additional data at 2.2 × 10
14 p/L is provided in the
Supplementary Information Tables S6 and S7.
4. Conclusions
This initial study examined the potential for utilization of surface-target interaction to impact the spatial distribution of particles flowing through a physical separation device. While the device incorporated feature shapes designed for Boltzmann type separation conditions, it was operated under conditions that should not allow for a significant contribution from that process. The arrangement of the features in the field should not promote any fluid dynamics flow effects. Experiments focused on understanding the impact of the devices on the flow of single component solutions rather than on more complex mixtures. Nevertheless, simply altering the surface-target interactions of the device resulted in a measurable and reproducible difference in the spatial concentration distribution for nanoparticles over a specific range of flow rates. The results should hold for single or multicomponent mixtures where the surface interactions of the mixed components are unique. While the changes noted for the current devices are modest, the results clearly demonstrate the potential of this contribution. The large surface area to volume ratio provided by these devices offers potential for significant surface effects and can lead to induced surface diffusion and locally high concentrations of targets. It can be imagined that combinations of spatial considerations and surface interactions generated with greater control could result in novel separation outcomes. Continuing research seeks to investigate the impact of surface modifications at lower flow rates, under which the Boltzmann separation effect should be more significant, providing insight into how these behaviors may enhance or interfere with that process.
Publications discussing the of application of ratchet based separation techniques cover a broad range of topics, including DNA [
21] and protein [
22] sorting, nanoparticle preconcentration [
7], and separation of leukocytes from cancer cells [
23]. Discussion of technique scalability is, however, rare. The majority of these studies focus on microfluidic devices, strictly limiting throughput. The approach is suitable for analytical separations, but impractical for preparative or industrial scale uses. Indeed, many of the described studies face limits on the ability to generate materials at larger scales. Nano-patterned materials, for example, have feature sizes small enough to require non-photolithographic technologies [
24]. The surface-target interactions illustrated in the study presented here will be of importance as advancements are made in these areas. These characteristics could be used to advantage or may work to the detriment of emerging separation approaches.
Acknowledgments
The participation of C. Sun and C. Scoggins in this effort was supported by the US Navy Science and Engineering Apprenticeship Program (SEAP). We have applied the SDC approach (“sequence-determines-credit”) for determining the sequence of authors [
25].This research was sponsored by the U.S. Office of Naval Research through Naval Research Laboratory base funds (69-9660). The views expressed here are those of the authors and do not represent those of the U.S. Navy, the U.S. Department of Defense, or the U.S. Government.
Author Contributions
Anthony P. Malanoski and Brandy J. Johnson were responsible for experimental design and manuscript assembly. Anthony P. Malanoski was responsible for theoretical considerations. Brandy J. Johnson, Carrie K. Sun, and Connie S. Scoggins were responsible for execution of experiments and data analysis. Jason E. Bongard and Martin H. Moore were responsible for surface chemistry. Jeffrey S. Erickson and Mansoor Nasir were responsible for device fabrication and characterization.
Conflicts of Interest
The authors declare no conflict of interest.
References
- Bernate, J.A.; Drazer, G. Stochastic and Deterministic Vector Chromatography of Suspended Particles in One-Dimensional Periodic Potentials. Phys. Rev. Lett. 2012, 108. [Google Scholar] [CrossRef]
- Kutter, J.P. Liquid phase chromatography on microchips. J. Chromatogr. A 2012, 1221, 72–82. [Google Scholar] [CrossRef] [PubMed]
- Bernate, J.A.; Liu, C.; Lagae, L.; Konstantopoulos, K.; Drazer, G. Vector separation of particles and cells using an array of slanted open cavities dagger. Lab Chip 2013, 13, 1086–1092. [Google Scholar] [CrossRef] [PubMed]
- Culbertson, C.T.; Mickleburgh, T.G.; Stewart-James, S.A.; Sellens, K.A.; Pressnall, M. Micro Total Analysis Systems: Fundamental Advances and Biological Applications. Anal. Chem. 2014, 86, 95–118. [Google Scholar] [CrossRef] [PubMed]
- Huang, L.R.; Cox, E.C.; Austin, R.H.; Sturm, J.C. Continuous particle separation through deterministic lateral displacement. Science 2004, 304, 987–990. [Google Scholar] [CrossRef] [PubMed]
- Inglis, D.W.; Davis, J.A.; Austin, R.H.; Sturm, J.C. Critical particle size for fractionation by deterministic lateral displacement. Lab Chip 2006, 6, 655–658. [Google Scholar] [CrossRef] [PubMed]
- Mitra, A.; Ignatovich, F.; Novotny, L. Nanofluidic preconcentration and detection of nanoparticles. J. Appl. Phys. 2012, 112. [Google Scholar] [CrossRef]
- Cabodi, M.; Chen, Y.F.; Turner, S.W.P.; Craighead, H.G.; Austin, R.H. Continuous separation of biomolecules by the laterally asymmetric diffusion array with out-of-plane sample injection. Electrophoresis 2002, 23, 3496–3503. [Google Scholar] [CrossRef]
- Huang, L.R.; Cox, E.C.; Austin, R.H.; Sturm, J.C. Tilted Brownian ratchet for DNA analysis. Anal. Chem. 2003, 75, 6963–6967. [Google Scholar] [CrossRef] [PubMed]
- van Oudenaarden, A.; Boxer, S.G. Brownian ratchets: Molecular separations in lipid bilayers supported on patterned arrays. Science 1999, 285, 1046–1048. [Google Scholar] [CrossRef] [PubMed]
- Reimann, P.; Hanggi, P. Introduction to the physics of Brownian motors. Appl. Phys. A 2002, 75, 169–178. [Google Scholar] [CrossRef]
- Parrondo, J.M.R.; de Cisneros, B.J. Energetics of Brownian motors: A review. Appl. Phys. A 2002, 75, 179–191. [Google Scholar] [CrossRef]
- Burada, P.S.; Schmid, G.; Reguera, D.; Rubi, J.M.; Hänggi, P. Biased diffusion in confined media: Test of the Fick-Jacobs approximation and validity criteria. Phys. Rev. E 2007, 75. [Google Scholar] [CrossRef]
- Derenyi, I.; Astumian, R.D. ac separation of particles by biased Brownian motion in a two-dimensional sieve. Phys. Rev. E 1998, 58. [Google Scholar] [CrossRef]
- Grimm, A.; Stark, H.; van der Maarel, J.R.C. Model for a Brownian ratchet with improved characteristics for particle separation. Phys. Rev. E 2009, 79. [Google Scholar] [CrossRef]
- Keller, C.; Marquardt, F.; Bruder, C. Separation quality of a geometric ratchet. Phys. Rev. E 2002, 65. [Google Scholar] [CrossRef]
- Savel'ev, S.; Misko, V.; Marchesoni, F.; Nori, F. Separating particles according to their physical properties: Transverse drift of underdamped and overdamped interacting particles diffusing through two-dimensional ratchets. Phys. Rev. B 2005, 71. [Google Scholar] [CrossRef]
- Sengupta, S.; Guantes, R.; Miret-Artes, S.; Hanggi, P. Controlling directed transport in two-dimensional periodic structures under crossed electric fields. Phys. A: Stat. Mech. Appl. 2004, 338, 406–416. [Google Scholar] [CrossRef]
- Faucheux, L.P.; Bourdieu, L.S.; Kaplan, P.D.; Libchaber, A.J. Optical Thermal Ratchet. Phys. Rev. Lett. 1995, 74. [Google Scholar] [CrossRef]
- Duke, T.A.J.; Austin, R.H. Microfabricated sieve for the continuous sorting of macromolecules. Phys. Rev. Lett. 1998, 80. [Google Scholar] [CrossRef]
- Thomas, J.D.P.; Joswiak, M.N.; Olson, D.W.; Park, S.-G.; Dorfman, K.D. Ratchet nanofiltration of DNA. Lab Chip 2013, 13, 3741–3746. [Google Scholar] [CrossRef] [PubMed]
- Cheetham, M.R.; Bramble, J.P.; McMillan, D.G.G.; Bushby, R.J.; Olmsted, P.D.; Jeuken, L.J.C.; Evans, S.D. Manipulation and sorting of membrane proteins using patterned diffusion-aided ratchets with AC fields in supported lipid bilayers. Soft Matter 2012, 8, 5459–5465. [Google Scholar] [CrossRef]
- Lin, B.K.; McFaul, S.M.; Jin, C.; Black, P.C.; Ma, H. Highly selective biomechanical separation of cancer cells from leukocytes using microfluidic ratchets and hydrodynamic concentrator. Biomicrofluidics 2013, 7. [Google Scholar] [CrossRef] [PubMed]
- Eijkel, J.C.T.; van den Berg, A. The promise of nanotechnology for separation devices—From a top-down approach to nature-inspired separation devices. Electrophoresis 2006, 27, 677–685. [Google Scholar] [CrossRef] [PubMed]
- Tscharntke, T.; Hochberg, M.E.; Rand, T.A.; Resh, V.H.; Krauss, J. Author Sequence and Credit for Contributions in Multiauthored Publications. PLoS Biol 2007, 5. [Google Scholar] [CrossRef] [PubMed]
© 2015 by the authors; licensee MDPI, Basel, Switzerland. This article is an open access article distributed under the terms and conditions of the Creative Commons Attribution license (http://creativecommons.org/licenses/by/4.0/).


 ,
, 