A Perspective on Recent Advances in Piezoelectric Chemical Sensors for Environmental Monitoring and Foodstuffs Analysis


1
Department of Ecology and Chemical Technology, Voronezh State University of Engineering Technologies, Revolution Avenue 19, Voronezh 394000, Russia
2
Department of Chemical Science and Technologies, University “Tor Vergata”, via della Ricercha Scientifica 1, 00133 Rome, Italy
*
Author to whom correspondence should be addressed.
Chemosensors 2019, 7(3), 39; https://doi.org/10.3390/chemosensors7030039
Submission received: 12 June 2019
/
Revised: 8 August 2019
/
Accepted: 19 August 2019
/
Published: 26 August 2019
(This article belongs to the Special Issue Chemical Sensors for Heavy Metals/Toxin Detection)
Abstract
:This paper provides a selection of the last two decades publications on the development and application of chemical sensors based on piezoelectric quartz resonators for a wide range of analytical tasks. Most of the attention is devoted to an analysis of gas and liquid media and to industrial processes controls utilizing single quartz crystal microbalance (QCM) sensors, bulk acoustic wave (BAW) sensors, and their arrays in e-nose systems. The unique opportunity to estimate several heavy metals in natural and wastewater samples from the output of a QCM sensor array highly sensitive to changes in metal ion activity in water vapor is shown. The high potential of QCM multisensor systems for fast and cost-effective water contamination assessments “in situ” without sample pretreatment is demonstrated.
1. Introduction
Chemical sensors represent one of the most significant tools of analytical chemistry. Relatively simple in preparation and application and inexpensive, these devices allow for the identification and determination of substances in their gaseous and liquid phases and may function in automatic and remote modes while being implemented in various technological processes. Moreover, they have found wide applications in medicine, agriculture, and environmental monitoring [1,2].
It is hard to overestimate the worldwide popularity of research devoted to the development and application of different types of sensors. Recently, the design and application of sensors have evolved into an independent branch of technology and measuring equipment. The growth of automation and the development of smart sensor and intelligent domotics concepts have increased the requirements imposed on modern sensors and detectors. In particular, special attention is given to sensors’ mechanical robustness, chemical inertness, parameter independence on external conditions (positioning in space, temperature, and pressure), selectivity, sensitivity, possibility of automation, size, and cost. Previously, several comprehensive books and reviews on chemical sensors and sensor array principles and applications were published [3,4,5,6,7,8,9,10,11,12,13]. Nowadays, oscillatory-based sensory systems cover a significant part of the total number of sensors employed [1,14,15,16,17]. Among them, sensing systems with lumped parameters (rigid bodies) or systems with distributed (continuous) parameters can be distinguished (Figure 1).
2. Piezoelectric Sensors Based on Gravimetric Resonant Devices
2.1. Design and Operation Principle
Gravimetric or mass-sensitive devices transform the mass change at a specially modified surface into a change of a property of the support material. The mass change is caused by accumulation of the analyte. The piezoelectric effect lies in the principle of such a device response. This effect consists of the generation of electric dipoles inside certain elastic anisotropic crystals when subjected to mechanical stress. Piezoelectrically excited bulk acoustic wave (BAW) resonators, quartz crystal microbalances with control of energy dissipation (QCM-D), and surface acoustic wave (SAW) resonators are still the most widely used in analytical practice [15,16,17,22,23]. A flexural plate wave (FPW) and a shear horizontal acoustic plate mode (SH-APM) have also been employed in chemical sensor development [19,21]. The beginning of the current century was characterized by a new direction in instrument-making, micro- and nanoelectromechanical systems development, MEMS, and NEMS [16,20,24,25,26,27]. Moreover, a new microgravimetry instrument, an electrochemical quartz crystal, has been demonstrated to be particularly promising for studying the viscoelastic properties of redox-active thin films and conductive polymers [28].
A typical example of a BAW device is the thickness shear mode (TSM) resonator, which is also widely referred to as a quartz crystal microbalance (QCM). A QCM is generally made of a thin disk of quartz crystal fixed between two circular metallic (most often golden) electrodes with fundamental frequencies between 5 and 50 MHz (Figure 2A). When an electric field is applied between the electrodes, the crystal is mechanically deformed and oscillates with a fundamental frequency. As the electrodes are attached to either side of the crystal, the wave produced travels though the bulk of the material, as illustrated in Figure 2B. There are different cuts of quartz crystals, which permits varied desired wave propagation features: among them, the AT-cut (35°15′ inclination in the y–z plane) is the most widely used.
Any layer added to the quartz crystal, which does not dampen the oscillation, can be treated as added thickness, causing a change in frequency. Even a tiny mass change of the sensor causes a measurable frequency shift. For a standard sensor, a 1-Hz change can relate to a 1-ng mass change. If soft polymers are used to coat the electrode, it is possible for them to have viscoelastic coupling to the acoustic wave: in these circumstances, the frequency shift cannot be entirely due to mass change. The QCM mass sensitivity can be expressed by the Sauerbrey equation [29]:
where Δf is the change in frequency of the quartz crystal in Hz; f0 is the fundamental frequency of the quartz crystal (Hz); Δm is the mass change of material deposited or sorbed onto the crystal in g; A is the area between electrodes in cm2; ρq is the density of quartz; μq is the shear modulus of quartz for an AT-cut crystal; and νq is the transverse wave velocity in quartz in m/s.
In SAW devices, comb-shaped interdigital metallic transducers (IDTs) are patterned over the piezoelectric material by a photolithographic or other process. When an alternate current is applied to IDTs, the surface acoustic waves are propagated and guided along the surface of an elastic layer, with most of the energy density confined to a depth of about one wavelength below the surface. The selection of a different piezoelectric material and appropriate crystal cut results in a shear horizontal acoustic wave in shear horizontal acoustic plate mode sensor (SH-APM) resonators. In quartz crystal microbalances with energy dissipation control (QCM-D) devices, simultaneous measurements in resonance frequency (ΔF) and energy dissipation (ΔD) changes are performed. For this purpose, the driving power applied to the sensor crystal is switched off periodically, and the decay of damped oscillation is recorded as the result of an analyte adsorption or other structural changes [30]. In this way, a QCM-D resonator may provide structural information on the viscoelastic properties of liquids and adsorbed films and can be employed for coating property characterization.
Among those mentioned above, each type of resonator has a number of advantages and limitations. For the manufacture of chemical sensors, transducers based on BAW–piezo resonators remain the most popular. Moreover, in the past years, there has been a tendency to substitute the individual selective piezo-microbalances with multisensor systems based on various sensing elements. Nowadays the number of publications devoted to application of such devices in traditional areas of analysis (mainly for food systems), but also for less studied earlier objects in environmental monitoring, biological tests, technological processes, studying biological and other reactions at the molecular level is expanding.
2.2. Piezosensors Optimization Strategies
To obtain a chemical sensor from a piezoelectric resonator (as an oscillatory system), it is necessary to modify resonator electrodes through specific reagents that are capable of altering their properties (in particular, mass) due to selective reactions with detectable components (ions, molecules, their fragments or clusters) in the analyzed environment. In order to properly develop a new analytical method, the following three factors should be considered: (i) proven theoretical backgrounds, including a description of the operation principles and prediction of system properties when externally exposed; (ii) a well-established method of measuring device and gadget manufacturing; and (iii) prompt practical solutions and analysis techniques. Despite initial interest, new mathematical models describing the functioning of piezoelectric masses with different coatings on electrodes have not received further development, even if the significant modifications may occur inside coatings as far as inside analyzed gaseous or liquid objects during the sensing event. This can be associated with the displacement of traditional transducers with thin-film acoustic sensors and with the sufficient versatility of the Sauerbrey model [29], when the resonators are loaded with thin films and when analytes are detected in dilute solutions. On the contrary, new approaches that enhance the useful response of piezoelectric balances and increase their resolution by modifying film coatings on a quartz plate or electrodes with gold nanoparticles [31], chitosan [32], or particles with magnetic properties [33] through the formation of biomimetic silica, peptide silaffin (silaffin peptides) [34], Teflon [18], or other polymers, etc., have been actively developed recently. In addition, there have been some studies on the properties of piezoelectric balance (quartz plate) resonant systems, which oscillate near resonant base frequencies and thus increase microweighing effectiveness [35], as well as publications on the development of effective electrical excitation circuits for quartz plates within the scope of improving their resolution [36].
Previously, Mindlin’s model was proposed in order to consider the heterogeneity of the junction in between the crystal plate and the coating layer (film) [37]: new methods of electrophysical and circuit design of electroacoustic transducers based on a single piezoelement were developed [38]. Besides, the search for new materials for manufacturing nanomechanical resonators is in continuous progress. In particular, a defect-free Au single-crystal nanowire (NWS) with resonant frequencies of 33–119 MHz has been shown to be a very promising material due to the almost absent energy scattering in the defect-free crystalline medium of the nanomaterial [39]. Other materials have been previously reported for piezoresonator development, among them lithium substrates such as lithium niobate (LiNbO3) and lithium tantalate (LiTaO3), aluminum nitride (AlN), and langasite (La3Ga5SiO14) [15,22,23,40].
2.3. Coating Selection
A distinctive feature of selective mass-sensitive resonators (piezosensors) is the presence of a sorption coating characterized by differently pronounced selectivity with respect to the sorption—desorption of components from the near-electrode space (Figure 2A). At present, various phases, materials, native concentrates (extracts from natural objects and their solutions), polymer films, nanostructures, etc., are used to modify the resonators. The most commonly employed coatings are stationary chromatographic phases, from nonpolar (squalene, bee wax) to highly polar (polyethylene glycols and their esters) and specific ones (chemisorption coatings, dyes, polymer matrices, and polymers with DNA) [1]. Recently, plenty of new composite materials have been reported, among them SnO2/CuO-based coatings for hydrogen sulfide vapor detection [41]; NiCl2 and AgCl films deposited on nickel and silver electrodes of piezoquartz plates for ammonia detection [42]; nanoporous TiO2 fibers functionalized with polyethylene diamine for formaldehyde vapors analysis [43]; titanate sol–gel layers imprinted with carbonic acids for highly sensitive detection of C2–C4 alcohols and C6–C10 hydrocarbons of normal and isomeric structures [44]; porphyrins and their derivatives [45,46,47,48]; ZnO nanoparticles modified with chiral porphyrin derivatives for enantiomer vapor recognition [49]; copolymers of porphyrin-substituted polypyrrole and carboxylated single-wall carbon nanotubes (SWCNTs) for volatile organic compounds (VOCs), n-butanol, in particular [50].
Molecularly imprinted polymers (MIP) are widely used to determine the variety of biomolecules [51,52,53]. Thus, polymeric films impregnated with birch and nettle pollen have been developed for the detection of allergens in the air [54]. The use of self-assembling glucosamine monolayers as biomimetic receptors for influenza viruses and other biomolecules has been reported in [55]. MIP-based QCM sensors were developed for the detection of low- and high-density lipoproteins (LDLs and HDLs) and were satisfactorily tested in human serum [56,57].
Thin films of polyaniline and emeraldine have been employed for assessments of the primary aliphatic alcohols methanol, ethanol, 2-propanol, and 1-propanol [58]; formic acid [59]; and amine vapors [60]. In the last case, the sensor’s selectivity was based on differences in the values of diffusion coefficients and the kinetics of vapor adsorption of various amines. A sensor for methane with a detection limit of 0.15 vol % on the basis of supramolecular kriptophan A synthesized from vanillin alcohol was developed in Reference [61]. Sensitive film coatings made of fulvic acids isolated from humus [62], Langmuir–Blodgett calix [4] resorcinarene [63], and doped and nondoped multilayer carbon nanotubes (CNTs) [64] have been reported for toluene and several other VOCs detection (among them: benzene, acetone, ethanol hexane, cumene, ethylbenzene, ethyl acetate, ethanol). Despite the diversity of materials and approaches for the formation of sensitive coatings on the electrodes of the piezoelectric element, the reproducibility of coating properties determines the main performance characteristics of piezoquartz microbalances, and depending on the nature of the sensitive coating, the time of stable operation (“lifetime”) of sensors varies from several days to a year. At the same time, in many cases, special attention is paid to the “training” of sensors before use and the exposure to pairs of high-concentration test compounds to form a stable structure. However, obtaining commercial sensors for long-term operation remains a challenging task in modern sensorics.
3. Single Piezosensor Applications
High mass sensitivity and fast response times in a piezoelectric resonator allow for active applications of piezoquartz microweighing in different fields [1]. Thus, a lot of attention is devoted to the selective detection of several species in air, among them carbon and nitrogen oxides [65], formaldehyde, ammonia [58,66], VOC–arenes [52,58,62], alcohols, ketones [50,58,66], amines [67,68], pesticides [69,70], short-chain aliphatic acids [59,71], etc. Moreover, often it is important to detect these compounds in a sample separately, since most of them belong to marker substances for assessing either environmental safety (nitrogen oxides, formaldehyde, arenas, pesticides) or the state of living objects (alcohols, ketones, amines, ammonia, acids (for all types of bioassays and food systems).
Atmospheric monitoring comprises not only the determination of hazardous and toxic compounds, but also the estimation of the size and the concentration of aerosol particles. For this purpose, in Reference [72], QCM sensors were employed to measure hourly and daily variations in the size and concentration of aerosol particles in the surface zone of semiarid rural places in India with low relative humidity (less than 75%). The use of a miniaturized measuring device with a fast response time allowed for obtaining valuable results for modeling the state and evolution processes of aerosols. In Reference [73], QCM sensors were employed for the direct measurement of stearic acid and homolog film mass changes during their dissolution process upon contact with solutions of anionic and non-ionic detergents. The use of QCMs made it possible to isolate and quantitatively characterize a series of successive stages (the adsorption and absorption of water and detergents on the film surface): a relationship was established between the film removal time and the detergent concentration in the solution [73]. In Reference [74], an atrazine sensor based on a QCM with a molecularly imprinted film of titanium dioxide was developed.
Piezoquartz microbalances are still an indispensable tool to study thin polymer layer behavior, in particular the changes in their mechanical and viscoelastic properties in comparison to bulk samples [75], and to investigate adsorption processes kinetics, for instance in the case of polyvinyl imidazole adsorption on a copper electrode [76]. The use of piezoresonators based on high-frequency quartz plates (more than 10–15 MHz) with a single-sided coating is recommended as a universal tool for determining the dry residue in natural and drinking water, food, fuel, etc.
4. Arrays of Piezosensors as Measuring Elements of Multicomponent Detectors
In the last two decades, artificial sensing systems (e-nose and e-tongue) have been actively used to solve a wide range of tasks in order to obtain information on the integral characteristics of multicomponent samples [9,10,77]. Among the most common applications of e-nose are the analysis of light and medium volatile odor fractions of various food products for quality assessment [78,79], safety assessments of plastics and building materials [80,81], quality monitoring of motor oils and diesel fuels [44,82], medical diagnostics [45,46,47,48,83], and environmental monitoring [5,12,42].
4.1. Foodstuffs Analysis
Research on the use of chemical sensors for food analysis is actively developing. This is proven by the nine-fold increase in publications over the past 15 years (Figure 3) and the emergence of new research directions. Sensors have been employed in foodstuffs analyses both in single mode or inside e-nose and e-tongue systems, which in turn were configured to detect trace amounts of specific markers and predict the state of tested objects after prior training on test compounds. An analysis of publications shows that the choice of specific markers of the state of various systems obeys the following principle: normal (native state of systems) → possible destructive processes (damage, microorganism activity) → products of these processes (specific, often gaseous markers). An application of e-nose systems for foodstuffs became a very attractive technique due to the analysis simplicity, the minimal sample preparation required, and the proximity of the approach in odor assessments to organoleptic testing (Figure 4).
Among the most common applications of e-nose systems is the continuous control of technological processes. For instance, in Reference [84], an array of a small number of piezosensors (six elements with MIP coatings) was employed to establish the characteristics of the composts obtained from grass and pine. The possibility of detecting a large number of alcohols and terpenes was shown, and the possibility of industrial monitoring of such processes using artificial sensing systems was highly appreciated. Among other applications of e-nose systems are the optimization of grape drying times in the production of sweet wines [85], the prediction of Fuji apple storage time [86], aroma studies of white pepper with various genotypes [87], vinegar component identification [88], flavor control of chocolate products [89], ethanol concentration evaluations in Chinese spirits [90], fuel quality assessments based on an evaluation of oxidation product accumulation [44], food allergens detection [78,91], etc.
A great number of publications have been devoted to the development of industrial measuring metal oxide sensor-based systems for product identification and freshness control. Furthermore, chemometric methods of data processing are widely used to increase analysis informativeness and offer various approaches to sample preparation before analysis [10]. The integration of different types of sensors into an array and its subsequent alliance with gas chromatography may solve the task with a reliable determination of the content of volatile compounds that in part form an odor. Consequently, the results of studies have coincided with the results of arbitration methods and panelist tasting. Thus, the reliability of the results and the informativeness of the e-nose systems have been proven by traditional organoleptic assessments of products such as beer [92], oysters [93], shrimp [94], vinegar [88], and milk [95]. According to the results, organoleptic evaluation and e-nose systems showed high correlations in the sample rankings, additionally allowing for the identification of the substances responsible for sample differentiation [92].
Additional properties may be acquired by the combination of mass-sensitive QCM-based e-noses with other techniques, in particular mass spectrometry [92]; microbiological analysis [93]; standard physicochemical quality indicators [95]; and gas chromatography combined with mass spectrometry (GC/MS) for the classification of rice wine, vinegar [88], VOCs [83,96], and various terpenes of basil and mint leaves [74]. Chemometric methods are widely used to process data from arrays of measuring elements: the most common techniques employed are principal component analysis (PCA), cluster analysis, linear discriminant analysis (LDA), various regression methods, and artificial neural networks (ANNs) [9,10].
4.2. Environmental Monitoring
An application of chemical sensors and sensor arrays is one of the most promising opportunities to carry out inexpensive and real-time environmental monitoring [1,5,6,9,10]. Previously, several research works have been conducted on the application of piezoelectric sensors in assessments of natural and wastewater pollutants for quality control of the construction and finishing materials. Thus, using selective piezobalance sensors, the possibility of detecting profenofos in the concentration ranged from 10−8 to 10−5 mg/L [51], and atrazine with a detection limit of 0.1 μg [74] in wastewater was shown. The quantitative and kinetic parameters of the sorption of volatile compounds evaporating from the surface of self-adhesive film, construction putty, and polymer plates were established with BAW microbalances in References [44,80]. A test method has been developed for evaluating the “background” of building materials in indoor air using signals from piezosensors in a matrix [80,81]. The developed approach has been applied to study the destruction of biodegradable polymer films and to find the optimal formulation. In Table 1, the applications of single piezosensors and multisensory systems employed for environmental monitoring and foodstuffs analysis are summarized.
Below, a case study devoted to the recent application of a multiselective QCM array for the assessment of wastewater quality is discussed in detail in order to illustrate the ability of such a multisensor system (based on piezosensors) to address real-world analytical tasks.
4.3. Case Study: QCM E-Nose for Wastewater Quality Assessment
Tests were performed on 15 wastewater samples provided by the Quality Control Laboratory of the LCEC (Lipetsk City Energy Company) and were analyzed with a gas analyzer MAG-8 comprised of six multiselective piezosensors. The sensors were modified by nanomaterials of various natures and coating weights, thus resulting in the additional selectivity of analyte sorption from the air environment above the wastewater solutions (Table 2). The statistically processed responses of the MAG-8 device in the analyzed samples are presented in Table 3. These responses were correlated to wastewater indicators obtained via standard methods (more than 40 controlled indicators), and some of them are listed in Table 4.
The main task of the experiment was to establish the possibility of wastewater sample assessment with a piezoelectric MAG-8 e-nose as well as the correlation of the e-nose response with water quality indicators determined by standard methods. A principal component analysis (PCA) was employed in order to compare the data obtained by the gas analyzer (Table 3) to the results obtained through the standard methods and Table 4 and to find out the correlation between these two datasets. The PCA method provides the identification of tested samples without prior training and model building. For the PCA analysis, wastewater samples were chosen as specimens, and e-nose output data containing qualitative (sorption effectiveness parameters [97], Aij) and quantitative (analytical sensors signal, ΔFi; visual prints area, Si) information were selected as variables. All data were autoscaled in order to reduce the impact of individual variables on the modeling results.
It was established that the use of three principal components described 90% of the data: the most important were the first two principal components, representing (respectively) 36% and 24% of the overall system variance, as seen in Figure 5. On the scores chart (Figure 5A), two separate sample groups can be distinguished: the first one was formed by samples #04, #05, and #51, which were the most different from the rest of the analyzed samples; while samples #47, #02, and #41, the classification of which was virtually not influenced by the selected variables, constituted the second group. When comparing scores and loadings charts (Figure 5), it was established that the quantitative output data—mainly the “visual fingerprints” areas—had the greatest impact on the identification of samples #04, #05, and #51. The output data for the first sensor had the greatest impact on the discrimination of samples #39, #40. #42, and #49, and this result indicated the presence of volatiles (organic trace impurities containing oxygen) with a high affinity to the oxidized MWCNT coating of Sensor 1.
From the loadings chart (Figure 5B), it can be seen that the qualitative parameters (Aij) for Sensor 1, Sensor 2, and Sensor 6 were grouped separately, which indicates the significant influence of these sensors on sample classification. This fact can be explained by the active sorption of O- and N-containing compounds and water vapors on sensors with polar MWCNTs of various weights and zirconium(IV) oxynitrate coatings.
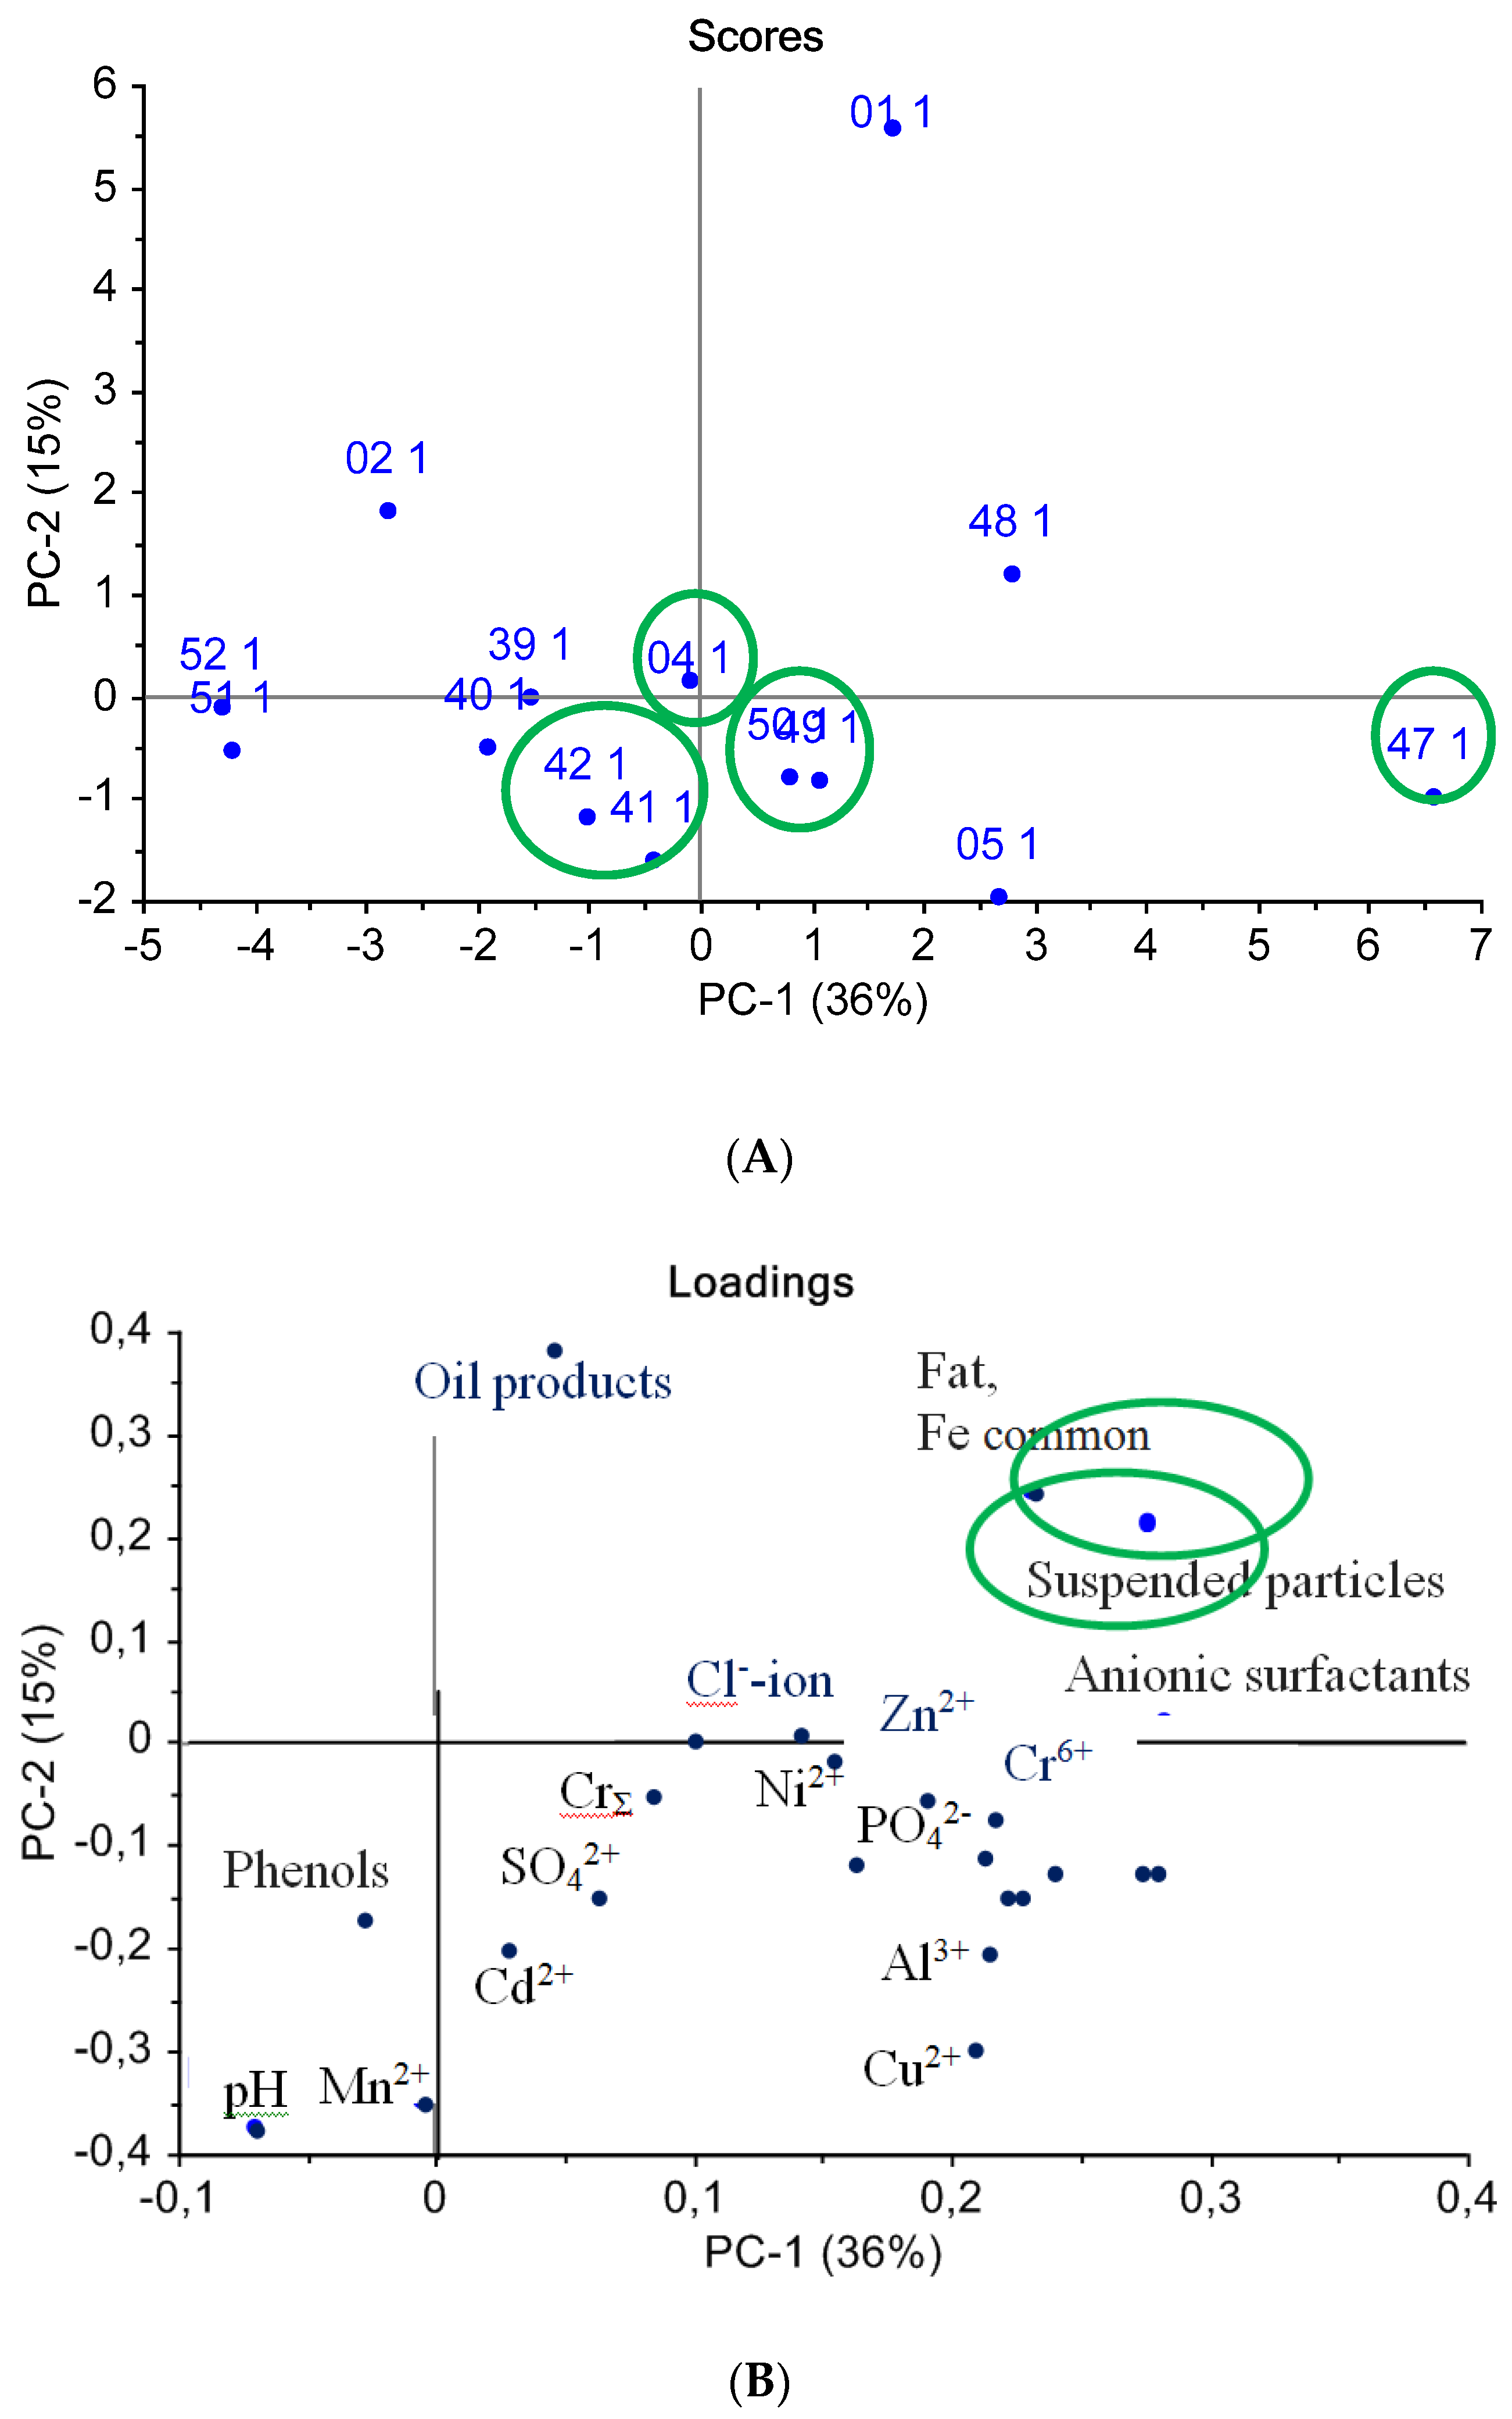
Similarly, a PCA procedure was carried out for a data array of water quality indicators determined by standard methods, as seen in Figure 6. As can be seen from the score plot (Figure 6A), most of the samples were placed in the graph center, which means that the standard indicators were insufficiently informative for water sample classification. The PCA procedure identified samples #01 and #47 as outliers, since these samples were situated far from the main group of other water samples on the PCA score plot, thus representing abnormal values of the measured standard indicators.
From the loadings graph (Figure 6B), it can be established that the “suspended solids” and “anion-active surfactants” variables were the most discriminative along the first principal component, PC1, while the “petroleum products” content and the “hydrogen index” were the most influencing variables along axis PC2. Moreover, the water mineral composition indicators were correlated with each other and did not influence the sample classification.
When comparing the PCA models of water sample classifications obtained from piezoelectric e-nose output data and from standard quality indicators (Figure 5 and Figure 6, respectively), it was apparent that the samples ranged differently, which made it impossible to establish interconnections between the two datasets. Thus, we calculated the Pearson paired criterion to evaluate the interconnection between the sensor array data and the standards of water quality parameters, as seen in Table 5.
Table 5 demonstrates only the statistically significant correlation coefficients obtained. It can be seen that no significant correlation was established between the sensor array outputs (analytical signals of sensors and “visual prints” area) and the standard water quality indicators. On the contrary, the most informative sensor array outputs were the parameters of the efficiency of sorption (A13, A14, A25, A26), which were associated with the mineral compositions of the analyzed samples. It is known that the presence of dissolved salts changes the pressure of saturated water vapor and other dissolved volatile substances, and these changes were then registered by sensors with polar coatings.
Indicators such as “suspended solids” and “hydrogen index” did not have a statistically significant relationship with any output parameter of the sensor array. This finding permitted a significantly simplified sample pretreatment prior to the analysis of any objects containing suspensions. In fact, it was demonstrated by means of the paired correlations method in wastewater that the “suspended solids” index and the pH of the solution did not affect the response of e-nose sensors.
We then estimated the possibility of predicting the value of standard indicators of water samples from e-nose output data. The multilinear regression method (MLR) was employed for this purpose. For each standard indicator, the MLR model was first constructed and then fitted by the gradual elimination of insignificant variables: finally, the model adequacy was estimated. For the majority of standard indicators, it was not possible to obtain significant MLR models based on sensor array output; however, adequate MLR models were obtained for the evaluation of Co2+, Cd2+, V3+, phosphate, and fat content. The MLR results are listed in Table 6.
As can be seen from Table 6, the most precise model (root mean squared error of prediction (RMSEP) = 0.0003) was obtained for the prediction of vanadium content in water: the most informative variables for this model construction were sorption effectiveness parameters for Sensor 1 (MWCNT-coated) and Sensor 2 (ZrO(NO3)2-coated). Due to the small dataset available, a one-leave-out cross-validation method was employed for the RMSEP calculation. The obtained RMSEP values varied within the 5%–25% range, with the smallest RMSEP being less than 2% for vanadium content.
The resulting MLR models could be considered for simultaneous evaluations of several parameters due to the nonspecific response of sensor coatings to substances whose content must be predicted. For example, it was possible to utilize the obtained MLR model for vanadium to estimate the content of other heavy metal ions, use the MLR model for phosphates to assess the content of other anions, or to predict the content of oily substances using the MLR model for fats.
5. New Opportunities and Trends for Piezosensors Development
One of the promising directions in the development of novel piezosensors is the establishment of appropriate transducers, which may implement simultaneously several operations principles, thus resulting in the construction of an analytical multisystem [4,98,99,100]. Although publications on this topic are still rare, they are of great interest in solving issues of increasing the information content and overall dimensions of sensory systems. Thus, Kim et al. have reported the development of a surface plasmon resonance (SPR)/QCM sensor with simultaneous measurement of the quartz plate resonant frequency oscillation and laser beam resistance and the intensity of reflection [101]. The sensor was obtained by spraying titanium (5 nm) and gold (50 nm) substrates onto different sides of a quartz plate: developed SPR/QCM sensors are promising for microchip technology applications.
Continuous progress has been observed in applications of sensor arrays, and e-noses in particular, in the analysis of complex objects. In Reference [97], new identification parameters, Aij, were calculated from the signals of individual sensors of the array and were employed for the identification of some components such as amines, ammonia, and acetic acid in unknown mixtures at a microconcentration level. This approach makes it possible to solve identification problems for complex mixtures without the use of chemometric data processing methods and can be successfully applied when programming microchips and creating data processing algorithms obtained by portable mobile systems based on an array of piezosensors.
Quite a large number of “e-noses” are currently commercially available instruments [102,103,104,105,106]. However, to date, there have been few portable models on the market for these products [1]. E-nose technology, along with near infrared (NIR) spectroscopy, ultrasound images, and computer colorimetry, belongs to nondestructive control methods employed for rapid screening of a large number of samples in animal husbandry to assess their quality [107].
Another type of oscillatory system, microcantilevers with biocompatible surfaces using natural materials, has been employed to create highly accurate and miniaturized systems with low detection limits for a wide range of analytes [108]. The development of microcantilever sensors and sensor arrays is a promising direction for the creation of environmentally friendly electronics [109], and the works in this area may be interpreted as research in the field of "green" sensorics.
An analysis of publication activity over the past 20 years in international peer-reviewed journals, in this and previous reviews [1,7,9,10,11,12,13,14,108], the number of abstracts at major conferences dedicated not only to sensorics, but also in the area technology and information, all this allows objectively assess the relevance and interest of the scientific community public consumers to development, production and implementation for wide range of applications the analyzers based on chemical sensors of various principles, including piezo quartz microbalances.
Author Contributions
Investigation, methodology, and original draft preparation, T.A.K.; review and editing, L.B.L. All authors have read and approved the final manuscript.
Funding
This research received no external funding.
Conflicts of Interest
The authors declare no conflict of interest.
References
- Kuchmenko, T.A. Problems of Analytical Chemistry in “Chemical Sensors”; Vlasov, Y.G., Ed.; Scientific Council on Analytical Chemistry OHNM of RAS, Nauka: Moscow, Russia, 2011; Volume 14, p. 127. [Google Scholar]
- Nikolelis, D.P.; Varzakas, T.; Erdem, A.; Nikoleli, G.P. Portable Biosensing of Food Toxicants and Environmental Pollutants; Jones, B., Huang, H., Eds.; CRC Press by Taylor Francis Group: Boca Raton, FL, USA, 2014; p. 71. ISBN 13978-1-4665-7633-9. [Google Scholar]
- Lahcen, A.A.; Amine, A. Recent Advances in Electrochemical Sensors Based on Molecularly Imprinted Polymers and Nanomaterials. Electroanalysis 2019, 31, 188–201. [Google Scholar] [CrossRef]
- Lvova, L.; Pudi, R.; Galloni, P.; Lippolis, V.; Di Natale, C.; Lundstrom, I.; Paolesse, R. Multi-transduction sensing films for Electronic Tongue applications. Sens. Actuators B 2015, 207B, 1076–1086. [Google Scholar] [CrossRef]
- Lvova, L.; Di Natale, C.; Paolesse, R. Chemical Sensors for Water Potability Assessment. In Bottled and Packaged Water; Grumezescu, A.M., Holba, A.M., Eds.; Elsevier: Amsterdam, The Netherlands, 2019; Volume 4, pp. 177–208. [Google Scholar] [CrossRef]
- Lvova, L.; Nadporozhskaya, M. Chemical sensors for soil analysis: Principles and applications. In New Pesticides and Soil Sensors; Grumezescu, A.M., Ed.; Series Nanotechnology in the Agri-Food Industry; Elsevier: Amsterdam, The Netherlands, 2017; Volume 10, pp. 637–678. [Google Scholar] [CrossRef]
- Pelosi, P.; Zhu, J.; Knoll, W. From Gas Sensors to Biomimetic Artificial Noses. Chemosensors 2018, 6, 32. [Google Scholar] [CrossRef]
- Loutfi, A.; Coradeschi, S.; Mani, G.K.; Shankar, P.; Rayappan, J.B.B. Electronic noses for food quality: A review. J. Food Eng. 2015, 144, 103–111. [Google Scholar] [CrossRef]
- Lvova, L.; Kirsanov, D.; Legin, A.; Di Natale, C. Multisensor Systems for Chemical Analysis: Materials and Sensors; Pan Stanford Publishing: Singapore, 2013; p. 392. ISBN1 978-981441116-5. ISBN2 978-981441115-8. [Google Scholar]
- Lvova, L.; Kirsanov, D. Multisensor Systems for Analysis of Liquids and Gases: Trends and Developments (e-Book); Frontiers Media: Lausanne, Switzerland, 2019. [Google Scholar] [CrossRef]
- Li, Z.; Askim, J.R.; Suslick, K.S. The Optoelectronic Nose: Colorimetric and Fluorometric Sensor Arrays. Chem. Rev. 2019, 119, 231–292. [Google Scholar] [CrossRef] [PubMed]
- Di Natale, C.; Martinelli, E.; Magna, G.; Mandoj, F.; Monti, D.; Nardis, S.; Stefaneli, M.; Paolesse, R. Porphyrins for olfaction mimic: The Rome Tor Vergata approach. JPP 2018, 21, 769–781. [Google Scholar] [CrossRef]
- Dung, T.T.; Oh, Y.; Choi, S.-J.; Kim, I.-D.; Oh, M.-K.; Kim, M. Applications and Advances in Bioelectronic Noses for Odour Sensing. Sensors 2018, 18, 103. [Google Scholar] [CrossRef]
- Pohanka, M. Overview of Piezoelectric Biosensors, Immunosensors and DNA Sensors and Their Applications. Materials 2018, 11, 448. [Google Scholar] [CrossRef]
- Kuchmenko, T.A. Application of Piezoquarz Micro-Weighing Method in Analytical Chemistry; VSUET: Voronezh, Russia, 2001; p. 280. [Google Scholar]
- Fanget, S.; Hentz, S.; Puget, P.; Arcamone, J.; Matheron, M.; Colinet, E.; Andreucci, P.; Duraffourg, L.; Myers, E.; Roukes, M.L. Gas sensors based on gravimetric detection—A review. Sens. Actuators B 2011, 160, 804–821. [Google Scholar] [CrossRef]
- Hauptmann, P. Resonant sensors and applications. Sens. Actuators A 1991, 26, 371–377. [Google Scholar] [CrossRef]
- Wang, W.; Lee, K.; Kim, T.; Park, I.; Yang, S. A novel wireless, passive CO2 sensor incorporating a surface acoustic wave reflective delay line. Smart Mater. Struct. 2007, 16, 1382–1389. [Google Scholar] [CrossRef]
- Glen McHale, G. Generalized concept of shear horizontal acoustic plate mode and Love wave sensors. Meas. Sci. Technol. 2003, 14, 1847–1853. [Google Scholar] [CrossRef]
- Li, M.; Tang, H.X.; Roukes, M.L. Ultra-sensitive NEMS-based cantilevers for sensing, scanned probe and very high-frequency applications. Nat. Nanotechnol. 2007, 2, 114–120. [Google Scholar] [CrossRef]
- Pepper, J.; Noring, R.; Klempner, M.; Cunningham, B.T.; Petrovich, A.; Bousquet, R.; Clapp, C.; Brady, J.; Hugh, B. Detection of proteins and intact microorganisms using microfabricated flexural plate wave resonator arrays. Sens. Actuators B 2003, 96, 565–575. [Google Scholar] [CrossRef]
- Mujahid, A.; Dickert, F.L. Surface Acoustic Wave (SAW) for Chemical Sensing Applications of Recognition Layers. Sensors 2017, 17, 2716. [Google Scholar] [CrossRef]
- Korotcenkov, G. Materials for Piezoelectric-Based Gas Sensors. In Handbook of Gas Sensor Materials: Properties, Advantages and Shortcomings for Applications; Conventional Approaches. Integrated Analytical Systems; Springer: New York, NY, USA, 2013; Volume 1, pp. 307–328. ISBN 978-1-4614-7165-3. [Google Scholar]
- Mile, E.; Jourdan, G.; Bargatin, I.; Marcoux, C.; Labarthe, S.; Kharrat, C.; Andreucci, P.; Hentz, S.; Colinet, E.; Duraffourg, L. In-plane nanoelectromechanical resonators based on silicon nanowire piezoresistive detection. Nanotechnology 2010, 21, 165504. [Google Scholar] [CrossRef] [Green Version]
- Newell, W.E. Miniaturization of Tuning Forks. Science 1964, 161, 1320–1326. [Google Scholar] [CrossRef]
- Carr, D.W.; Evoy, S.; Sekaric, L.; Craighead, H.G.; Parpia, J.M. Measurement of mechanical resonance and losses in nanometer scale silicon wires. Appl. Phys. Lett. 1999, 75, 920–922. [Google Scholar] [CrossRef] [Green Version]
- Hu, Z.; Thundat, T.; Warmack, R.J.J. Investigation of adsorption and absorption-induced stresses using microcantilever sensors. J. Appl. Phys. 2001, 90, 427–431. [Google Scholar] [CrossRef]
- Hillman, A.R. The EQCM: Electrogravimetry with a light touch. J. Solid State Electrochem. 2011, 15, 1647–1660. [Google Scholar] [CrossRef]
- Sauerbrey, G. Verwendung von Schwingquarzen zur Wägung dünner Schichten und zurMikrowägung. Z. Phys. 1959, 155, 206–222. [Google Scholar] [CrossRef]
- Tonda-turo, C.; Carmagnola, I.; Ciardelli, G. Quartz crystal microbalance with dissipation monitoring: A powerful method to predict the in vivo behavior of bioengineered surfaces. Front. Bioeng. Biotechnol. 2018, 6, 158. [Google Scholar] [CrossRef]
- Miller, S.A.; Hiatt, L.A.; Robert, G.; Keil, R.G.; Wright, D.W.; Cliffel, D.E. Multifunctional nanoparticles as simulants for a gravimetric immunoassay. Anal. Bioanal. Chem. 2011, 399, 1021–1029. [Google Scholar] [CrossRef]
- De Giglio, E.; Trapani, A.; Cafagna, D.; Sabbatini, L.; Cometa, S. Dopamine-loaded chitosan nanoparticles: Formulation and analytical characterization. Anal. Bioanal. Chem. 2011, 400, 1997–2002. [Google Scholar] [CrossRef]
- Wang, L.; Gan, X.-X. Biomolecule-functionalized magnetic nanoparticles for flow-through quartz crystal microbalance immunoassay of aflatoxin B1. Bioprocess Biosyst. Eng. 2009, 32, 109–116. [Google Scholar] [CrossRef]
- Nam, D.H.; Lee, J.-O.; Sang, B.-I.; Won, K.; Kim, Y.H. Silaffin Peptides as a Novel Signal Enhancer for Gravimetric Biosensors. Appl. Biochem. Biotechnol. 2013, 170, 25–31. [Google Scholar] [CrossRef]
- Ali, M.G.S.; Elsyed, N.Z.; Abdel Fattah, A.M.; Ali Gharieb, A. Loss mechanisms in piezoceramic materials. J. Comput. Electron. 2012, 11, 196–202. [Google Scholar] [CrossRef]
- Lin, Z.-Q.; Gea, H.C.; Liu, S.-T. Design of piezoelectric energy harvesting devices subjected to broadband random vibrations by applying topology optimization. Acta Mech. Sin. 2011, 27, 730–737. [Google Scholar] [CrossRef]
- Chen, Y.Y.; Wang, J.; Du, J.K.; Yang, J.S. Effects of mass layer imperfect bonding on the electrical impedance of a quartz crystal microbalance. Sci. China Phys. Mech. Astron. 2013, 56, 2186–2191. [Google Scholar] [CrossRef]
- Sharapov, V.; Sotula, Z.; Kunickaya, L. The Technologies of PEAT Synthesis. In Piezo-Electric Electro-Acoustic Transducers; Microtechnology and MEMS; Springer: Cham, Sitzerland, 2014; pp. 91–113. [Google Scholar] [CrossRef]
- Chang, J.W.; Jung, M.; Kim, S.G.; Shim, S.B.; Kim, J.; Lee, S.G.; Yoo, Y.; Kim, B. High-quality nanomechanical resonator based on a defect-free gold nanowire. J. Korean Phys. Soc. 2013, 63, 263–268. [Google Scholar] [CrossRef]
- Naumenko, N.; Solie, L. Optimal cuts of Langasite, La3Ga5SiO14 for SAW devices. IEEE Trans. Ultrason. Ferroelectr. 2001, 48, 530–537. [Google Scholar] [CrossRef]
- Wang, X.; Wang, W.; Li, H.; Fu, C.; Ke, Y.; He, S. Development of a SnO2/CuO-coated surface acoustic wave-based H2S sensor with switch-like response and recovery. Sens. Actuators B 2012, 169, 10–16. [Google Scholar] [CrossRef]
- Hristova-Vasileva, T.; Petkov, K.; Vassilev, V.; Arnaudov, A. Piezoelectric Crystal Sensor for Ammonia Detection. In Nanotechnological Basis for Advanced Sensors; Reithmaier, J., Paunovic, P., Kulisch, W., Popov, C., Petkov, P., Eds.; NATO Science for Peace and Security Series B: Physics and Biophysics; Springer: Dordrecht, The Netherlands, 2011; pp. 439–443. [Google Scholar]
- Wang, X.; Cui, F.; Lin, J.; Ding, B.; Yu, J.; Al-Deyab, S.S. Functionalized nanoporous TiO2 fibers on quartz crystal microbalance platform for formaldehyde sensor. Sens. Actuators B 2012, 171–172, 658–665. [Google Scholar] [CrossRef]
- Latif, U.; Rohrer, A.; Lieberzeit, P.A.; Dickert, F.L. QCM gas phase detection with ceramic materials-VOCs and oil vapors. Anal. Bioanal. Chem. 2011, 400, 2457–2462. [Google Scholar] [CrossRef]
- Bernabei, M.; Pennazza, G.; Santonico, M.; Corsi, C.; Roscioni, C.; Paolesse, R.; Di Natale, C.; D’Amico, A. A preliminary study on the possibility to diagnose urinary tract cancers by an electronic nose. Sens. Actuators B 2008, 131, 1–4. [Google Scholar] [CrossRef]
- D’Amico, A.; Pennazza, G.; Santonico, M.; Martinelli, E.; Roscioni, C.; Galluccio, G.; Paolesse, R.; Di Natale, C. An investigation on electronic nose diagnosis of lung cancer. Lung Cancer 2010, 68, 170–176. [Google Scholar] [CrossRef]
- Bartolazzi, A.; Santonico, M.; Pennazza, G.; Martinelli, E.; Paolesse, R.; D’Amico, A.; Di Natale, C. A sensor array and GC study about VOCs and cancer cells. Sens. Actuators B 2010, 146, 483–488. [Google Scholar] [CrossRef]
- Capuano, R.; Spitalieri, P.; Talarico, R.V.; Catini, A.; Domakoski, A.C.; Martinelli, E.; Scioli, M.G.; Orlandi, A.; Cicconi, R.; Paolesse, R.; et al. Volatile compounds emission from teratogenic human pluripotent stem cells observed during their differentiation in vivo. Sci. Rep. 2018, 1, 11056. [Google Scholar] [CrossRef]
- Stefanelli, M.; Magna, G.; Zurlo, F.; Caso, M.F.; di Bartolomeo, E.; Antonaroli, S.; Venanzi, M.; Paolesse, R.; Di Natale, C.; Monti, D. Chiral Selectivity of Porphyrin-ZnO Nanoparticle Conjugates. ACS Appl. Mater. Interfaces 2019, 11, 12077–12087. [Google Scholar] [CrossRef]
- Lvova, L.; Mastroianni, M.; Pomarico, G.; Santonico, M.; Pennazza, G.; Di Natale, C.; Paolesse, R.; D’Amico, A. Carbon Nanotubes Modified with Porphyrin Units for Chemical Sensing of Gaseous Phase. Sens. Actuators B 2012, 170, 163–171. [Google Scholar] [CrossRef]
- Gao, N.; Dong, J.; Liu, M.; Ning, B.; Cheng, C.; Guo, C.; Zhou, C.; Peng, Y.; Bai, J.; Gao, Z. Development of molecularly imprinted polymer films used for detection of profenofos based on a quartz crystal microbalance sensor. Analyst 2012, 137, 1252–1258. [Google Scholar] [CrossRef]
- Tretjakov, A.; Syritski, V.; Reut, J.; Boroznjak, R.; Volobujeva, O.; Öpik, A. Surface molecularly imprinted polydopamine films for recognition of immunoglobulin G. Microchim. Acta 2013, 180, 1433–1442. [Google Scholar] [CrossRef]
- Wangchareansak, T.; Sangma, C.; Choowongkomon, K.; Dickert, F.; Lieberzeit, P. Surface molecular imprints of WGA lectin as artificial receptors for mass-sensitive binding studies. Anal. Bioanal. Chem 2011, 400, 2499–2506. [Google Scholar] [CrossRef]
- Jenik, M.; Seifner, A.; Lieberzeit, P.; Dickert, F.L. Pollen-imprinted polyurethanes for QCM allergen sensors. Anal. Bioanal. Chem. 2009, 394, 523–528. [Google Scholar] [CrossRef]
- Wangchareansak, T.; Sangma, C.; Ngernmeesri, P.; Thitithanyanont, A.; Lieberzeit, P.A. Self-assembled glucosamine monolayers as biomimetic receptors for detecting WGA lectin and influenza virus with a quartz crystal microbalance. Anal. Bioanal. Chem. 2013, 405, 6471–6478. [Google Scholar] [CrossRef]
- Chunta, S.; Suedee, R.; Lieberzeit, P.A. Low-Density Lipoprotein Sensor Based on Molecularly Imprinted Polymer. Anal. Chem. 2016, 88, 1419–1425. [Google Scholar] [CrossRef]
- Chunta, S.; Suedee, R.; Lieberzeit, P.A. High-density lipoprotein sensor based on molecularly imprinted polymer. Anal. Bioanal. Chem 2018, 410, 875–883. [Google Scholar] [CrossRef]
- Ayad, M.M.; El-Hefnawey, G.; Torad, N.L. A sensor of alcohol vapours based on thin polyaniline base film and quartz crystal microbalance. J. Hazard. Mater. 2009, 168, 85–88. [Google Scholar] [CrossRef]
- Yan, Y.; Lu, D.; Zhou, H.; Hou, H.; Zhang, T.; Wu, L.; Cai, L. Polyaniline-Modified Quartz Crystal Microbalance Sensor for Detection of Formic Acid Gas. Water Air Soil Pollut. 2012, 223, 1275–1280. [Google Scholar] [CrossRef]
- Ayad, M.M.; Torad, N.L. Quartz crystal microbalance sensor for detection of aliphatic amines vapours. Sens. Actuators B 2010, 147, 481–487. [Google Scholar] [CrossRef]
- Sun, P.; Jiang, Y.; Xie, G.; Du, X.; Hu, J. A room temperature supramolecular-based quartz crystal microbalance (QCM) methane gas sensor. Sens. Actuators B 2009, 141, 104–108. [Google Scholar] [CrossRef]
- Shaposhnik, A.V.; Zvyagin, A.A.; Yukish, V.A.; Ryabtsev, S.V.; Domashevskaya, E.P.; Kotov, V.V. Piezogravimetrical Toluene Concentration Sensor. Russian Patent # 2376590, 2007. Available online: https://russianpatents.com/patent/237/2376590 (accessed on 26 August 2019).
- Rusanova, T.Y.; Kalach, A.V.; Rumyantseva, S.S.; Shtykov, S.N.; Ryzhkina, I.S. Determination of Volatile Organic Compounds Using Piezosensors Modified with the Langmuir–Blodgett Films of Calix[4] resorcinarene. J. Anal. Chem. 2009, 64, 1270–1274. [Google Scholar] [CrossRef]
- Kuchmenko, T.A.; Shogenov, Y.K.; Grazhulene, S.S.; Redkin, A.N. Quartz crystal microbalance determination of vapors of volatile organic compounds on carbon nanotubes under batch conditions. J. Anal. Chem. 2012, 67, 21–27. [Google Scholar]
- Lim, C.; Wang, W.; Yang, S.; Lee, K. Development of SAW-based multi-gas sensor for simultaneous detection of CO2 and NO2. Sens. Actuators B 2011, 154, 9–16. [Google Scholar] [CrossRef]
- Kuchmenko, T.A.; Umarkhanov, R.U.; Kochetova, Z.Y.; Bel’skikh, N.V. Development of a Piezosensor-Based Transducer, Gas Analyzer, and Ammonia Detector. J. Anal. Chem. 2012, 67, 930–937. [Google Scholar] [CrossRef]
- Kuchmenko, T.A.; Umarkhanov, R.U. Peculiarities of microweighing of trace quantities of alkylamines on polymer and solid-state thin films. J. Anal. Chem. 2013, 68, 368–375. [Google Scholar] [CrossRef]
- Kuchmenko, T.A.; Mishina, A.A. Sorption specifics of volatile amines on thin films of acid-base indicators. J. Anal. Chem. 2011, 66, 701–708. [Google Scholar] [CrossRef]
- Kim, N.; Park, I.-S.; Kim, D.-K. High-sensitivity detection for model organophosphorus and carbamate pesticide with quartz crystal microbalance-precipitation sensor. Biosens. Bioelectron. 2007, 22, 1593–1599. [Google Scholar] [CrossRef]
- Liu, S.; Zheng, Z.; Li, X. Advances in pesticide biosensors: Current status, challenges, and future perspectives. Anal. Bioanal. Chem. 2013, 405, 63–90. [Google Scholar] [CrossRef]
- Kuchmenko, T.A.; Pogrebnaya, D.A.; Shuba, A.A. Application of principal component analysis and discriminant analysis using latent structure regression to the identification of highly volatile organic compounds in gas mixtures based on piezoelectric quartz microweighing parameters. J. Anal. Chem. 2013, 68, 652–661. [Google Scholar] [CrossRef]
- Reddy, B.S.K.; Kumar, K.R.; Balakrishnaiah, G.; Gopal, K.R.; Reddy, R.R.; Sivakumar, V.; Arafath, S.M.; Lingaswamy, A.P.; Pavankumari, S.; Umadevi, K.; et al. Ground-based in situ measurements of near-surface aerosol mass concentration over Anantapur: Heterogeneity in source impacts. Adv. Atmos. Sci. 2013, 30, 235–246. [Google Scholar] [CrossRef]
- Favrat, O.; Gavoille, J.; Aleya, L.; Monteil, G. Real Time Study of Detergent Concentration Influence on Solid Fatty Acid Film Removal Processes. J. Surfact. Deterg. 2013, 16, 213–219. [Google Scholar] [CrossRef]
- Zhang, C.; Luo, S. Piezoelectric atrazine sensor based on a molecularly imprinted film of titanium dioxide. Microchim. Acta 2011, 175, 63–68. [Google Scholar] [CrossRef]
- Qin, S.; Tang, X.; Du, X.; Zhu, L.; Wei, Y.; Kwon, O.; Fang, J.; Wang, P.; Zhu, D.M. Mechanical and Viscoelastic Properties of Polymer Layers on Solid-Liquid Interfaces. In IUTAM Symposium on Surface Effects in the Mechanics of Nanomaterials and Heterostructures; Cocks, A., Wang, J., Eds.; IUTAM Bookseries (closed); Springer: Dordrecht, The Netherlands, 2013; Volume 31, pp. 217–228. [Google Scholar]
- Simbeck, T.; Hammer, M.M.; Thomaier, S.; Stock, C.; Riedl, E.; Gores Heiner, J. Kinetics of adsorption of poly(vinylimidazole) (PVI) onto copper surfaces investigated by quartz crystal microbalance studies. J. Solid State Electrochem. 2012, 16, 3467–3472. [Google Scholar] [CrossRef]
- Davide, F.A.M.; D’Amico, A. Pattern recognition from sensor arrays: Theoretical considerations. Sens. Actuators A 1992, 32, 507–518. [Google Scholar] [CrossRef]
- Lieberzeit, P.A.; Rehman, A.; Iqbal, N.; Najafi, B.; Dickert, F.L. QCM sensor array for monitoring terpene emissions from odoriferous plants. Monatsh. Chem 2009, 140, 947–952. [Google Scholar] [CrossRef]
- Sun, X.; Zhang, Y.; Shao, J.; Shen, L.; Qian, H.; Zhu, W. A quartz crystal microbalance-based Immunosensor for Shrimp Allergen Determination in Food. Eur. Food Res. Technol. 2010, 231, 563–570. [Google Scholar]
- Kuchmenko, T.A.; Drozdova, E.V. Application of piezosensors array for express analysis of free volatile components from phenolformaldehyde plastics. Anal. Control 2014, 18, 66–75. [Google Scholar]
- Chuikov, A.M.; Peregudov, A.N.; Isaev, A.A.; Kalach, A.V. The possibility of using the “Electronic nose” system for evaluation of gases and vapors toxic level while exploiting some building materials. Technol. Technosphere Saf. 2011, 36, 17–25. [Google Scholar]
- Mujahid, A.; Dickert, F.L. Monitoring automotive oil degradation: Analytical tools and onboard sensing technologies. Anal. Bioanal. Chem. 2012, 404, 1197–1209. [Google Scholar] [CrossRef]
- Chen, S.; Wang, Y.; Choi, S. Applications and Technology of Electronic Nose for Clinical Diagnosis. Open J. Appl. Biosens. 2013, 2, 39–50. [Google Scholar] [CrossRef] [Green Version]
- Lieberzeit, P.A.; Rehman, A.; Najafi, B.; Dickert, F.L. Real-life application of a QCM-based e-nose: Quantitative characterization of different plant-degradation processes. Anal. Bioanal. Chem. 2008, 391, 2897–2903. [Google Scholar] [CrossRef]
- López de Lerma, N.; Moreno, J.; Peinado, R.A. Determination of the Optimum Sun-Drying Time for Vitis vinifera L. cv. Tempranillo Grapes by E-nose Analysis and Characterization of Their Volatile Composition. Food Bioprocess Technol. 2014, 7, 732–740. [Google Scholar] [CrossRef]
- Hui, G.; Wu, Y.; Ye, D.; Ding, W. Fuji Apple Storage Time Predictive Method Using Electronic Nose. Food Anal. Methods 2013, 6, 82–88. [Google Scholar]
- Liu, H.; Zeng, F.K.; Wang, Q.H.; Wu, H.S.; Tan, L.H. Studies on the chemical and flavor qualities of white pepper (Piper nigrum L.) derived from five new genotypes. Eur. Food Res. Technol. 2013, 237, 245–251. [Google Scholar] [CrossRef]
- Jo, D.; Kim, G.R.; Yeo, S.H.; Jeong, Y.J.; Noh, B.S.; Kwon, J.H. Analysis of aroma compounds of commercial cider vinegars with different acidities using SPME/GC-MS, electronic nose, and sensory evaluation. Food Sci. Biotechnol. 2013, 22, 1559–1565. [Google Scholar] [CrossRef]
- Kuchmenko, T.A.; Lisitskaya, R.P.; Khoperskaya, M.A.; Strelnikova Yu, I.; Koblyakova, O.S. Control of the content of food fragrantizers in confectionary masses with the use of sorption gas sensors. Anal. Control 2012, 16, 399–405. [Google Scholar]
- Li, Z.; Wang, N.; Vijaya Raghavan, G.S.; Vigneault, C. Volatiles Evaluation and Dielectric Properties Measurements of Chinese Spirits for Quality Assessment. Food Bioprocess Technol. 2011, 4, 247–253. [Google Scholar] [CrossRef]
- Cotrone, S.; Cafagna, D.; Cometa, S.; De Giglio, E.; Magliulo, M.; Torsi, L.; Sabbatini, L. Microcantilevers and organic transistors: Two promising classes of label-free biosensing devices which can be integrated in electronic circuits. Anal. Bioanal. Chem. 2012, 402, 1799–1811. [Google Scholar] [CrossRef]
- Vera, L.; Aceña, L.; Guasch, J.; Boqué, R.; Mestres, M.; Busto, O. Characterization and classification of the aroma of beer samples by means of an MS e-nose and chemometric tools. Anal. Bioanal. Chem. 2011, 399, 2073–2081. [Google Scholar] [CrossRef]
- Hu, X.; Mallikarjunan, P.; Vaughan, D. Development of non-destructive methods to evaluate oyster quality by electronic nose technology. Sens. Instrumen. Food Qual. 2008, 2, 51–57. [Google Scholar] [CrossRef]
- Delgado-Rodriguez, M.; Ruiz-Montoya, M.; Giraldez, I.; Lopez, R.; Madejon, E.; Diaz, M.J. Use of electronic nose and GC-MS in detection and monitoring some VOC. Atmos. Environ. 2012, 51, 278–285. [Google Scholar] [CrossRef]
- Kuchmenko, T.A.; Pogrebnaya, D.A.; Khripushin, V.V. The new instrumental methods for assessment organoleptic indicators of milk. Anal. Control 2012, 16, 289–298. [Google Scholar]
- Cano, M.; Roales, J.; Castillero, P.; Mendoza, P.; Palma, M.; Calero, A.M.; Jiménez-Ot, C.; Pedrosa, J.M. Improving the training and data processing of an electronic olfactory system for the classification of virgin olive oil into quality categories. Sens. Actuators B 2011, 160, 916–922. [Google Scholar] [CrossRef]
- Kuchmenko, T.A.; Shuba, A.A.; Belskikh, N.V. The identification parameters of organic substances in multisensors piezoquartz microbalance. Anal. Control 2012, 16, 151–161. [Google Scholar]
- Penza, M.; Cassano, G.; Aversa, P.; Antolini, F.; Cusano, A.; Consales, M.; Giordano, M.; Nicolais, L. Carbon nanotubes-coated multi-transducing sensors for VOCs detection. Sens. Actuatots B 2005, 111–112, 171–180. [Google Scholar] [CrossRef]
- Chen, I.S.; Stawasz, M.; Di Mascio, S.K.; Welch, J.J.; Neuner, J.W.; Chen, P.S.H.; Di Meo, F., Jr. Micromachined chemical sensor with dual-transduction mechanisms. Appl. Phys. Lett. 2005, 86, 173510. [Google Scholar] [CrossRef]
- Wang, L.; Swensen, J.S. Dual-transduction-mode sensing approach for chemical detection. Sens. Actuators B 2012, 174, 366–372. [Google Scholar] [CrossRef]
- Kim, J.; Kim, S.; Ohashi, T.; Muramatsu, H.; Chang, S.M.; Kim, W.S. Construction of simultaneous SPR and QCM sensing platform. Bioprocess Biosyst. Eng. 2010, 33, 39–45. [Google Scholar] [CrossRef]
- Alpha MOS: Sensory Analysis Solutions. Available online: https://www.alpha-mos.com/heracles-smell-analysis (accessed on 24 August 2019).
- Sensigent. Available online: http://www.sensigent.com/products/cyranose.html (accessed on 24 August 2019).
- Airsense Analytics. Available online: https://airsense.com/en/products/portable-electronic-nose (accessed on 24 August 2019).
- Electronic Nose for Environmental. Available online: http://e-nose.asia (accessed on 24 August 2019).
- Owlstone Medical. Available online: https://www.owlstonemedical.com/products/lonestar/ (accessed on 24 August 2019).
- Narsaiah, K.; Jha, S.N. Nondestructive methods for quality evaluation of livestock products. J. Food Sci. Technol. 2012, 49, 342–348. [Google Scholar] [CrossRef]
- Lang, H.P.; Gerber, C. Microcantilever Sensors. In STM and AFM Studies on (Bio)molecular Systems: Unravelling the Nanoworld; Samorì, P., Ed.; Topics in Current Chemistry; Springer: Berlin/Heidelberg, Germany, 2008; Volume 285, pp. 1–27. [Google Scholar] [CrossRef]
- Chaudhary, M.; Gupta, A. Microcantilever-based Sensors. Def. Sci. J. 2009, 59, 634–641. [Google Scholar] [CrossRef] [Green Version]
Figure 1.
Classification of oscillatory-based sensors. (A) Schematic diagram of the wireless surface acoustic wave (SAW) CO2-gas sensor system, reprinted from Reference [18]; (B) Scanning electron microscope (SEM) image of an in-plane silicon nanowire piezoresistive resonator, reprinted from Reference [19]; (C) SEM micrograph of an SiC nanocantilever with dimensions of 10 um × 2 um and 70 nm thick, reprinted from Reference [20]; (D) cross-section diagram of a flexural plate wave (FPW) resonating membrane structure and an image of chemical sensor arrays with differential outputs (uCANARY), reprinted from Reference [21]. On figure—BAW: bulk acoustic wave; SH-APM: shear horizontal acoustic plate mode sensor; QCM-D: quartz crystal microbalances with energy dissipation control.
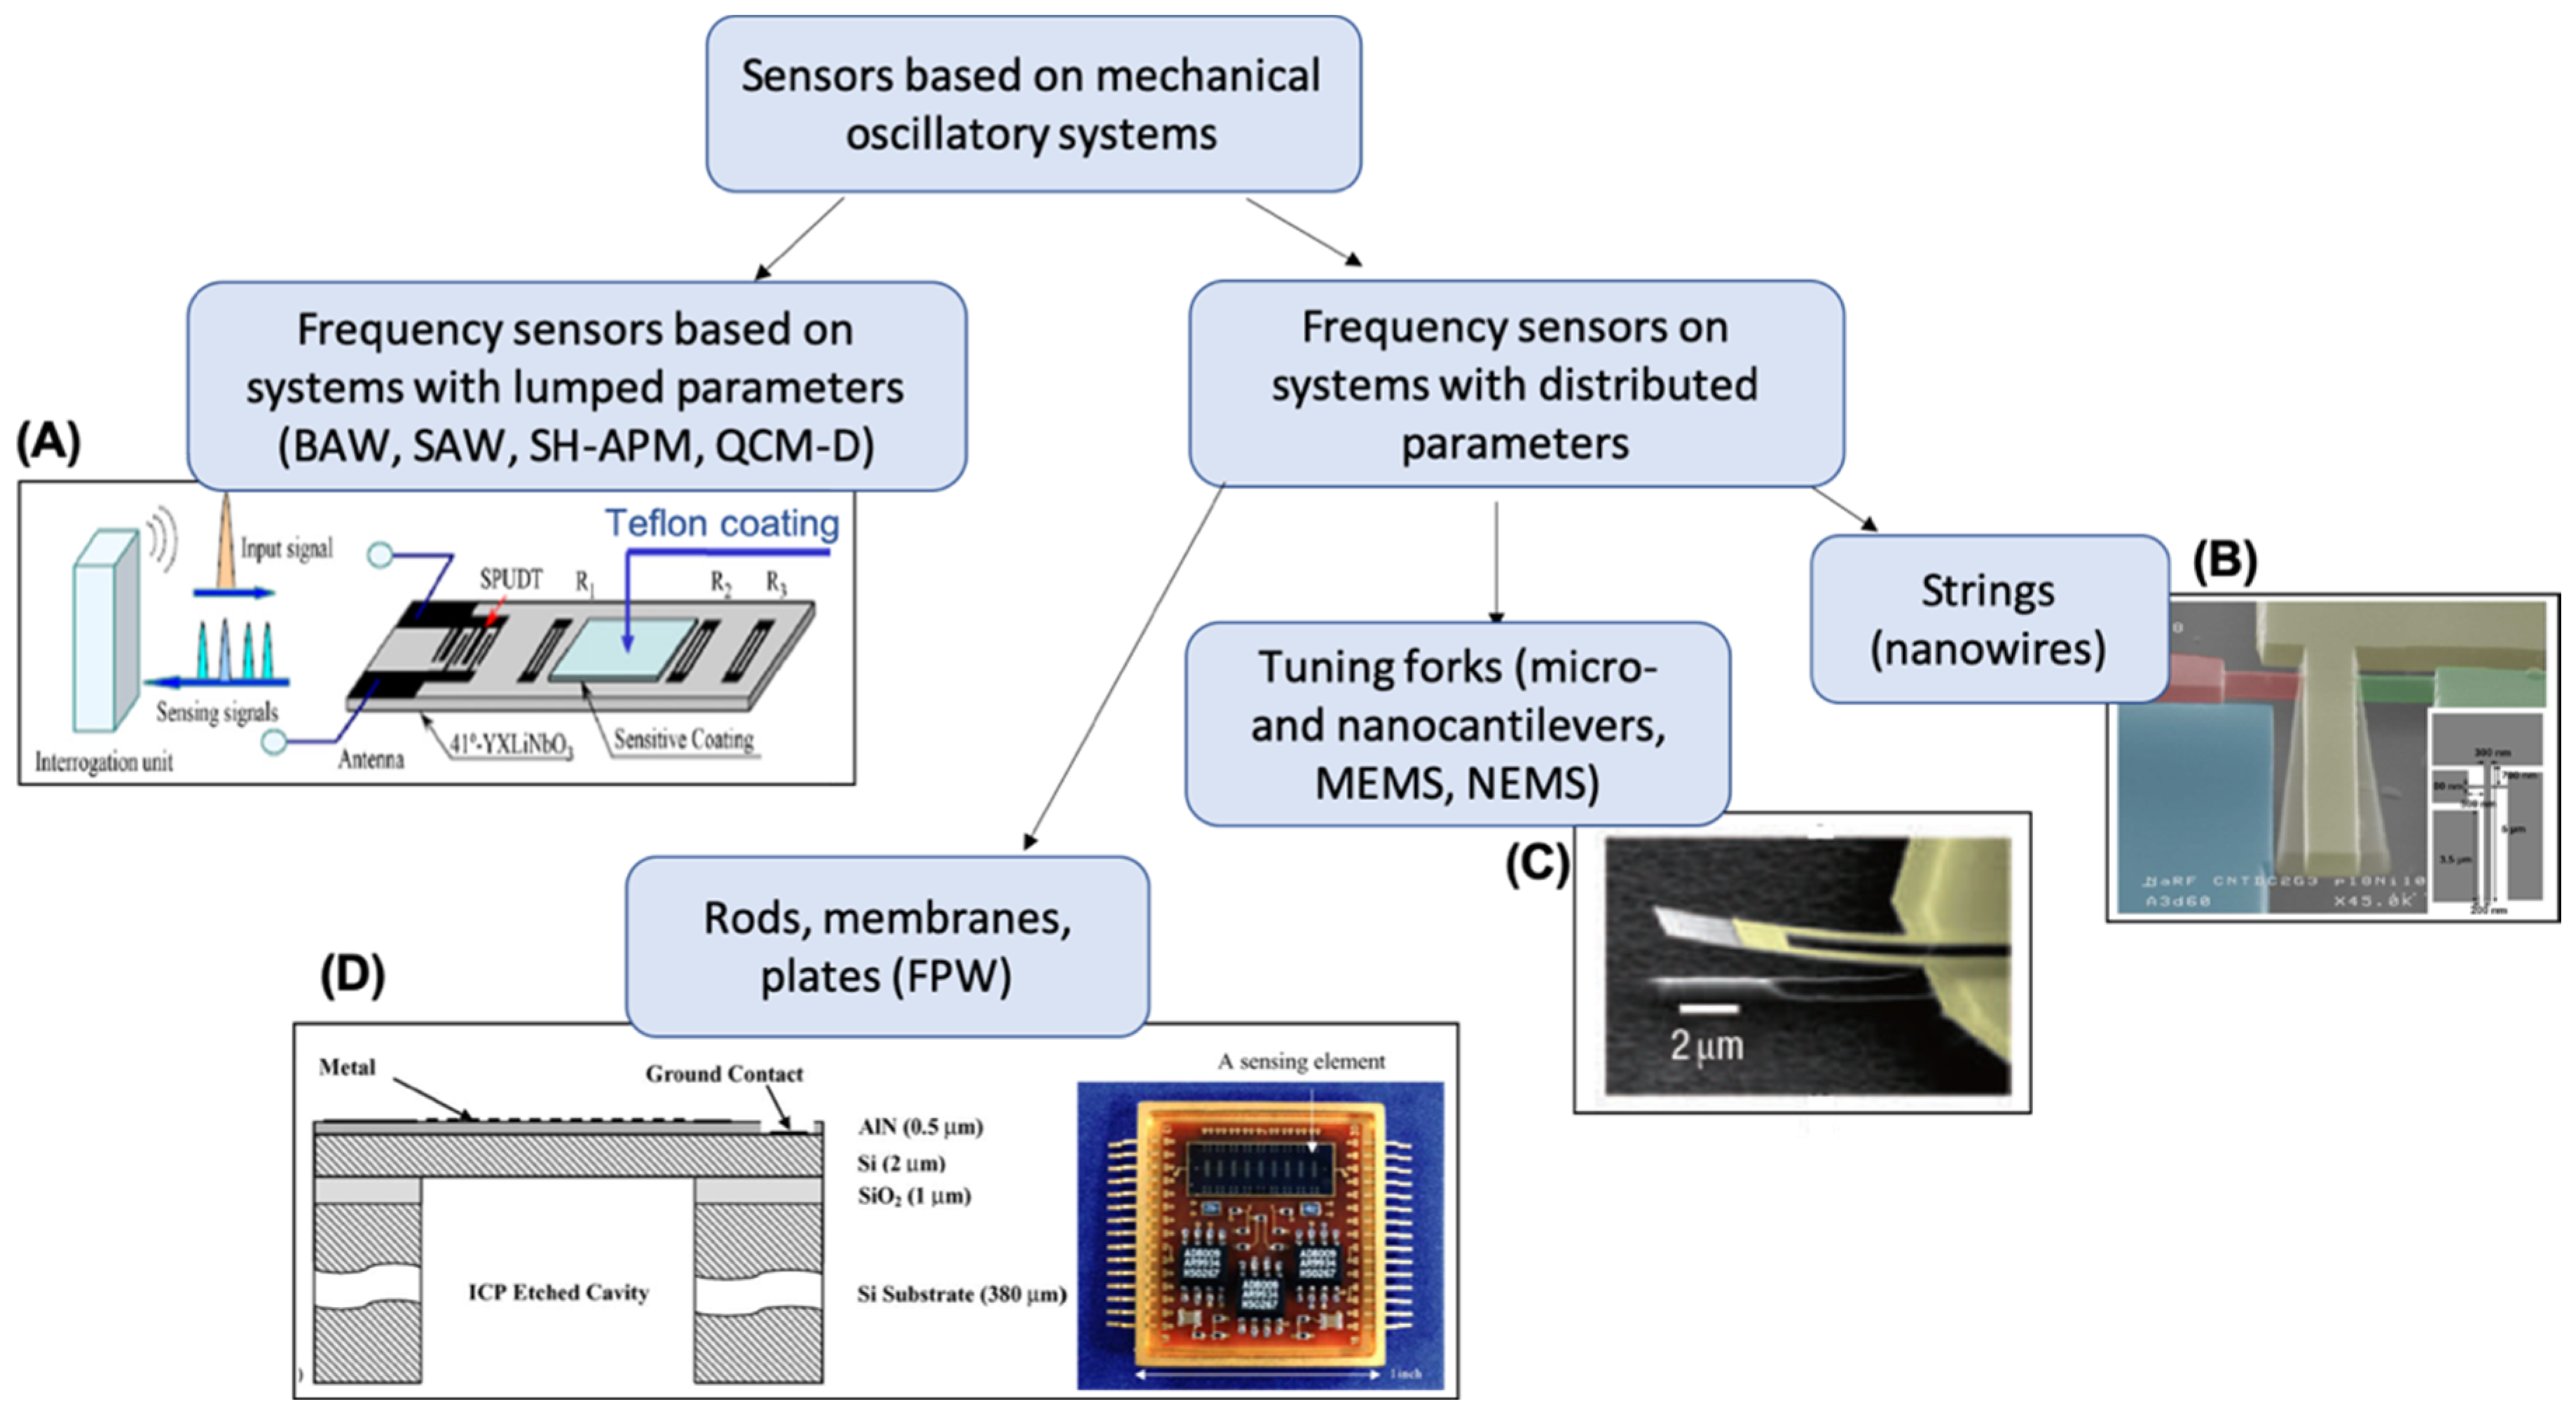
Figure 2.
(A) 3D model of QCM sensor in mode of vapor sorption; (B) schematic presentation of BAW oscillation.
Figure 2.
(A) 3D model of QCM sensor in mode of vapor sorption; (B) schematic presentation of BAW oscillation.
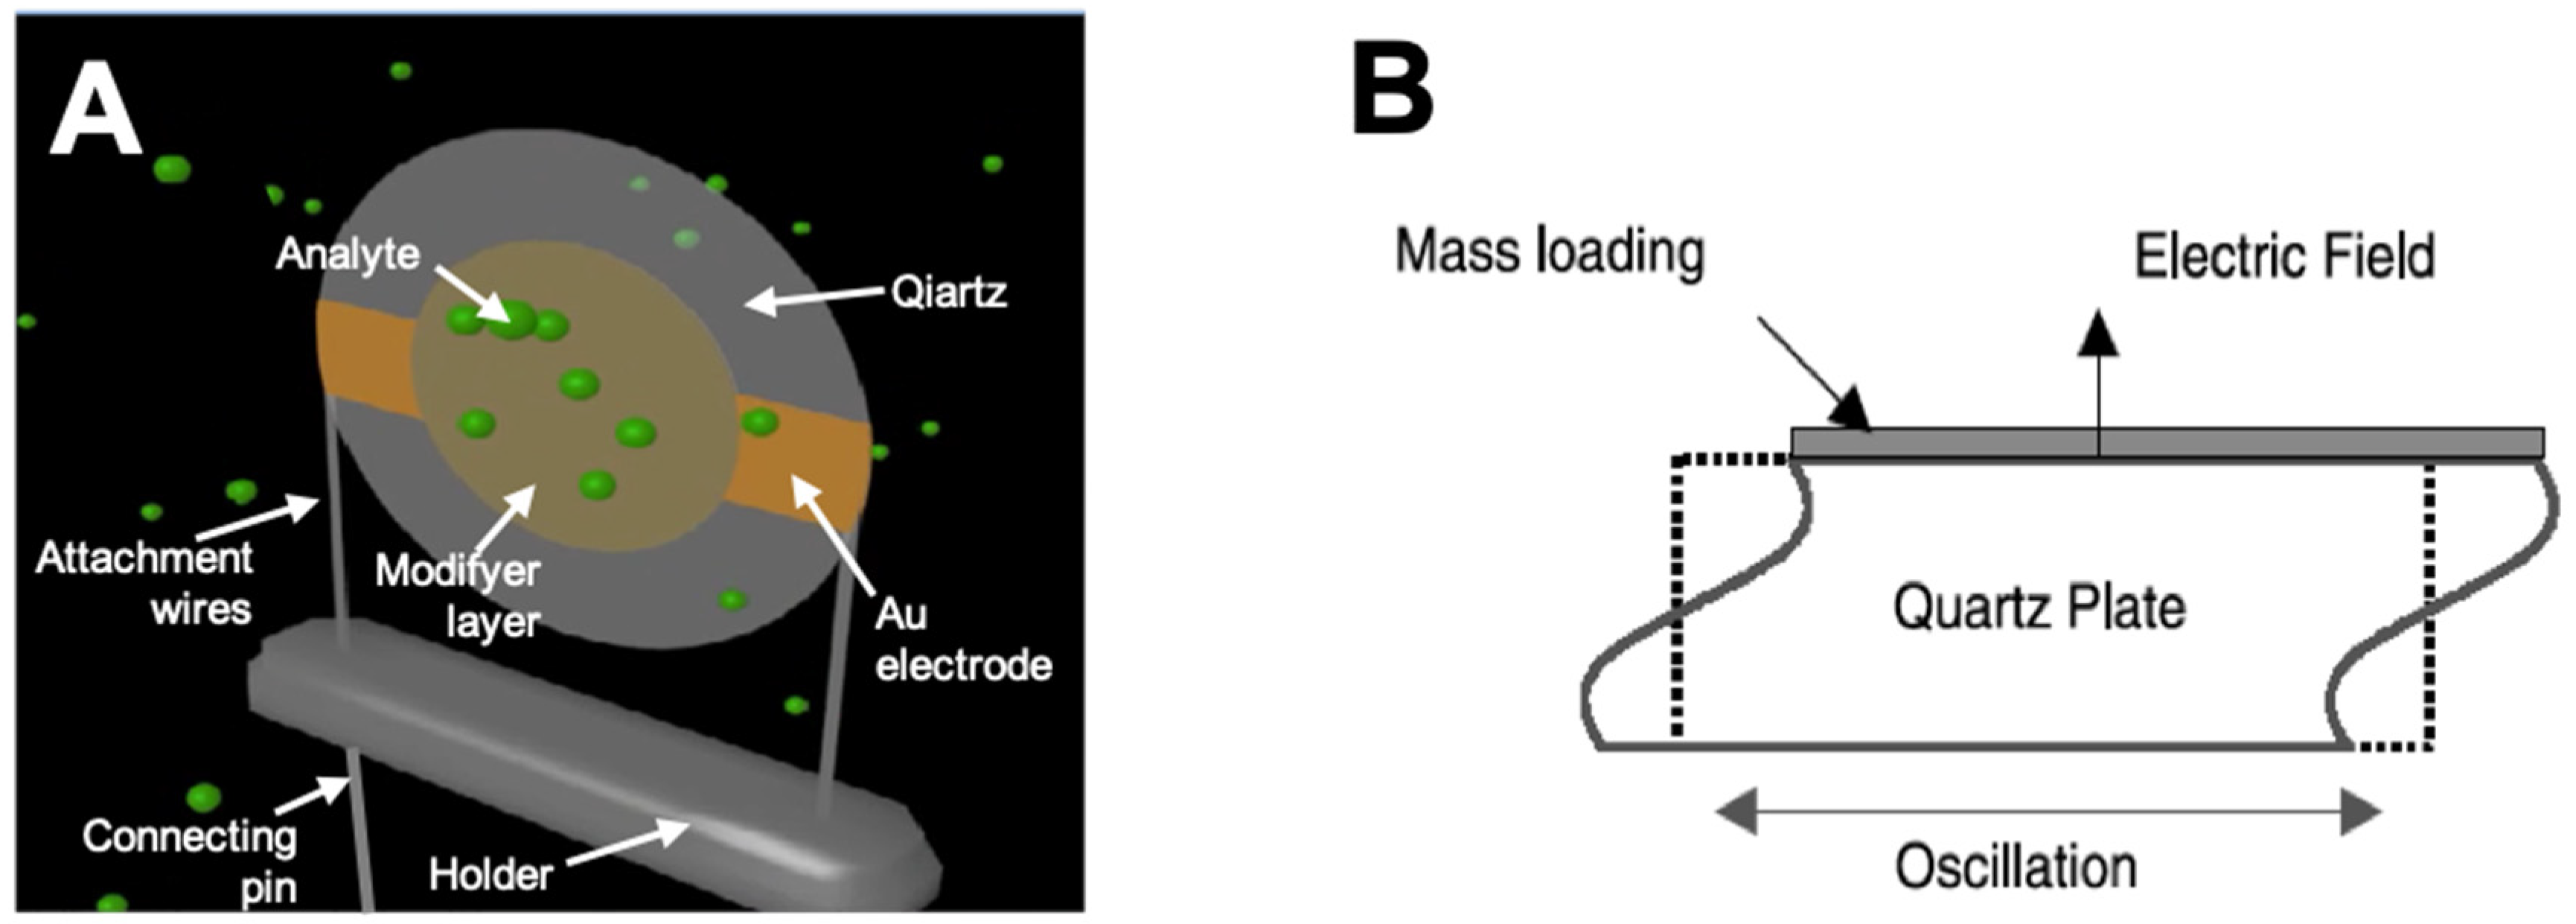
Figure 3.
Dynamics of changes in the number of publications in food analysis employing chemical gas sensors.
Figure 3.
Dynamics of changes in the number of publications in food analysis employing chemical gas sensors.
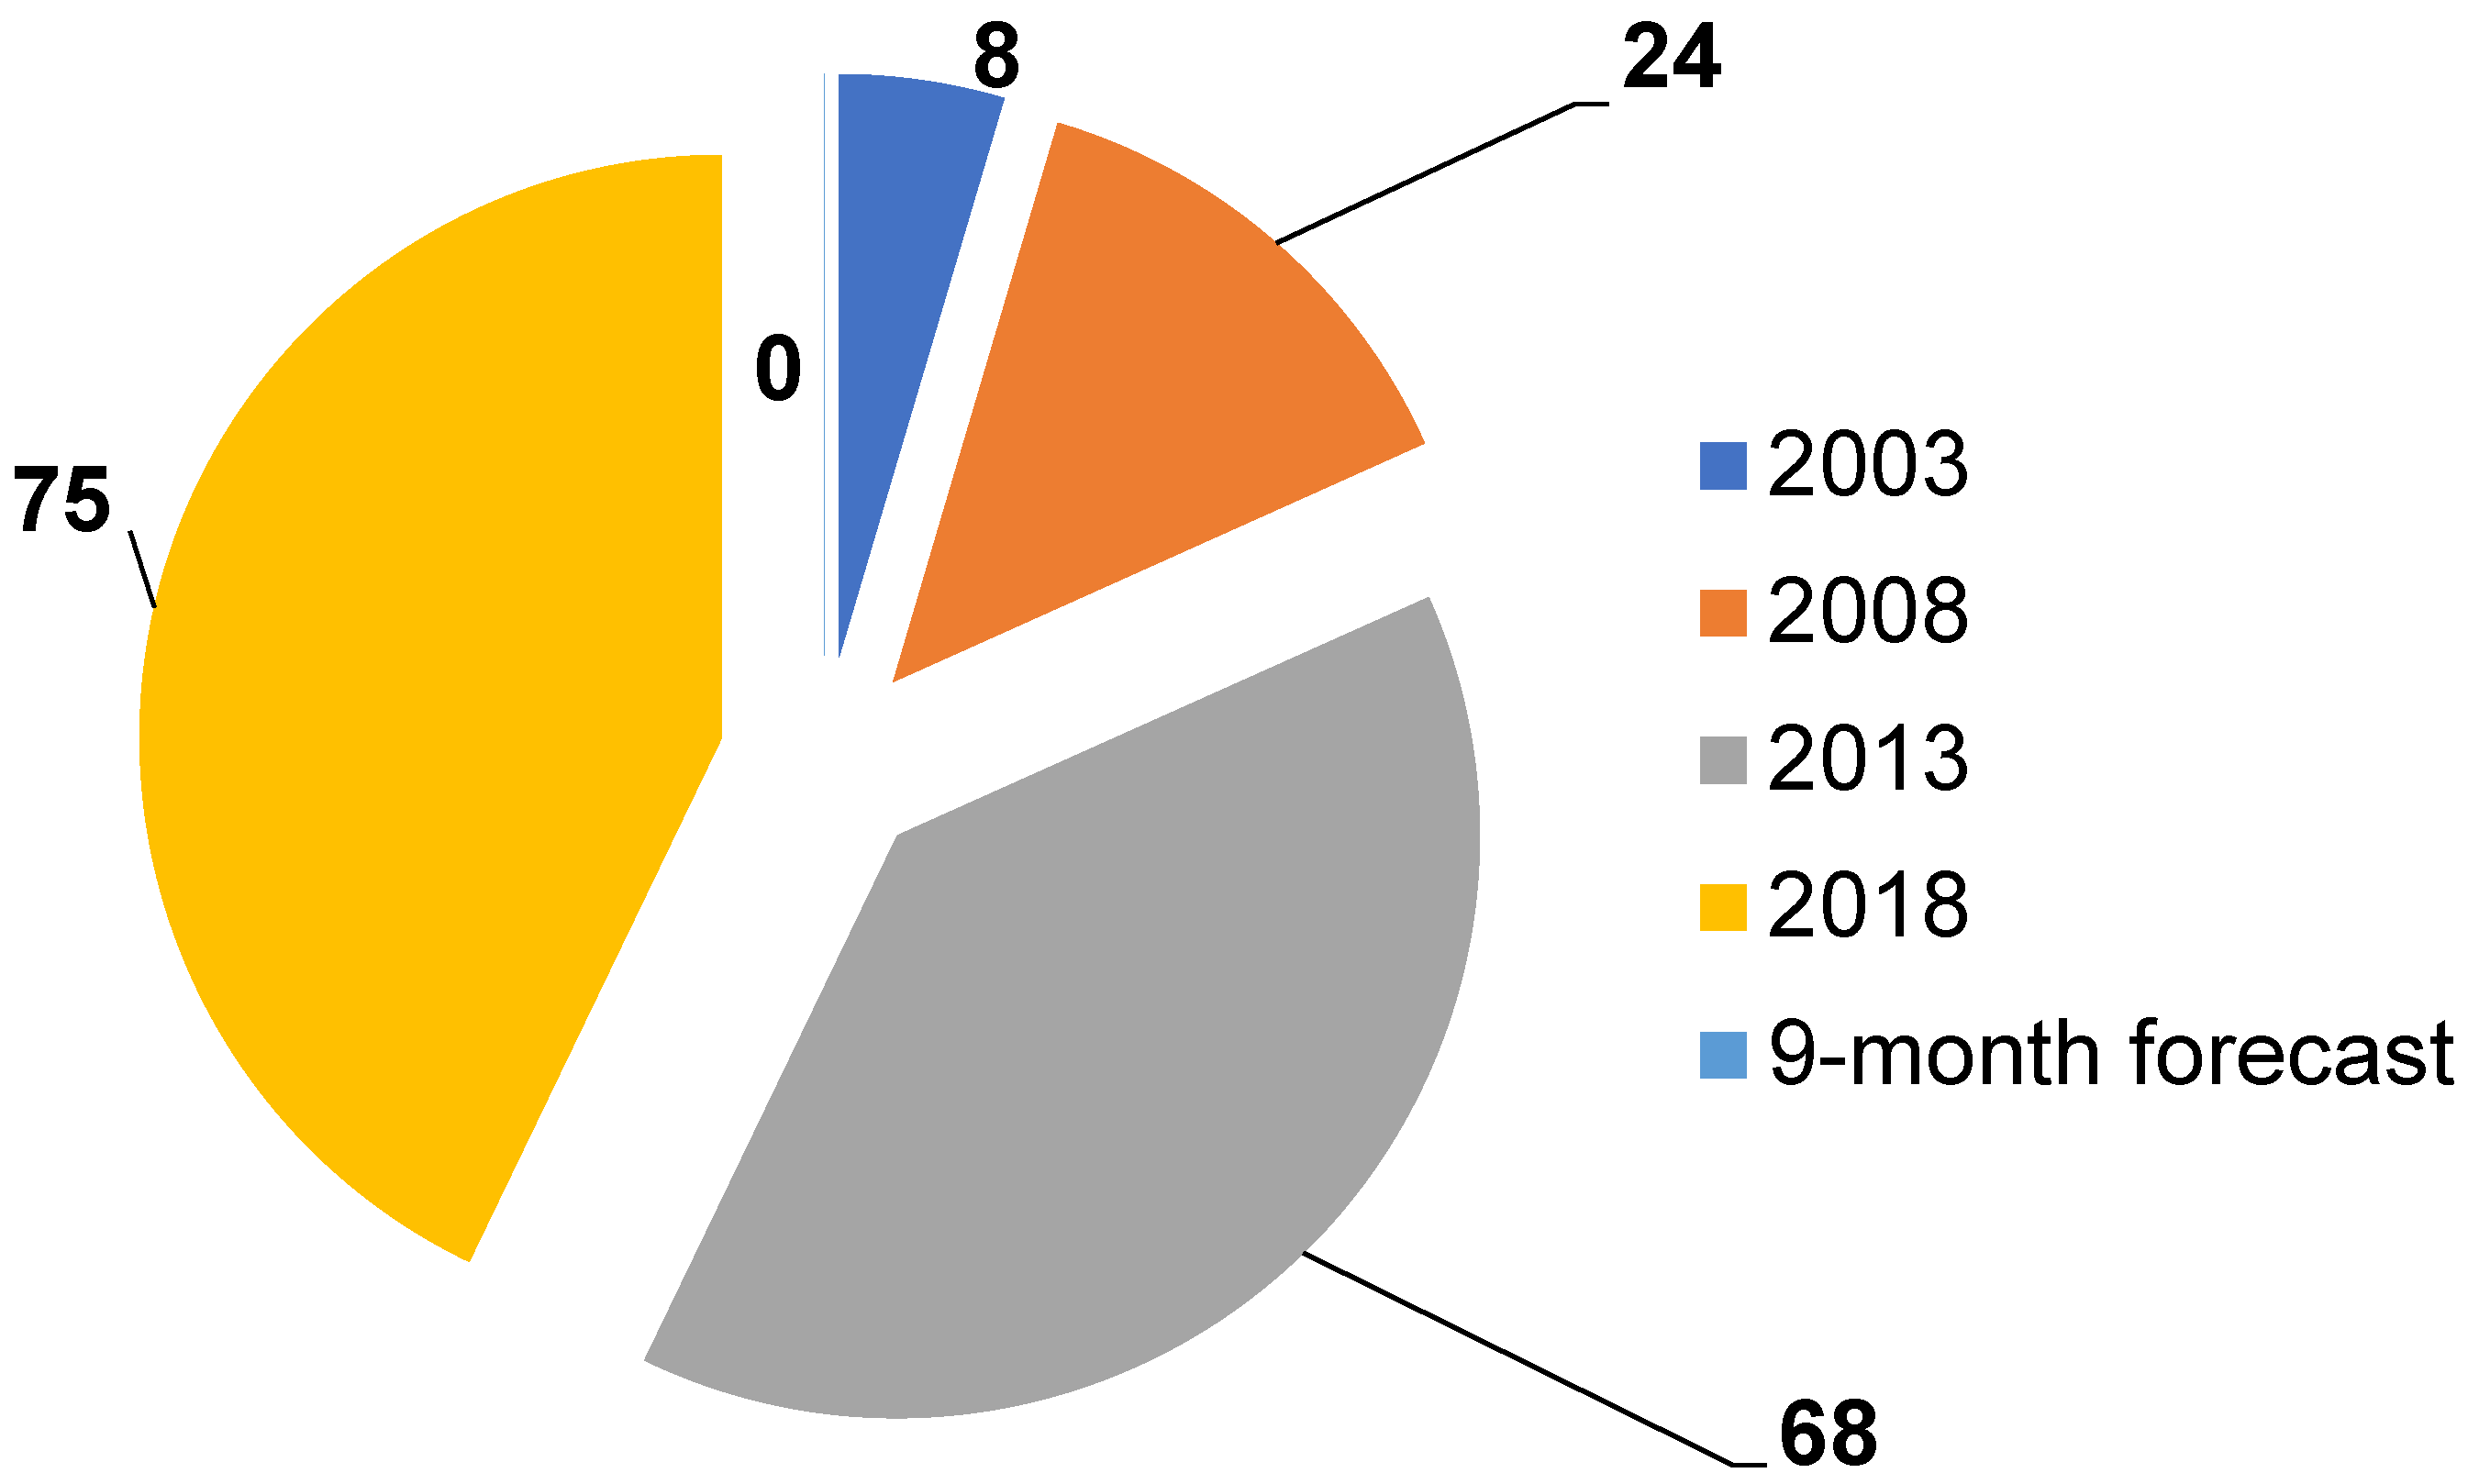
Figure 4.
3D model of food analysis system. 1: A sample in a sampler with an equal gas phase (EGP) above it; 2: syringe for EGP sampling and for injection into the e-nose detector; 3–8: sensor e-nose.
Figure 4.
3D model of food analysis system. 1: A sample in a sampler with an equal gas phase (EGP) above it; 2: syringe for EGP sampling and for injection into the e-nose detector; 3–8: sensor e-nose.
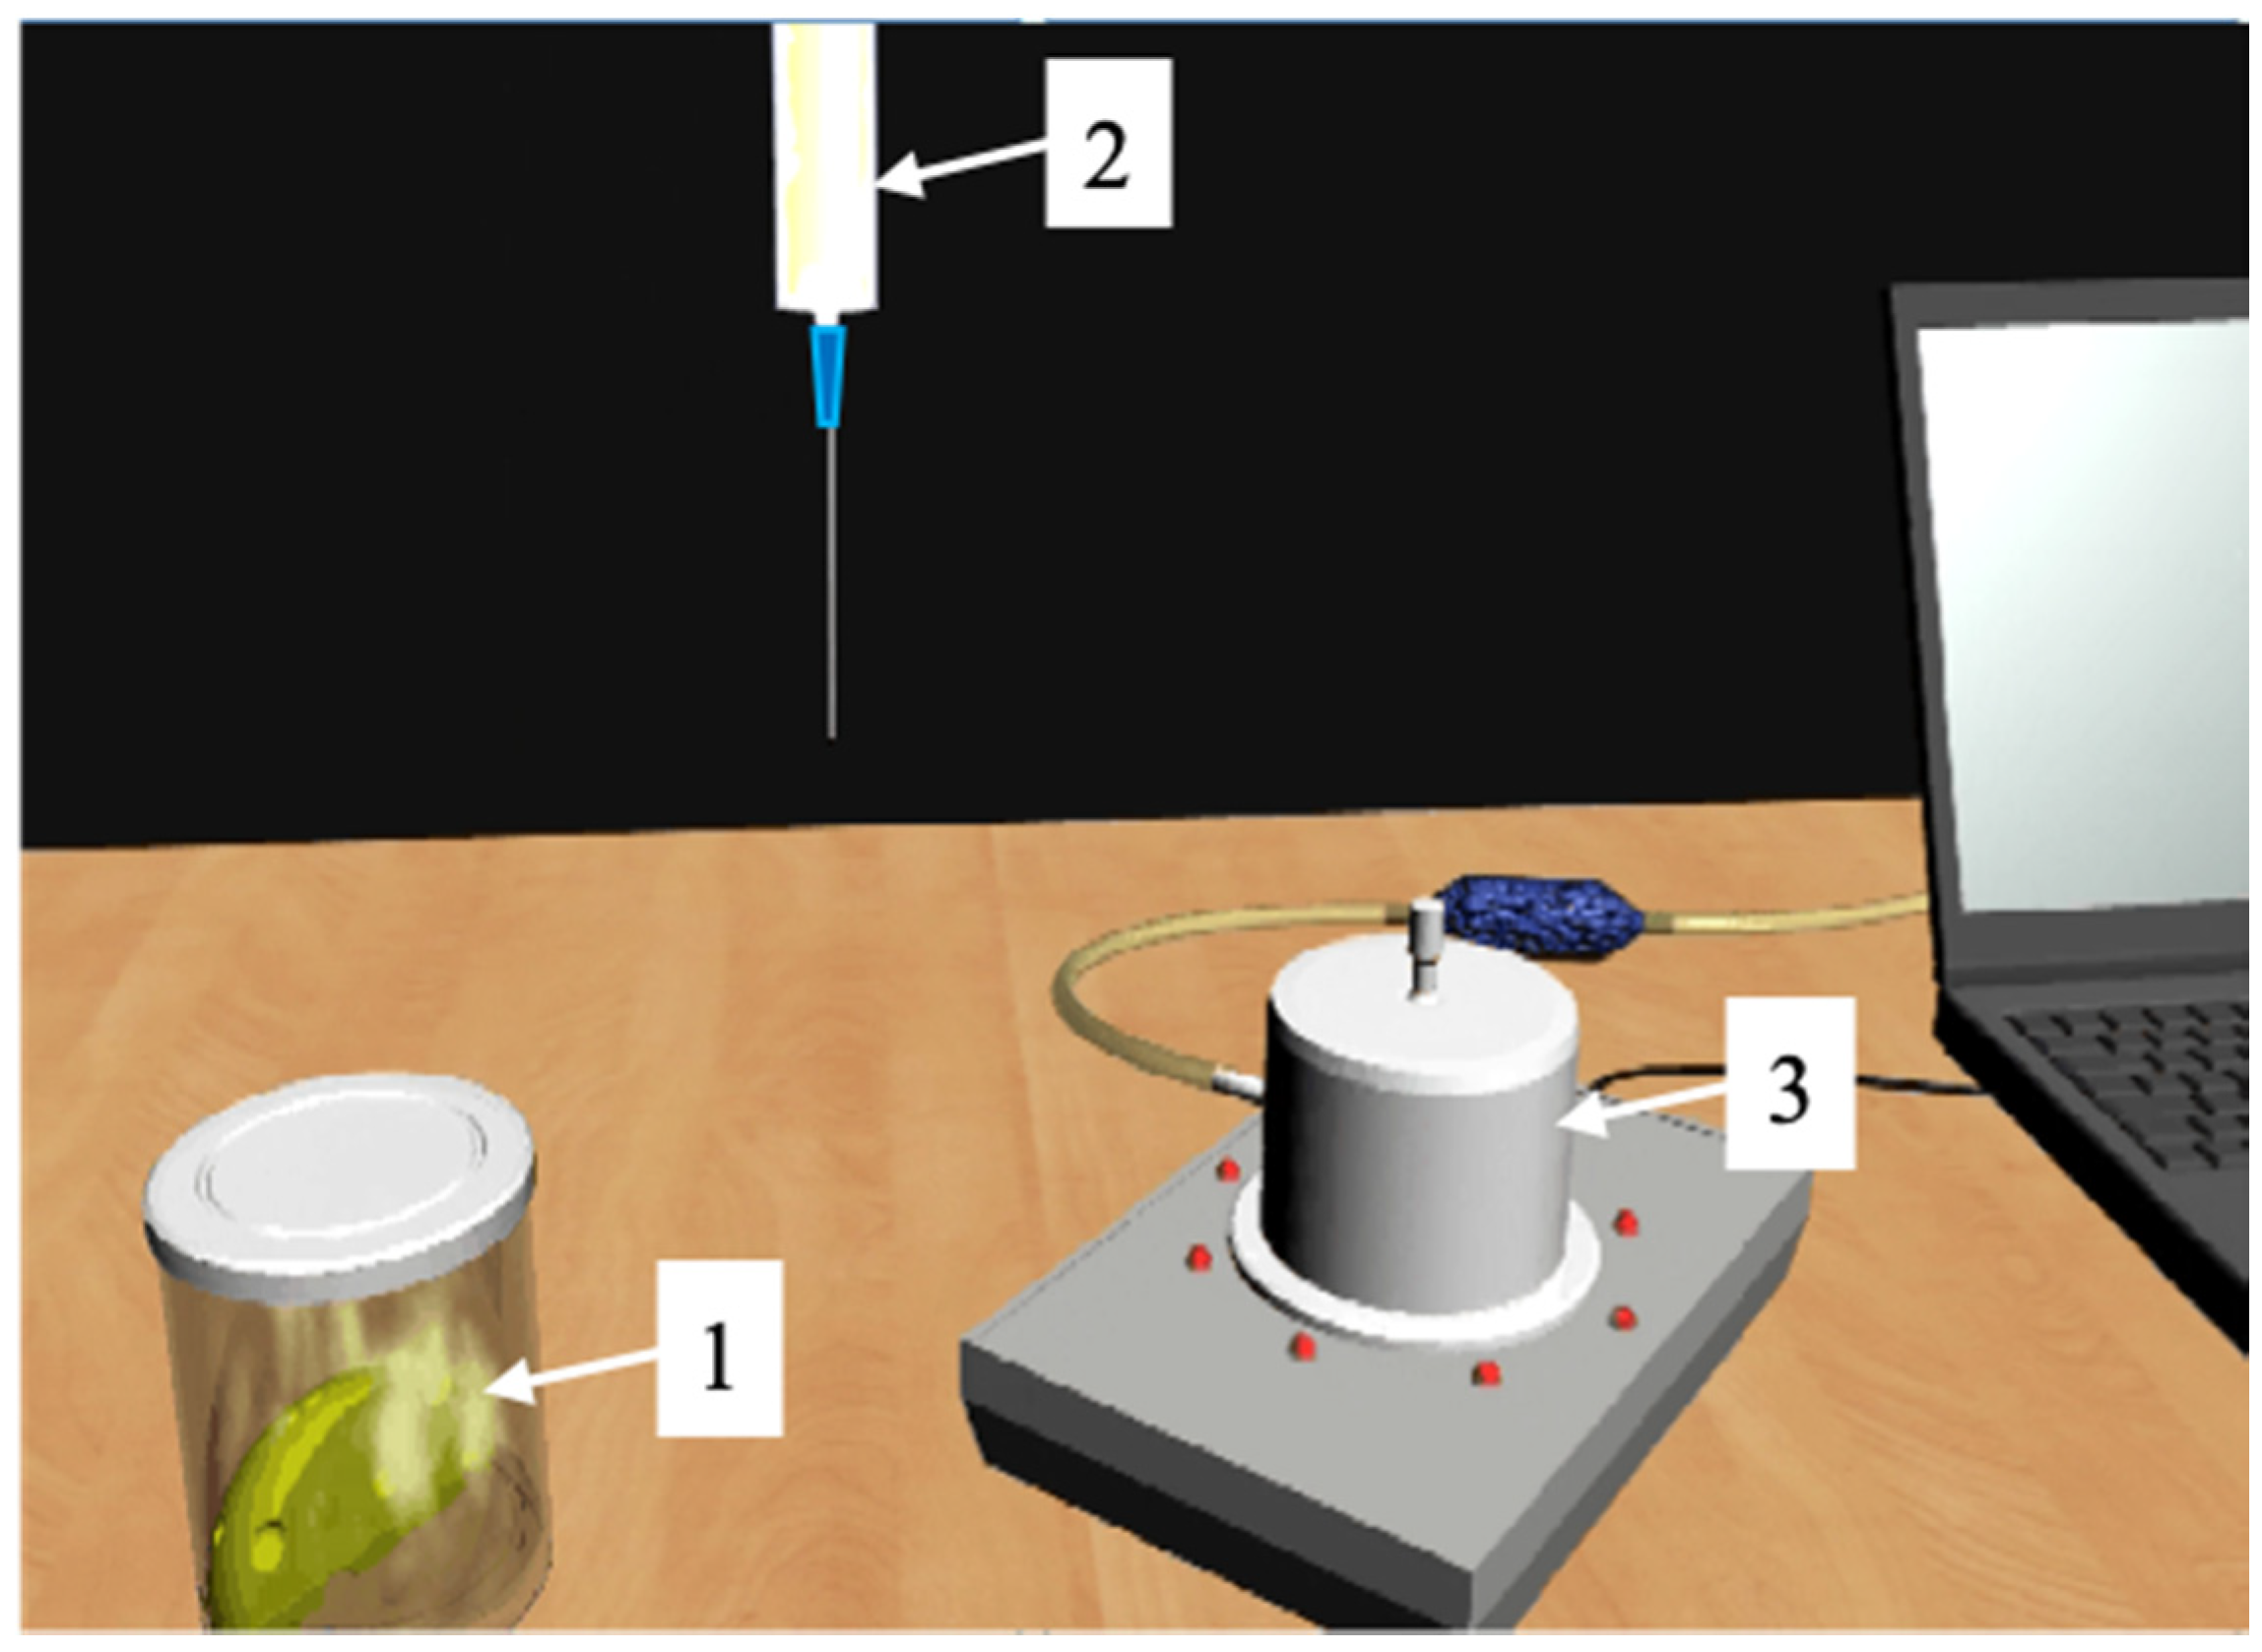
Figure 5.
Principal component analysis (PCA) of water samples according to sensor array output data: (A) scores chart, (B) loadings chart.
Figure 5.
Principal component analysis (PCA) of water samples according to sensor array output data: (A) scores chart, (B) loadings chart.
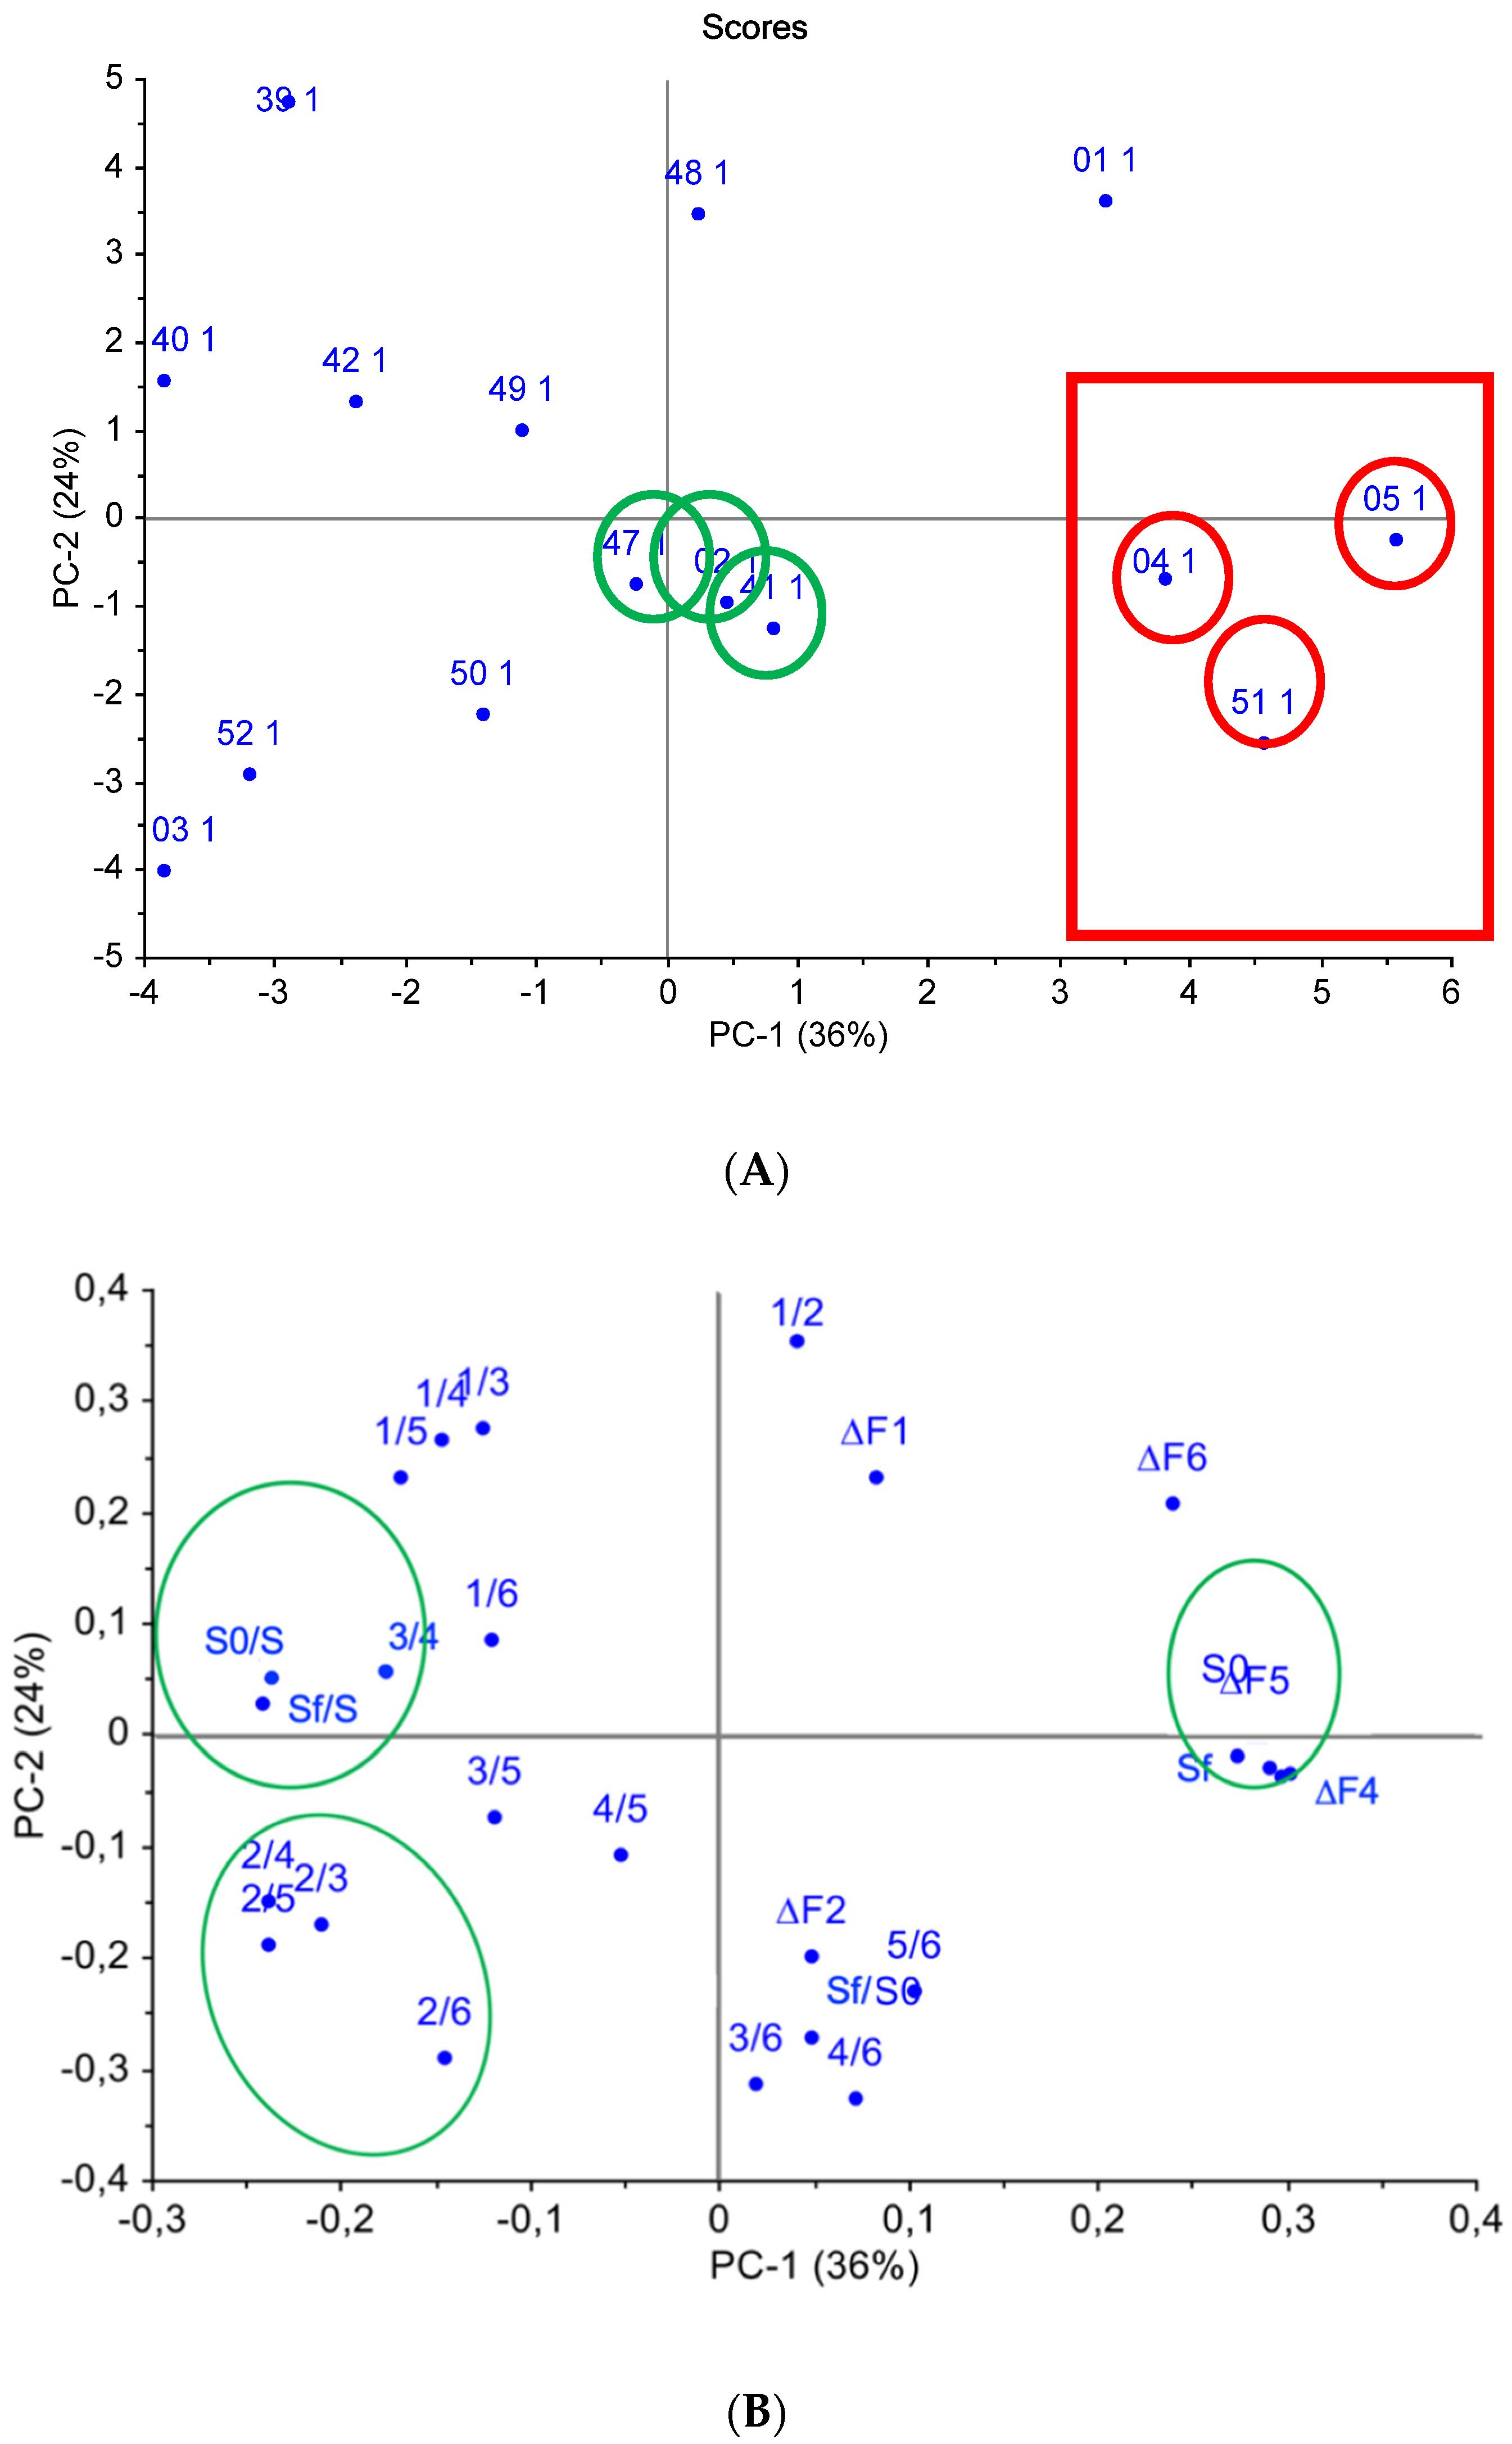
Figure 6.
PCA analysis of water samples using standard methods: (A) scores chart, (B) loadings chart.
Figure 6.
PCA analysis of water samples using standard methods: (A) scores chart, (B) loadings chart.

Table 1.
Summary of single piezosensors and multisensory system applications for environmental monitoring and foodstuffs analysis.
Table 1.
Summary of single piezosensors and multisensory system applications for environmental monitoring and foodstuffs analysis.
| Analysis Objects | Technique | Sensor Coating Type | Measuring System | Ref. |
|---|---|---|---|---|
| CO2 gas | SAW | Teflon | single sensor | [18] |
| proteins and intact microorganisms | FPW | surface-immobilized coatings of biotinylated anti-dog IgG and dog-IgG antibodies | chemical sensor arrays with differential outputs | [21] |
| cell adhesion, cytotoxicity, cell viability, cell phenomena | QCM-D | cell preincubated QCM-D sensors | ΔD–Δf measurements in the presence of different reagents | [30] |
| hemagglutinin (HA) glycoprotein of influenza virions (H5N1) | QCM | polyepitope-functionalized Au NPs | antibody–antigen binding-based gravimetric immunosensor | [31] |
| dopamine (DA) | QCM-D | chitosan nanoparticles (CSNPs) | piezoelectric sensors array with crown ether coatings | [32] |
| aflatoxin B1 | QCM | biomolecule-functionalized magnetic nanoparticles | immunoassay | [33] |
| different proteins using recombinant DNA technology | QCM | silica particles induced by the GFP-R1 chimeric protein | single immunosensor | [34] |
| H2S vapor | SAW | SnO2/CuO coatings | single sensor | [41] |
| NH3 | QCM | NiCl2 and AgCl films | single sensor | [42,66] |
| formaldehyde | QCM | nanoporous TiO2 fibers | single sensor | [43] |
| VOCs: ethanol, n-propanol, n-butanol, n-hexane, n-heptane, n-/iso-octane, n-decane and monitoring emanation of degraded engine oil | QCM | titanate sol–gel layers imprinted with carbonic acids | single sensor | [44] |
| VOC cancer markers | QCM | porphyrins and their metallic complexes | e-nose composed from 8–12-element chemical sensor array | [45,46,47,48] |
| chiral VOCs | QCM | porphyrin–ZnO nanoparticle conjugates | single sensor | [49] |
| n-butanol | QCM | electropolymerized porphyrin-containing coating | single sensor | [50] |
| profenofos | QCM | MIP based on 11-mercaptoundecanoic acid (MUA) | single sensor | [51] |
| immunoglobulin G (IgG) | QCM | MIP polydopamine films | single sensor | [52] |
| wheat germ agglutinin (WGA) lectin | QCM | MIP polyacrylic film | single sensor | [53] |
| pollen allergens (birch and nettle) | QCM | pollen-imprinted polyurethanes | single sensor | [54] |
| influenza viruses and other biomolecules | QCM | self-assembling glucosamine monolayers | single sensor | [55] |
| low-density (LDLs) and high-density (HDLs) lipoproteins in blood serum | QCM | MIPs from acrylic acid (AA), methacrylic acid (MAA), and N-vinylpyrrolidone (VP) monomers in different ratios | single sensors | [56,57] |
| methanol, ethanol, 2-propanol, and 1-propanol vapors | QCM | thin polyaniline film | single sensor | [58] |
| formic acid gas | QCM | thin polyaniline film | single sensor | [59] |
| aliphatic amine vapors | QCM | polyaniline/emeraldine base (PANI/EB) film | single sensor | [60] |
| CH4 gas | QCM | supramolecular cryptophane-A film deposited via electrospray method | single sensor | [61] |
| toluene | QCM | sensitive film coatings made of fulvic acids isolated from humus | single sensor | [62] |
| VOCs: ethanol, benzene, toluene, ethylbenzene, ethyl acetate, acetone, hexane, and cumene | QCM | Langmuir–Blodgett calix [4] resorcinarene | single sensor | [63] |
| VOCs: benzene, methylbenzene, 1,2-dimethylbenzene, ethylbenzene, isopropylbenzene, 1,2,4-trimethylbenzene, monoatomic aliphatic alcohols (C2—C9) with normal and isomeric structures | QCM | doped and nondoped multilayer carbon nanotubes (CNTs) | MAG-8 gas analyzer using e-nose methodology with an array of eight piezoelectric sensors | [64] |
| simultaneous detection of CO2 and NO2 | SAW | CO2-sensitive film (Teflon AF 2400) and an NO2-sensitive film (indium tin oxide) | multigas sensor | [65] |
| alkylamines | QCM | polymer and solid-state thin films, thin films of acid–base indicators | single sensor, gas analyzer | [67,68] |
| organophosphorus and carbamate pesticides | QCM | acetylcholinesterase (AChE) immobilized on QCM surface | single sensor | [69] |
| chain aliphatic acids | QCM | standard chromatographic coatings: polyethylene glycol PEG-2000 (PEG); the ethers: polyethylene glycol adipate (PEGA), phthalate (PEGP), etc.; the specific sorbents 18-crown-6 (18C6) and propolis (Pr) | MAG-8 analyzer using e-nose methodology with an array of eight piezoelectric sensors | [71] |
| variations in the size and concentration of aerosol particles | QCM | no coating | single sensor | [72] |
| stearic acid and homolog dissolution monitoring | QCM | no coating | single sensor | [73] |
| atrazine sensor | QCM | molecularly imprinted film of titanium dioxide | single sensor | [74] |
| adsorption of poly(vinylimidazole) (PVI) on Cu | QCM | no coating | single sensor | [76] |
| shrimp allergen determination in food | QCM | self-assembly of 1,6-hexanedithiol (HDT) and antishrimp antibodies | e-nose immunosensor system | [79] |
| monitoring terpene emissions from odoriferous plants | QCM | molecularly imprinted polymer (MIP) selectively interacting with alpha-pinene, thymol, estragol, linalool, and camphor | sensor array | [80] |
| free volatile components from phenolformaldehyde plastics | QCM | nonspecified | sensor array | [81] |
| composts of grass and pine characterization, alcohol and terpene detection | QCM | affinity materials and MIPs | sensor array of six piezosensors | [84] |
| volatile food flagrancies in confectionary masses | QCM | nonspecified | sensor array | [89] |
| organoleptic indicators of milk assessments | QCM | nonspecified | sensor array | [95] |
| wastewater quality assessments | QCM | MWCNTs, zirconium(IV) oxynitrate, biohydroxyapatite coatings | MAG-8 gas analyzer with six piezosensors | This work’s case study |
Table 2.
The coating compositions and weights of QCM sensors in the MAG-8 gas analyzer.
| Sensor | Coating | Coating Weight (µg) |
|---|---|---|
| Sensor 1 | Multiwalled carbon nanotubes (MWCNTs) oxidized by nitric acid | 5.03 |
| Sensor 2 | Zirconium(IV) oxynitrate | 4.03 |
| Sensor 3 | Biohydroxyapatite | 4.03 |
| Sensor 4 | Biohydroxyapatite | 2.15 |
| Sensor 5 | Zirconium(IV) oxynitrate | 2.12 |
| Sensor 6 | Multiwalled carbon nanotubes (MWCNTs) oxidized by nitric acid | 1.96 |
Table 3.
The response of the MAG-8 e-nose in wastewater samples.
| Sample # | ΔFi | Sensor 1 | Sensor 2 | Sensor 3 | Sensor 4 | Sensor 5 | Sensor 6 | Si (Hz/s) |
|---|---|---|---|---|---|---|---|---|
| Potable Water | X ± ΔX | 6 ± 1 | 7 ± 1 | 12 ± 1 | 7 ± 1 | 6 ± 1 | 11 ± 1 | 125 ± 20 |
| Δ | 0.23 | 0.19 | 0.12 | 0.21 | 0.23 | 0.21 | 0.16 | |
| 04 | X ± ΔX | 12 ± 2 | 14 ± 2 | 25 ± 2 | 12 ± 2 | 12 ± 1 | 20 ± 2 | 485 ± 30 |
| Δ | 0.23 | 0.20 | 0.09 | 0.22 | 0.11 | 0.13 | 0.08 | |
| 01 | X ± ΔX | 13 ± 1 | 15 ± 1 | 26 ± 1 | 15 ± 2 | 12 ± 1 | 24 ± 2 | 480 ± 40 |
| Δ | 0.11 | 0.09 | 0.05 | 0.16 | 0.12 | 0.10 | 0.08 | |
| 51 | X ± ΔX | 12 ± 1 | 15 ± 2 | 24 ± 2 | 15 ± 2 | 12 ± 1 | 21 ± 2 | 470 ± 50 |
| Δ | 0.12 | 0.19 | 0.12 | 0.19 | 0.12 | 0.12 | 0.14 | |
| 05 | X ± ΔX | 12 ± 1 | 15 ± 1 | 24 ± 1 | 15 ± 2 | 12 ± 1 | 21 ± 2 | 445 ± 30 |
| Δ | 0.12 | 0.09 | 0.06 | 0.16 | 0.12 | 0.13 | 0.09 | |
| 47 | X ± ΔX | 12 ± 1 | 14 ± 1 | 25 ± 2 | 14 ± 1 | 11 ± 1 | 19 ± 1 | 420 ± 20 |
| Δ | 0.12 | 0.10 | 0.12 | 0.10 | 0.13 | 0.07 | 0.06 | |
| 49 | X ± ΔX | 12 ± 1 | 14 ± 1 | 24 ± 1 | 14 ± 1 | 12 ± 2 | 19 ± 1 | 430 ± 30 |
| Δ | 0.12 | 0.01 | 0.06 | 0.01 | 0.2 | 0.07 | 0.08 | |
| 48 | X ± ΔX | 11 ± 1 | 12 ± 1 | 24 ± 1 | 13 ± 2 | 11 ± 1 | 18 ± 2 | 420 ± 20 |
| Δ | 0.13 | 0.12 | 0.06 | 0.19 | 0.13 | 0.14 | 0.05 | |
| 50 | X ± ΔX | 12 ± 1 | 14 ± 1 | 24 ± 1 | 14 ± 1 | 11 ± 1 | 19 ± 1 | 435 ± 20 |
| Δ | 0.13 | 0.10 | 0.06 | 0.10 | 0.13 | 0.07 | 0.04 | |
| 52 | X ± ΔX | 10 ± 1 | 14 ± 1 | 24 ± 1 | 13 ± 1 | 12 ± 1 | 19 ± 1 | 350 ± 20 |
| Δ | 0.15 | 0.10 | 0.06 | 0.10 | 0.13 | 0.07 | 0.07 | |
| 02 | X ± ΔX | 10 ± 1 | 14 ± 1 | 24 ± 1 | 14 ± 1 | 11 ± 1 | 19 ± 1 | 420 ± 20 |
| Δ | 0.01 | 0.10 | 0.06 | 0.10 | 0.13 | 0.13 | 0.08 | |
| 03 | X ± ΔX | 13 ± 1 | 14 ± 1 | 23 ± 1 | 13 ± 1 | 11 ± 1 | 19 ± 1 | 440 ± 20 |
| Δ | 0.11 | 0.10 | 0.06 | 0.10 | 0.03 | 0.03 | 0.06 | |
| 39 | X ± ΔX | 14 ± 1 | 14 ± 1 | 24 ± 1 | 14 ± 1 | 11 ± 1 | 19 ± 1 | 460 ± 30 |
| Δ | 0.10 | 0.10 | 0.06 | 0.10 | 0.13 | 0.07 | 0.08 | |
| 40 | X ± ΔX | 14 ± 1 | 14 ± 1 | 23 ± 1 | 13 ± 1 | 11 ± 1 | 19 ± 1 | 420 ± 20 |
| Δ | 0.10 | 0.01 | 0.06 | 0.10 | 0.01 | 0.07 | 0.06 | |
| 42 | X ± ΔX | 13 ± 1 | 14 ± 1 | 23 ± 1 | 13 ± 1 | 11 ± 1 | 19 ± 1 | 400 ± 30 |
| Δ | 0.21 | 0.10 | 0.06 | 0.10 | 0.01 | 0.08 | 0.08 | |
| 41 | X ± ΔX | 12 ± 1 | 14 ± 1 | 23 ± 1 | 15 ± 1 | 11 ± 1 | 20 ± 2 | 490 ± 20 |
| Δ | 0.12 | 0.10 | 0.06 | 0.09 | 0.13 | 0.15 | 0.04 |
Table 4.
The results of several different metal concentrations (C, μg/L) in wastewater samples (determined by standard methods).
Table 4.
The results of several different metal concentrations (C, μg/L) in wastewater samples (determined by standard methods).
| Sample # | Mn | Al | Pb | Cr | Fe | Ni | Zn | Cu | Cd |
|---|---|---|---|---|---|---|---|---|---|
| 01 | 0.062 | 0.086 | 0.0045 | <0.01 | 9.42 | 0.0031 | 0.09 | 0.0089 | <0.0001 |
| 02 | 0.04 | 0.20 | <0.001 | <0.01 | 0.61 | 0.0016 | 0.12 | 0.0097 | <0.0001 |
| 03 | 0.52 | 2,6 | 0.520 | 0.11 | 52 | 0.018 | 0.8 | 0.60 | 0.0027 |
| 04 | 0.102 | 0.64 | <0.001 | <0.01 | 2.4 | 0.0029 | 0.12 | 0.034 | <0.0001 |
| 05 | 0.181 | 2.24 | - | <0.01 | 6.8 | 0.0096 | 0.55 | 0.10 | 0.0004 |
| 39 | 0.095 | 0.56 | 0.0022 | 0.039 | 1.0 | 0.0049 | 0.16 | 0.031 | 0.0002 |
| 40 | 0.16 | 1.46 | 0.0047 | 0.012 | 1.2 | 0.0033 | 0.12 | 0.040 | 0.0002 |
| 41 | 0.092 | 0.24 | 0.0120 | <0.01 | 1.8 | 0.0048 | 0.18 | 0.050 | 0.0015 |
| 42 | 0.17 | 0.63 | 0.0033 | 0.013 | 2.8 | 0.0044 | 0.43 | 0.108 | 0.0003 |
| 47 | 0.118 | 2.12 | 0.011 | 0.025 | 4.4 | 0.030 | 0.33 | 0.096 | 0.0003 |
| 48 | 0.098 | 1.14 | 0.009 | <0.01 | 4.2 | 0.0058 | 0.98 | 0.036 | <0.0001 |
| 49 | 0.17 | 0.33 | 0.0041 | <0.01 | 1.9 | 0.011 | 0.20 | 0.048 | <0.0001 |
| 50 | 0.096 | 0.32 | 0.0029 | <0.01 | 2.7 | 0.061 | 0.11 | 0.053 | 0.0002 |
| 51 | 0.16 | 0.25 | 0.0014 | <0.01 | 0.43 | 0.0016 | 0.013 | 0.0055 | <0.0001 |
| 52 | 0.126 | 0.148 | 0.0026 | <0.01 | 0.26 | 0.0014 | 0.011 | 0.004 | <0.0001 |
Table 5.
Pearson correlation coefficients between e-nose output data and the standard parameters of water quality.
Table 5.
Pearson correlation coefficients between e-nose output data and the standard parameters of water quality.
| Parameters | A13 | A14 | A15 * | A16 | A23 | A24 | A25 | A26 | A36 | A45 | A56 |
|---|---|---|---|---|---|---|---|---|---|---|---|
| Co2+ | 0.595 | 0.509 | - | - | - | - | - | - | - | - | - |
| Cr3+ | 0.536 | 0.474 | - | 0.442 | - | - | - | - | - | - | - |
| Crtotal | - | - | - | - | 0.496 | 0.456 | 0.493 | 0.434 | - | - | - |
| Cd2+ | - | - | - | - | 0.507 | 0.453 | - | 0.436 | - | - | - |
| V3+ | - | - | - | - | - | - | 0.757 | 0.529 | - | - | - |
| Cu2+ | - | - | - | - | - | - | 0.409 | 0.433 | - | - | - |
| As3+ | - | - | - | - | - | - | 0.435 | 0.409 | - | - | - |
| Pb2+ | - | - | - | - | - | - | 0.426 | 0.405 | - | - | - |
| Mn2+ | - | - | - | - | - | - | - | 0.459 | - | - | - |
| Phosphates (P) | 0.478 | 0.597 | - | - | - | - | - | - | - | - | - |
| S2− | - | - | - | - | 0.473 | - | - | 0.482 | - | - | - |
| F− | - | - | - | - | - | - | - | - | 0.797 | - | - |
| Fats | - | - | - | - | - | - | - | - | - | - | 0.422 |
| Phenols | - | - | - | - | - | - | - | - | - | 0.371 | - |
| Oil products | - | - | - | - | - | - | 0.422 | - | - | - | - |
* Correlation coefficients are statistically insignificant.
Table 6.
Multiple linear regression (MLR) coefficients (β), their significance levels (p), and the root mean squared error of prediction (RMSEP) for standard water quality indicators.
Table 6.
Multiple linear regression (MLR) coefficients (β), their significance levels (p), and the root mean squared error of prediction (RMSEP) for standard water quality indicators.
| Projected Indicator | b0 | A12 | A13 | A14 | A23 | A24 | A25 | A26 | A34 | A46 | RMSEP | |
|---|---|---|---|---|---|---|---|---|---|---|---|---|
| Co2+ | β | −0.034 | - * | 0.281 | −0.129 | - | -- | - | - | - | - | 0.0027 |
| p | 0.012 | - | 0.063 | 0.100 | - | - | - | - | - | - | ||
| Cd2+ | β | 0.036 | - | - | - | - | −0.040 | - | 0.060 | - | −0.055 | 0.0007 |
| p | 0.056 | - | - | - | - | 0.05 | - | 0.030 | - | 0.037 | ||
| V3+ | β | 0.172 | - | - | - | - | −0.205 | 0.030 | 0.275 | - | −0.276 | 0.0003 |
| p | 0.001 | - | - | - | - | 0.001 | 0.001 | 0.001 | - | 0.001 | ||
| Phosphates | β | −26.7 | 20.7 | −193 | 131.8 | - | - | - | - | - | - | 2.12 |
| p | 0.011 | 0.017 | 0.032 | 0.009 | - | - | - | - | - | - | ||
| Fats | β | 5046 | - | - | - | −4266 | - | - | 3270 | −1415 | −3420 | 21.7 |
| p | 0.008 | - | - | - | 0.010 | - | - | 0.012 | 0.013 | 0.007 | ||
* The parameter was not employed for modeling.
© 2019 by the authors. Licensee MDPI, Basel, Switzerland. This article is an open access article distributed under the terms and conditions of the Creative Commons Attribution (CC BY) license (http://creativecommons.org/licenses/by/4.0/).
Share and Cite
MDPI and ACS Style
Kuchmenko, T.A.; Lvova, L.B. A Perspective on Recent Advances in Piezoelectric Chemical Sensors for Environmental Monitoring and Foodstuffs Analysis. Chemosensors 2019, 7, 39. https://doi.org/10.3390/chemosensors7030039
AMA Style
Kuchmenko TA, Lvova LB. A Perspective on Recent Advances in Piezoelectric Chemical Sensors for Environmental Monitoring and Foodstuffs Analysis. Chemosensors. 2019; 7(3):39. https://doi.org/10.3390/chemosensors7030039
Chicago/Turabian StyleKuchmenko, Tatyana A., and Larisa B. Lvova. 2019. "A Perspective on Recent Advances in Piezoelectric Chemical Sensors for Environmental Monitoring and Foodstuffs Analysis" Chemosensors 7, no. 3: 39. https://doi.org/10.3390/chemosensors7030039
Note that from the first issue of 2016, this journal uses article numbers instead of page numbers. See further details here.