Article

A Naphthalimide-Benzothiazole Conjugate as Colorimetric and Fluorescent Sensor for Selective Trinitrophenol Detection

by
Pramod D. Jawale Patil
1,2,
Rajita D. Ingle
1,*,
Sopan M. Wagalgave
2,3,
Rajesh S. Bhosale
2,†,
Sidhanath V. Bhosale
2,3,*,
Rajendra P. Pawar
1 and
Sheshanath V. Bhosale
4,*
1
Department of Chemistry, Deogiri College, Aurangabad 431005, India
2
Polymers and Functional Materails Division, CSIR-Indian Institute of Chemical Technology, Hyderabad 500007, Telangana, India
3
Academy of Scientific and Innovative Research (AcSIR), Ghaziabad 201002, Uttar Pradesh, India
4
School of Chemical Sciences, Goa University, Taleigao Plateau 403206, Goa, India
*
Authors to whom correspondence should be addressed.
Present Address: Department of Chemistry, Indrashil University, Kadi, Mesana-382470, Gujarat, India.
Chemosensors 2019, 7(3), 38; https://doi.org/10.3390/chemosensors7030038
Submission received: 14 June 2019 / Revised: 31 July 2019 / Accepted: 7 August 2019 / Published: 14 August 2019
(This article belongs to the Special Issue Chromogenic and Fluorogenic Chemosensors)

Abstract

:
Although chemical structural modification of naphthalimides is widely employed for the purpose of sensing explosives, the effects of such modification have been little explored. Herein, we report the design and synthesis of a new naphthalimide-benzothiazole conjugate (1) and its ability to sense various nitrophenols by means of its colorimetric and fluorescent characteristics. Under long-range UV light (365 nm), 1 displayed a color change of its solution from bluish to colorless only upon addition of 2,4,6-trinitrophenol (TNP). Photoluminescence spectroscopy showed quantitative fluorescence quenching by TNP of the emission peaks of 1 at 398 nm and 418 nm due to donor–acceptor electron transfer. The interaction of 1 with TNP was via a cooperative, non-covalent hydrogen-bonding interaction. Receptor 1 exhibited high sensitivity and selectivity towards TNP over various aromatic nitro analytes. The binding constant (K) and Stern–Volmer constant (Ksv) between 1 and TNP were found to be 5.332 × 10⁻⁵ M and 2.271 × 10⁶ M−1, respectively. Furthermore, the limit of detection was calculated and found to be as low as 1.613 × 10⁻¹⁰ M.

Graphical Abstract

1. Introduction

Nitroaromatic compounds are important primary constituents of several explosives and are widely employed in the agrochemical and military fields [1]. The excessive use of these nitroaromatics has been known to pollute the environment in war zones and around industrial facilities [2]. Among them, 2,4,6-trinitrophenol (TNP) is a more powerful explosive as compared to other aromatics [1,3,4].
TNP’s extensive use in several industries, such as medicine and dyeing, results in the pollution of soil and groundwater [1,5], causing health problems such as urinary, respiratory, and gastrointestinal problems, anemia, dizziness, nausea, cyanosis, cancer, skin allergy, and eye irritation [6,7,8]. Therefore, there is an urgent need to develop receptors able to sensitively detect trace amounts of TNP. Such a sensor should be easy to handle and efficient to apply in field testing.
A literature survey revealed that, to date, various instrumental methods have been used to detect nitroaromatics, such as mass spectrometry [9], surface enhanced Raman spectroscopy (SERS) [10], ion mobility spectrometry (IMS) [11], cyclic voltammetry [12], gas chromatography [13], and nuclear quadrupole resonance (NQR) [14]. Although there are some benefits to these techniques, they are expensive, time-consuming, and lack the portability required for application in the field. Therefore, a simple, low-cost, more sensitive, selective detection method is needed for real-world applications. To date, different colorimetric and fluorescent receptors based on small organic molecules [15], polymers [16,17], gels [18,19], metal–organic frameworks (MOFs) [20,21,22], covalent organic frameworks (COFs) [23,24], microtube optical waveguides [25], organic crystalline solids [26], and cages [27,28] have been used to detect TNP [3,4,29,30,31,32,33,34,35,36]. These methods are advantageous over instrumental techniques due to their sensitivity, ease of operation, and portability.
Thus, the design of fluorescent small organic molecules with a combination of colorimetric and fluorescence detection methods should be the natural choice with which to construct more efficient sensors. Therefore, the design and development of an efficient, selective, and sensitive fluorescent receptor for sensing TNP, and understanding the mechanism of this detection, has very great significance. The compound 1,8-naphthalimide (NPI) has attracted researchers’ attention due to its optical and photophysical properties. NPI derivatives have been widely used because of their potential applications in many fields, such as cancer treatment, DNA-targeting binders, supramolecular self-assembly, optoelectronic materials, fluorescent sensors, and living cell imaging [37,38,39,40,41]. As such, the chemistry of NPI is well understood and lends itself to easy modification and manipulation. NPI exhibits a rigid planar structure, with strong π–π stacking interactions and tunable optoelectronic properties. Furthermore, benzothiazoles (BTH) are also biologically important heterocycles and have been applied in various fields, such as in biological, sensing, and optoelectronic materials [42,43,44]. It is also notable that benzothaizoles in receptors could function as molecular recognition subunits [45].
Therefore, we designed and synthesized a new NPI analogue with a BTH subunit (receptor 1) incorporating a 6-methoxybenzo[d]thiazol-2-amine group at the imide position of the NPI molecule to improve its colorimetric and emissive properties, allowing for the visual detection of TNP (Scheme 1). This receptor system showed efficient, selective, and sensitive visual detection of TNP over other nitroaromatics.

2. Experimental Section

2.1. Materials and Methods

The 6-bromobenzo[de]isochromene-1,3-dione, 6-methoxybenzo[d]thiazol-2-amine, zinc acetate, N,N-dimethylacetamide, and nitroaromatic compounds were purchased from Sigma Aldrich (Bengaluru, Karnataka, India) and used without further purification, unless otherwise specified. 1H Nuclear Magnetic Resonance (NMR) spectra were recorded on an AVANCE 400 or AVANCE 500 spectrometer (Bruker, Hyderabad, India) as CDCl3 solutions, internally referenced to tetramethylsilane (TMS). The chemical shift (δ) of protons were represented in part per million (ppm) and coupling constant (J) was reported in Hertz (Hz). The splitting pattern was denoted as singlet (s), doublet (d), triplet (t), doublet of doublet (dd) and multiplet (m). CDCl3 was used as a deuterated solvent. Mass spectrometric data were obtained using the positive electrospray ionization (ESI-MS) technique on an Agilent Technologies 1100 Series (Agilent Chemistation Software) mass spectrometer. High-resolution mass spectra (HRMS) were obtained by electrospray-ionization quadrupole time-of-flight (ESIQTOF) mass spectrometry. IR spectra were recorded on a Perkin Elmer FT-IR 400 spectrometer, UV-vis absorption spectra using a UV-vis-1800 Schimadzu spectrophotometer, and fluorescence emission spectraon a RF-6000 (Schimadzu, Japan) spectrofluorophotometer.

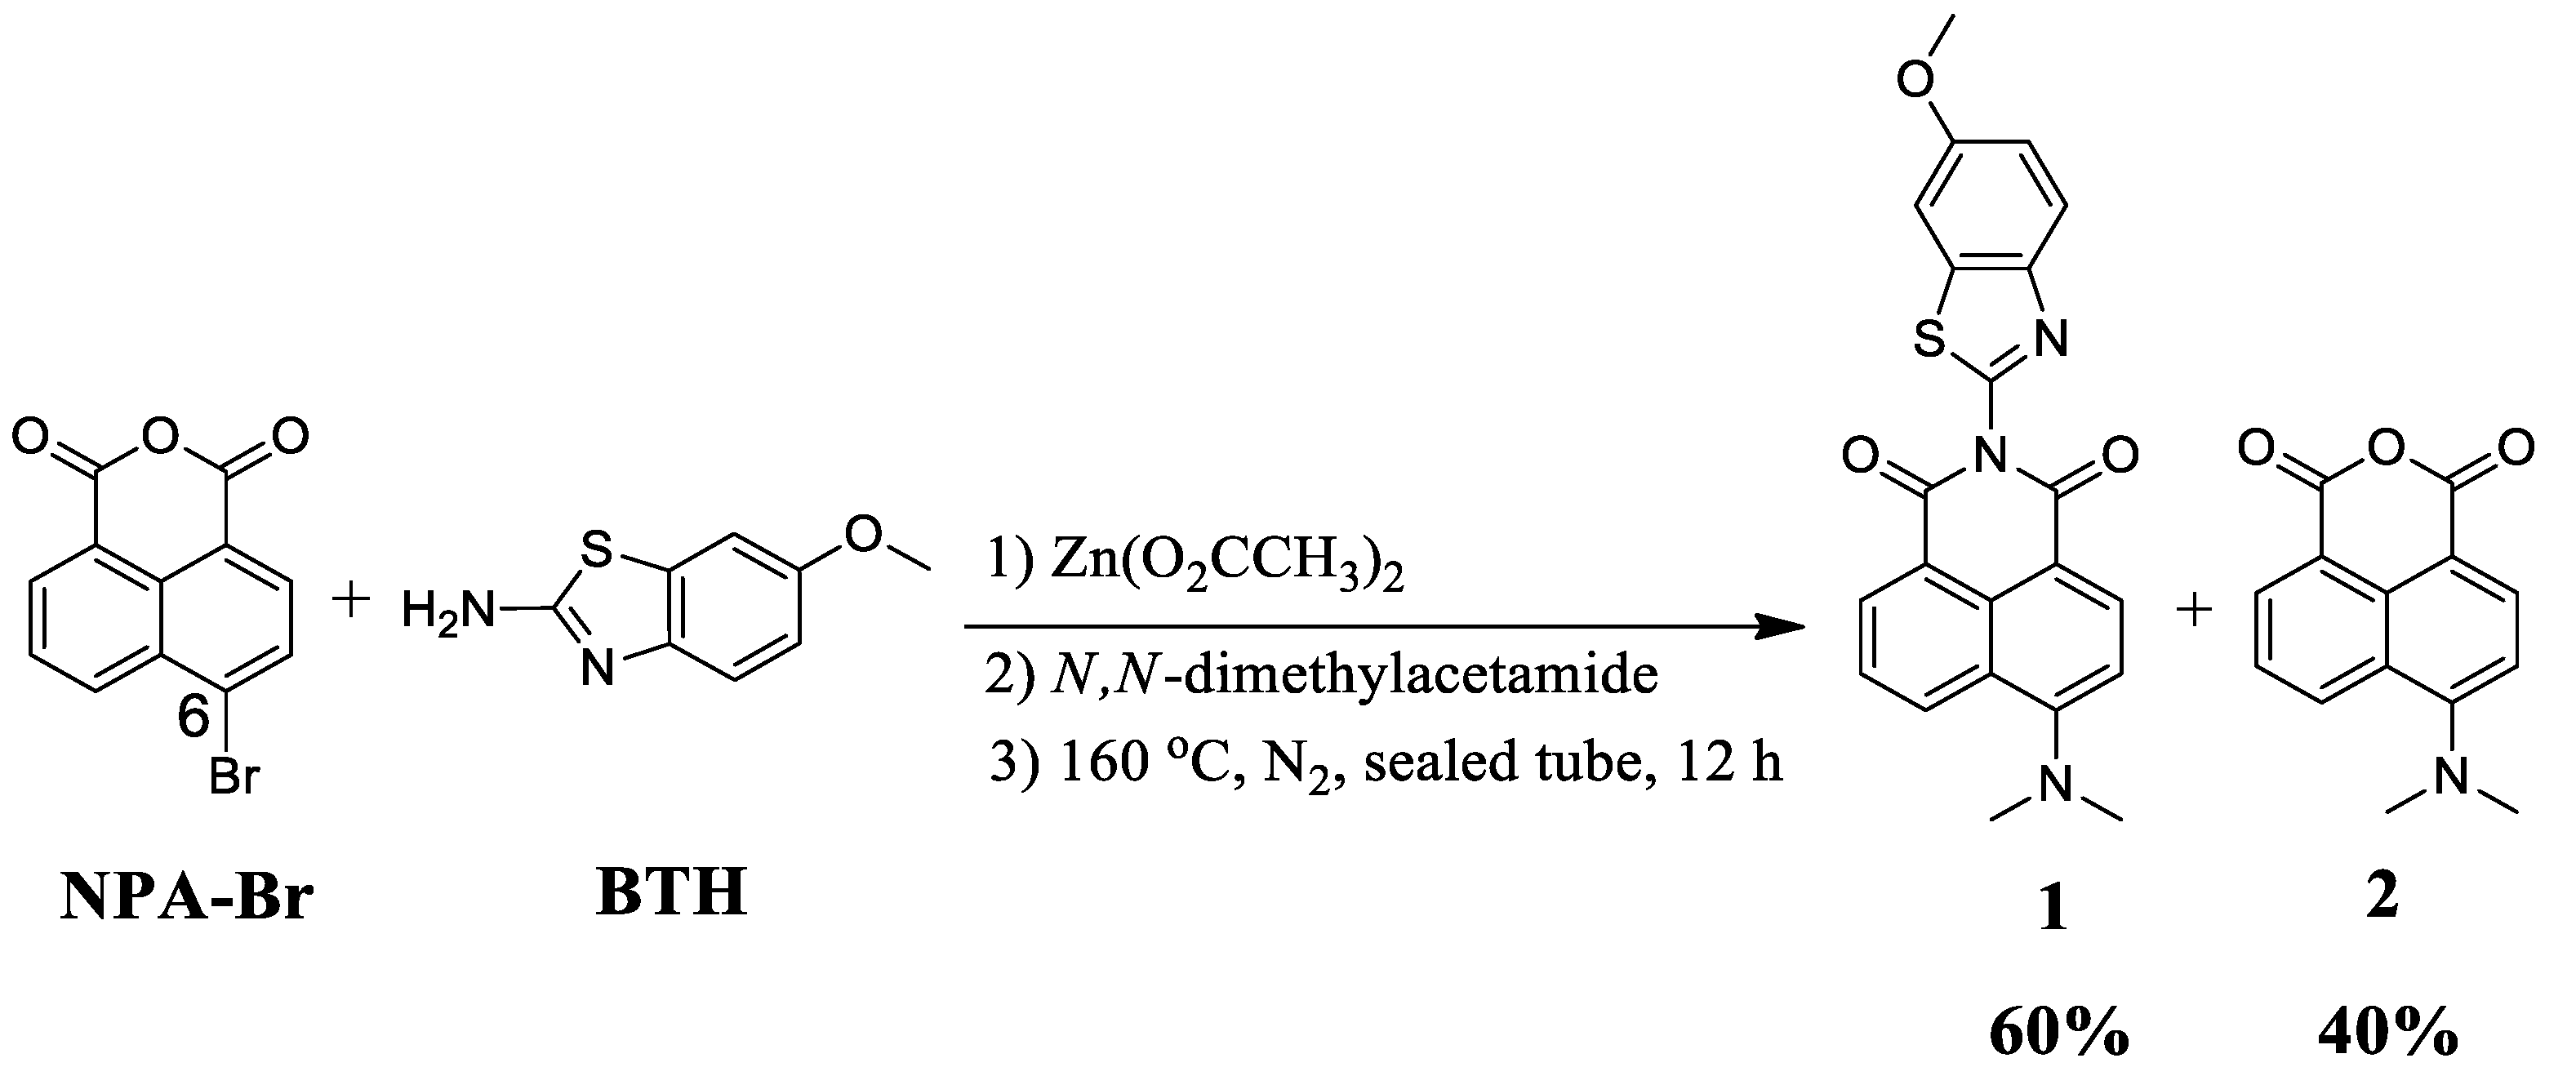
2.2. Synthesis of Compound 1

6-bromobenzo[de]isochromene-1,3-dione (NPA-Br), (0.2 gm, 0.0007 mole, 1 equivalents), zinc acetate (0.013 gm, 0.00007 mole, 0.1 equivalents), and 5 mL of dimethylacetamide (DMA) were added to a sealed tube. The reaction mixture was stirred for 15 min at room temperature. Next, 6-methoxybenzo[d]thiazol-2-amine (BTH) (0.16 gm, 0.001 mole, 1.5 equivalents) was slowly added under N2 atmosphere. The reaction mixture was heated to 160 °C with continuous stirring for 12 h. The progress and completion of reaction was monitored by thin layer chromatography (TLC). After completion of the reaction, it was cooled to room temperature. The reaction mixture was then poured into 500 mL of 0.1 M HCl with vigorous stirring, at which point a dark brown precipitate appeared. The precipitate was filtered, washed with excess water, and dried at room temperature. The dark brown precipitate was purified by silica gel column chromatography (dichloromethane eluent) to yield, after evaporation of the solvent, a yellow powder of 1 (0.15 g, 60%). 1H NMR (400 MHz, CDCl3) δ: 8.63 (dd, J = 7.3, 1.1 Hz, 1H), 8.51 (dd, J = 13.0, 4.7 Hz, 2H), 8.00 (d, J = 9.0 Hz, 1H), 7.69 (dd, J = 8.4, 7.4 Hz, 1H), 7.38 (d, J = 2.5 Hz, 1H), 7.13 (dd, J = 8.7, 2.9 Hz, 2H), 3.91 (s, 3H), 3.16 (s, 6H); 13C NMR (100 MHz, CDCl3) δ: 164.26 (s), 163.51 (s), 158.23 (s), 157.76 (s), 153.64 (s), 145.02 (s), 138.24 (s), 133.54 (s), 132.32 (s), 131.85 (s), 131.01 (s), 125.27 (s), 124.82 (s,), 122.53 (s), 115.80 (s), 113.79 (s), 113.25 (s), 104.13 (s), 55.87 (s), 44.77 (s); FT-IR (KBr, v cm−1) 773.43, 831.63, 1228.36, 1351.38, 1575.18, 1637.30, 1699.48, 2927.15; ESI-MS (m/z %): 404 (100) [M + H]+; HRMS: calculated for C22H18O3N3S = 404.1063 Found [M + H]+ = 404.1064.

2.3. Optical Detection

The nitroaromatic solutions were added to a solution of receptor 1 (5.0 × 10⁻⁵ M) in acetonitrile at room temperature, and images were recorded using a high resolution camera.

2.4. UV-vis Absorption Spectroscopy

The receptor 1 (c ≈ 1.0 × 10⁻⁵ M) was dissolved in acetonitrile corresponding to the maximum of absorbance in range ≈ 0.1 to 0.7 for the UV experiments. The solution of the receptor was placed in a quartz cuvette (l = 1 cm, V0 = 3 mL), and the various nitroaromatic analyte solutions were added. The UV-vis measurements were performed at room temperature.

2.5. Fluorescence Spectroscopy

The nitroaromatic compound solutions were added to a solution of receptor 1 (1.0 × 10⁻⁵ M) in acetonitrile. After the addition at room temperature, the emission spectrum (λex = 365 nm) was recorded.

2.6. Time Resolved Fluorescence Spectroscopy

Fluorescence lifetime measurements were carried using a picosecond time-correlated single photon counting (TCSPC) setup (FluoroLog3-Triple Illuminator, IBH Horiba JobinYvon, Alabaster, AL, USA) (Instrument installed in CSIR-Indian Institute of Chemical Technology, Hyderabad, India) employing a picosecond light emitting diode laser (NanoLED, λex = 365 nm). The samples were prepared in acetonitrile. The TCSPC measurements were performed evaluated using a 1 cm cuvette at 25 °C.

3. Results and Discussion

3.1. Synthesis and Characterization

The synthesis of receptor 1 is depicted in Scheme 1. The reaction was carried out starting from commercially available 6-bromobenzo[de]isochromene-1,3-dione (NPA-Br) by reaction with 6-methoxybenzo[d]thiazol-2-amine (BTH) in the presence of zinc acetate and N,N-dimethylacetamide at 160 °C in a sealed tube. It is worthwhile to note that the incorporation of BTH occurs at the anhydride part of 6-bromobenzo[de]isochromene-1,3-dione (NPA-Br). Furthermore, the nucleophilic substitution reaction of NPA-Br with dimethylamine (formed in situ from the hydrolysis of N,N-dimethylacetamide (DMA) at temperatures above its boiling point) [46] occurs at the 6-position of NPA. The synthesized compounds 1 are easily separated by silica gel column chromatography. The structures of receptors 1 were confirmed by 1H NMR, 13C NMR, ESI mass, HRMS and FT-IR spectroscopy (Figures S1–S5). The 1H NMR spectrum of receptor 1 displays two peaks in the aliphatic region at 3.16 and 3.91 ppm, corresponding to the –N(CH3)2 and –OCH3 fragments, respectively.
To examine the sensing properties of the receptor 1 towards the various nitroaromatics (Scheme 2), we employed optical, UV-vis and fluorescence spectroscopic measurements.

3.2. Optical Properties

At first glance we investigated the change in optical properties of 1 with the addition of various nitroaromatics under UV illumination (365 nm) (Figure 1). The solution color of receptor 1 is bluish in acetonitrile. After the addition of the nitroaromatics (A1A14), the change in color of receptor 1 was monitored. As shown in Figure 1, the addition of analyte TNP (A1) showed a change in color of 1 from bluish to colorless under UV light. In contrast, the addition of nitroaromatics A2A14 to receptor 1 did not result in a color change, indicating the high selectivity of receptor 1 towards TNP. We presume that the solution color change of receptor 1 in the presence of TNP is due to complex formation via H-bonding and a change in electronic properties.

3.3. UV-vis Absorption

The UV-vis electronic absorption spectra of receptor 1 was studied in the presence of various nitroaromatic analytes and are shown in Figure 2a,b and Figure S1. The absorption band for receptor 1 at 429 nm was used to monitor the effect of TPA (A1). After the addition of A1, the UV-vis absorption band at 429 nm showed a significant increase in peak intensity along with the appearance of new band at 378 nm. It is notable that TNP displayed an absorption band at 350 nm (Figure S6). We presume that the appearance of the new band at 378 nm was due to complex formation between receptor 1 and A1 (Figure 2a and Figure S1). The change in the absorption band indicated an interaction between A1 with the receptor 1 due to a change in electronic properties. Furthermore, no significant spectral changes were observed after the addition of the nitroaromatics A2A14 (0 to 2 equivalents). The results of the absorption titration experiment between receptor 1 with A1 is depicted in Figure 2b. A hypsochromic shift in the absorption band of receptor 1 after the addition of A1 (0 to 2 equivalents) clearly suggested complex formation. As shown in the inset to Figure 2b, the increase in concentration of TNP resulted in an increase in absorption band intensity at 378 nm.

3.4. Florescence Properties

Fluorescence emission spectroscopy was employed to explore the sensing properties of receptor 1 towards various nitroaromatics (A1A14) at room temperature at a wavelength (λex) of 365 nm. The fluorescence emission spectra of receptor 1 in acetonitrile exhibited two strong emission bands (λem) at 398 nm and 418 nm (Figure 3a). The appearance of two emission bands may be due to self-association of 1 to form oligomers which further resulted in an excimer emission band in the spectrum in addition to the monomer band, similar to that observed for pyrene. As shown in Figure 3a, the fluorescence emission spectra displayed no significant changes in the band intensity of receptor 1 with the addition of A2 to A14 (0–2 equivalents). However, quantitative emission band quenching of receptor 1 was observed in the presence of analyte A1. To gain insights into this emission quenching, fluorescence titration experiments were performed by the addition of A1 (0–2 equivalents) to a solution of receptor 1. The fluorescence emission peak intensity at 398 nm and 418 nm was quenched significantly by the addition of TNP. The titration experiment showed significant spectral changes of receptor 1 with the gradual addition of TNP, suggesting the receptor could serve as a highly sensitive fluorescent receptor towards TNP (Figure 3b). A Job’s plot was also employed to investigate the stoichiometry of complex formation between the receptor 1 and analyte A1 in acetonitrile. The emission peak intensity of receptor 1 gradually decreased as the TNP concentration increased. However, upon addition of >2 equivalents of TNP, the fluorescence intensity remained constant. These results revealed that one molecule of receptor 1 binds to two TNP analytes i.e., the obtained stoichiometry complex formation is 1:2 (Figure S7).

3.5. Time Correlated Single Photon Counting (TCSPC) Studies

The dynamic kinetics of emission of compound 1 were investigated by time correlated single photon counting (TCSPC). Solutions of receptor 1, in the presence and absence of TNP, were excited at 365 nm and the fluorescence emissions were measured at 416 nm, 424 nm, and 425 nm, the results of which are depicted in Figure S8, and summarized in Table S1. A bi-exponential function was used to fit the decay profile of 1, 1:A1 (1 equivalents) and 1:A2 (2 equivalents). In acetonitrile solution, the fluorescence emission life-time of 1, 1:A1 (1 equivalents) and 1:A2 (2 equivalents) were 1.01 ns (100%), 1.00 ns (100%) and 0.95 ns (100%), respectively (Table S1). The τ1 value of 1:A2 (2 equivalents) is less than that of 1:A1, which is in turn less than that of 1. The decrease in τ1 value follows the order 1:A2 < 1:A1 < 1, possibly due to the protonation of the ring nitrogen atoms in the NPI and the benzothiazole of receptor 1, together with photoinduced electron transfer (PET).

3.6. Fluorescence Quenching Mechanism

To elucidate the quenching mechanism of the fluorescence emissions, we performed theoretical calculations using the Gaussian 09 ab initio/DFT quantum chemical simulation package [47]. Geometry optimization of receptor 1 and picric acid were carried out at the B3LYP/6-31G (d) level of theory. To ensure the structures remained real, frequency calculations were carried out. Highest occupied molecular orbital (HOMO) and lowest unoccupied molecular orbitals (LUMO) images were generated using Avogadro [48,49] and are given in Figure 4. In receptor 1, the HOMO was located on the benzothiazole ring system whereas the LUMO was delocalized over the NPI ring system. It was observed that the LUMO energy level of receptor 1 was higher than that of the LUMO of TNP. Upon excitation, we ascribe the observed fluorescence emission quenching to excited state charge transfer from the donor to the acceptor via a non-fluorescent PET mechanism [50].

3.7. Stern–Volmer Constant

The fluorescence quenching efficiency was also studied using a Stern–Volmer (SV) plot and equation. The SV plot (Figure S9) of TNP in receptor 1 displayed linearity at lower and higher concentrations, indicating 1 was an excellent receptor for the selective detection of TNP in acetonitrile. The linearity at lower concentration of analyte was ascribed to either static or dynamic fluorescence quenching of receptor 1. This was further confirmed using the SV equation:
τ0/τ = 1+ Kq τ0 [Q]; Ksv = Kq τ
where τ0 and τ are the excited-state lifetimes of receptor 1, before and after the addition of the analyte TNP (quencher) Q, Kq is the quenching rate constant, [Q] is the molar concentration of analyte TNP and Ksv is the Stern–Volmer constant [M−1].
In the case of TNP as quencher, the Kq and Ksv values for receptor 1 are 2.38 × 10⁶ M−1 and 2.271 × 10⁶ M−1, respectively.

3.8. Binding Constant

The Benesi–Hildebrand equation, shown below, was employed to investigate the binding constant of 1 with TNP (A1) (Figure 5a) using the results of UV-vis titration experiments to calculate the binding constant.
1/A − A0 = 1/Amax − A0 + 1/[Amax − A0]Ka[C]
where, A0 = the absorbance of free 1, A = the absorbance of 1 measured with TNP (A1) and λmax—the absorbance of 1 measured in the presence of an excess amount of TNP (A1) at 454 nm. Ka = association constant and [C] is the concentration of added TNP (A1). Figure 5 displays the linear relationship obtained by plotting 1/(A − A0) versus 1/[A1]. The binding constant (K) between 1 and TNP (A1), calculated from the ratio of intercept/slope, was found to be 5.332 × 10⁻⁵ M.

3.9. Limit of Detection

To examine the realistic relevance of 1 as a sensor for TNP (A1), the limit of detection (LOD) was determined. The absorbance response at 370 nm was recorded at different concentration of TNP (A1) (Figure 5b). The equation 3S/ρ was used for the LOD determination, where S is the standard deviation of three blank measurements and ρ is the slope between the absorbance intensity versus the concentration of TNP (A1). It was observed that 1 displayed a good response towards TNP (A1) with a linear relationship within the change in absorbance peak intensity at 370 nm and the concentration of A1. The calculated LOD for TNP (A1) was 1.613 × 10⁻¹⁰ M, indicating nanomolar concentrations of TNP (A1) were sufficient to observe a change in the absorption intensity of 1.

3.10. 1H NMR Spectroscopy

To comprehend the sensing mechanism, we examined the correlation between 1 and TNP (A1) analyte using 1H NMR spectroscopy (Figure 6 and Figure S10). The 1H NMR spectrum of a 1:1 mixture of 1 and TNP (A1) clearly indicated an upfield shift of the naphthalimide and TNP aromatic resonances compared to the spectra of the pure components. This shielding effect was attributed to the formation of hydrogen bonds between 1 and TNP, and π-π interactions of the planar NPI.
We believe that hydrogen-bonding along with intermolecular π-π interactions play a major role in the recognition process, which is illustrated in Figure 7.

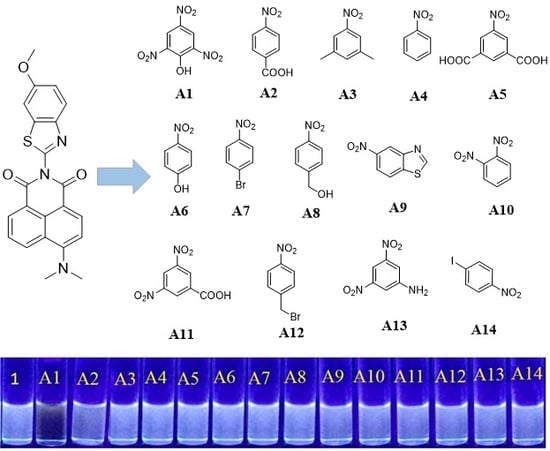
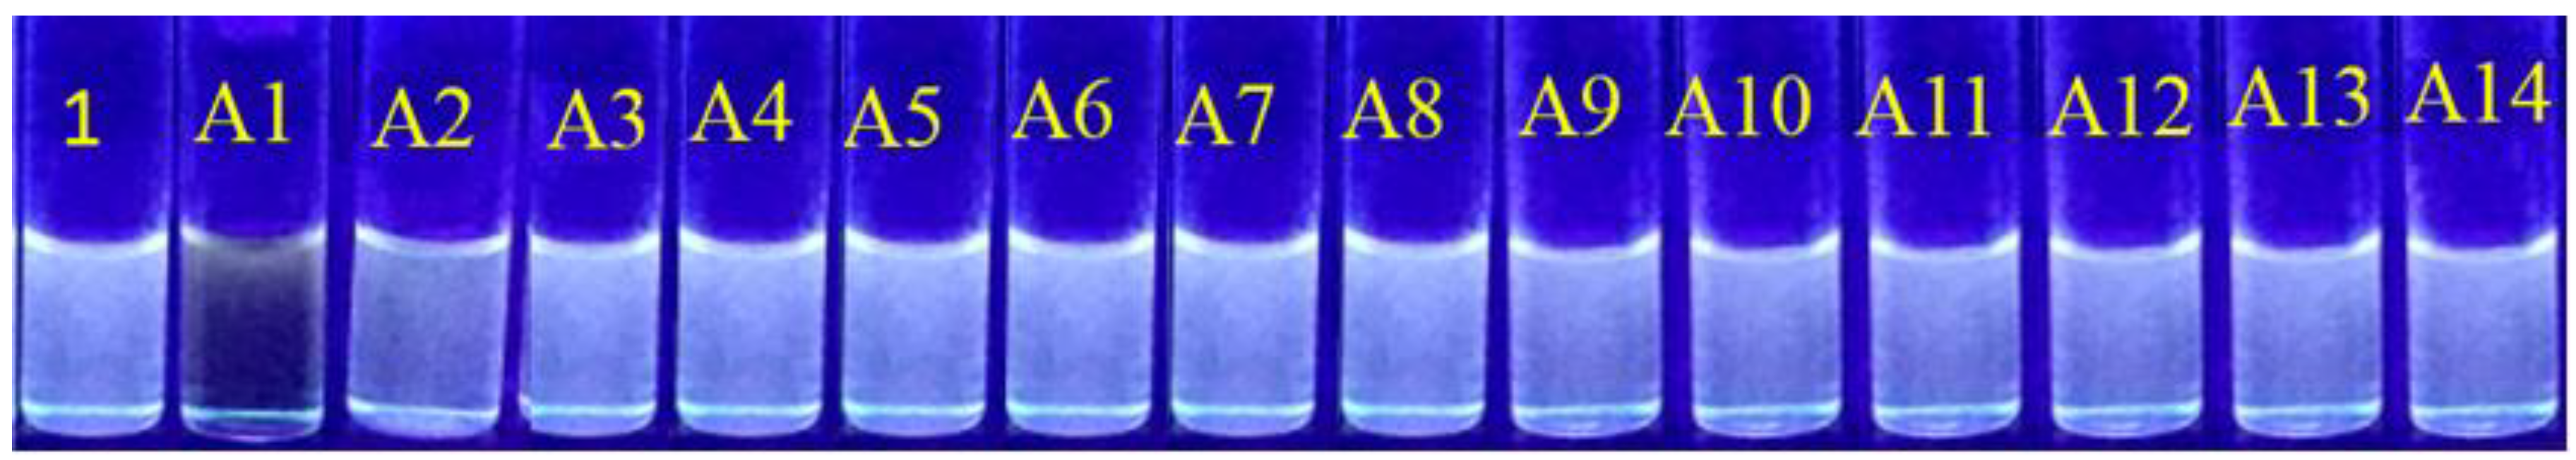
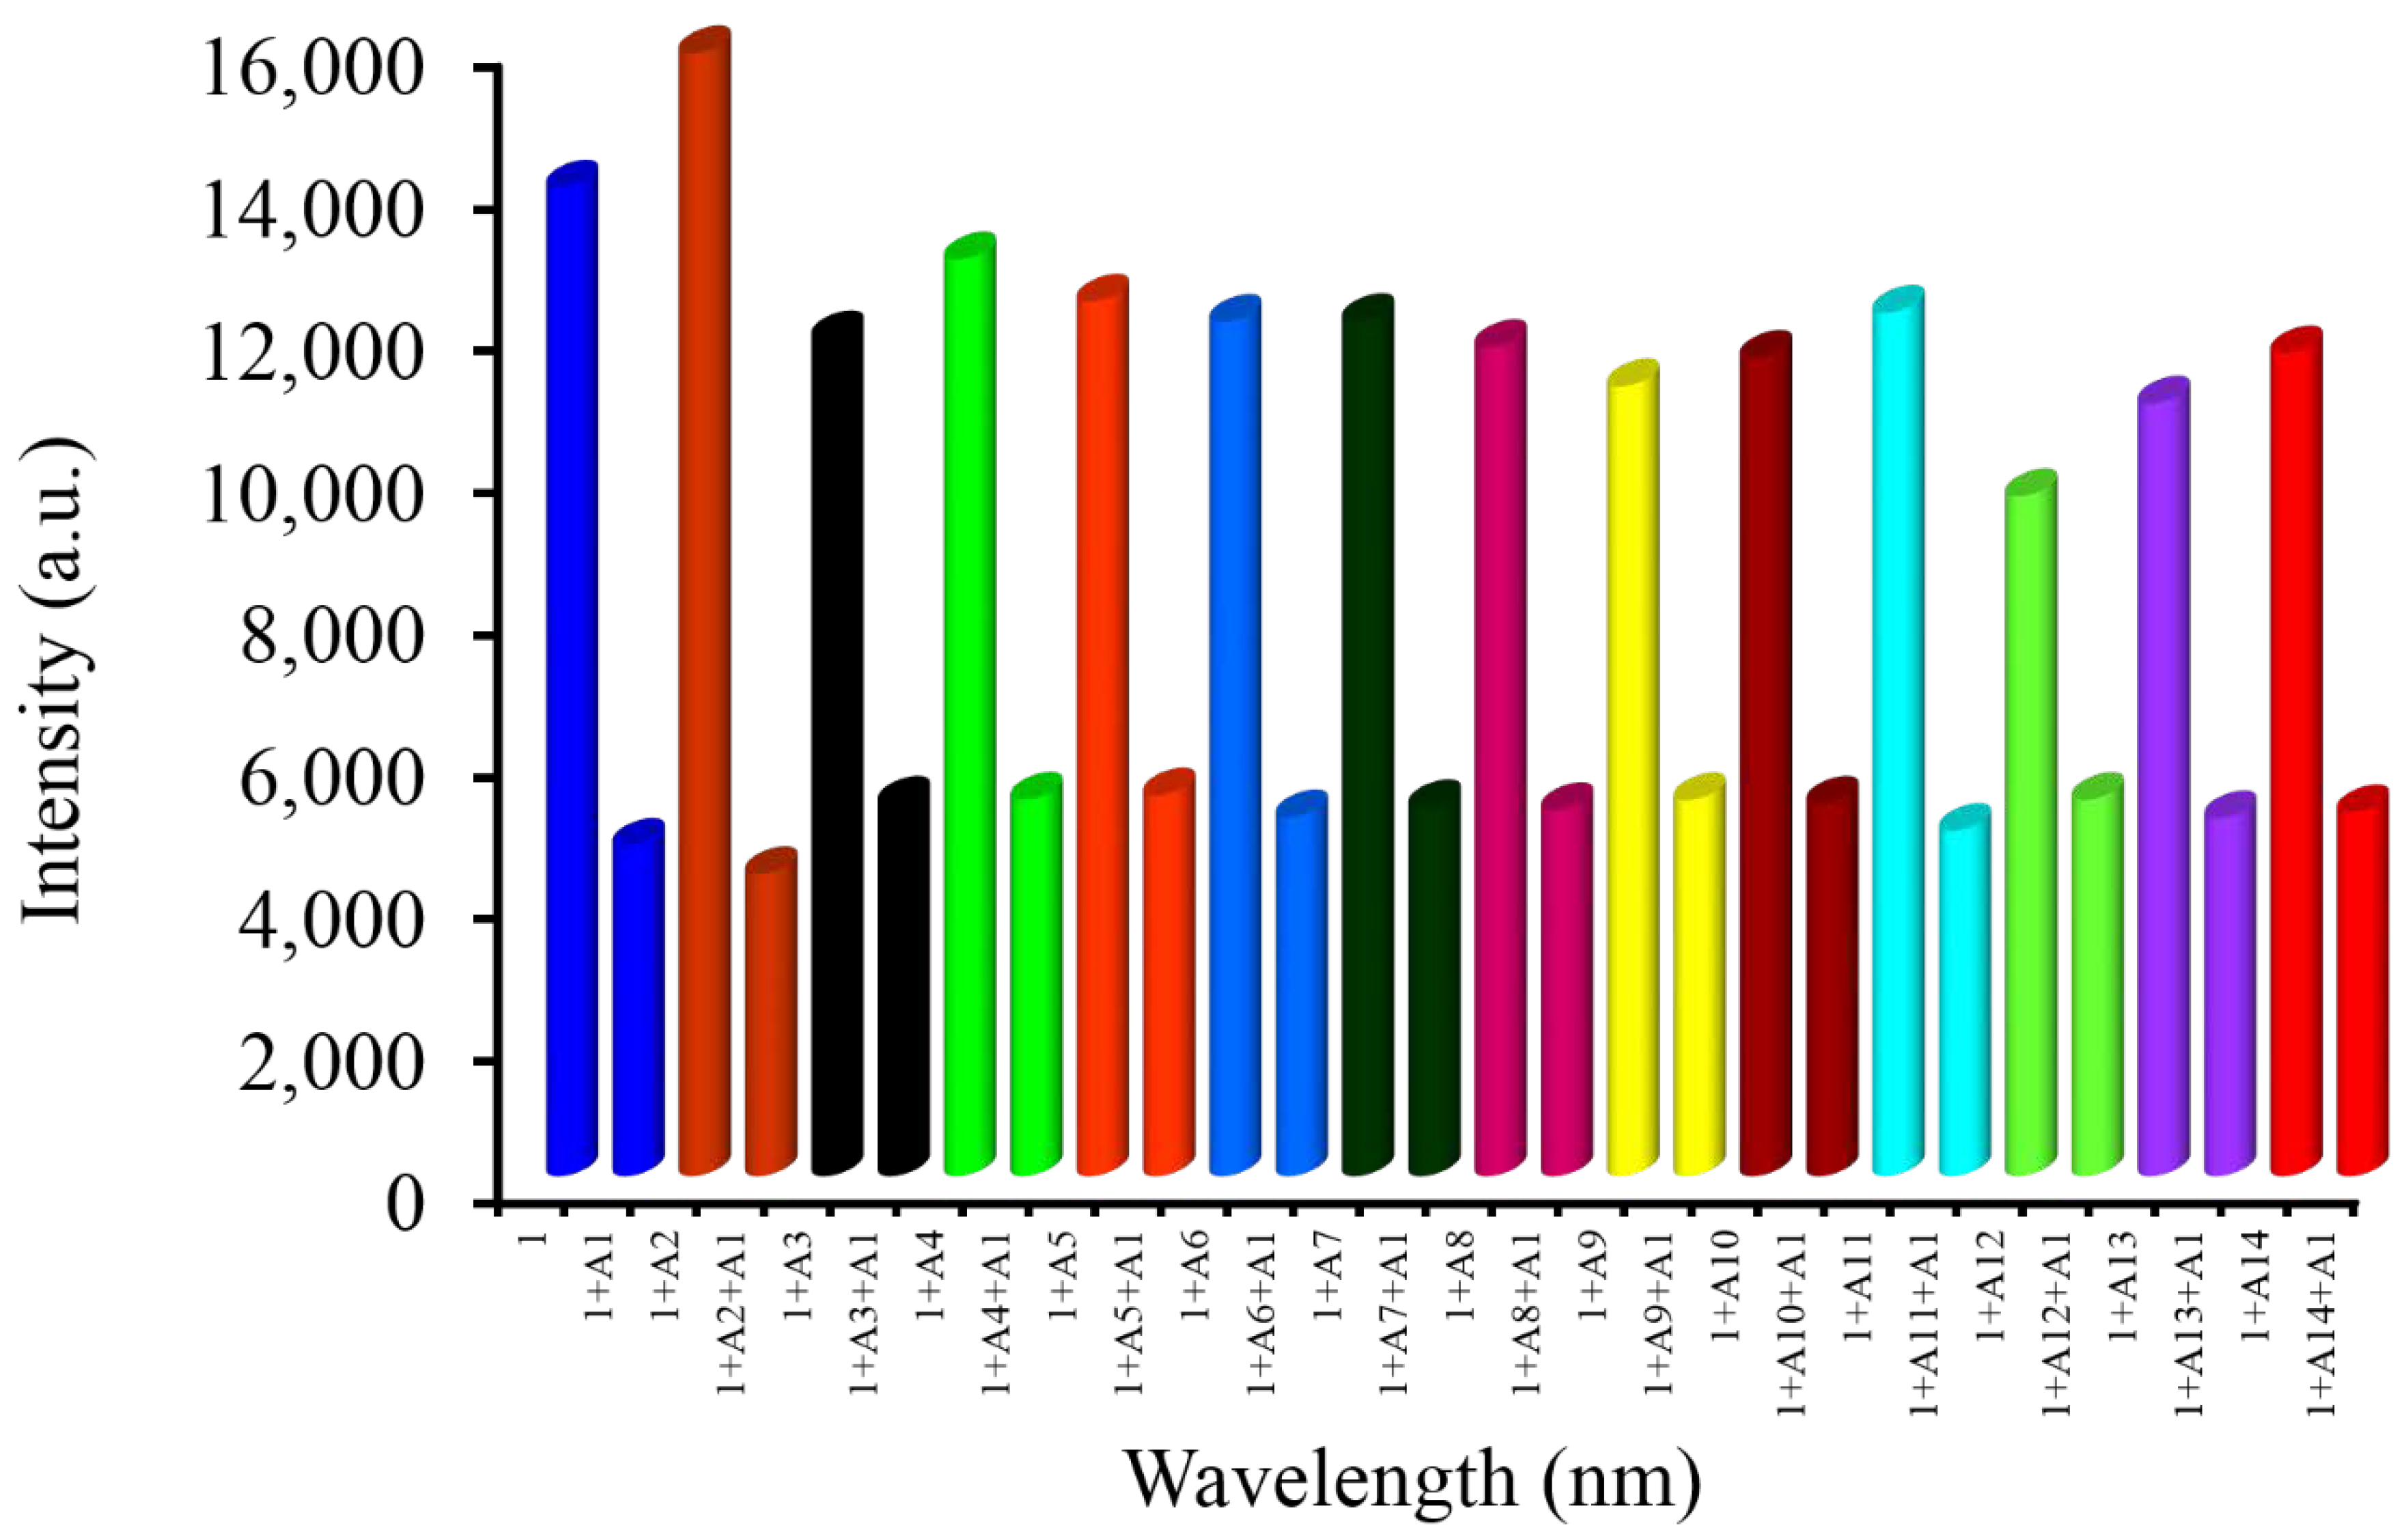
3.11. Competitive Sensing Properties

For real world applications, competitive binding ability is an important factor. To examine the anti-interference properties of receptor 1 towards analyte A1, photoluminescence (PL) quenching experiments were conducted in the presence of various nitroaromatics such as A2 to A14 (2 equivalents) (Figure 8 and Figure S11). The receptor 1 displayed a significant fluorescence emission band quenching response toward TNP (A1) in the presence of other competitive nitroaromatic analytes. It was observed that other nitroaromatics (A2A14) did not interfere with the recognition of TNP (A1) under competitive conditions. These results showed the practical application of receptor 1 to monitor TNP with high selectivity in the presence of other interfering nitroaromatics.

3.12. Detection of DNP

Considering the above TNP detection results, the detection ability of receptor 1 toward 2,4-dinitrophenol (A15) was studied using UV-vis and emission spectral techniques. Upon addition of DNP (A15), the absorbance band intensity of receptor 1 at 429 nm gradually increased (Figure S12a). The titration experiments of 1 with DNP (A15) were carried out in acetonitrile. The emission band intensity at 398 nm and 418 nm (λex = 365 nm) of receptor 1 showed a gradual emission quenching with the addition of 2 equivalents of DNP (Figure S12b). The Job’s plot, obtained from the fluorescence emission spectral data, showed the 1:DNP binding ratio was 1:2 (Figure S13). The calculated binding constant (Figure S14) and limit of detection (Figure S15) were determined to be Ka = 9.86914 × 10⁻⁷ M and 3.83334 × 10⁻¹⁰ M, respectively, indicating receptor 1 was also suitable for DNP sensing.

3.13. Detection of Hydroxyl Aromatics

To examine the role of H-bonding, we investigated the interaction between receptor 1 with aromatic phenols such as 2,3,4,5,6-pentafluorophenol (A16), 1,3,5-trihydroxybenzene (A17), p-iodophenol (A18) and p-methoxyphenol (A19) (Scheme S1) using UV-vis and fluorescence emission techniques. Receptor 1 showed no significant changes in absorbance (Figure S16a) or emission (Figure S16b) spectral intensity upon addition of 2 equivalents of A16, A17, A18, or A19. The obtained results indicated that not only H-bonding but also π–π stacking interactions were involved in the TNP detection.

4. Conclusions

In summary, we successfully designed and synthesized a naphthalimide-benzothiazole based chromophore for the colorimetric and fluorescence detection of TNP. The fluorescence emission peaks of receptor 1 were selectively quenched by TNP via a d-PET mechanism with a limit of detection of 1.613 × 10⁻¹⁰ M. Notably, the color of a solution of 1 changed from bluish to colorless in the presence of TNP.

Supplementary Materials

The following data can be found in the ESI and are available online at https://www.mdpi.com/2227-9040/7/3/38/s1, Figure S1: 1H NMR of compound 1, Figure S2: 13C NMR of compound 1, Figure S3: ESI mass of compound 1, Figure S4: ESI-HRMS of compound 1, Figure S5: FT-IR of compound 1, Figure S6: Absorption spectra of receptor 1, TNP (A1) and 1:A1 complex, Figure S7: Job’s plot obtained from fluorescence emission spectral data (λex = 413 nm); G-analyte TNP (A1) and H-receptor 1, Figure S8: Time resolved decay (tau) of compound 1 in the presence and absence of TNP (A1) @ 416 nm, 424 nm and 425 nm, Figure S9: Stern-Volmer plot for TNP with 1. The relative fluorescence intensity is linear with TNP concentration in the range of 0–2 equivalents, Figure S10: Zoomed image of 1H NMR of probe 1, TNP and complex between 1 and TNP (A1), Figure S11: Competitive experimental spectra for each analyte (λex = 365 nm), Figure S12: (a) UV-vis titration experiment of 1 in the presence of DNP (A15) and (b) Fluorescence titration experiment of 1 in the presence of DNP (A15) (λex = 365 nm), Figure S13: Job’s plot obtained from fluorescence emission spectral data (λex = 413 nm); G-analyte DNP (A15) and H-receptor 1, Figure S14: Benesi-Hildebrand plot of 1 for DNP (A15) (G), Figure S15: Absorption intensity at 425 nm of 1 versus increasing concentration of DNP (A15), Figure S16: (a) UV-vis titration experiment of 1 in the presence of A16, A17, A18, A19 and (b) Fluorescence titration experiment of 1 in the presence of A16, A17, A18, A19ex = 365 nm), Table S1: The time resolved decay (tau) values of 1, 1:A1 (1 equivalents) and 1:A2 (2 equivalents), Scheme S1, The aromatic (A15 to A19) structures used in sensing study.

Author Contributions

P.D.J.P. synthesized the target molecule and fully characterized it by means of NMR, IR, mass spectroscopy; P.D.J.P; S.M.W.; and R.S.B. performed the UV-vis and fluorescence spectroscopic experiments; R.D.I.; R.P.P. supervised P.D.J.P.; S.V.B. (Sidhanath V. Bhosale) (IICT); S.V.B. (Sheshanath V. Bhosale) (GU) outlined and supervised the work, analyzed the data and drafted the manuscript. All co-authors contributed to read the manuscript.

Funding

S.V.B. (Sidhanath V. Bhosale) (CSIR-IICT) is grateful for financial support from The Director, IICT, Hyderabad, India. S.V.B. (Sheshanath V. Bhosale) (GU) acknowledges financial support from the University Grant Commission under the faculty recharge program.

Acknowledgments

S.V.B. (Sidhanath V. Bhosale) (IICT) is thankful to The Director, CSIR-IICT, Hyderabad, India for financial support. IICT Commun. No. IICT/Pubs./2019/182. S.V.B. (Sheshanath V. Bhosale) (GU) acknowledges the UGC for financial support under the UGC-FRP program and professorship. We would like to thank Giribabu and Devulapally Koteshwar for TCSPC measurements. We acknowledge Avinash L. Puyad for DFT calculations using Gaussian 09 procured under the DST-FIST Scheme (Sanction No. FS/FST/PSI-018/2009).

Conflicts of Interest

The authors declare no competing interest.

References

  1. Akhavan, J. Chemistry of Explosives, 2nd ed.; Royal Society of Chemistry: London, UK, 2004. [Google Scholar]
  2. Wollin, K.-M.; Dieter, H.H. Toxicological guidelines for monocyclic nitro-, amino- and amino nitroaromatics, nitramines, and nitrate esters in drinking water. Arch. Environ. Contam. Toxicol. 2005, 49, 18–26. [Google Scholar] [CrossRef] [PubMed]
  3. Sun, X.; Wang, Y.; Lei, Y. Fluorescence based explosive detection: From mechanisms to sensory materials. Chem. Soc. Rev. 2015, 44, 8019–8061. [Google Scholar] [CrossRef] [PubMed]
  4. Salinas, Y.; Martínez-Máñez, R.; Marcos, M.D.; Sancenón, F.; Costero, A.M.; Parra, M.; Gil, S. Optical chemosensors and reagents to detect explosives. Chem. Soc. Rev. 2012, 41, 1261–1296. [Google Scholar] [CrossRef] [PubMed]
  5. Xiang, D.; Xiaomei, H.; Di, W. Förster resonance-energy-transfer detection of 2, 4, 6-trinitrophenol using copper nanoclusters. Anal. Bioanal. Chem. 2015, 407, 4607–4613. [Google Scholar]
  6. McQueen, C.A. Comprehensive Toxicology, 2nd ed.; Elsevier Science: Amsterdam, The Netherlands, 2010. [Google Scholar]
  7. Shen, J.; Zhang, J.; Zuo, Y.; Wang, L.; Sun, X.; Li, J.; Han, W.; He, R. Biodegradation of 2, 4, 6-trinitrophenol by Rhodococcus sp. Isolated from a picric acid contaminated soil. J. Hazard. Mater. 2009, 163, 1199–1206. [Google Scholar] [CrossRef] [PubMed]
  8. Haknsson, K.; Coorey, R.V.; Zubarev, R.; Talrose, V.L.; Hakansson, P. Low-mass ions observed in plasma desorption mass spectrometry of high explosives. J. Mass Spectr. 2000, 35, 337–346. [Google Scholar] [CrossRef]
  9. Sylvia, J.M.; Janni, J.A.; Klein, J.D.; Spencer, K.M. Surface enhanced Raman detection of 2, 4-dinitrotoluene impurity vapor as a marker to locate landmines. Anal. Chem. 2000, 72, 5834–5840. [Google Scholar] [CrossRef] [PubMed]
  10. Hill, H.H.; Simpson, G. Capabilities and limitations of ion mobility spectrometry for field screening applications field. Anal. Chem. Technol. 1997, 1, 119–134. [Google Scholar] [CrossRef]
  11. Krausa, M.; Schorb, K. Trace detection of 2, 4, 6-trinitrotoluene in the gaseous phase by cyclic voltammetry. J. Electroanal. Chem. 1999, 461, 10–13. [Google Scholar] [CrossRef]
  12. Walsh, M.E. Determination of nitroaromatic, nitramine, and nitrate ester explosives in soil by gas chromatography and an electron capture detector. Talanta 2001, 54, 427–438. [Google Scholar] [CrossRef]
  13. Ostafin, M.; Nogaj, B. 14N-NQR based Device for Detection of Explosives in Landmines. Measurement 2007, 40, 43–54. [Google Scholar] [CrossRef]
  14. Pan, J.; Tang, F.; Ding, A.; Kong, L.; Yang, L.; Tao, X.; Tian, Y.; Yang, J. A small-molecule chemosensor for the selective detection of 2, 4, 6-trinitrophenol (TNP). RSC Adv. 2015, 5, 191–195. [Google Scholar] [CrossRef]
  15. Palma-Cando, A.; Scherf, U. Electrogenerated thin films of microporous polymer networks with remarkably increased electrochemical response to nitroaromatic analytes. ACS Appl. Mater. Interfaces 2015, 7, 11127–11133. [Google Scholar] [CrossRef] [PubMed]
  16. Räupke, A.; Palma-Cando, A.; Shkura, E.; Teckhausen, P.; Polywka, A.; Görrn, P.; Scherf, U.; Riedl, T. Highly sensitive gas-phase explosive detection by luminescent microporous polymer networks. Sci. Rep. 2016, 6, 29118. [Google Scholar]
  17. Qin, Z.-S.; Dong, W.-W.; Zhao, J.; Wu, Y.-P.; Zhang, Q.; Li, D.-S. A water-stable Tb(III)-based metal–organic gel (MOG) for detection of antibiotics and explosives. Inorg. Chem. Front. 2018, 5, 120–126. [Google Scholar] [CrossRef]
  18. Kartha, K.K.; Sandeep, A.; Praveen, V.K.; Ajayaghosh, A. Detection of Nitroaromatic Explosives with Fluorescent Molecular Assemblies and π-Gels. Chem. Rec. 2015, 15, 252–265. [Google Scholar] [CrossRef] [PubMed]
  19. Wang, D.; Hu, Z.; Xu, S.; Li, D.; Zhang, Q.; Ma, W.; Zhou, H.; Wu, J.; Tian, Y. Fluorescent metal–organic frameworks based on mixed organic ligands: New candidates for highly sensitive detection of TNP. Dalton Trans. 2019, 48, 1900–1905. [Google Scholar] [CrossRef] [PubMed]
  20. Li, J.; Li, J. A luminescent porous metal–organic framework with Lewis basic pyridyl sites as a fluorescent chemosensor for TNP detection. Inorg. Chem. Commun. 2018, 89, 51–54. [Google Scholar] [CrossRef]
  21. Sharma, A.; Kim, D.; Park, J.-H.; Rakshit, S.; Seong, J.; Jeong, G.H.; Kwon, O.-H.; Lah, M.S. Mechanistic insight into the sensing of nitroaromatic compounds by metal-organic frameworks. Commun. Chem. 2019, 2, 39. [Google Scholar] [CrossRef]
  22. Das, P.; Mandal, S.K. A dual-functionalized, luminescent and highly crystalline covalent organic framework: Molecular decoding strategies for VOCs and ultrafast TNP sensing. J. Mater. Chem. A 2018, 6, 16246–16256. [Google Scholar] [CrossRef]
  23. Zhang, C.; Zhang, S.; Yan, Y.; Xia, F.; Huang, A.; Xian, Y. Highly fluorescent polyimide covalent organic nanosheets as sensing probes for the detection of 2, 4, 6-trinitrophenol. ACS Appl. Mater. Interfaces 2017, 9, 13415–13421. [Google Scholar] [CrossRef] [PubMed]
  24. Yang, G.; Hu, W.L.; Xia, H.Y.; Zou, G.; Zhang, Q.J. Highly selective and reproducible detection of picric acid in aqueous media, based on a polydiacetylene microtube optical waveguide. J. Mater. Chem. A 2014, 2, 15560–15565. [Google Scholar] [CrossRef]
  25. Mukherjee, S.; Desai, A.V.; Inamdar, A.I.; Manna, B.; Ghosh, S.K. Selective detection of 2, 4, 6-trinitrophenol (TNP) by a π-stacked organic crystalline solid in water. Cryst. Growth Des. 2015, 15, 3493–3497. [Google Scholar] [CrossRef]
  26. Acharyya, K.; Mukherjee, P.S. A fluorescent organic cage for picric acid detection. Chem. Commun. 2014, 50, 15788–15791. [Google Scholar] [CrossRef] [PubMed]
  27. Yin, S.-Y.; Zhu, Y.-X.; Pan, M.; Wei, Z.-W.; Wang, H.-P.; Fan, Y.-N.; Su, C.-Y. Nanosized NIR-luminescent Ln metal–organic cage for picric acid sensing. Eur. J. Inorg. Chem. 2017, 3, 646–650. [Google Scholar] [CrossRef]
  28. Peng, Y.; Zhang, A.-J.; Dong, M.; Wang, Y.-W. A colorimetric and fluorescent chemosensor for the detection of an explosive-2, 4, 6-trinitrophenol (TNP). Chem. Commun. 2011, 47, 4505–4507. [Google Scholar] [CrossRef]
  29. Bandela, A.K.; Bandaru, S.; Rao, C.P. A fluorescent 1, 3-diaminonaphthalimide conjugate of calix[4]arene for sensitive and selective detection of trinitrophenol: Spectroscopy, microscopy, and computational studies, and its applicability using cellulose strips. Chem. Eur. J. 2015, 21, 13364–13374. [Google Scholar] [CrossRef]
  30. Roy, B.; Bar, A.K.; Gole, B.; Mukherjee, P.S. Fluorescent tris-imidazolium sensors for picric acid Explosive. J. Org. Chem. 2013, 78, 1306–1310. [Google Scholar] [CrossRef]
  31. Nagarkar, S.S.; Joarder, B.; Chaudhari, A.K.; Mukherjee, S.; Ghosh, S.K. Highly selective detection of nitro explosives by a luminescent metal–organic framework. Angew. Chem. Int. Ed. 2013, 52, 2881–2885. [Google Scholar] [CrossRef]
  32. Kumar, A.; Pandith, A.; Kim, H.-S. Pyrene-appended imidazolium probes as 3, 5-dinitrosalicylic acid sensors in 10% aqueous media. Dyes Pigm. 2015, 122, 351–358. [Google Scholar] [CrossRef]
  33. Kumar, A.; Pandith, A.; Kim, H.-S. Pyrene appended imidazolium probe for 2, 4, 6-trinitrophenol in water. Sens. Actuator B Chem. 2016, 231, 293–301. [Google Scholar] [CrossRef]
  34. Lustig, W.P.; Mukherjee, S.; Rudd, N.D.; Desai, A.V.; Li, J.; Ghosh, S.K. Metal–organic frameworks: Functional luminescent and photonic materials for sensing applications. Chem. Soc. Rev. 2017, 46, 3242–3285. [Google Scholar] [CrossRef] [PubMed]
  35. Pandith, A.; Kim, H.-S. Selective detection of 2, 4, 6-trinitrophenol based on in situ–generated fluorescent Zn2+-anthracene ensembles in 80% aqueous dimethyl sulfoxide. Bull. Korean Chem. Soc. 2018, 39, 14–23. [Google Scholar] [CrossRef]
  36. Banerjee, S.; Veale, E.B.; Phelan, C.M.; Murphy, S.A.; Tocci, G.M.; Gillespie, L.J.; Frimannsson, D.O.; Kelly, J.M.; Gunnlaugsson, T. Recent advances in the development of 1,8-naphthalimide based DNA targeting binders, anticancer and fluorescent cellular imaging agents. Chem. Soc. Rev. 2013, 42, 1601–1618. [Google Scholar] [CrossRef] [PubMed] [Green Version]
  37. Gopikrishna, P.; Meher, N.; Iyer, P.K. Functional 1,8-naphthalimide AIE/AIEEgens: Recent advances and prospects. ACS Appl. Mater. Interfaces 2018, 10, 12081–12111. [Google Scholar] [CrossRef]
  38. Tomczyk, M.D.; Walczak, K.Z. l,8-Naphthalimide based DNA intercalators and anticancer agents. A systematic review from 2007 to 2017. Eur. J. Md. Chem. 2018, 159, 399–442. [Google Scholar] [CrossRef] [PubMed]
  39. Kalita, A.; Hussain, S.; Malik, A.H.; Barman, U.; Goswami, N.; Iyer, P.K. Anion-exchange induced strong π–π interactions in single crystalline naphthalene diimide for nitroexplosive sensing: An electronic prototype for visual on-site detection. ACS Appl. Mater. Interfaces 2016, 8, 25326–25336. [Google Scholar] [CrossRef]
  40. Cao, X.; Zhao, N.; Lv, H.; Ding, Q.; Gao, A.; Jing, Q.; Yi, T. Strong blue emissive supramolecular self-assembly system based on naphthalimide derivatives and its ability of detection and removal of 2, 4, 6-trinitrophenol. Langmuir 2017, 33, 7788–7798. [Google Scholar] [CrossRef]
  41. Keri, R.S.; Patil, M.R.; Patil, S.A.; Budagumpi, S. A comprehensive review in current developments of benzothiazole-based molecules in medicinal chemistry. Eur. J. Med. Chem. 2015, 89, 207–251. [Google Scholar] [CrossRef]
  42. Seth, S. A comprehensive review on recent advances in synthesis & pharmacotherapeutic potential of benzothiazoles. Antiinflamm Antiallergy Agents Med. Chem. 2015, 14, 98–112. [Google Scholar]
  43. Chaudhary, S.; Sharma, H.; Milton, M.D. Novel 2-arylbenzothiazoles: Selective chromogenic and fluorescent probes for the detection of picric acid. Chem. Sel. 2018, 3, 4598–4608. [Google Scholar] [CrossRef]
  44. Dikundwar, A.G.; Dutta, G.K.; Guru Row, T.N.; Patil, S. Polymorphism in opto-electronic materials with a benzothiazole-fluorene core: A consequence of high conformational flexibility of π-conjugated backbone and alkyl side chains. Cryst. Growth Des. 2011, 11, 1615–1622. [Google Scholar] [CrossRef]
  45. Juollard, J. Dimethylformamide: Purification, tests for purity and physical properties. Pure Appl. Chem. 1977, 49, 885–892. [Google Scholar]
  46. Impurities of Dimethylacetamide. Available online: https://www.labhut.com//media/download/ dimethylacetamide_impurities-CGB-WAX.pdf (accessed on 22 May 2019).
  47. Frisch, M.J.; Trucks, G.W.; Schlegel, H.B.; Scuseria, G.E.; Robb, M.A.; Cheeseman, J.R.; Scalmani, G.; Barone, V.; Mennucci, B.; Petersson, G.A.; et al. Gaussian 09, Revision C.01; Gaussian Inc.: Wallingford, CT, USA, 2009. [Google Scholar]
  48. Avogadro: An Open-Source Molecular Builder and Visualization Tool, Version 1.1.0. Available online: http://avogadro.openmolecules.net/ (accessed on 19 July 2019).
  49. Hanwell, M.D.; Curtis, D.E.; Lonie, D.C.; Vandermeersch, T.; Zurek, E.; Hutchison, G.R. Avogadro: An advanced semantic chemical editor, visualization and analysis platform. J. Cheminform. 2012, 4, 1–17. [Google Scholar] [CrossRef] [PubMed]
  50. Ueno, T.; Urano, Y.; Setsukinai, H.; Takakusa, H.; Kojima, H.; Kikuchi, K.; Ohkubo, S.; Fukuzumi, S.; Nagano, T. Rational principles for modulating fluorescence properties of fluorescein. J. Am. Chem. Soc. 2004, 126, 14079–14085. [Google Scholar] [CrossRef] [PubMed]
Scheme 1. Synthetic strategy receptor 1 and side product 2. BTH: benzothiazoles; NPA-Br: 6-bromobenzo[de]isochromene-1,3-dione.
Chemosensors 07 00038 sch001
Scheme 2. The nitro-aromatic (A1 to A14) structures used in sensing study.
Chemosensors 07 00038 sch002
Figure 1. The visual color change under UV-light (λmax = 365 nm) of receptor solution 1 with the addition of various nitroaromatics (A1 to A14).
Chemosensors 07 00038 g001
Figure 2. (a) UV-vis absorption spectra of receptor 1 in the presence of 2 equivalents of various nitroaromatics (A1A14) in acetonitrile; and (b) UV-vis titration experiment of 1 in the presence of TNP.
Chemosensors 07 00038 g002
Figure 3. (a) Fluorescence emission spectra (λex = 365 nm) of 1 in the presence of 2 equivalents of various nitroaromatics (A1A14) in acetonitrile and (b) Fluorescence titration experiment of 1 in the presence of TNP (λex = 365 nm).
Chemosensors 07 00038 g003
Figure 4. Frontier molecular orbital diagram with energy in eV of receptor 1 and TNP (A1) showing donor-excited photoinduced electron transfer (d-PET).
Chemosensors 07 00038 g004
Figure 5. (a) Benesi–Hildebrand plot of 1 and TNP (A1); and (b) absorption intensity at 370 nm of 1 versus increasing concentration of TNP (A1).
Chemosensors 07 00038 g005
Figure 6. 1H nuclear magnetic resonance (NMR) spectra of receptor 1, 2,4,6-trinitrophenol (TNP) and the complex formed between 1 and TNP (A1).
Chemosensors 07 00038 g006
Figure 7. Possible binding structure of receptor 1 with TNP (A1).
Chemosensors 07 00038 g007
Figure 8. Competitive fluorescence study (λex = 365 nm) between receptor 1 (1.0 × 10⁻⁵ M) and A1 (2 equivalents) in the presence of different nitroaromatics (2 equivalents).
Chemosensors 07 00038 g008

